Physiological and metabolic insights into the first cultured anaerobic representative of deep-sea Planctomycetes bacteria
- CAS and Shandong Province Key Laboratory of Experimental Marine Biology & Center of Deep Sea Research, Institute of Oceanology, Chinese Academy of Sciences, China
- Laboratory for Marine Biology and Biotechnology, Qingdao National Laboratory for Marine Science and Technology, China
- Center of Ocean Mega-Science, Chinese Academy of Sciences, China
- College of Earth Science, University of Chinese Academy of Sciences, China
Figures
Figure 1 with 5 supplements

Isolation, morphology, and phylogenetic analysis of Poriferisphaera heterotrophicis ZRK32.
(A) Diagram showing the strategy used to isolate the Planctomycetes bacteria. (B, C) Transmission electron microscope (TEM) observation of strain ZRK32. (D) TEM observation of ultrathin sections of cells from strain ZRK32. Abbreviations: CM, outer membrane; Pi, cytoplasm; R, ribosome; N, nucleoid; ICM, cytoplasmic membrane; Py, periplasm; V, vesicle-like organelles. (E) Phylogenetic analysis of strain ZRK32. Phylogenetic placement of strain ZRK32 within the phylum Planctomycetes, based on almost complete 16S rRNA gene sequences. The NCBI accession number for each 16S rRNA gene is indicated after each corresponding strain’s name. The tree was inferred and reconstructed using the maximum likelihood criterion, with bootstrap values (%)>80; these are indicated at the base of each node with a gray dot (expressed as a percentage from 1000 replications). The 16S rRNA gene sequence of Actinoplanes derwentensis LA107T was used as the outgroup. Bar, 0.1 substitutions per nucleotide position.
Figure 1—figure supplement 1
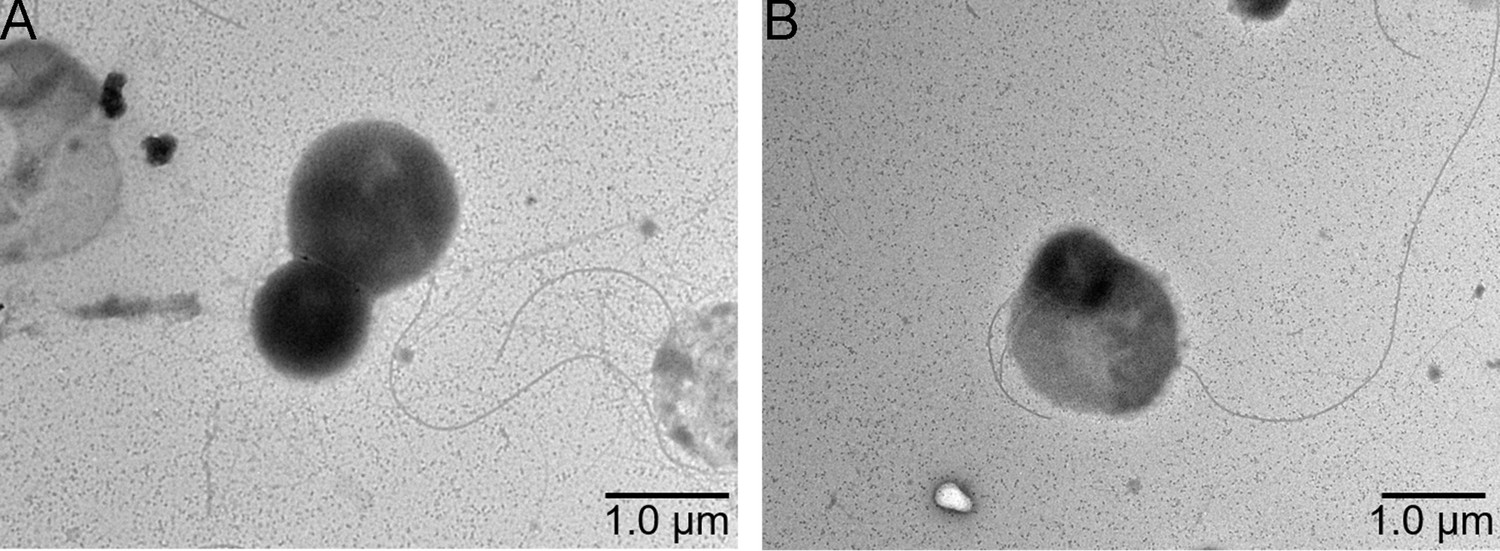
Transmission electron microscope (TEM) observation of the morphology of cells from P. heterotrophicis ZRK32 (A, B).
Figure 1—figure supplement 2
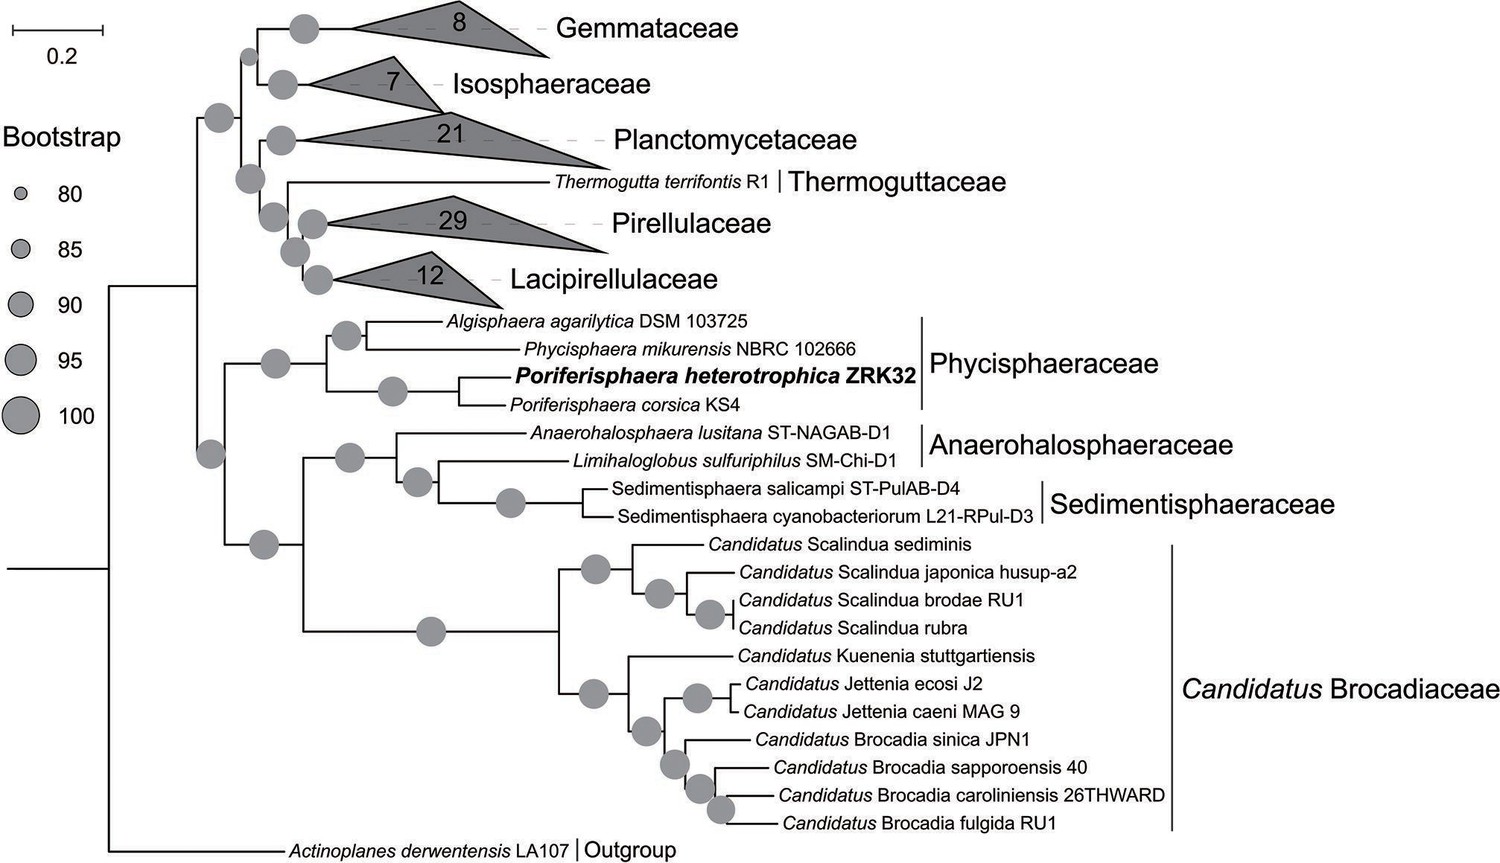
Maximum likelihood phylogenetic tree of genome sequences from the P. heterotrophicis ZRK32 and other Planctomycetes bacteria constructed from the concatenated alignment of 37 single-copy genes; A. derwentensis LA107 was used as the outgroup.
The tree was inferred and reconstructed using the maximum likelihood criterion, with bootstrap values (%)>80; these are indicated at the base of each node with a gray dot (expressed as a percentage from 1000 replications). Bar, 0.2 substitutions per nucleotide position.
Figure 1—figure supplement 3
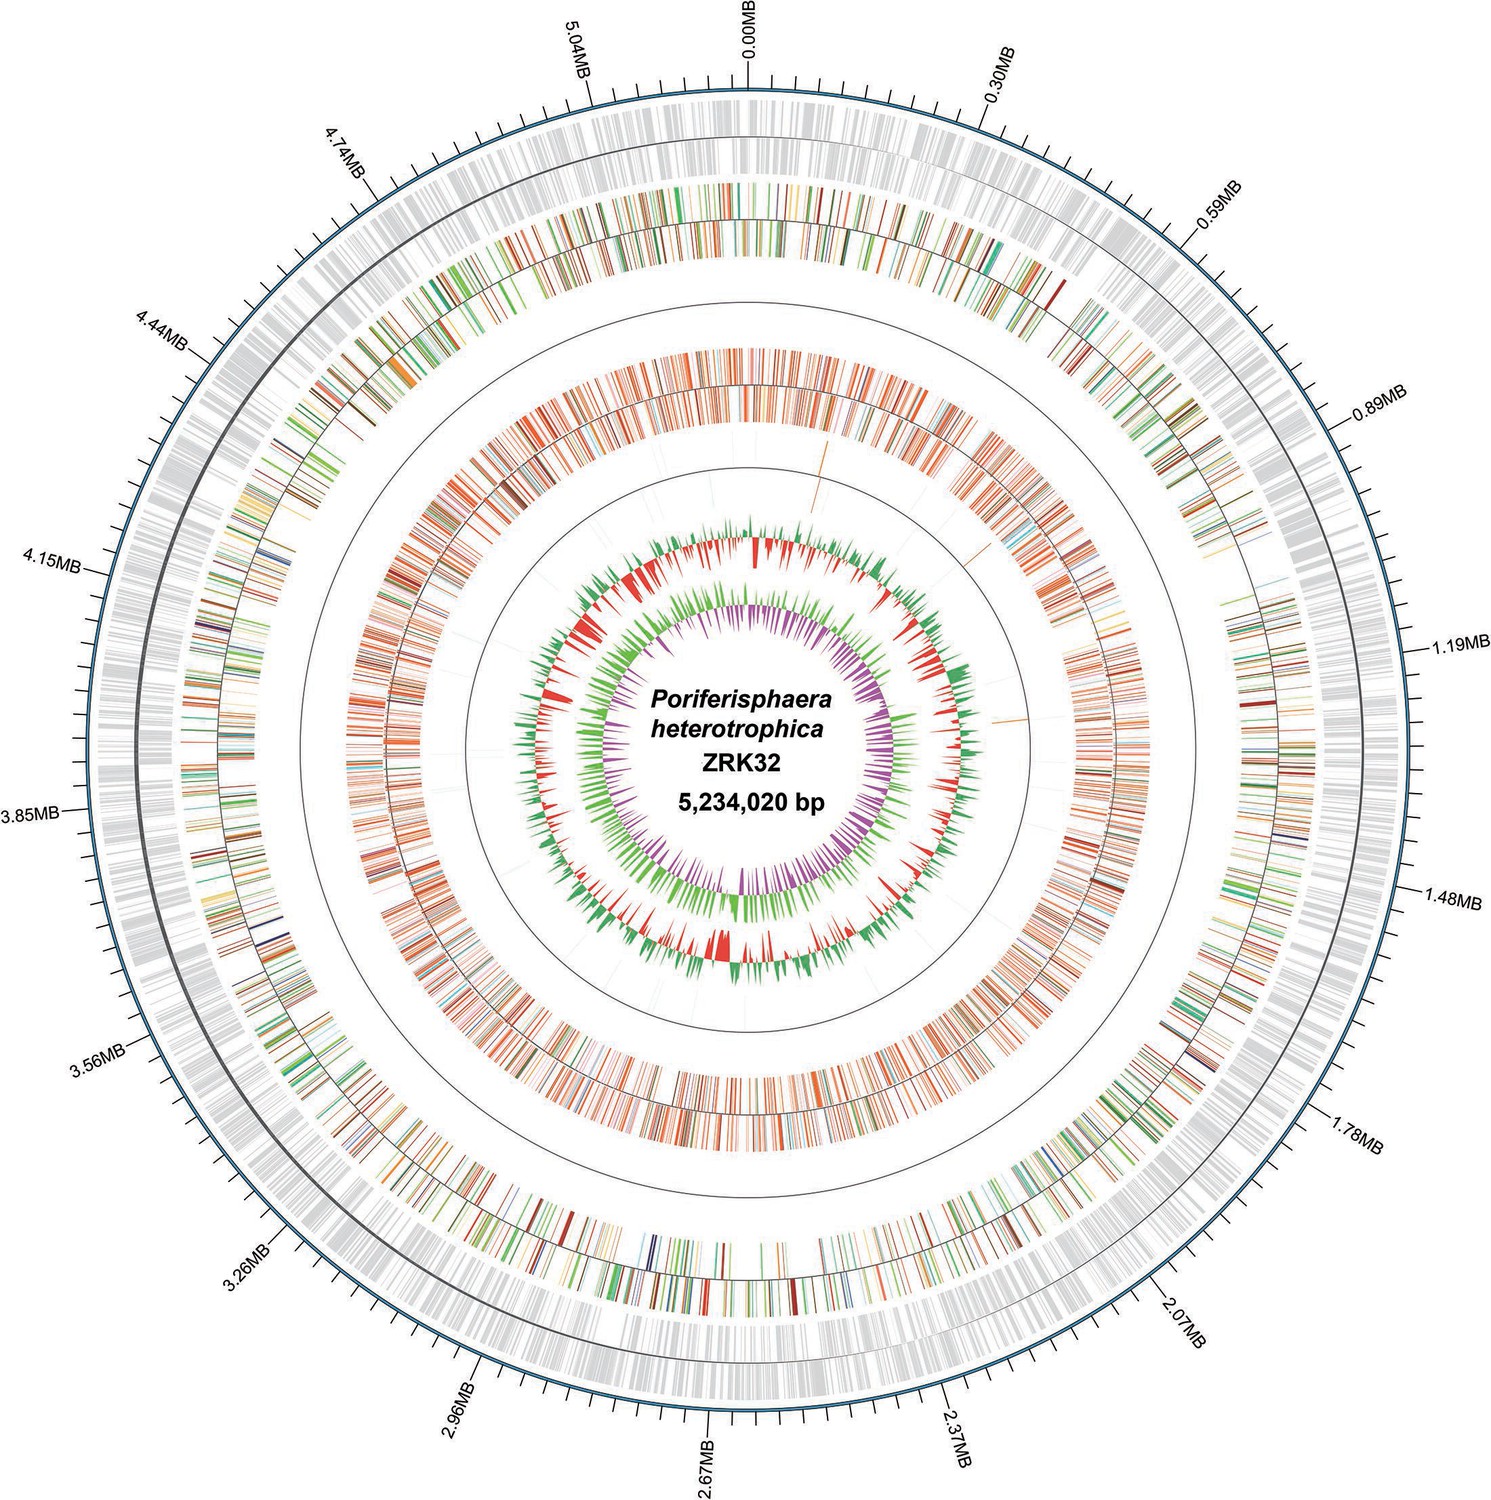
Circular diagram of the P. heterotrophicis ZRK32 genome.
Rings indicate, from outside to the center: a genome-wide marker with a scale of 0.3 MB; coding genes; gene function annotation results; ncRNA; GC content; GC skew.
Figure 1—figure supplement 4
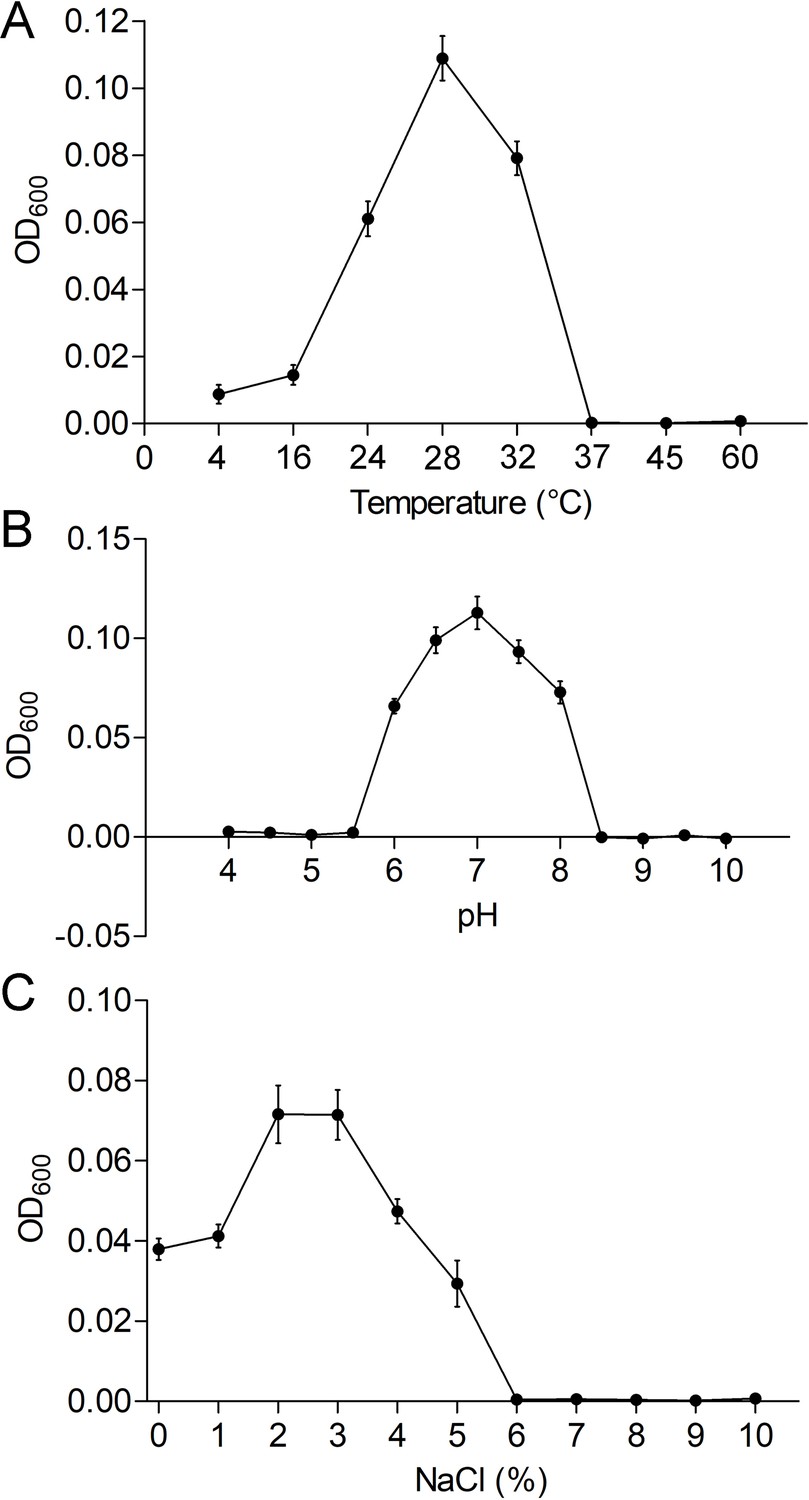
Physiological characterizations of P. heterotrophicis ZRK32.
Growth curves of ZRK32 strains cultivated in different conditions. Temperature (A), pH (B), and NaCl concentration (C) ranges enabling growth were analyzed of ZRK32 strains cultivated in rich medium with three biological triplicates. Data shown as mean; error bars = SD (Standard Deviation).
Figure 1—figure supplement 5
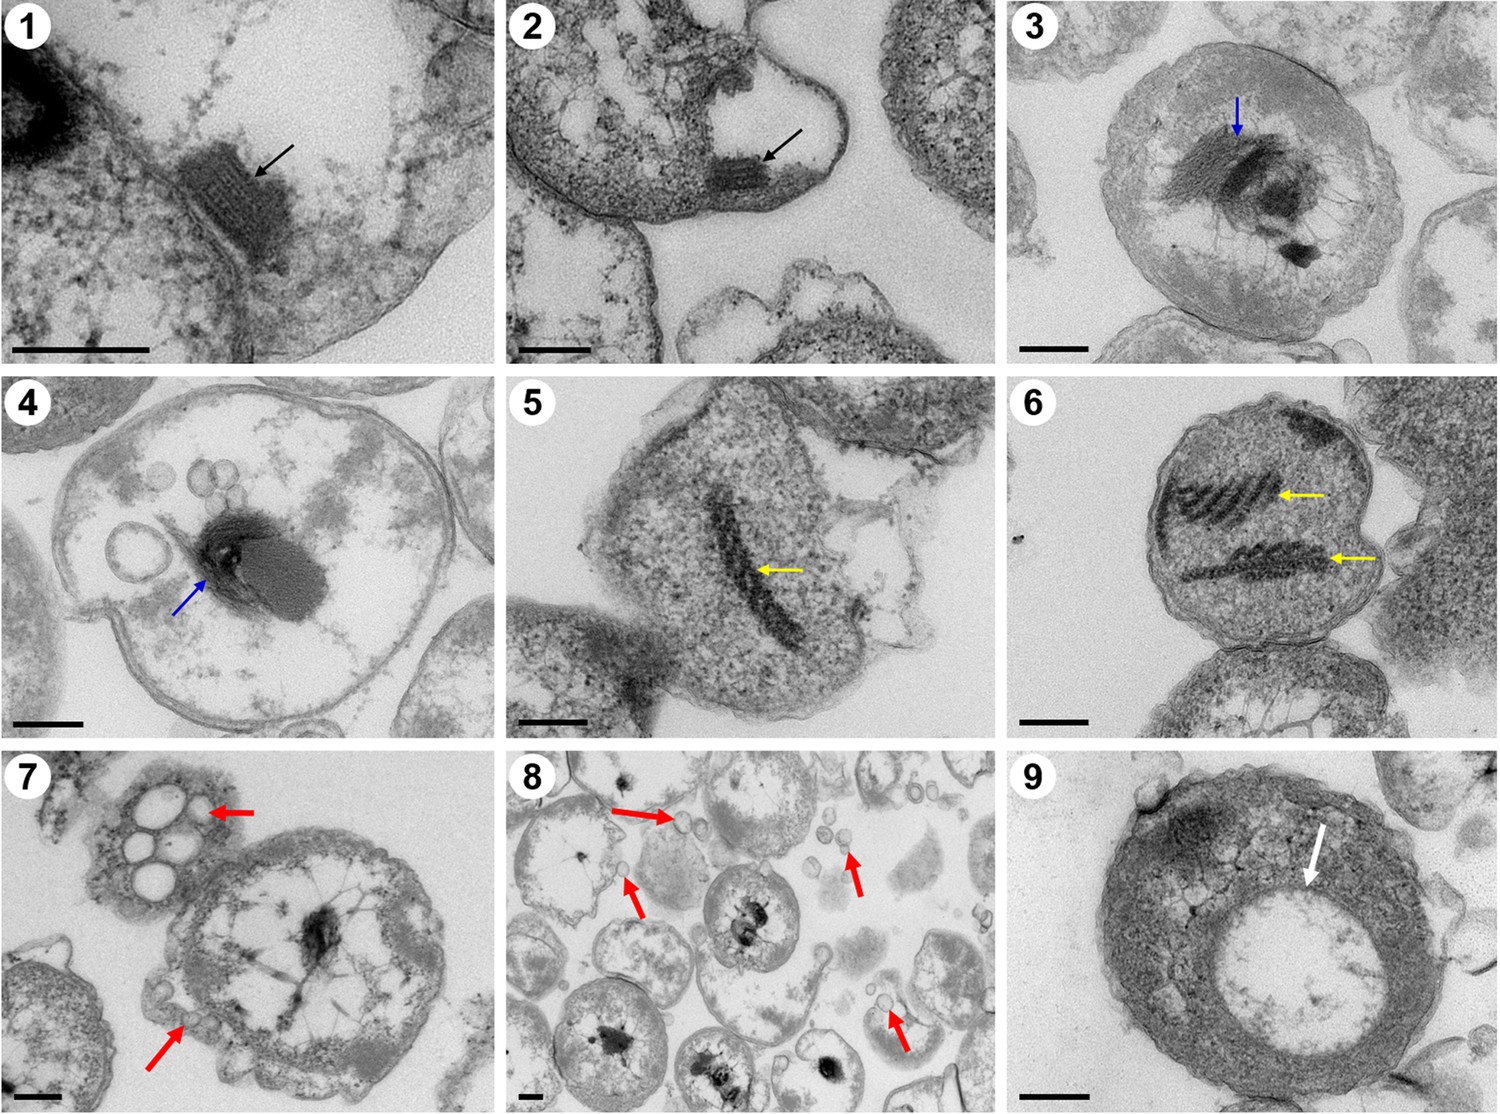
Ultrathin transmission electron microscope (TEM) sections showing some eukaryote-like structures observed in cells from P. heterotrophicis ZRK32.
Golgi-like organelles (indicated with black arrows in panels 1 and 2); endoplasmic reticula-like organelles (indicated with blue arrows in panels 3 and 4); actin filament-like organelles (indicated with yellow arrows in panels 5 and 6); vesicle-like organelles (indicated with red arrows in panels 7 and 8); vacuole-like organelles (indicated with red arrows in panel 9). Scale bars: 200 nm.
Figure 2 with 3 supplements

Growth assay and transcriptomic analysis of P. heterotrophicis ZRK32 strains cultivated in basal medium and rich medium.
(A) Growth curves of ZRK32 strains cultivated in basal medium and rich medium. Data shown as mean; error bars = SD (Standard Deviation). (B) Diagram of the tricarboxylic acid (TCA) cycle. The gene numbers shown in this schematic are the same as those shown in panel C. Transcriptomics-based heat map showing the relative expression levels of genes associated with the TCA cycle (C), NADH-quinone oxidoreductase (D), and flagellar assembly (E) of strain ZRK32 cultivated in rich medium (Rich) compared with strain cultivated in basal medium (Basal). The numbers in panels C, D, and E represent the fold change of gene expression (by using the log2 value).
Figure 2—figure supplement 1
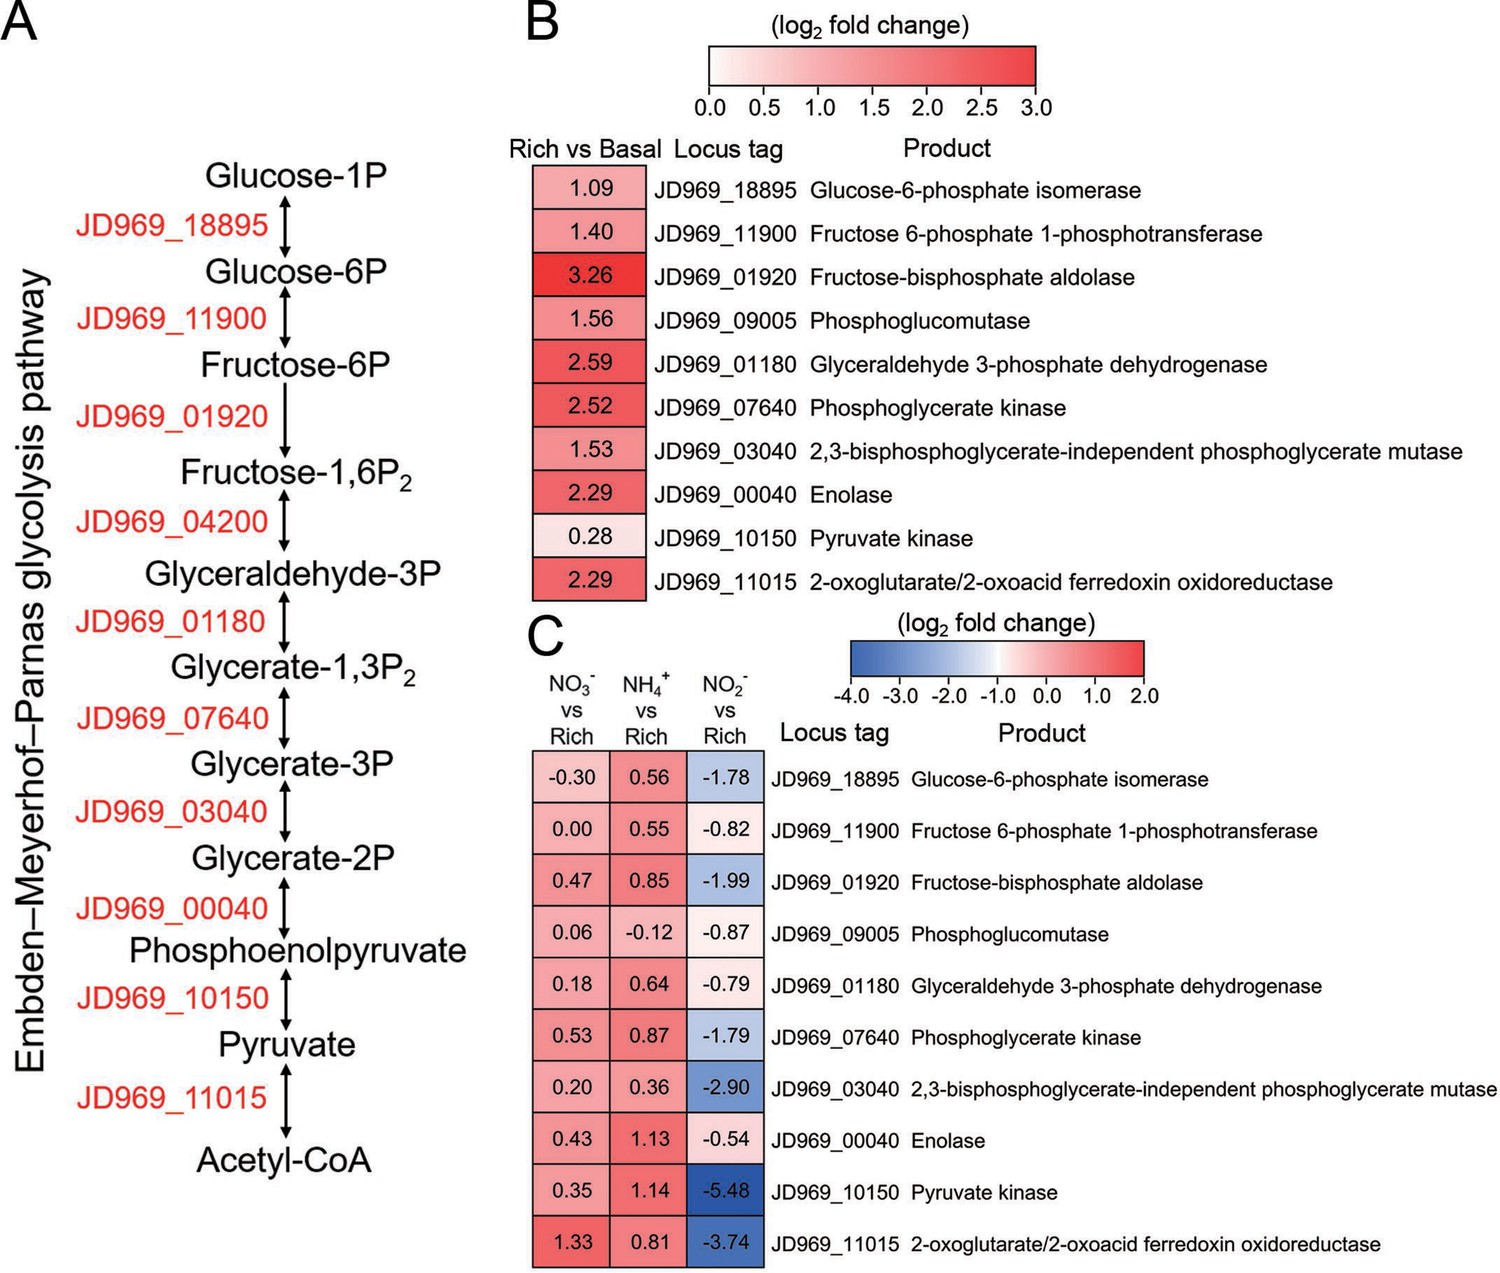
Transcriptomics analysis of the genes associated with the Embden-Meyerhof-Parnas (EMP) glycolysis pathway of P. heterotrophicis ZRK32 strains cultivated in the rich medium alone and cultivated in rich medium supplemented with either 20 mM NO3-, 20 mM NH4+, or 20 mM NO2-.
(A) Diagram of the EMP glycolysis pathway. The gene numbers shown in this schematic are the same as those shown in panels B and C. (B) Transcriptomics-based heat map showing differentially expressed genes associated with the EMP glycolysis pathway of strain ZRK32 cultivated in rich medium (Rich) compared with strains cultivated in basal medium (Basal). (C) Transcriptomics-based heat map showing the relative expression levels of genes associated with the EMP glycolysis pathway of strain ZRK32 cultivated in the rich medium supplemented with different inorganic nitrogen sources (20 mM NO3-, 20 mM NH4+, or 20 mM NO2-) compared with strains cultivated in the rich medium alone. ‘Rich’ indicates rich medium. ‘NO3-, NH4+, and NO2-’ indicate rich medium supplemented with 20 mM NO3-, 20 mM NH4+, and 20 mM NO2-, respectively. The numbers in panels B and C represent the fold change of gene expression (by using the log2 value).
Figure 2—figure supplement 2
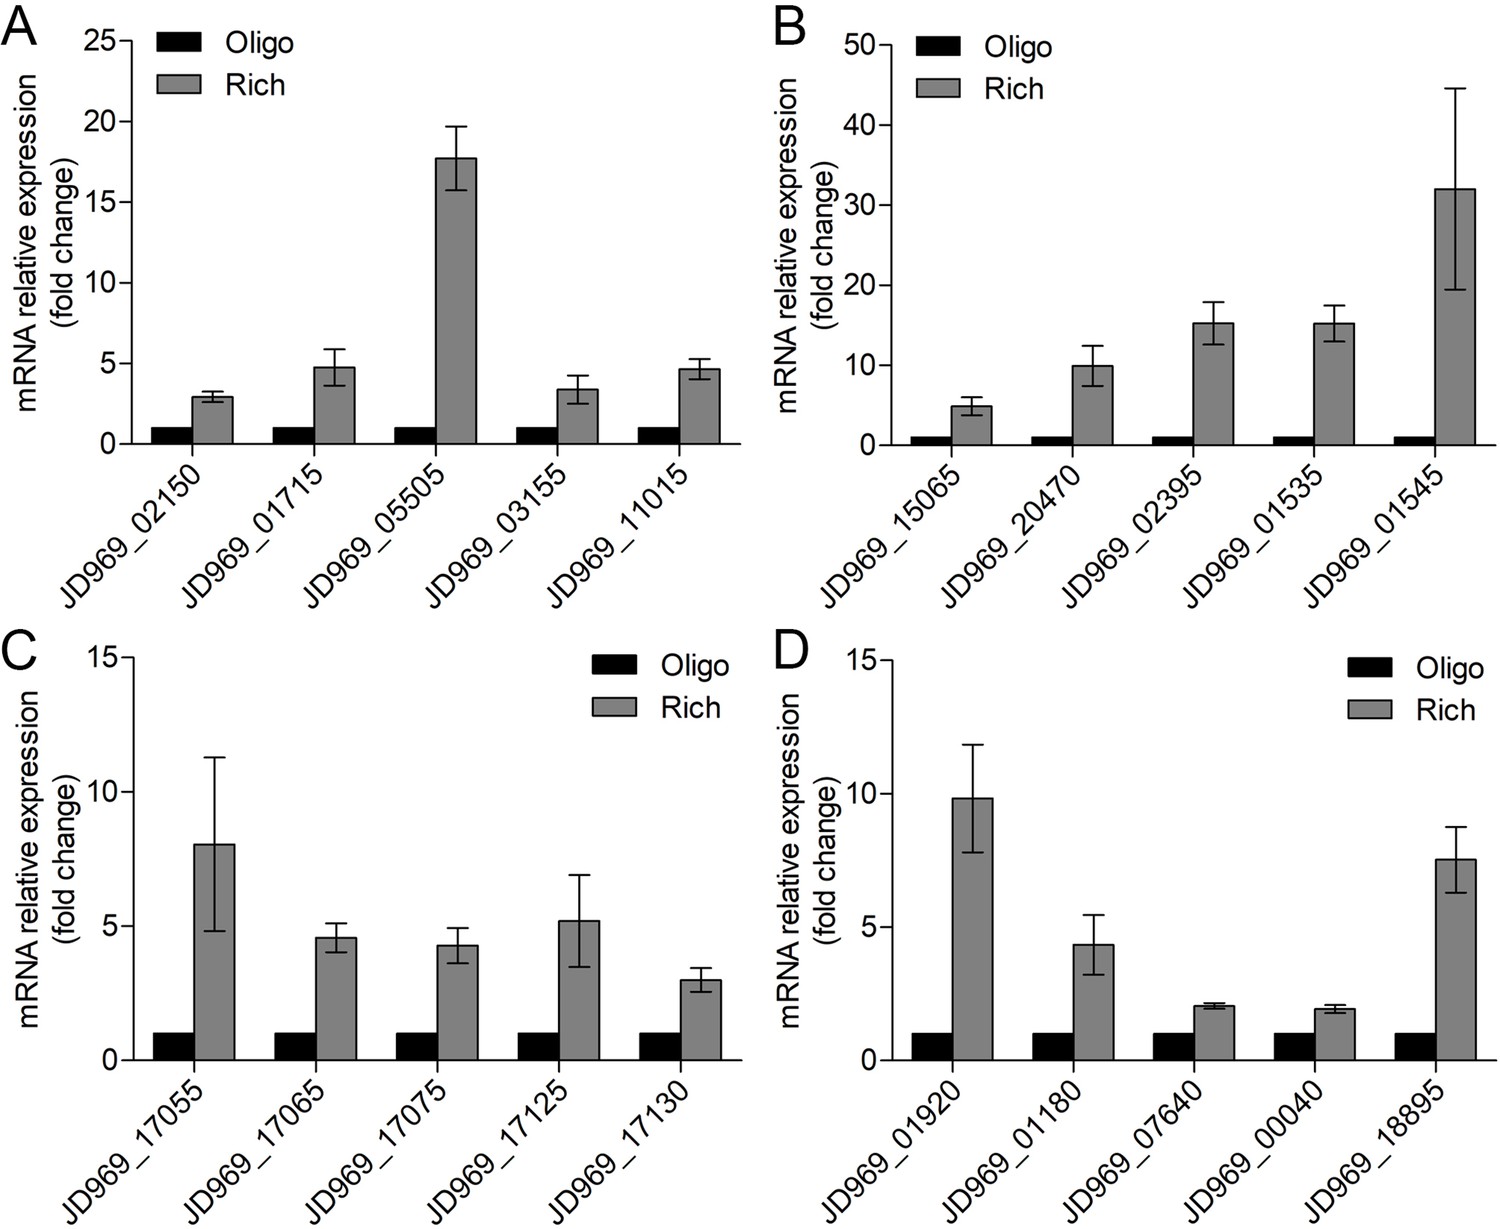
Real-time quantitative reverse transcription PCR (qRT-PCR) detection of the relative expression levels of the genes associated with the tricarboxylic acid (TCA) cycle (A), NADH-quinone oxidoreductase (B), flagellar assembly (C), and Embden-Meyerhof-Parnas (EMP) glycolysis pathway (D) of P. heterotrophicis ZRK32 strains cultivated in rich medium (Rich) compared with strains cultivated in basal medium (Basal).
JD969_02150, succinate dehydrogenase; JD969_01715, fumarate hydratase; JD969_05505, malate dehydrogenase; JD969_03155, isocitrate dehydrogenase; JD969_11015, 2-oxoglutarate ferredoxin oxidoreductase; JD969_15065, NADH-quinone oxidoreductase subunit A; JD969_20470, NADH-quinone oxidoreductase subunit C; JD969_02395, NADH-quinone oxidoreductase subunit F; JD969_01535, NADH-quinone oxidoreductase subunit L; JD969_01545, NADH-quinone oxidoreductase subunit N; JD969_17055, flagellar basal body rod protein FlgB; JD969_17065, flagellar hook-basal body protein FliE; JD969_17075, flagellar motor switch protein FliG; JD969_17125, motility protein MotA; JD969_17130, motility protein MotB; JD969_01920, fructose-bisphosphate aldolase; JD969_01180, glyceraldehyde 3-phosphate dehydrogenase; JD969_07640, phosphoglycerate kinase; JD969_00040, enolase; JD969_18895, glucose-6-phosphate isomerase. Data shown as mean; error bars = SD (Standard Deviation).
Figure 2—figure supplement 3
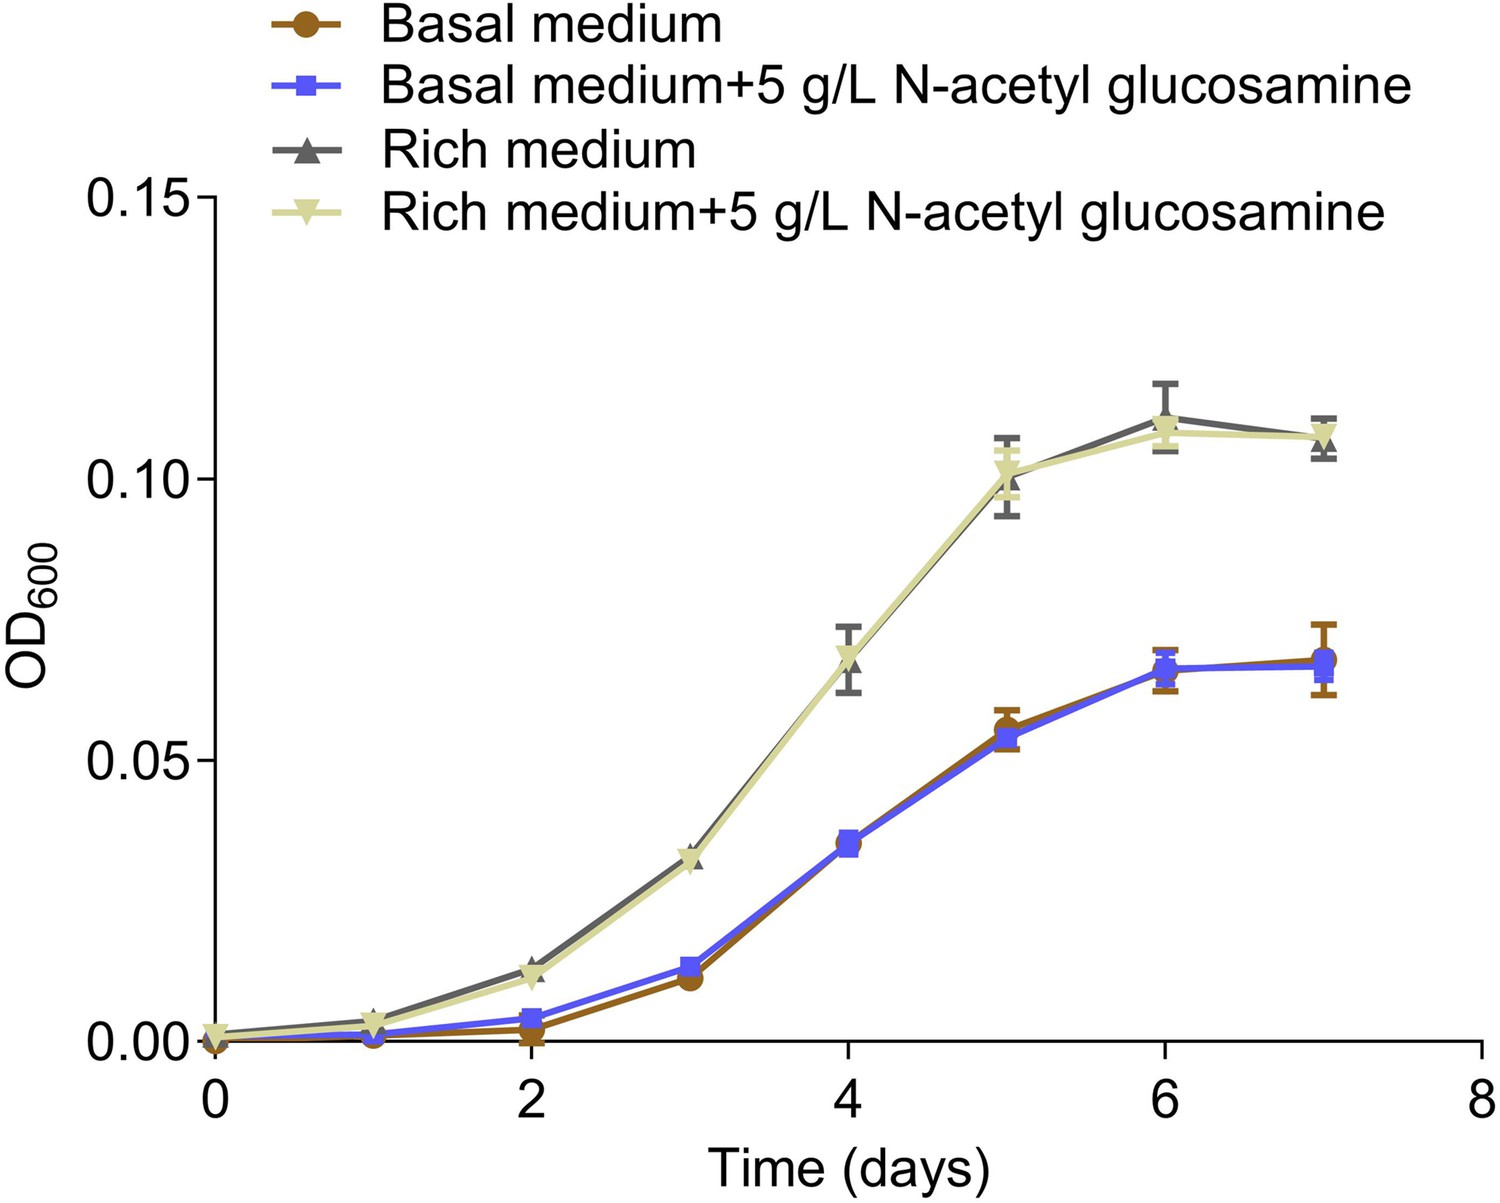
Growth curves of ZRK32 strains cultivated in the basal medium, basal medium supplemented with 5 g/L N-acetyl glucosamine, rich medium, and rich medium supplemented with 5 g/L N-acetyl glucosamine.
Data shown as mean; error bars = SD (Standard Deviation).
Figure 3
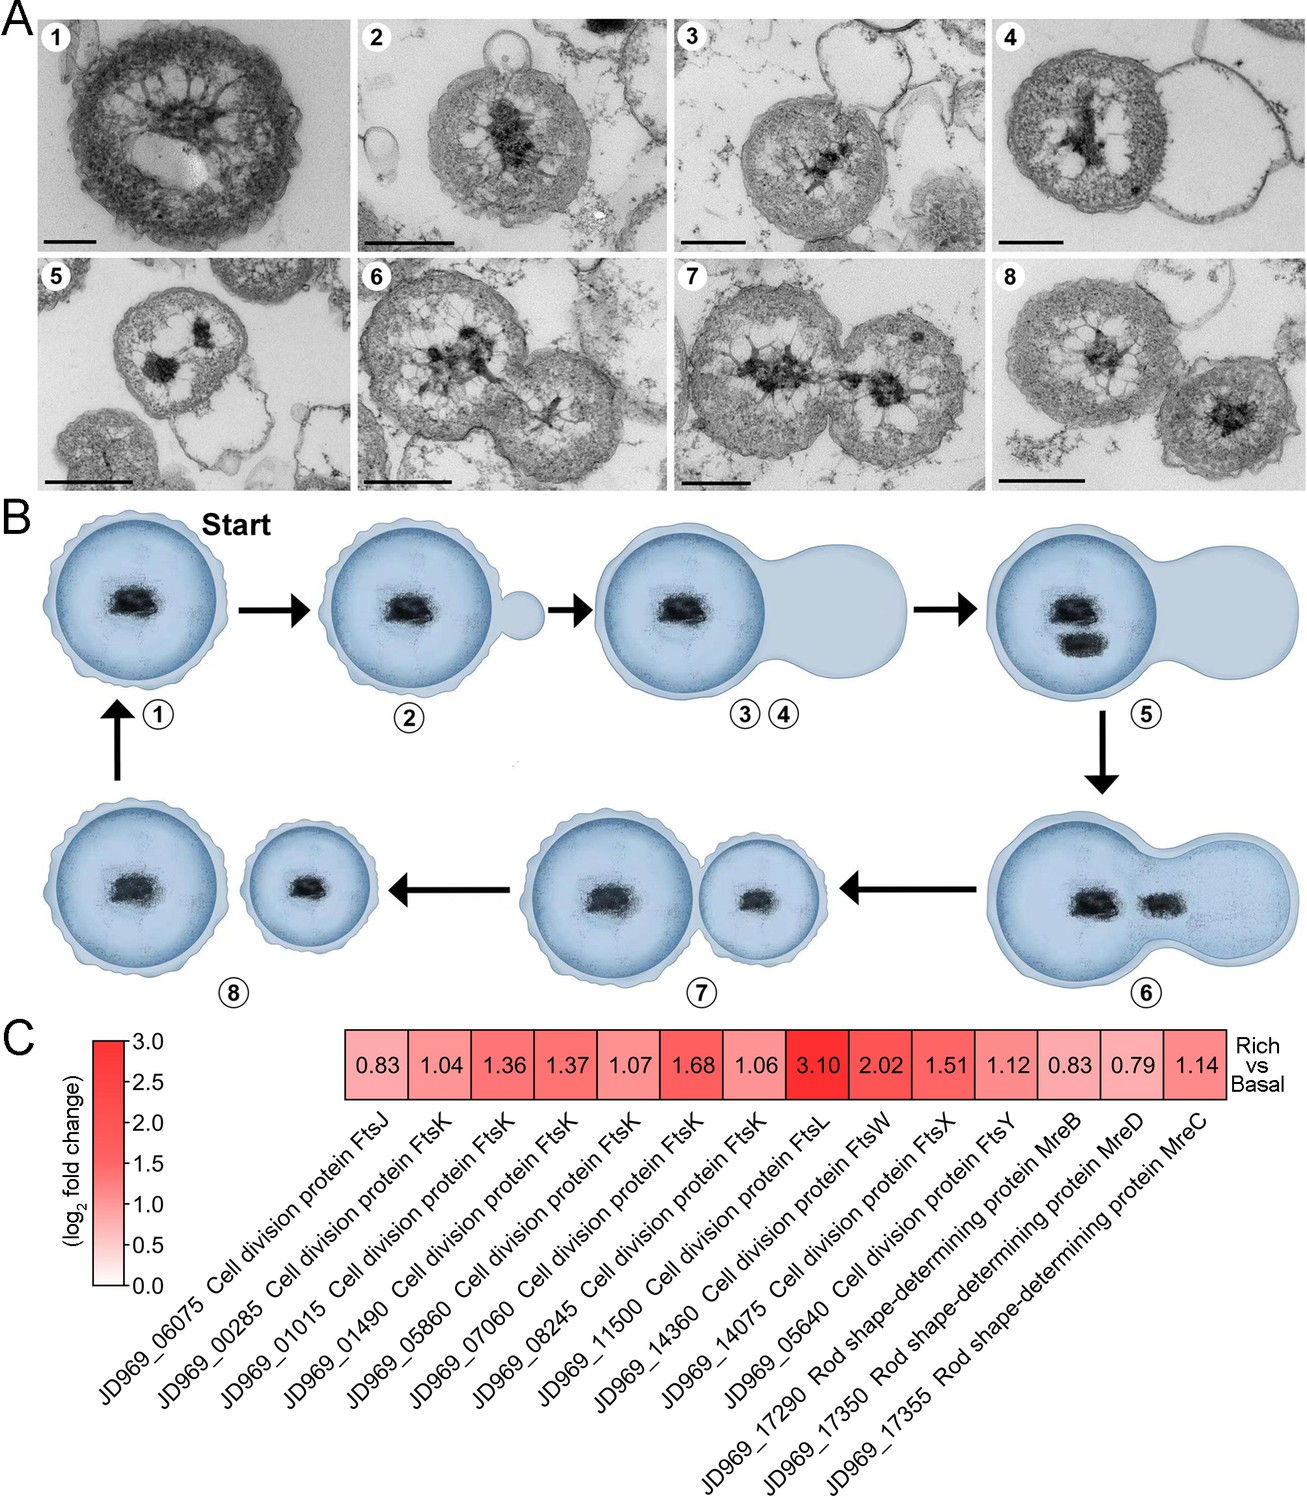
The mode of cell division utilized by P. heterotrophicis ZRK32.
(A) Ultrathin transmission electron microscope (TEM) sections showing the process of polar budding division (panels 1–8) in strain ZRK32. Images representing the different phases of cell division are shown. (B) The proposed model of cell division of strain ZRK32 based on the TEM observation shown in panel B. The numbers in panels A and B correspond to the same phase of division. (C) Transcriptomics-based heat map showing the differentially expressed genes that encode different key proteins associated with cell division in strain ZRK32. The numbers in panel A represent the fold change of gene expression (by using the log2 value). Scale bars = 200 nm.
Figure 4 with 2 supplements
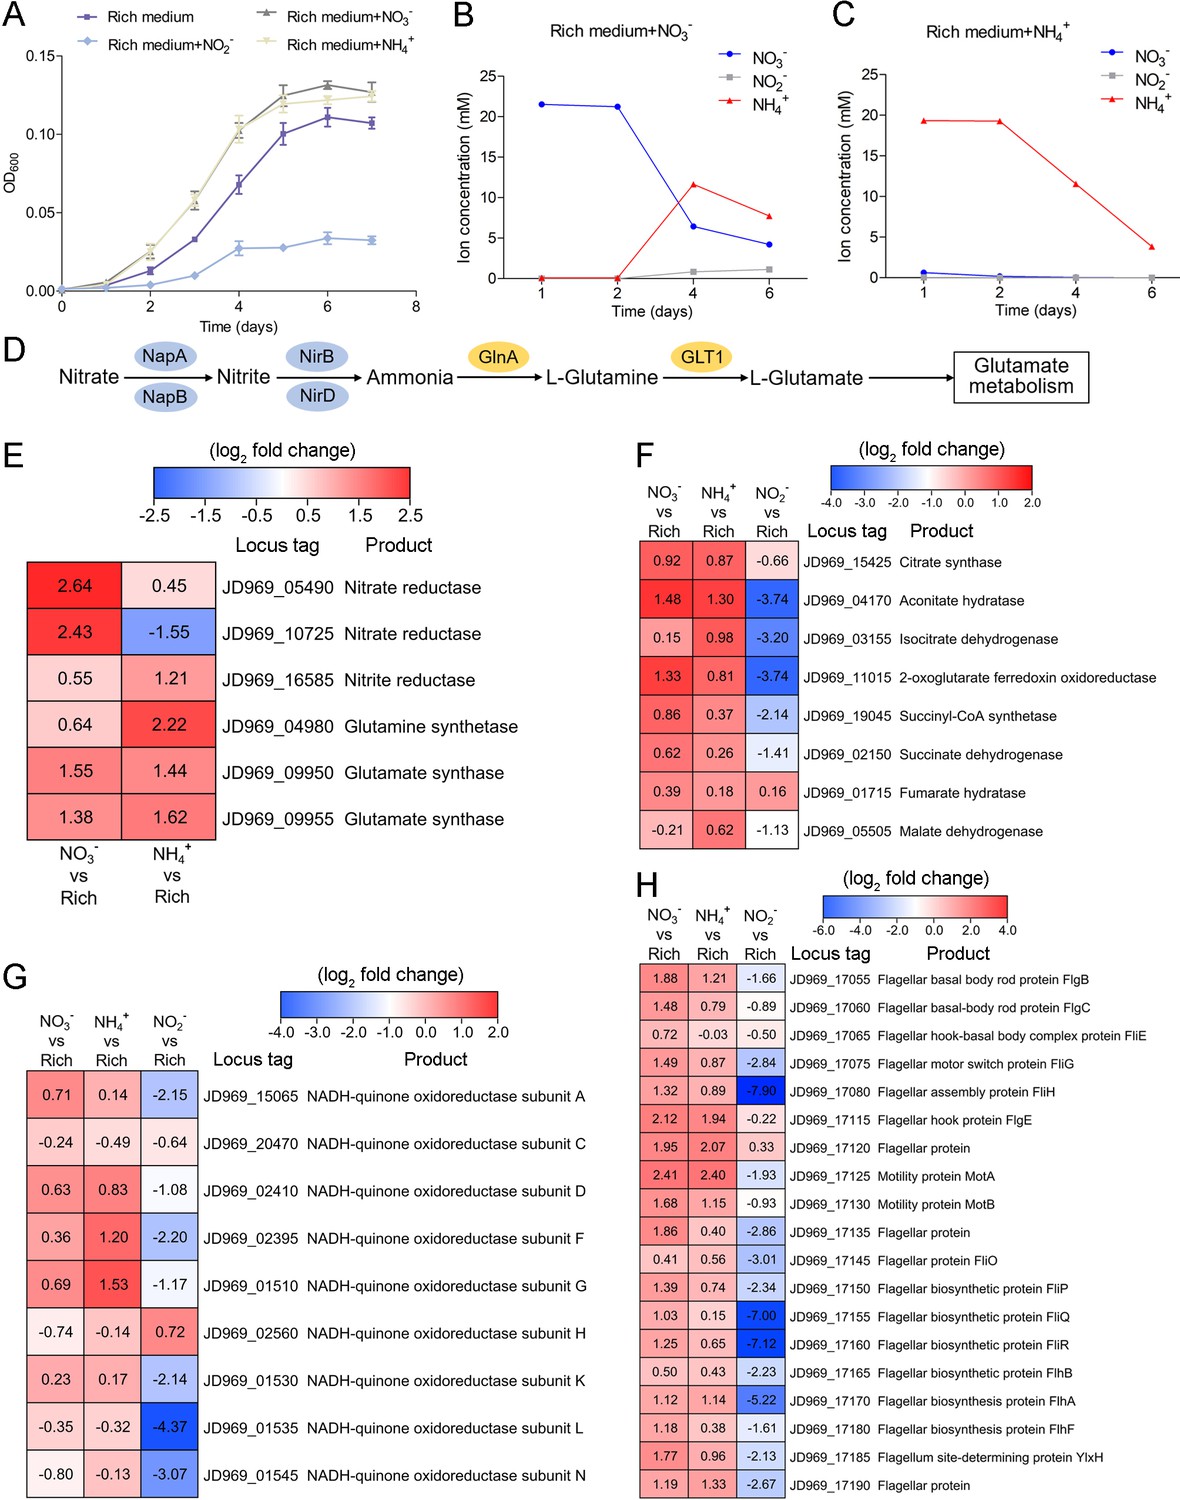
Nitrogen metabolism assays of P. heterotrophicis ZRK32.
(A) Growth curves of ZRK32 strains cultivated in the rich medium alone and cultivated in rich medium supplemented with either 20 mM NO3-, 20 mM NH4+, or 20 mM NO2-. Data shown as mean; error bars = SD (Standard Deviation). (B) The dynamics of concentrations of NO3-, NH4+, and NO2- in strains of ZRK32 cultivated in the rich medium supplemented with 20 mM NO3-. (C) The dynamics of concentrations of NO3-, NH4+, and NO2- in strains of ZRK32 cultivated in the rich medium supplemented with 20 mM NH4+. (D) The predicted nitrogen metabolism pathway of strain ZRK32. Abbreviations: NapA, periplasmic nitrate reductase; NapB, periplasmic nitrate reductase, electron transfer subunit; NirB, nitrite reductase (NADH) large subunit; NirD, nitrite reductase (NADH) small subunit; GlnA, glutamine synthetase; GLT1, glutamate synthase. Transcriptomics-based heat map showing the relative expression levels of genes associated with nitrogen metabolism (E), the tricarboxylic acid (TCA) cycle (F), NADH-quinone oxidoreductase (G), and flagellar assembly (H) in strains of ZRK32 cultivated in the rich medium supplemented with different inorganic nitrogen sources (20 mM NO3-, 20 mM NH4+, or 20 mM NO2-) compared with strains cultivated in the rich medium alone. ‘Rich’ indicates rich medium. ‘NO3-, NH4+, and NO2-’ indicate rich medium supplemented with 20 mM NO3-, 20 mM NH4+, and 20 mM NO2-, respectively. The numbers in panels E, F, G, and H represent the fold change of gene expression (by using the log2 value).
Figure 4—figure supplement 1
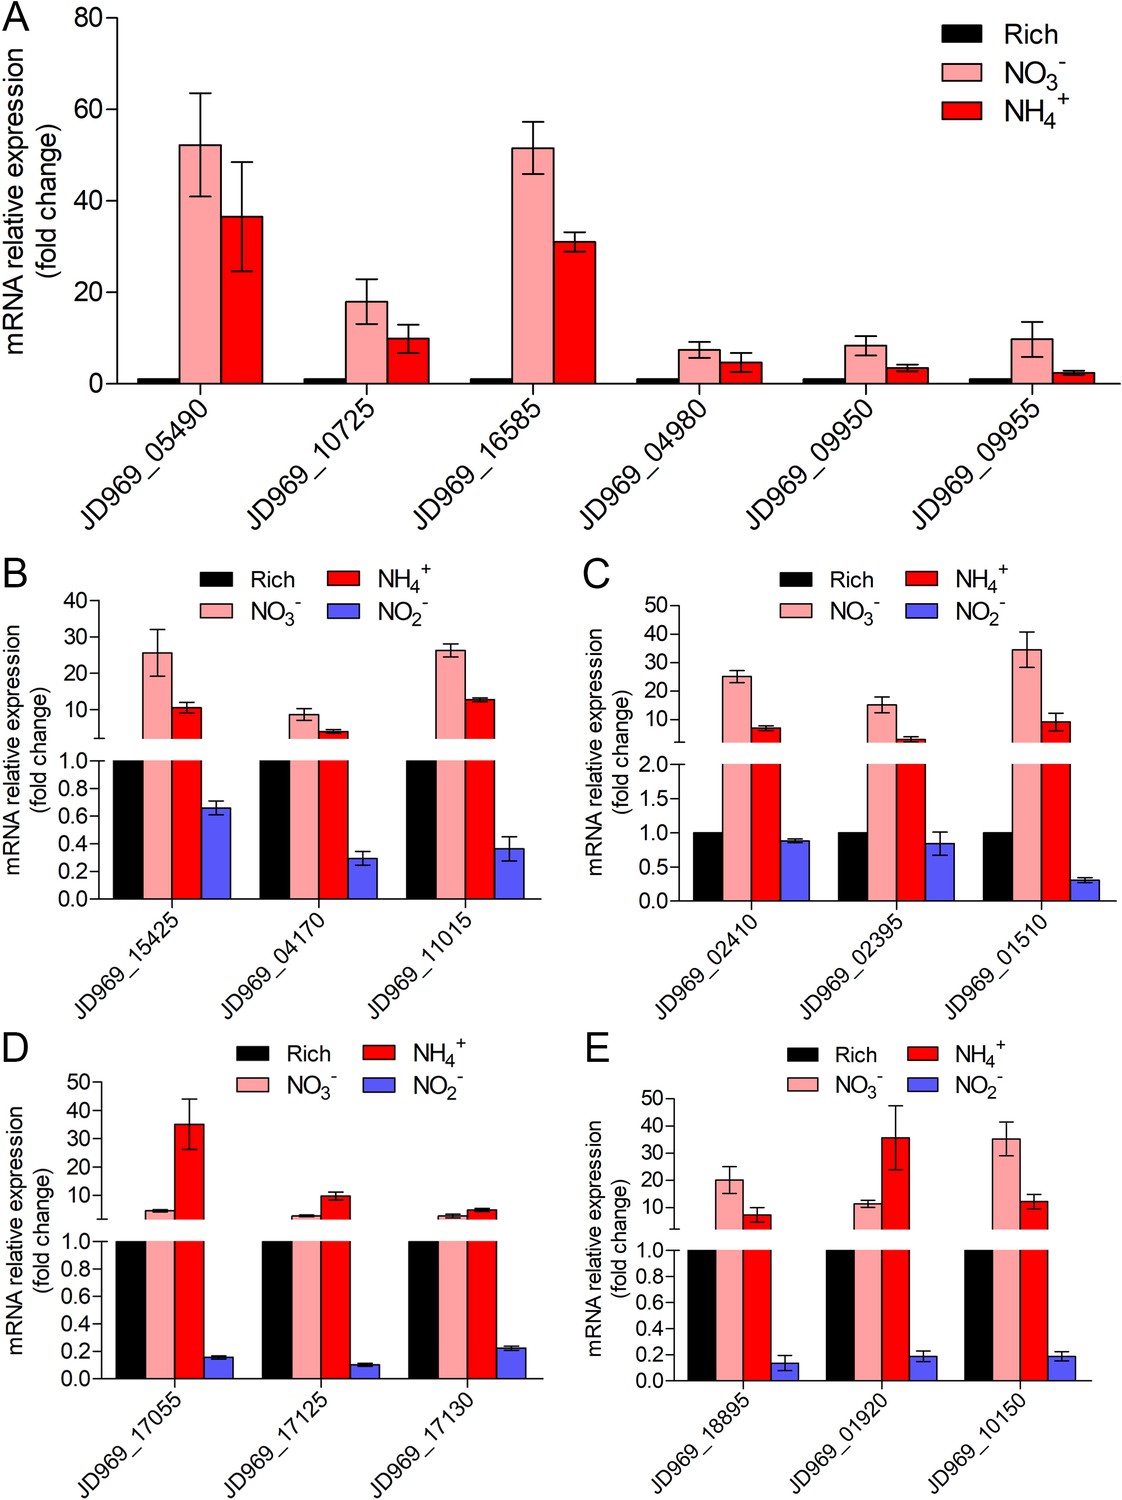
Real-time quantitative reverse transcription PCR (qRT-PCR) detection of the relative expression levels of the genes associated with nitrogen metabolism (A), tricarboxylic acid (TCA) cycle (B), NADH-quinone oxidoreductase (C), flagellar assembly (D), and Embden–Meyerhof–Parnas (EMP) glycolysis pathway (E) of ZRK32 strains cultivated in the rich medium supplemented with different inorganic nitrogen sources (20 mM NO3-, 20 mM NH4+, or 20 mM NO2-) compared with strains cultivated in the rich medium alone.
‘Rich’ indicates rich medium. ‘NO3-, NH4+, and NO2-’ indicate rich medium supplemented with 20 mM NO3-, 20 mM NH4+, and 20 mM NO2-, respectively. JD969_05490, nitrate reductase; JD969_10725, nitrate reductase; JD969_16585, nitrite reductase; JD969_04980, glutamine synthetase; JD969_09950, glutamate synthase; JD969_09955, glutamate synthase; JD969_15425, citrate synthase; JD969_04170, aconitate hydratase; JD969_11015, 2-oxoglutarate ferredoxin oxidoreductase; JD969_02410, NADH-quinone oxidoreductase subunit D; JD969_02395, NADH-quinone oxidoreductase subunit F; JD969_01510, NADH-quinone oxidoreductase subunit G; JD969_17055, flagellar basal body rod protein FlgB; JD969_17125, motility protein MotA; JD969_17130, motility protein MotB; JD969_18895, glucose-6-phosphate isomerase; JD969_01920, fructose-bisphosphate aldolase; JD969_10150, pyruvate kinase. Data shown as mean; error bars = SD (Standard Deviation).
Figure 4—figure supplement 2
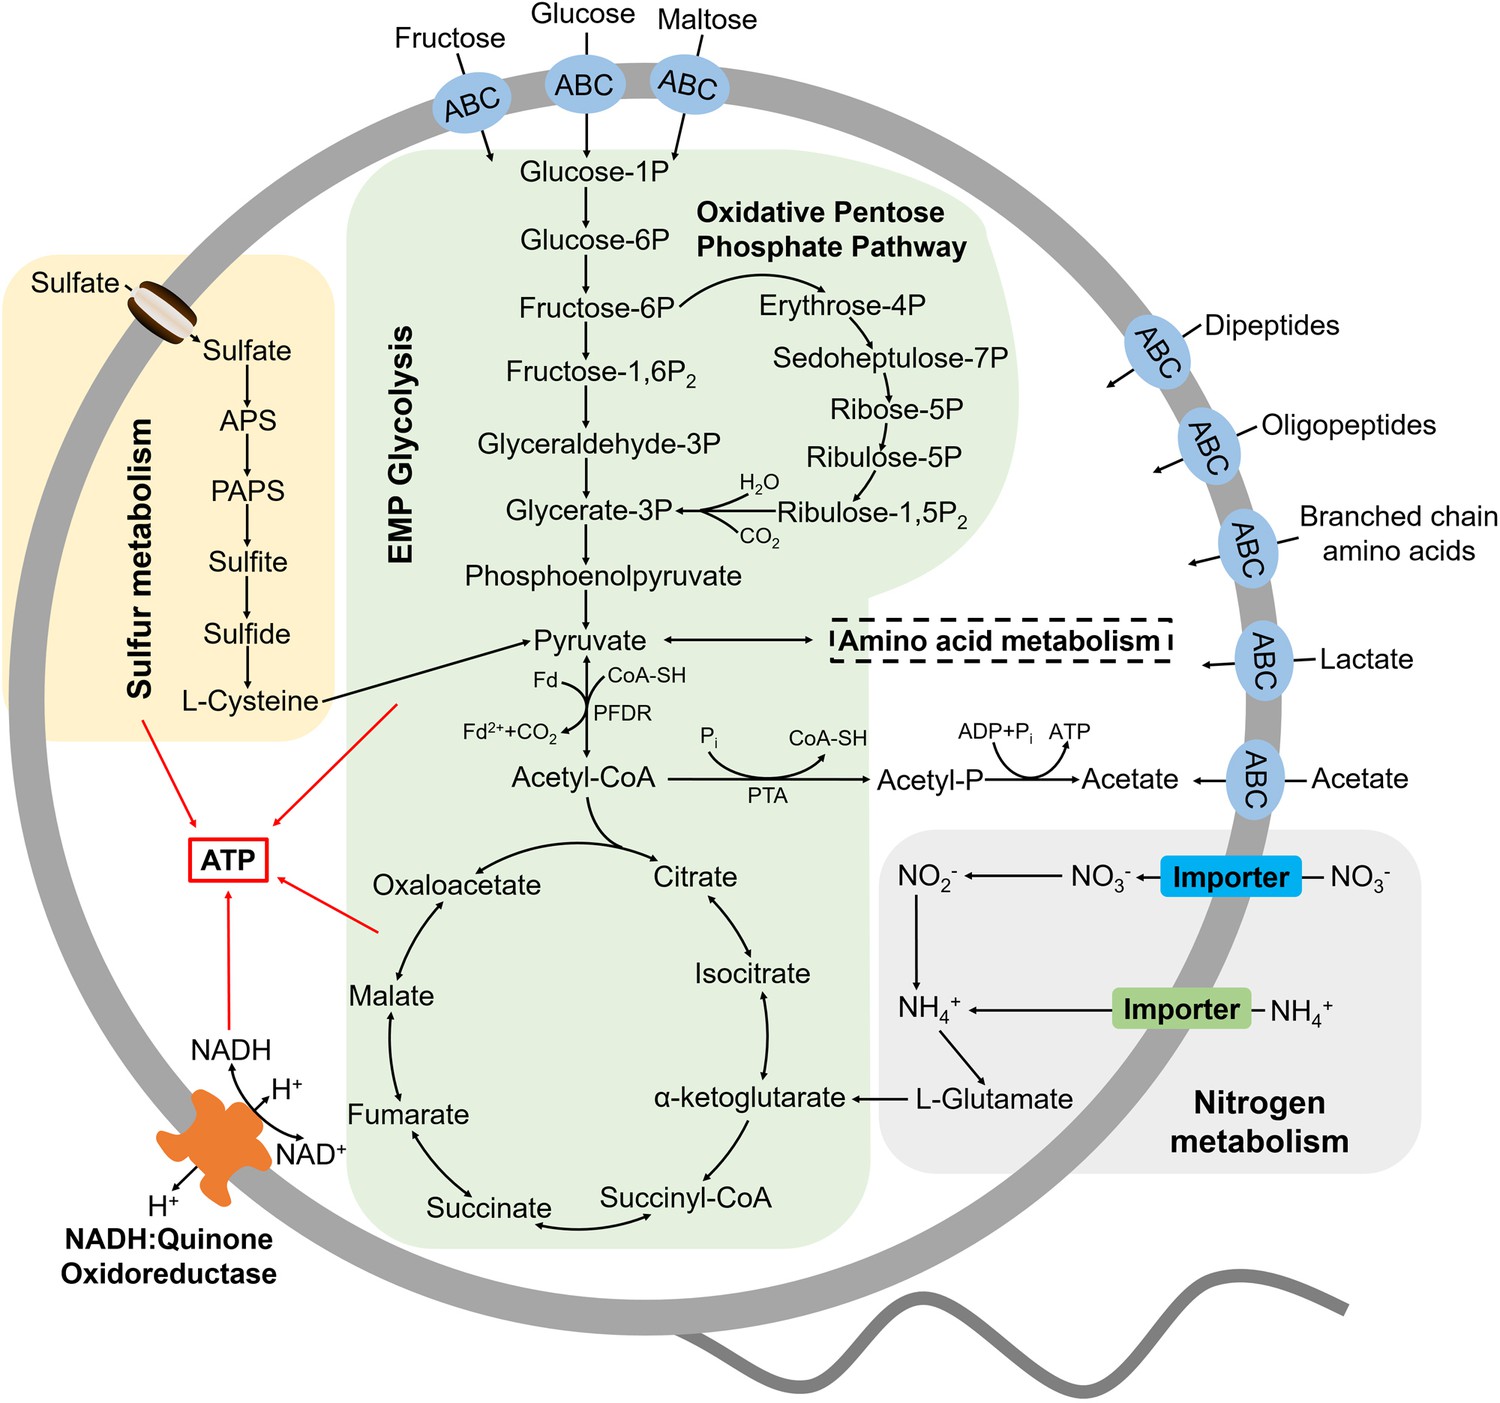
Muti-omics-based central metabolism model of P. heterotrophicis ZRK32.
Based on the combination of genomic, transcriptomic, and physiological characteristics, we proposed a model toward the central metabolic traits of strain ZRK32. In this model, central metabolisms including the Embden-Meyerhof-Parnas (EMP) glycolysis pathway, the oxidative pentose phosphate pathway, the tricarboxylic acid (TCA) cycle, sulfur metabolism, nitrogen metabolism, and electron transport system were shown. All the above items are closely related to the energy production in strain ZRK32. Briefly, strain ZRK32 contains a number of genes related to ABC transporters of amino acids and peptides, which could transport these organic matters into the cell to participate in the EMP glycolysis and oxidative pentose phosphate pathway. These processes eventually drive the formation of pyruvate and acetyl-CoA, which enter the TCA cycle to produce energy for the growth of strain ZRK32. Moreover, nitrate could be converted to ammonium through the dissimilatory nitrate reduction, which participates in the synthesis of L-glutamate and thereby entering into the TCA cycle for energy generation. Meanwhile, the H+-transporting NADH-quinone oxidoreductase required for energy production is present in strain ZRK32. Strain ZRK32 also contains a complete pathway for assimilatory sulfate reduction, which contributes to to energy production.
Figure 5 with 4 supplements
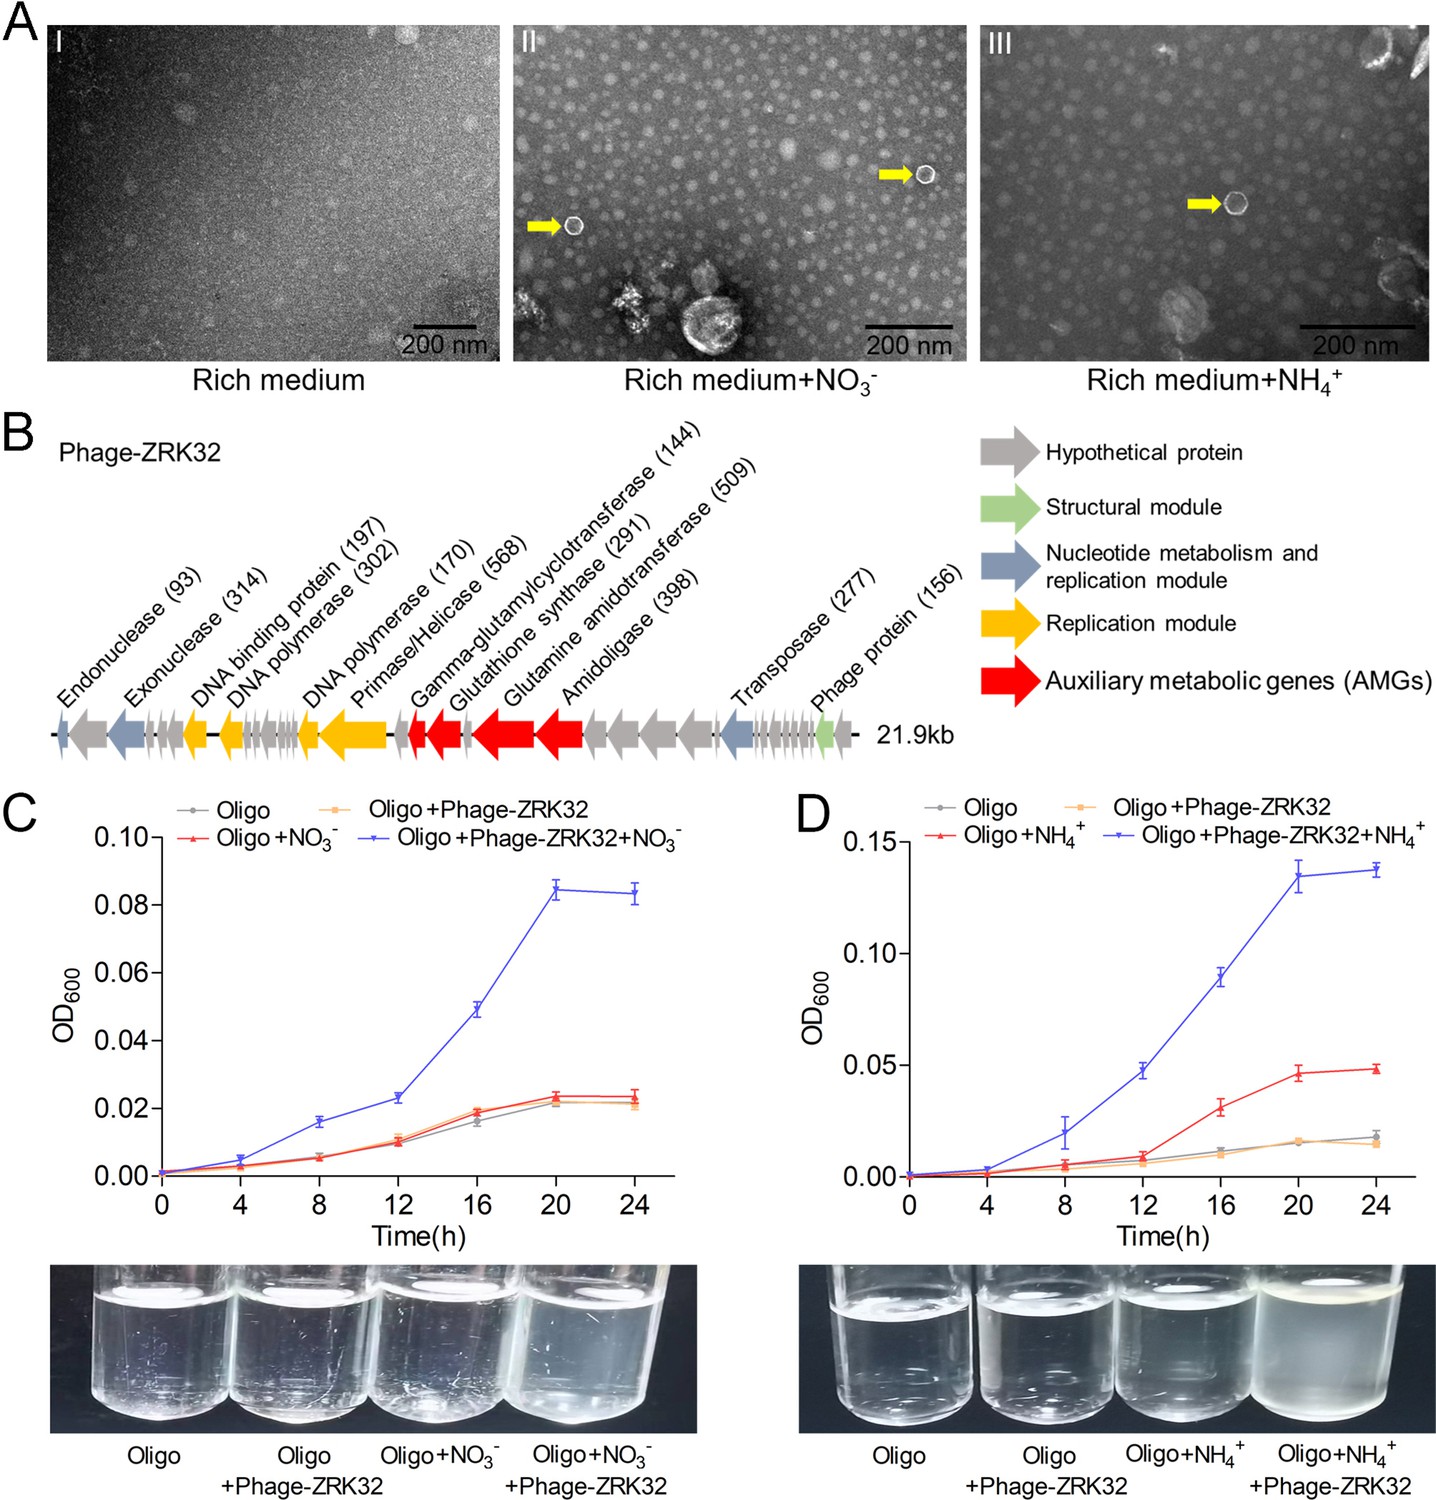
Observation and functional assay of the chronic bacteriophage induced by NO3- or NH4+ from P. heterotrophicis ZRK32.
(A) Transmission electron microscope (TEM) observation of phages extracted from the cell suspensions of ZRK32 strains that cultured in either the rich medium alone, or rich medium supplemented with 20 mM of either NO3- or NH4+. (A, panel I) No phage-like particles were observed in the cell suspensions from the ZRK32 strain cultured in the rich medium. (A, panels II and III) Hexagonal phages (indicated with yellow arrows) observed in the cell suspensions from the ZRK32 strains cultured in the rich medium supplemented with 20 mM of either NO3- or NH4+. Scale bars: 200 nm. (B) A diagram showing the genomic composition of Phage-ZRK32. The arrows represent different ORFs and the direction of transcription. The main putative gene products of this phage are shown, and the numbers in brackets indicate the numbers of amino acids. Hypothetical proteins are indicated by gray arrows, structural modules are indicated by green arrows, nucleotide metabolism is indicated by blue-gray arrows, the replication module is indicated by gold arrows, and auxiliary metabolic genes (AMGs) are indicated by red arrows. The size of the phage genome is shown beside the gene cluster. (C) Bacterial growth curve showing the growth rate of strains of Pseudomonas stutzeri 273 cultivated in either oligotrophic medium, oligotrophic medium supplemented with Phage-ZRK32, oligotrophic medium supplemented with 20 mM NO3-, or oligotrophic medium supplemented with 20 mM NO3- and Phage-ZRK32. (D) Bacterial growth curve showing the growth rate of strains of P. stutzeri 273 cultivated in either oligotrophic medium, oligotrophic medium supplemented with Phage-ZRK32, oligotrophic medium supplemented with 20 mM NH4+, or oligotrophic medium supplemented with 20 mM NH4+ and Phage-ZRK32. ‘Oligo’ indicates oligotrophic medium. Data shown as mean; error bars = SD (Standard Deviation).
Figure 5—figure supplement 1
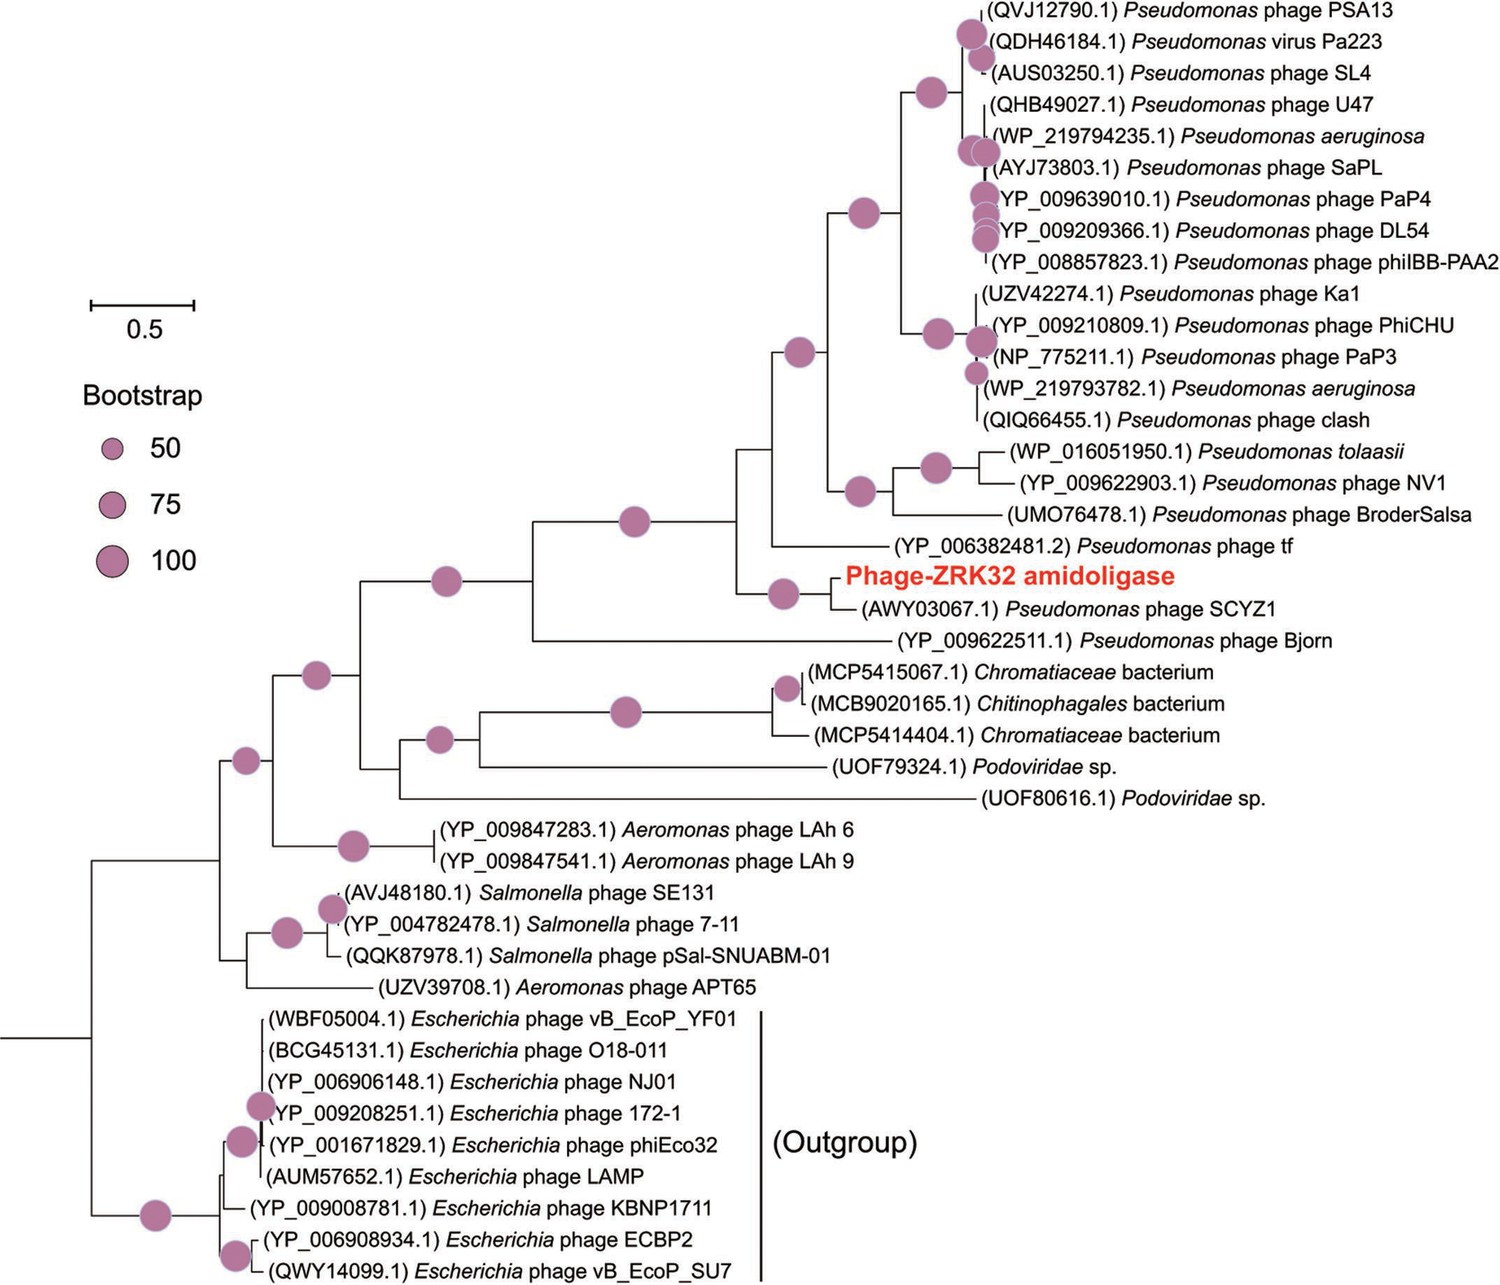
Phylogenetic analysis of Phage-ZRK32, some related phages, and bacterial hosts, based on the aligned amino acid sequences of amidoligase.
The NCBI accession number for each amino acid sequence is indicated after each corresponding strain’s name. The amino acid sequences of amidoligase from nine Escherichia phages were used as the outgroup. The tree was inferred and reconstructed using the maximum likelihood criterion, with bootstrap values (%)>50; these are indicated at the base of each node with a gray dot (expressed as a percentage from 1000 replications). Bar, 0.5 substitutions per nucleotide position.
Figure 5—figure supplement 2
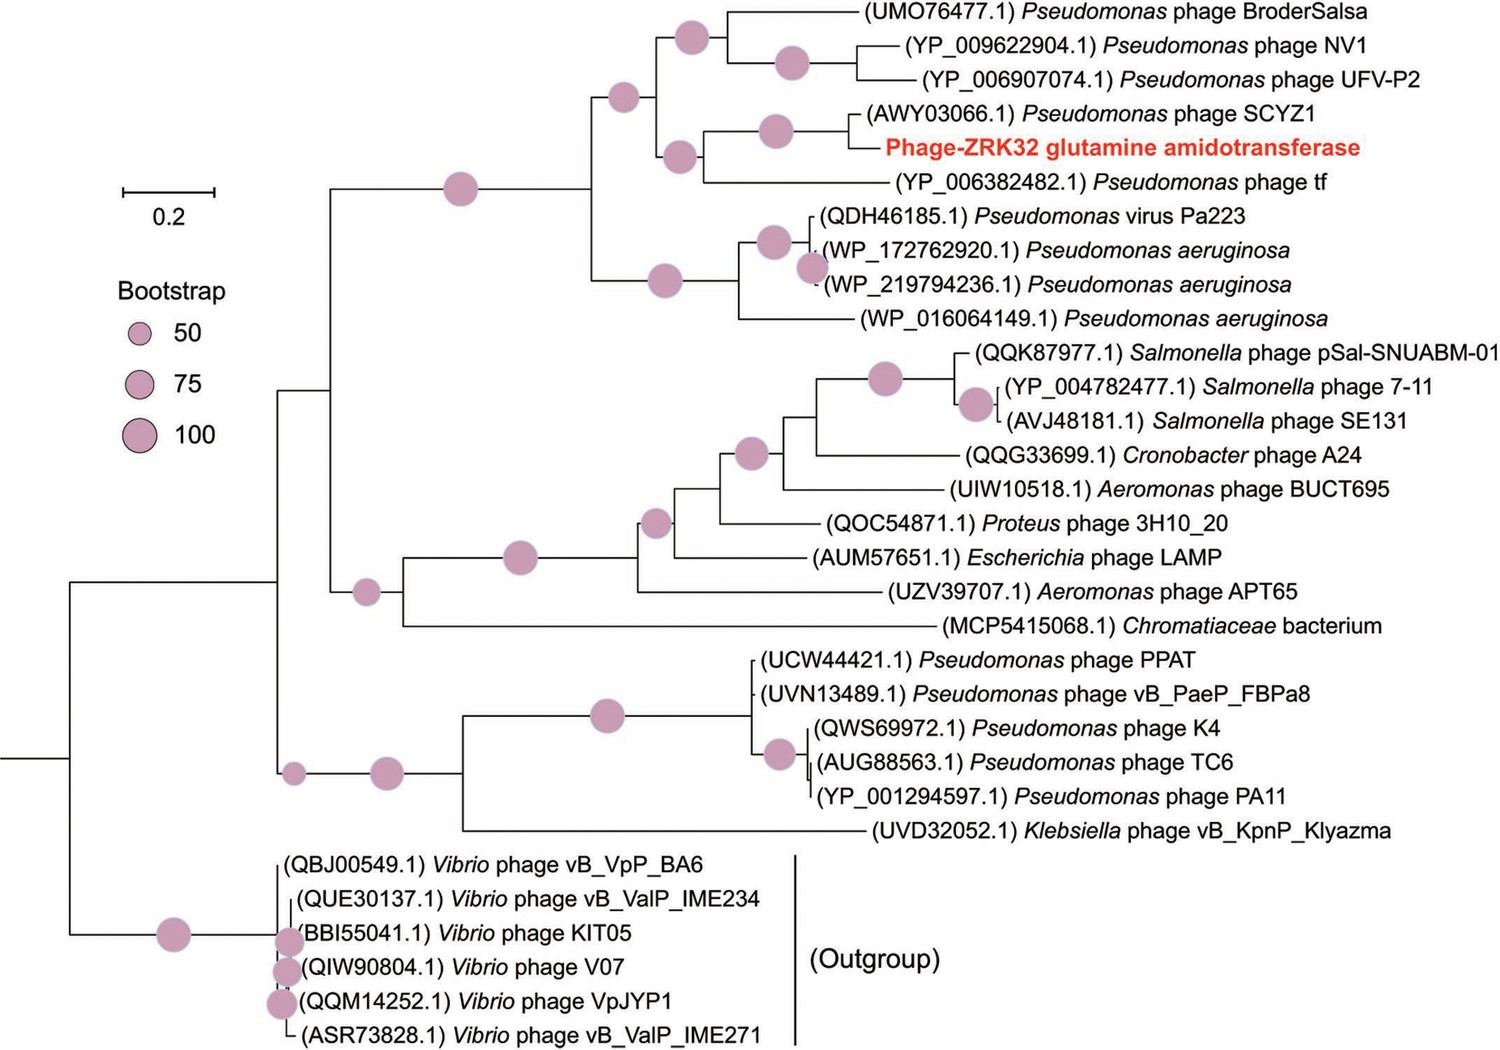
Phylogenetic analysis of Phage-ZRK32, some related phages, and bacterial hosts, based on the aligned amino acid sequences of glutamine amidotransferase.
The NCBI accession number for each amino acid sequence is indicated after each corresponding strain’s name. The amino acid sequences of glutamine amidotransferase from six Vibrio phages were used as the outgroup. The tree was inferred and reconstructed using the maximum likelihood criterion, with bootstrap values (%)>50; these are indicated at the base of each node with a gray dot (expressed as a percentage from 1000 replications). Bar, 0.2 substitutions per nucleotide position.
Figure 5—figure supplement 3
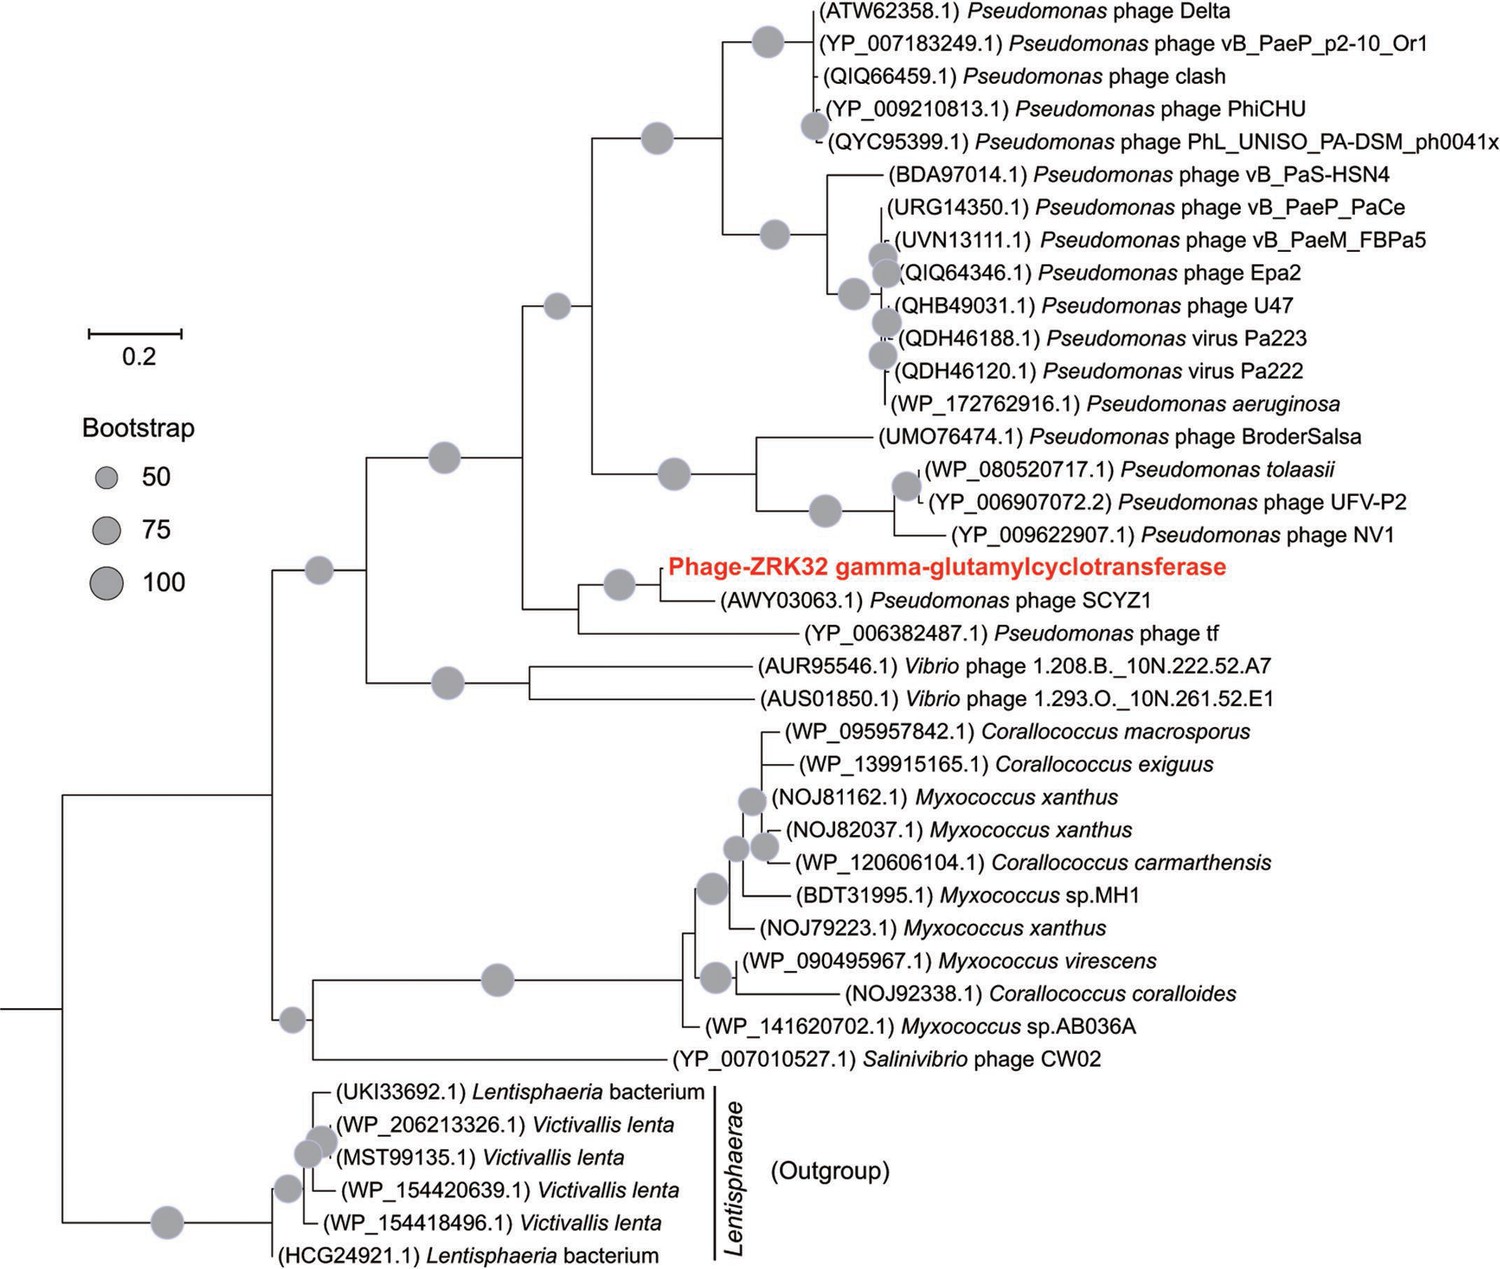
Phylogenetic analysis of Phage-ZRK32, some related phages, and bacterial hosts, based on the aligned amino acid sequences of gamma-glutamylcyclotransferase.
The NCBI accession number for each amino acid sequence is indicated after each corresponding strain’s name. The amino acid sequences of gamma-glutamylcyclotransferase from six Lentisphaerae strains were used as the outgroup. The tree was inferred and reconstructed using the maximum likelihood criterion, with bootstrap values (%)>50; these are indicated at the base of each node with a gray dot (expressed as a percentage from 1000 replications). Bar, 0.2 substitutions per nucleotide position.
Figure 5—figure supplement 4
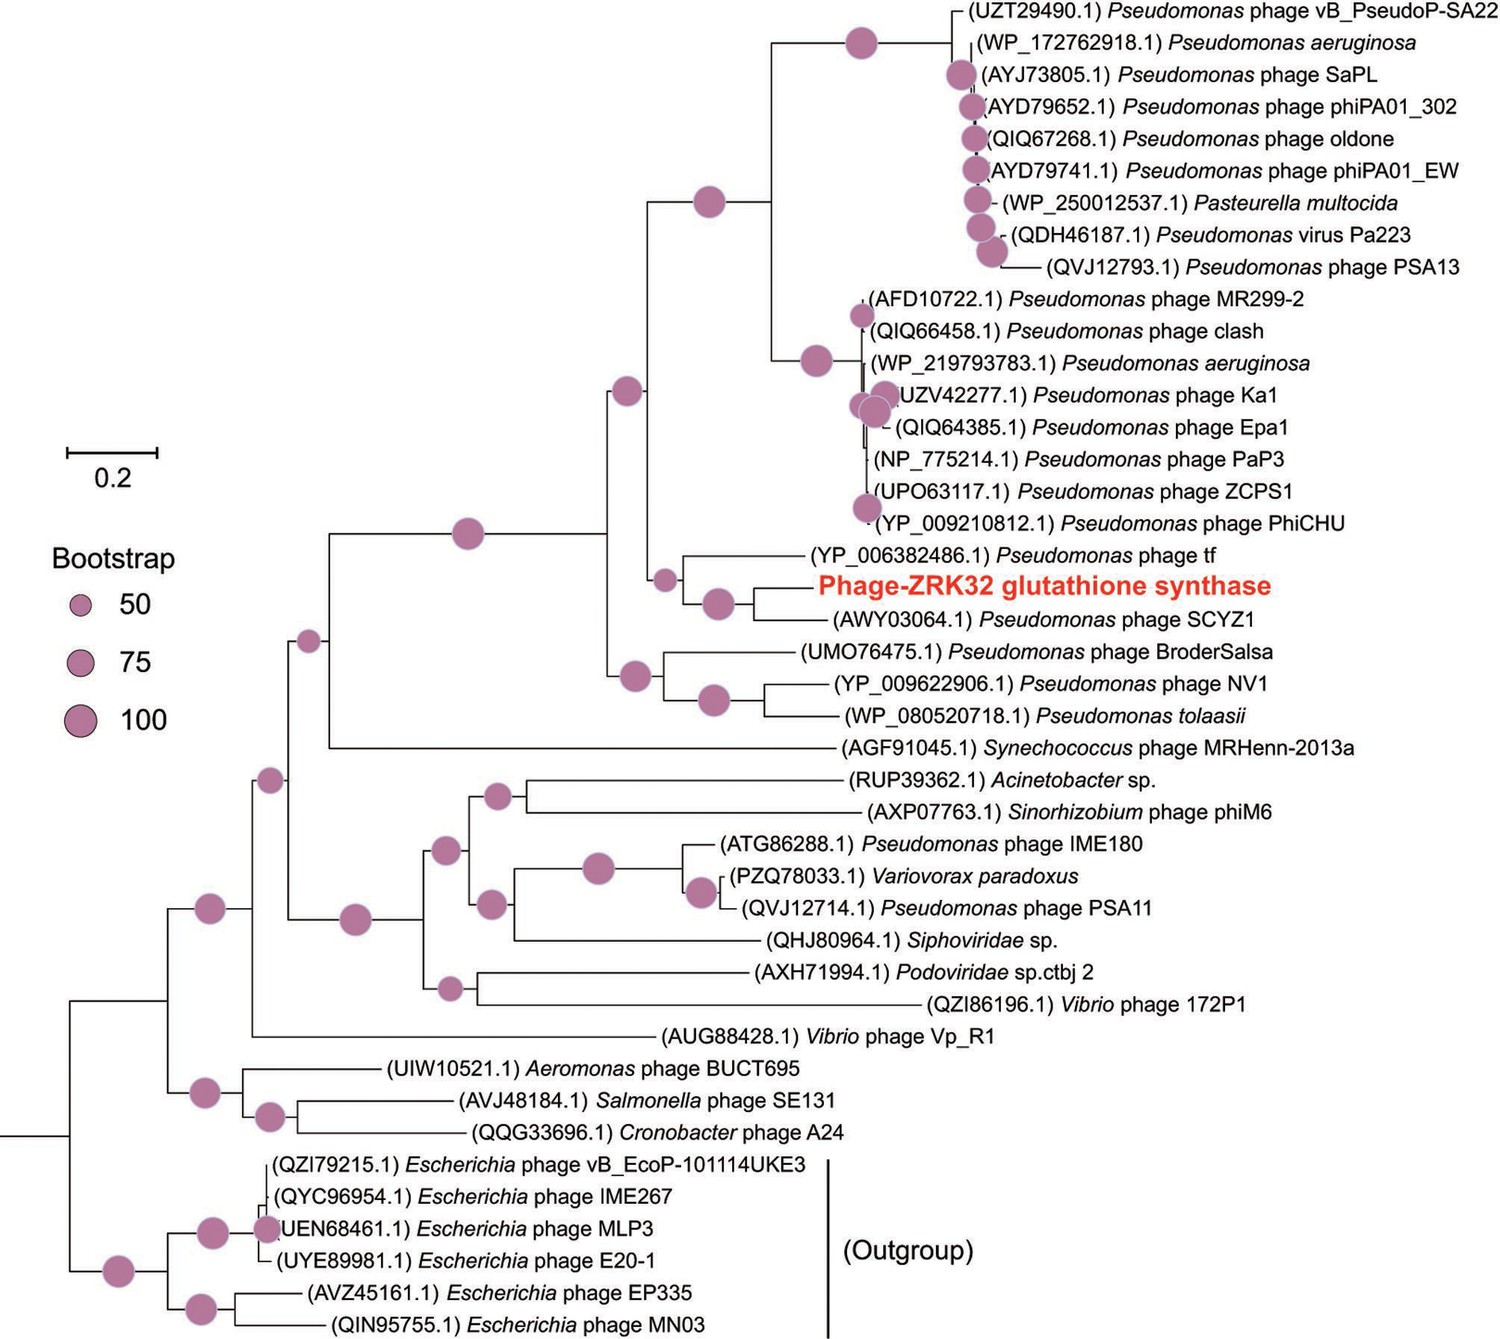
Phylogenetic analysis of Phage-ZRK32, some related phages, and bacterial hosts, based on the aligned amino acid sequences of glutathione synthase.
The NCBI accession number for each amino acid sequence is indicated after each corresponding strain’s name. The amino acid sequences of glutathione synthase from six Escherichia phages were used as the outgroup. The tree was inferred and reconstructed using the maximum likelihood criterion, with bootstrap values (%)>50; these are indicated at the base of each node with a gray dot (expressed as a percentage from 1000 replications). Bar, 0.2 substitutions per nucleotide position.
Author response image 1

Figure 2.
Growth assay and transcriptomic analysis of P. heterotrophicis ZRK32 strains cultivated in basal medium and rich medium.
Additional files
-
Supplementary file 1
Phenotypic and genotypic features of strain ZRK32 and the most closely related type strain P. corsica KS4T.
- https://cdn.elifesciences.org/articles/89874/elife-89874-supp1-v1.xlsx
-
Supplementary file 2
The sugar utilization of strain ZRK32. +, Positive result or growth; −, negative result or no growth.
- https://cdn.elifesciences.org/articles/89874/elife-89874-supp2-v1.xlsx
-
Supplementary file 3
Marker genes used in the phylogenetic analysis.
The DNGNGWU marker genes in phylosift refer to a suite of single-copy, protein-coding marker genes. All 37 DNGNGWU marker genes were concatenated to construct maximum likelihood phylogenetic tree.
- https://cdn.elifesciences.org/articles/89874/elife-89874-supp3-v1.xlsx
-
Supplementary file 4
Primers used for real-time quantitative reverse transcription PCR (qRT-PCR).
- https://cdn.elifesciences.org/articles/89874/elife-89874-supp4-v1.xlsx
-
MDAR checklist
- https://cdn.elifesciences.org/articles/89874/elife-89874-mdarchecklist1-v1.docx
Download links
A two-part list of links to download the article, or parts of the article, in various formats.
Downloads (link to download the article as PDF)
Open citations (links to open the citations from this article in various online reference manager services)
Cite this article (links to download the citations from this article in formats compatible with various reference manager tools)
Physiological and metabolic insights into the first cultured anaerobic representative of deep-sea Planctomycetes bacteria
eLife 12:RP89874.
https://doi.org/10.7554/eLife.89874.3


