Choline supplementation in early life improves and low levels of choline can impair outcomes in a mouse model of Alzheimer’s disease
- Center for Dementia Research, The Nathan Kline Institute for Psychiatric Research, United States
- Department of Neuroscience and Physiology, New York University Grossman School of Medicine, United States
- Departments of Child and Adolescent Psychiatry, New York University Grossman School of Medicine, United States
- Department of Psychiatry, New York University Grossman School of Medicine, United States
- NYU Neuroscience Institute, New York University Grossman School of Medicine, United States
Figures
Figure 1 with 1 supplement
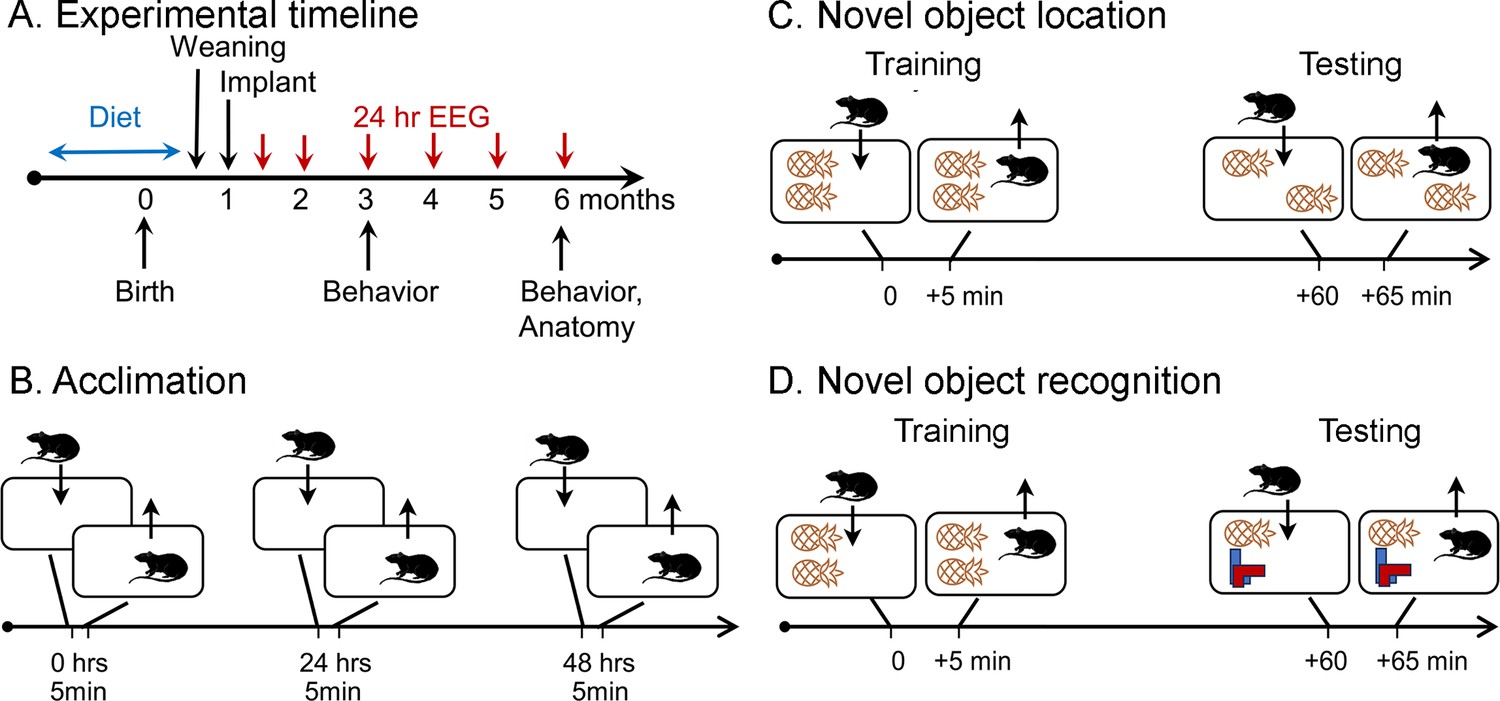
Schematic of the behavioral procedures for the novel object location (NOL) and novel object recognition (NOR) tasks.
(A) Experimental timeline. Dams were fed one of three diets for mating, gestation, and offspring that consumed the diet until weaning. At 1 month old, offspring were implanted with electrodes for EEG. Recordings for 24 hr started 1 week later (5 weeks old; 1.2 months old in the graphs). Additional recordings were made at 2, 3, 4, 5, and 6 months of age. At 3 and 6 months of age, behavior was tested, mice were perfused, brains were sectioned, and sections were processed with antibodies against NeuN and ∆FosB. (B) Prior to NOL or NOR, animals were acclimated to the testing arena. There were three acclimation sessions separated by 24 hr during which animals were allowed to freely explore for 5 min. (C) In the NOL task, animals were placed in a cage with two identical objects and allowed to freely explore for 5 min (Training). After 1 hr, they were brought back to the cage, where one object was displaced, and allowed to freely explore for 5 min (Testing). (D) In the NOR task. animals were placed in a cage with two identical objects and allowed to freely explore for 5 min (Training). After 1 hr, they were brought back to the cage, where one object was replaced, and allowed to freely explore for 5 min (Testing).
Figure 1—figure supplement 1
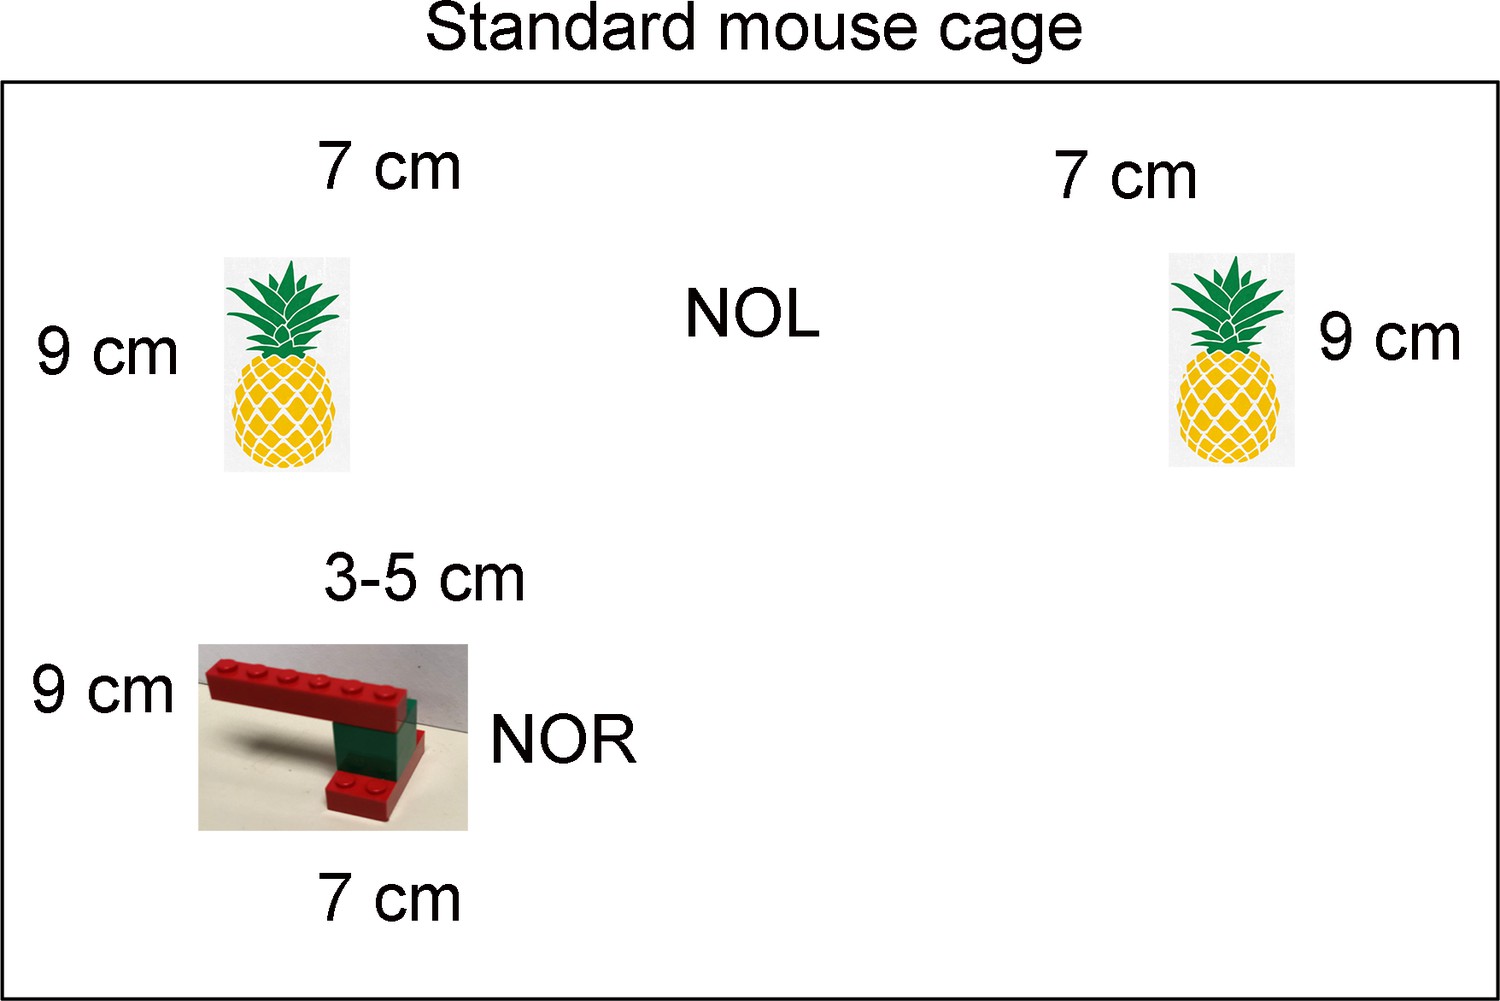
Details of behavioral tasks.
A standard mouse cage is diagrammed, with the locations of objects inside it. For novel object location (NOL), there were two pineapple-like objects and one was moved across the cage for the test session. For the novel object recognition (NOR) test session, one pineapple-like object was removed and an object made of LEGO was placed in the location where the original pineapple-like object had been.
Figure 2 with 2 supplements
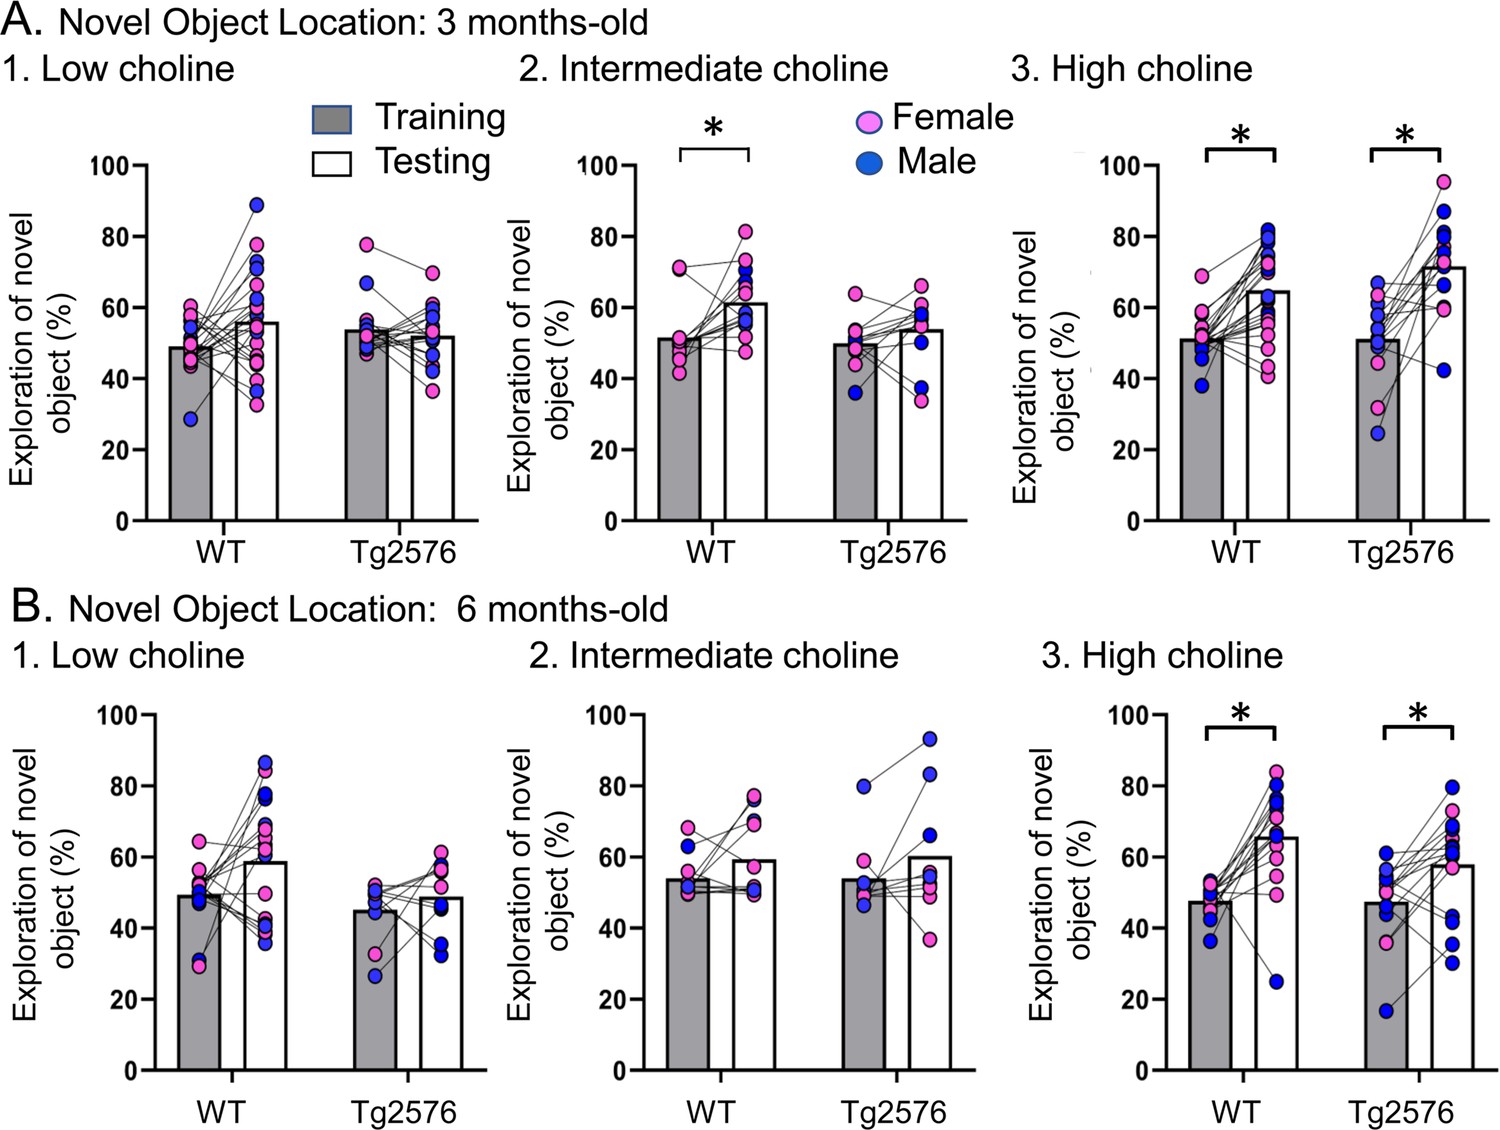
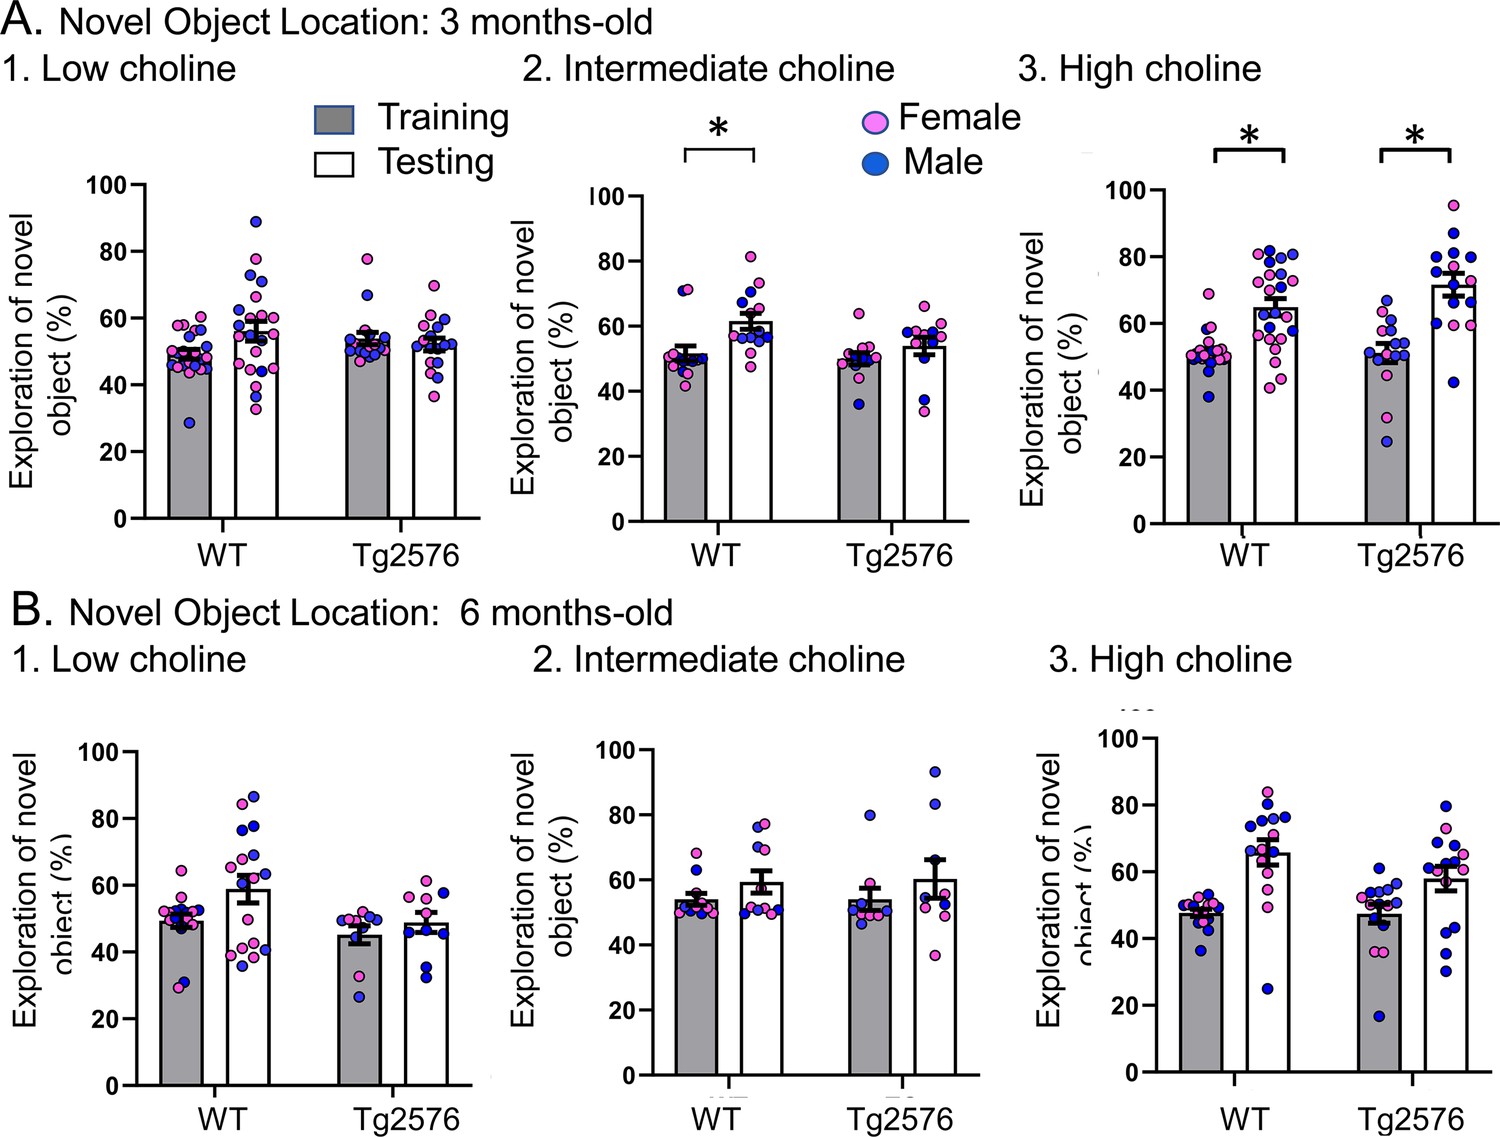
Choline enrichment reduced spatial memory deficits.
(A) Three months-old mice. For (A) and (B), breeders were fed the specified diet and offspring were tested. 1. Low choline diet. WT and Tg2576 offspring showed spatial memory deficits. 2. Intermediate diet. Tg2576 showed spatial memory deficits but not WT. 3. High choline diet. Spatial memory was improved. (B) Six months-old mice. 1. Low choline diet. WT and Tg2576 offspring showed spatial memory deficits. 2. Intermediate diet. WT and Tg2576 mice showed spatial memory deficits. 3. High choline diet. WT and Tg2576 mice had improved spatial memory.
Figure 2—figure supplement 1
The data shown in Figure 2 are plotted with means ± sem.
Figure 2—figure supplement 2
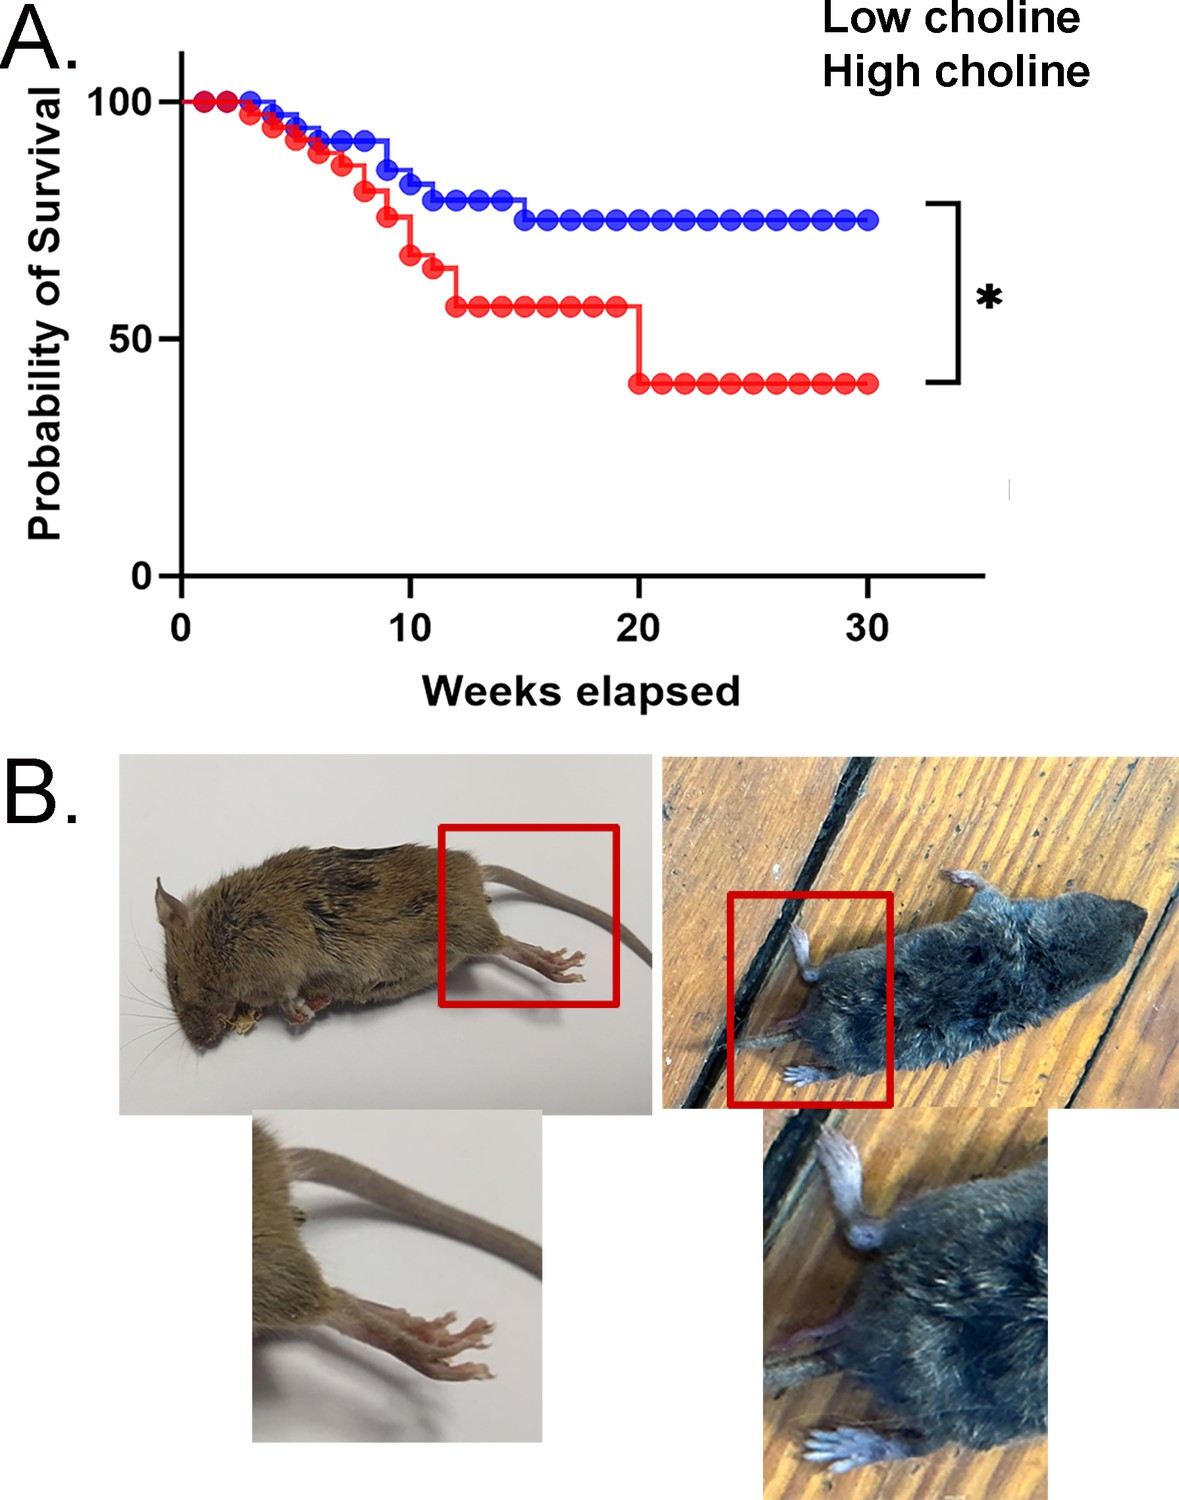
Mortality was high in mice treated with the low choline diet.
(A) Survival curves are shown for mice fed the low choline diet and mice fed the high choline diet. The mice fed the high choline diet had a significantly less severe survival curve. (B) Left: a photo of a mouse after sudden unexplained death. The mouse was found in a posture consistent with death during a convulsive seizure. The area surrounded by the red box is expanded below to show the outstretched hindlimb (red arrow), consistent with a convulsive seizure. Right: a photo of a mouse that did not die suddenly. The area surrounded by the box is expanded below to show that the hindlimb is not outstretched.
Figure 3
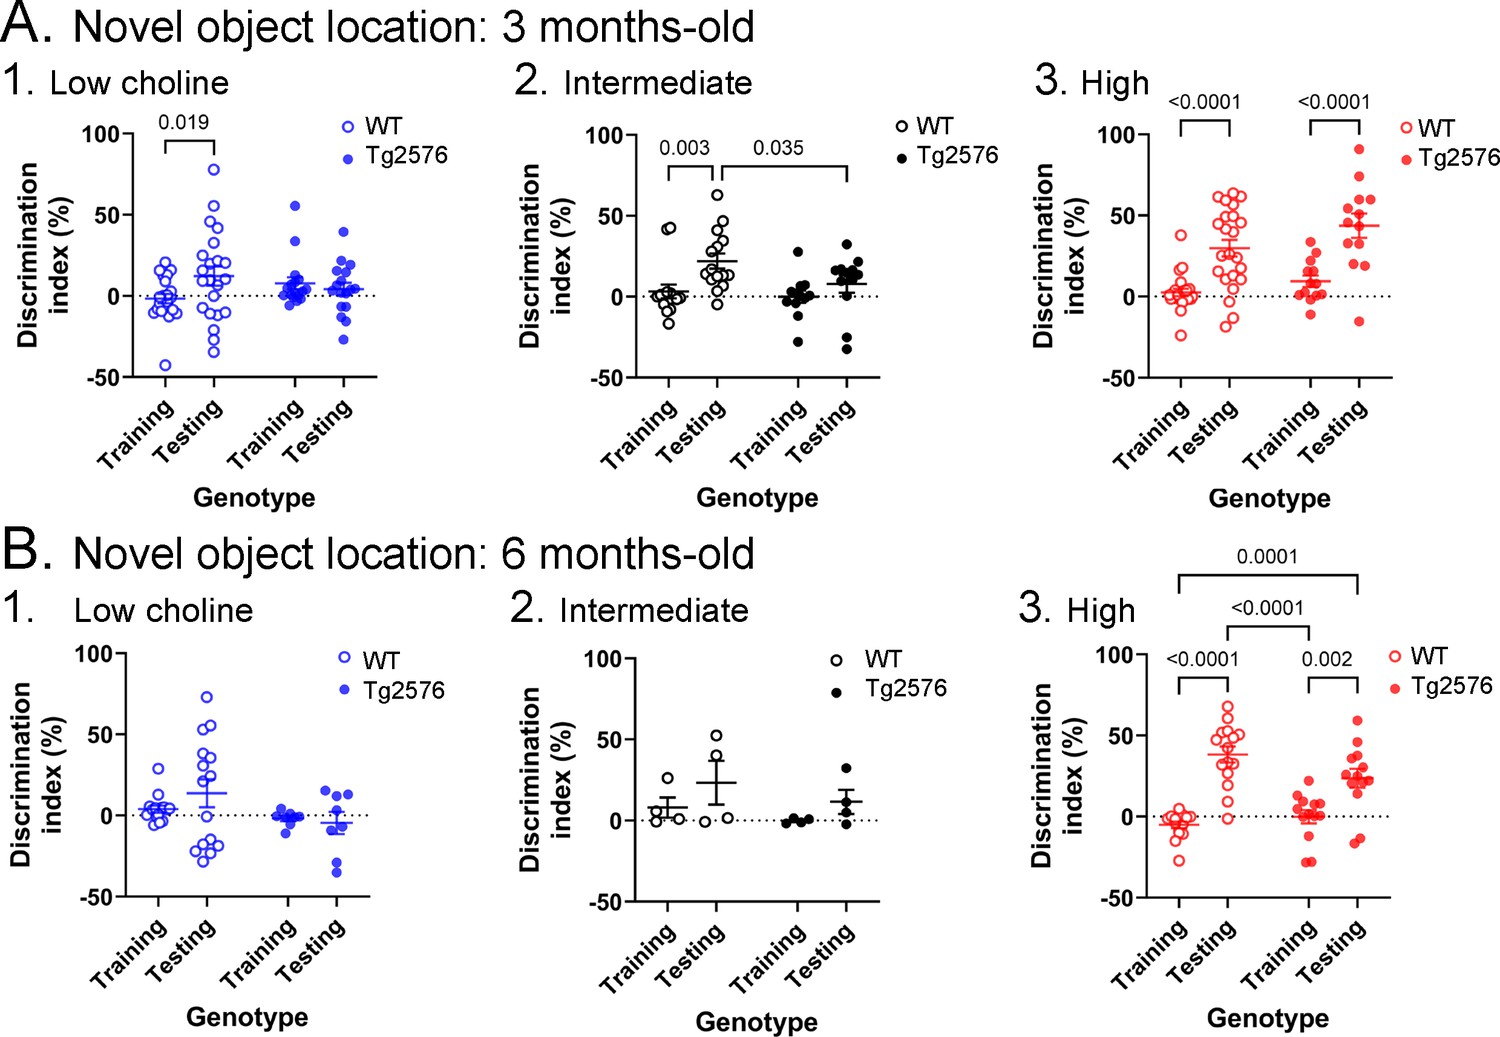
Novel object location results based on the discrimination index.
(A) Results are shown for 3 months-old WT and Tg2576 mice based on the discrimination index. 1. Mice fed the low choline diet showed object location memory only in WT. 2. Mice fed the intermediate diet showed object location memory only in WT. 3. Mice fed the high choline diet showed memory both for WT and Tg2576 mice. Therefore, the high choline diet improved memory in Tg2576 mice. (B) The results for 6 months-old mice are shown. 1–2. There was no significant diference between training and testing demonstrated by mice that were fed the low or intermediate choline diet. 3. Mice fed a diet enriched in choline showed significant differences between training and testing whether they were WT or Tg2576 mice. Therefore, choline enrichment improved task performance in all mice.
Figure 4 with 1 supplement
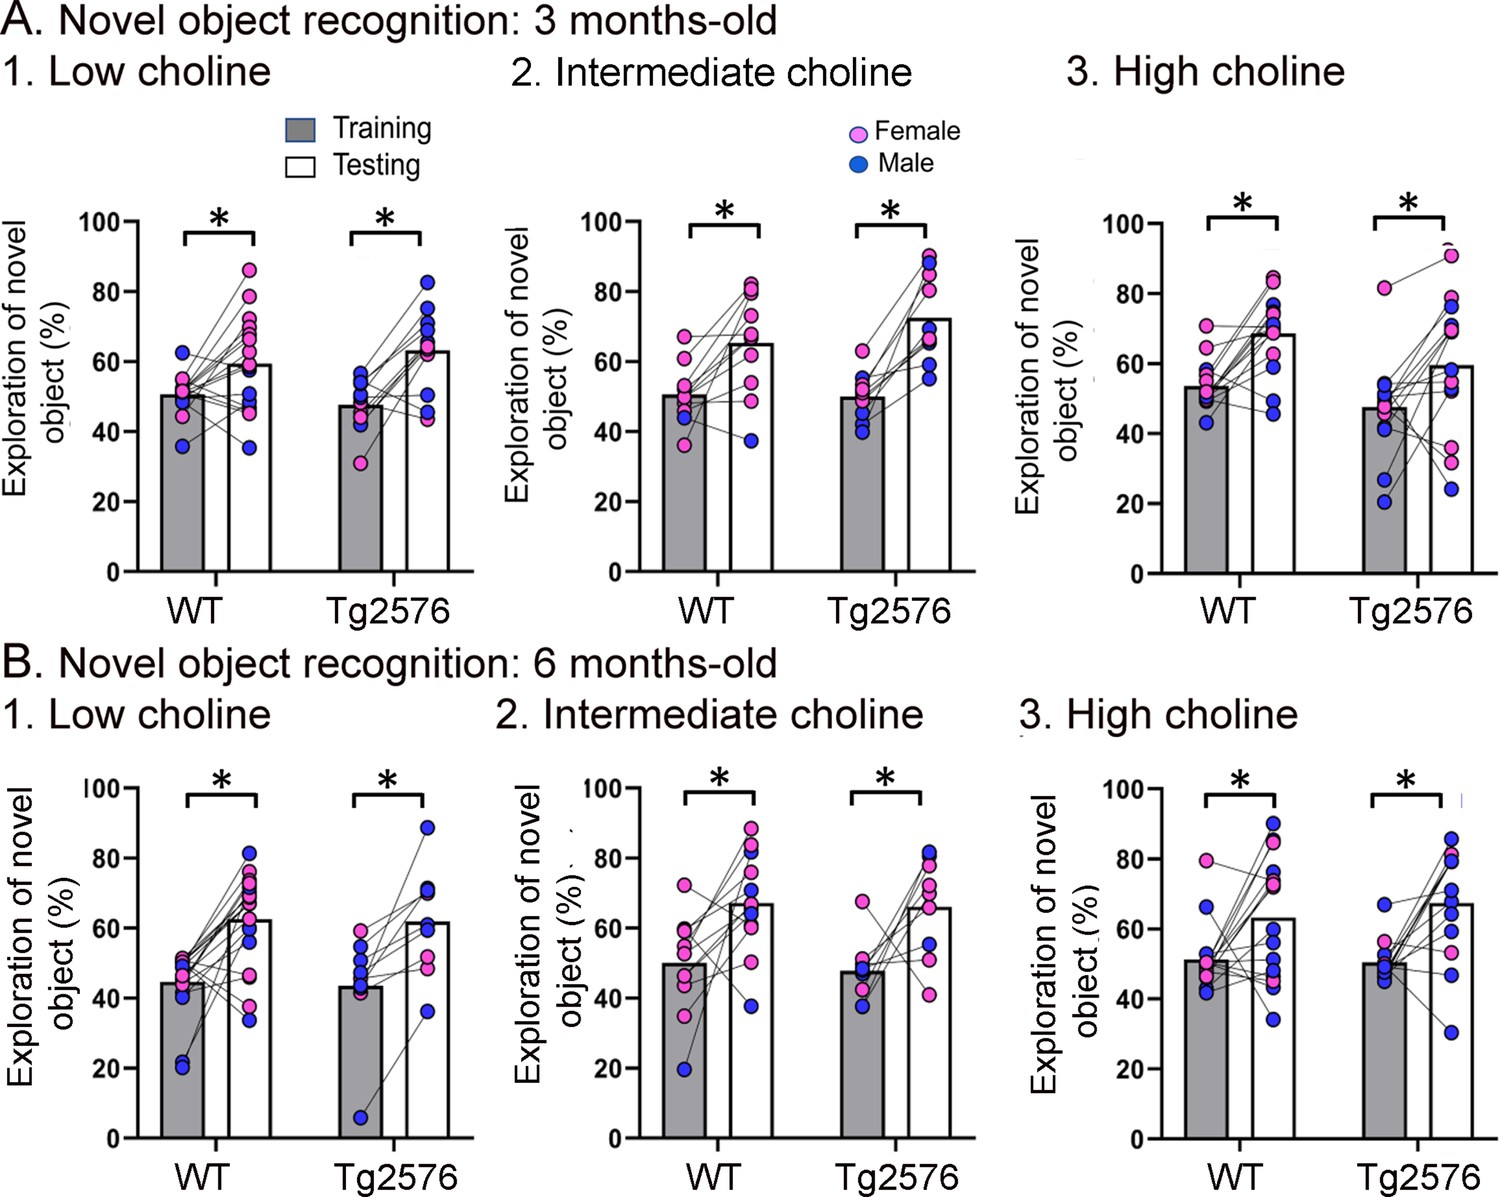
WT and Tg2576 mice showed object recognition memory regardless of diet.
(A) Three months-old mice. 1–3. WT and Tg2576 mice performed the novel object recognition (NOR) task. (B) Six months-old mice. 1–3. WT and Tg2576 mice performed the NOR task.
Figure 4—figure supplement 1
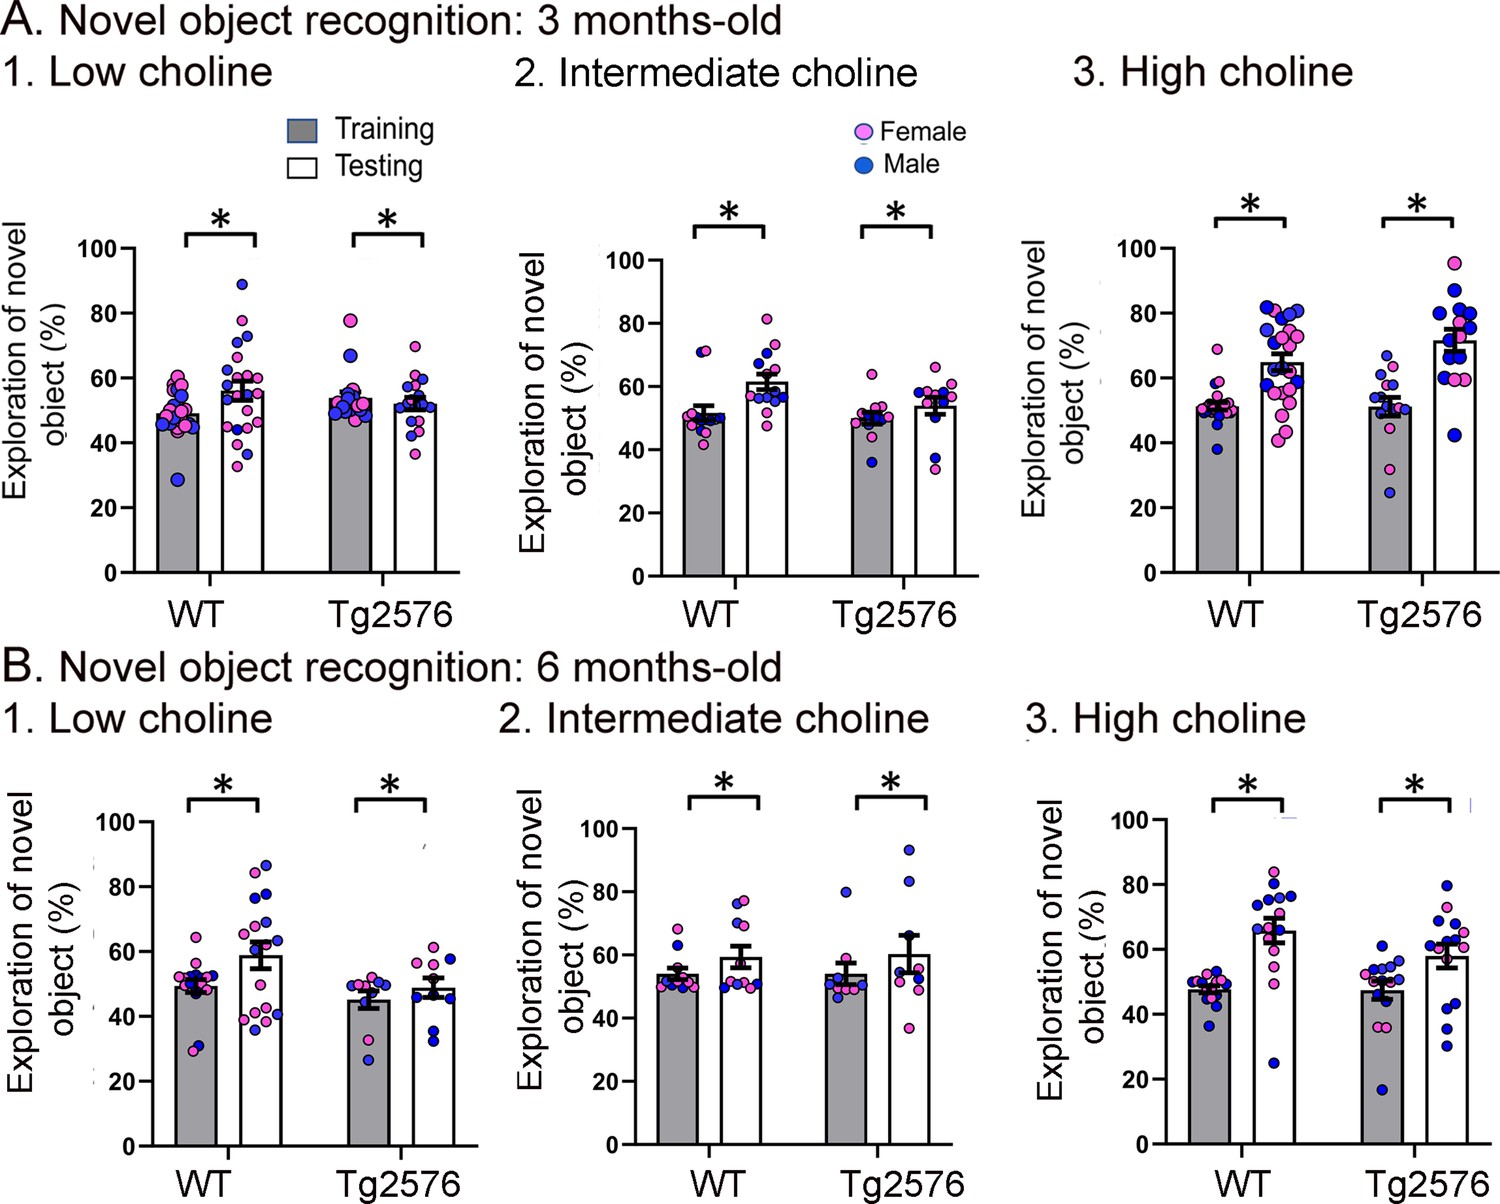
The data shown in Figure 3 are plotted with means ± sem.
Figure 5
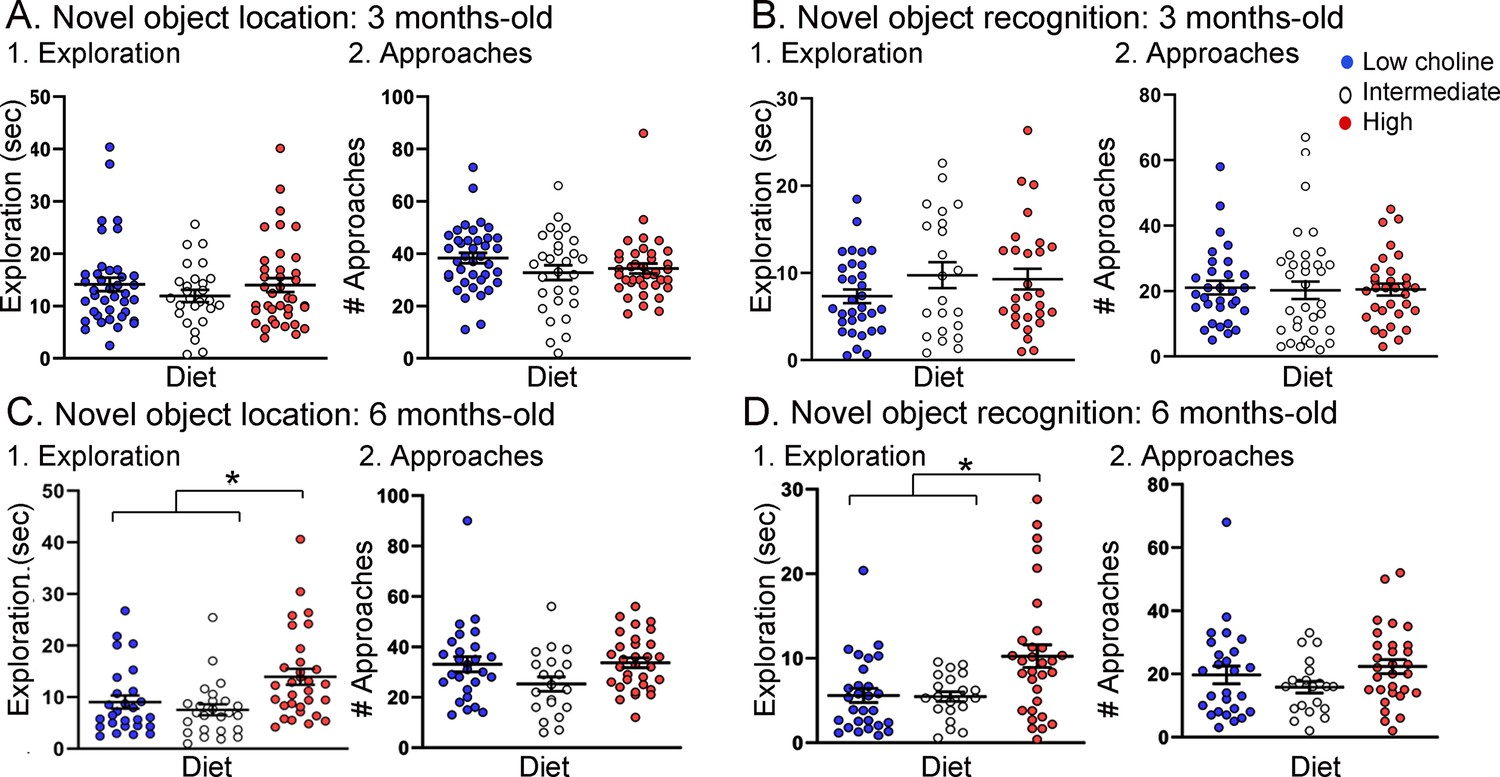
Tg2576 mice treated with the high choline diet spent more time with the objects at each approach.
(A, B) Novel object location (NOL). There was no effect of diet on time exploring or approaches to the novel object in the NOL task at 3 months of age (A) but there were significant differences at 6 months of age (B). Mice exposed to the high choline diet spent more time exploring than mice that had been fed the low choline or the intermediate diet. (C, D) Novel object recognition (NOR). There was no effect of diet on time exploring or approaches to the novel object in the NOR task at 3 months of age (C) but there were significant differences at 6 months of age (D). Mice that had been fed the high choline diet spent more time exploring than mice that had been fed the low choline or the intermediate diet.
Figure 6
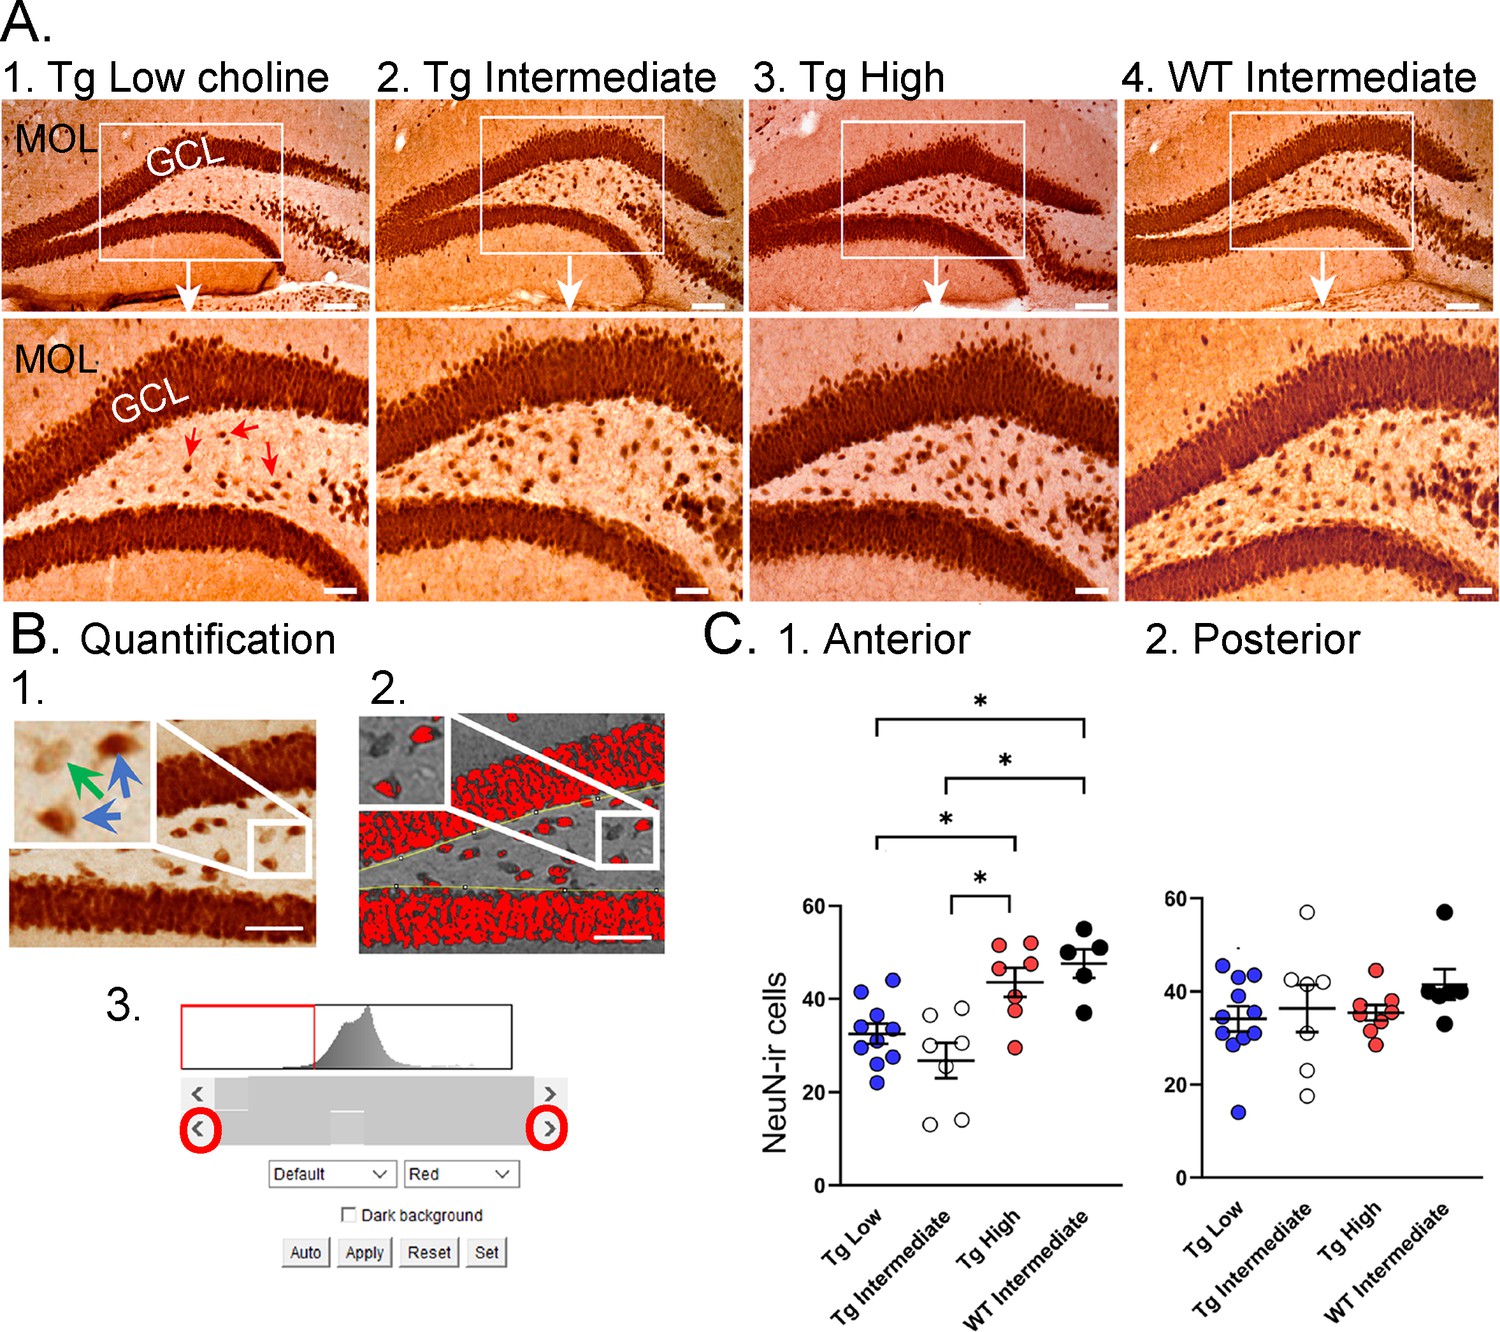
Choline supplementation improved NeuN immunoreactivity (ir) in hilar cells in Tg2576 animals.
(A) Representative images of NeuN-ir staining in the anterior dentate gyrus (DG). 1. A section from a Tg2576 mouse fed the low choline diet. The area surrounded by a box is expanded below. Red arrows point to NeuN-ir hilar cells. Mol = molecular layer; GCL = granule cell layer. Calibration for the top row, 100 µm; for the bottom row, 50 µm. 2. A section from a Tg2576 mouse fed the intermediate diet. Same calibrations as for 1. 3. A section from a Tg2576 mouse fed the high choline diet. Same calibrations as for 1. 4. A section from a WT mouse fed the intermediate diet. Same calibrations as for 1. (B) Quantification methods. Representative images demonstrate the thresholding criteria used to quantify NeuN-ir. 1. A NeuN-stained section. The area surrounded by the white box is expanded in the inset (arrow) to show three hilar cells. The two NeuN-ir cells above threshold are marked by blue arrows. The one NeuN-ir cell below threshold is marked by a green arrow. 2. After converting the image to grayscale, the cells above threshold were designated as red. The inset shows that the two cells that were marked by blue arrows are red while the cell below threshold is not. 3. An example of the threshold menu from ImageJ showing the way the threshold was set. Sliders (red circles) were used to move the threshold to the left or right of the histogram of intensity values. The final position of the slider (red arrow) was positioned at the onset of the steep rise of the histogram. (C) NeuN-ir in Tg2576 and WT mice. Tg2576 mice had either the low, intermediate, or high choline diet in early life. WT mice were fed the standard diet (intermediate choline). 1. Tg2576 mice treated with the high choline diet had significantly more hilar NeuN-ir cells in the anterior DG compared to Tg2576 mice that had been fed the low choline or intermediate diet. The values for Tg2576 mice that received the high choline diet were not significantly different from WT mice, suggesting that the high choline diet restored NeuN-ir. 2. There was no effect of diet or genotype in the posterior DG.
Figure 7
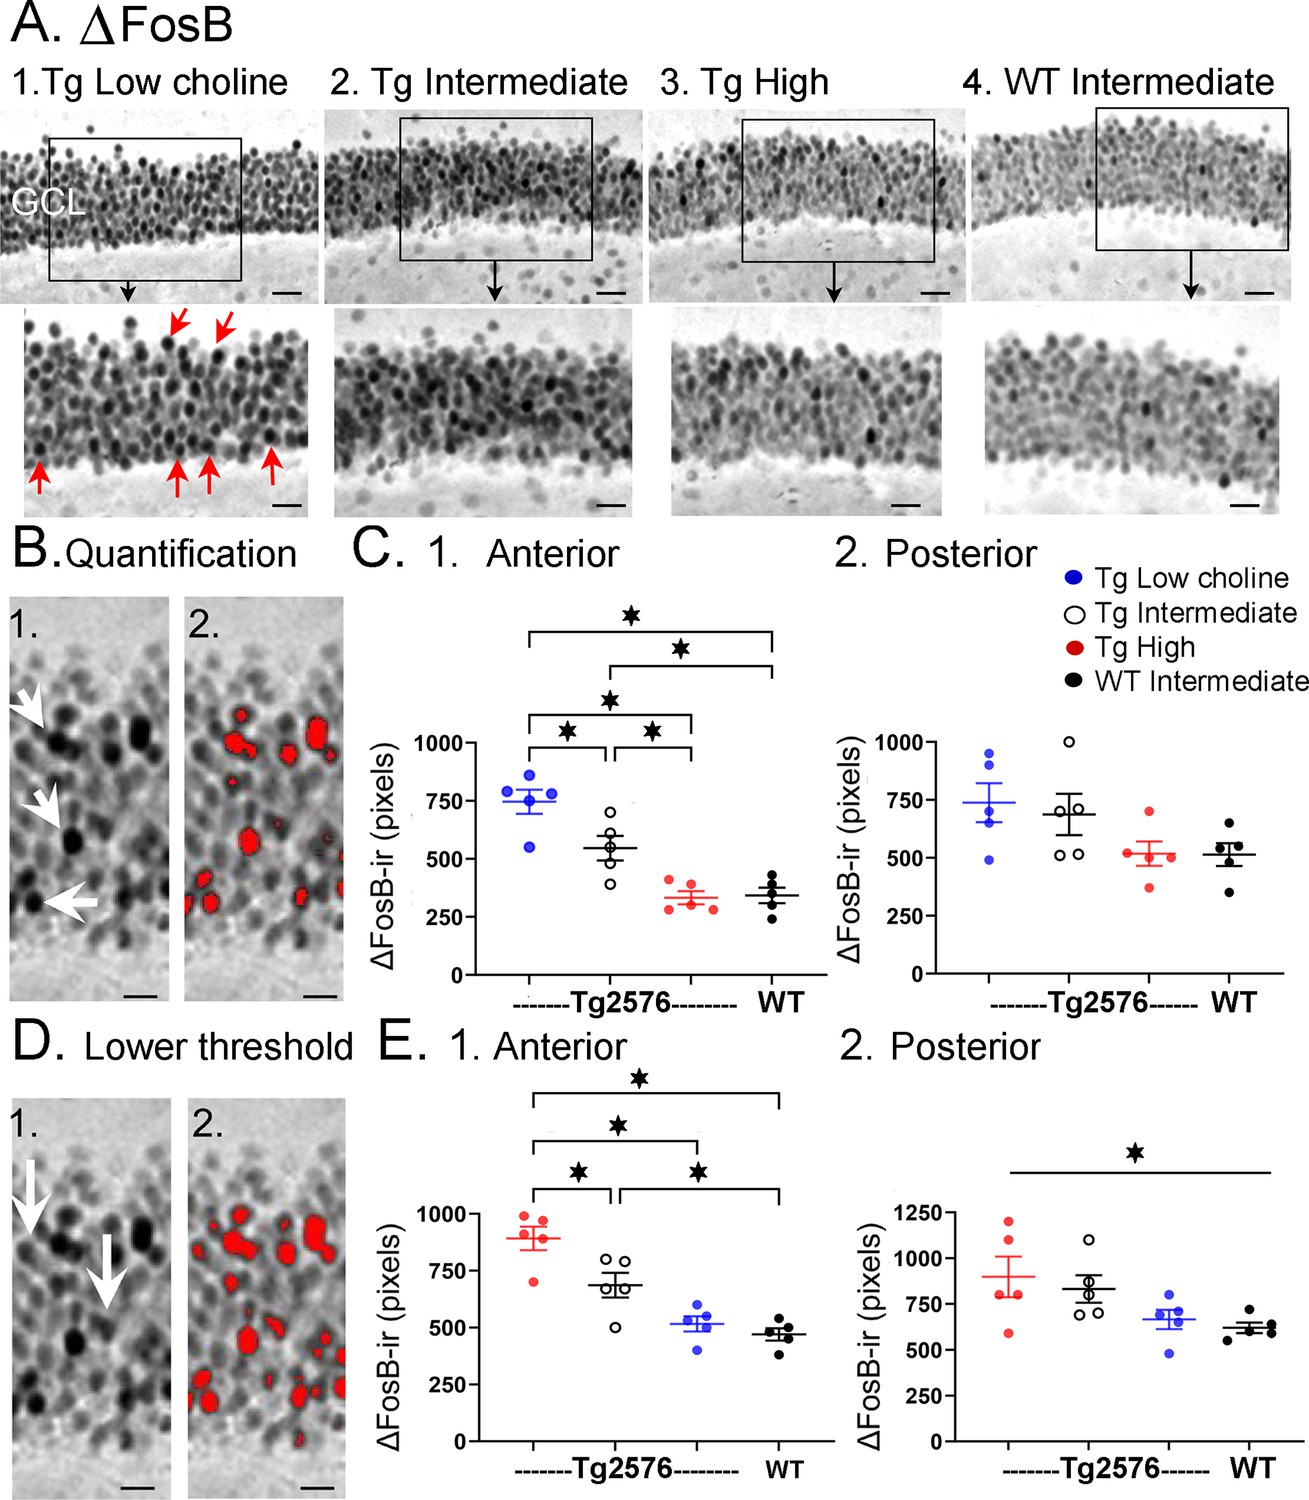
Choline supplementation reduced ∆FosB expression in dorsal granule cells (GCs) of Tg2576 mice.
(A) Representative images of ∆FosB staining in the GCL. A section from a low choline-treated Tg2576 mouse shows robust ∆FosB-ir in the GCL. The area outlined by the box is expanded below. Red arrows point to ∆FosB-labeled cells. GCL = granule cell layer. Calibration for the top row, 100 µm; for the bottom row, 50 µm.2–3. Sections from intermediate (2) and high choline (3) -treated Tg2576 mice. Same calibrations as 1. 4, A section from a WT mouse treated with the intermediate diet. Same calibrations as 1. (B) Quantification methods. Representative images demonstrating the thresholding criteria established to quantify ∆FosB. 1. A ∆FosB-stained section shows strongly-stained cells (white arrows). 2. A strict thresholding criterion was used to make only the darkest stained cells red. (C) Use of the strict threshold to quantify ∆FosB-ir. 1. Anterior dentate gyrus (DG). Tg2576 mice treated with the choline-supplemented diet had significantly less ∆FosB-ir compared to the Tg2576 mice fed the low or intermediate diets. Tg2576 mice fed the high choline diet were not significantly different from WT mice, suggesting a rescue of ∆FosB-ir. 2. There were no significant differences in ∆FosB-ir in posterior sections. (D) Methods are shown using a threshold that was less strict. Some of the stained cells that were included are not as dark as those used for the strict threshold (white arrows). 2. All cells above the more permissive threshold are shown in red. (E) Use of the less strict threshold to quantify ∆FosB-ir. 1. Anterior DG. Tg2576 mice that were fed the high choline diet had less ΔFosB-ir pixels than the mice that were fed the other diets. There were no differences from WT mice, suggesting restoration of ∆FosB-ir by choline enrichment in early life. 2. Posterior DG. There were no significant differences between Tg2576 mice fed the three diets or WT mice.
Figure 8 with 2 supplements
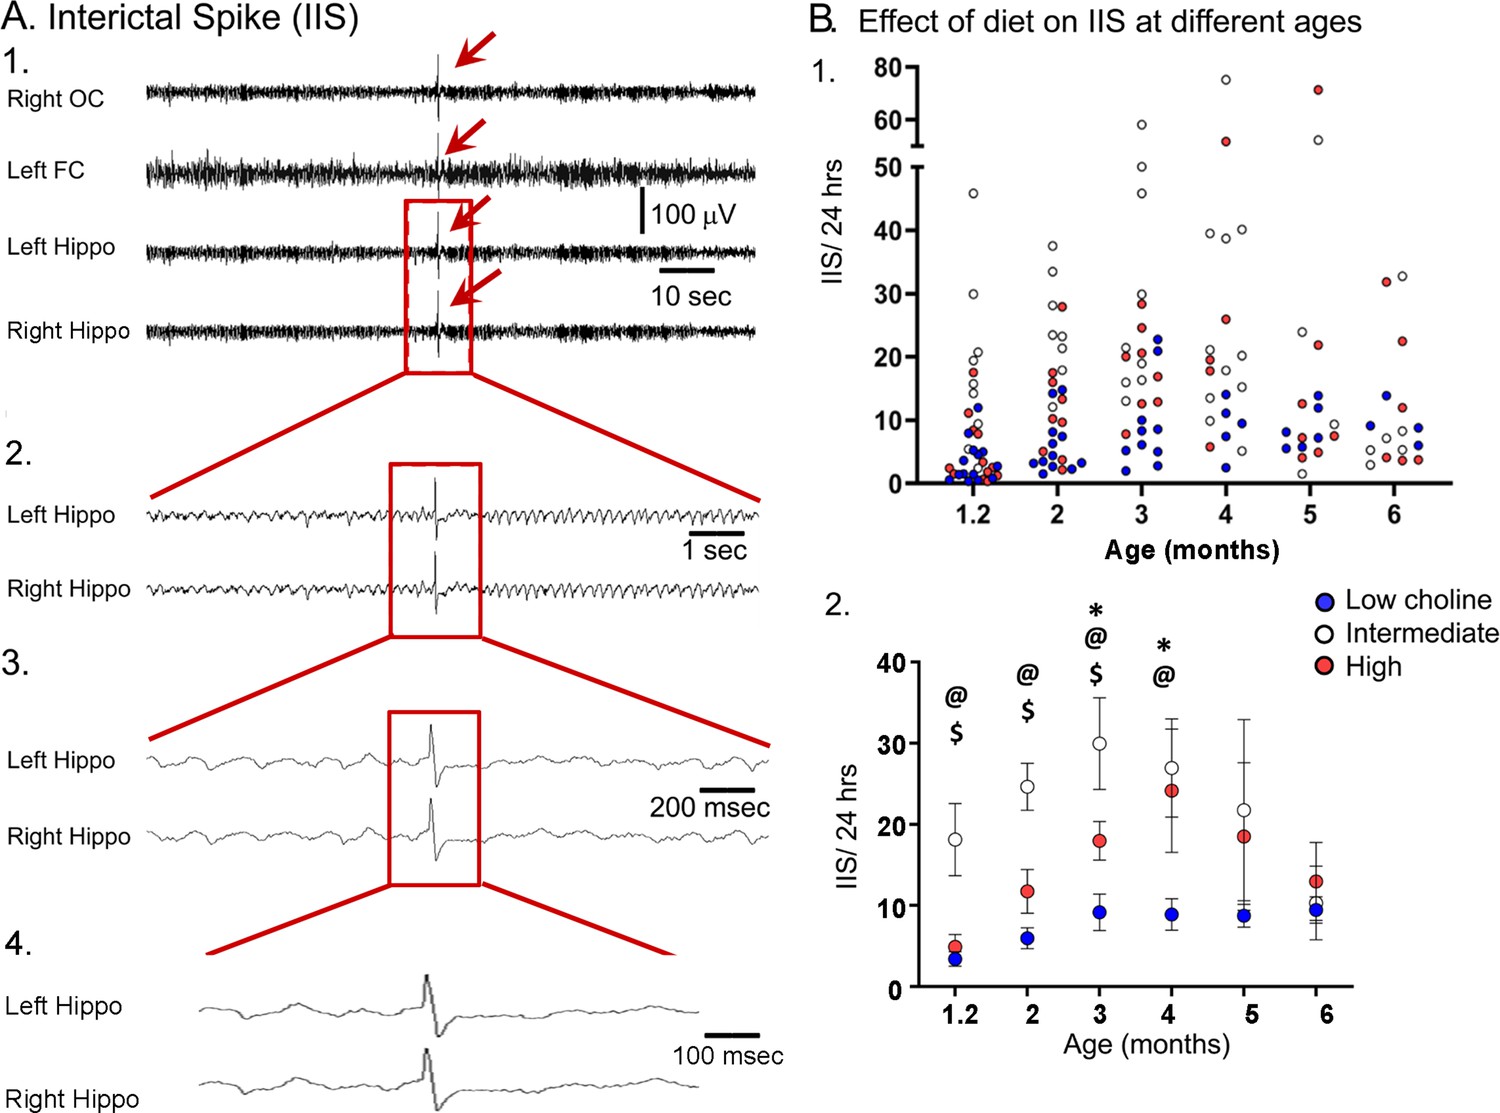
The high choline diet reduced interictal spikes (IIS) frequency in Tg2576 animals.
(A) 1. Representative example of an IIS (red arrow). IIS were defined as occurring in all four channels (generalized) to distinguish them from focal spikes that can often be artifact. 2–4. The IIS shown in A1 is expanded. (B) 1. Scatter plot of IIS frequency at each age of recording. 2. Means and sem are plotted. The high choline diet group had fewer IIS than the intermediate diet group at ages 1–3 months ($, p<0.05) and the low choline group had less IIS than the intermediate diet at ages 1–4 months (@, p<0.05). The high and low choline diet groups were significantly different at ages 3 and 4 months (*, p<0.05).
Figure 8—figure supplement 1
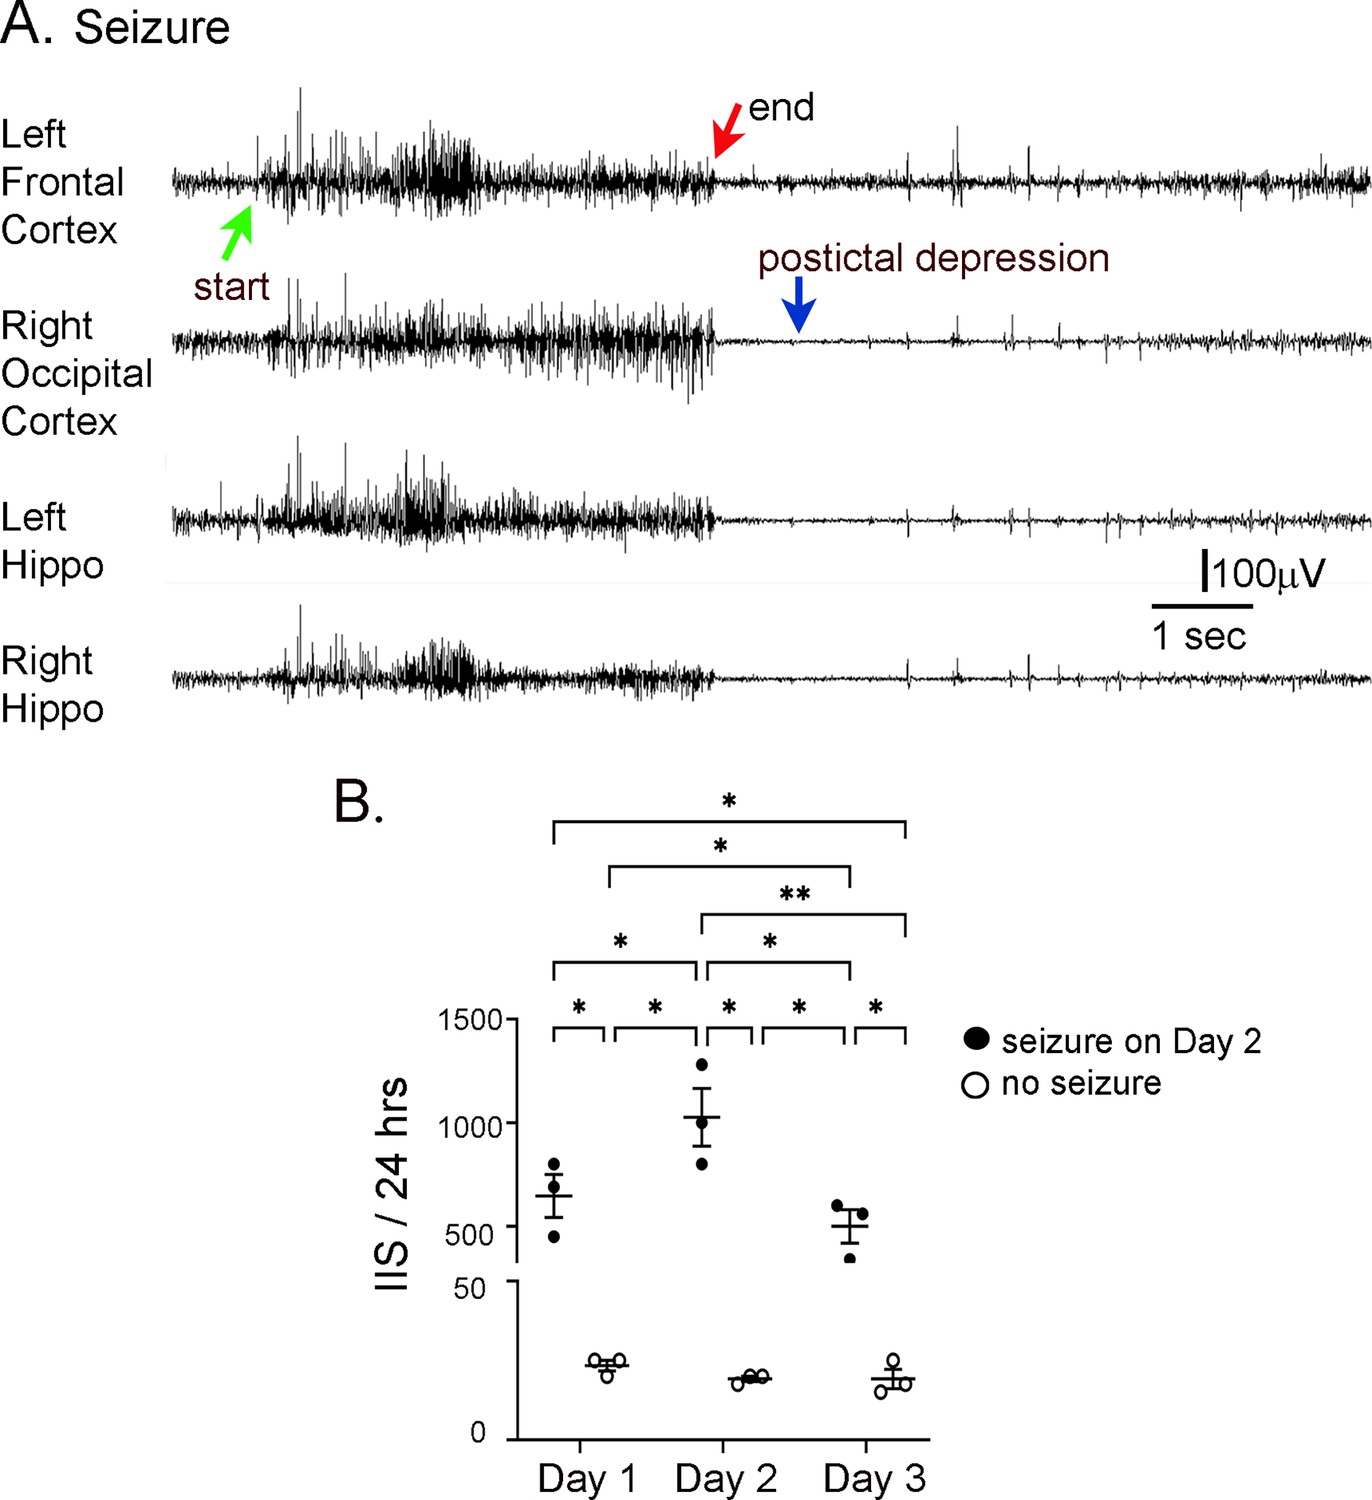
Interictal spike (IIS) frequency before and after seizures.
(A) Representative EEG traces recorded from electrodes implanted in the skull over the left frontal cortex, right occipital cortex, left hippocampus (Hippo), and right hippocampus during a spontaneous seizure in a 5 months-old Tg2576 mouse. Arrows point to the start (green arrow) and end of the seizure (red arrow), and postictal depression (blue arrow). (B) IIS frequency was quantified from continuous video-EEG for mice that had a spontaneous seizure during the recording period and mice that did not. IIS frequency is plotted for three consecutive days, starting with the day before the seizure (designated as day 1), and ending with the day after the seizure (day 3). A two-way RMANOVA was conducted with the day and group (mice with or without a seizure) as main factors. There was a significant effect of day (F(2,4) = 46.95, p=0.002) and group (seizure vs. no seizure; F(1,2) = 46.01, p=0.021) and an interaction of factors (F(2,4) = 46.68, p=0.002).Tukey–Kramer post hoc tests showed that mice with a seizure had significantly greater IIS frequencies than mice without a seizure for every day (day 1, p=0.0005; day 2, p=0.0001; day 3, p=0.001). For mice with a seizure, IIS frequency was higher on the day of the seizure than the day before (p=0.037) or after (p=0.010). For mice without a seizure, there were no significant differences in IIS frequency for day 1, 2, or 3. These data are similar to prior work showing that from one day to the next mice without seizures have similar IIS frequencies (Kam et al., 2016).
Figure 8—figure supplement 2
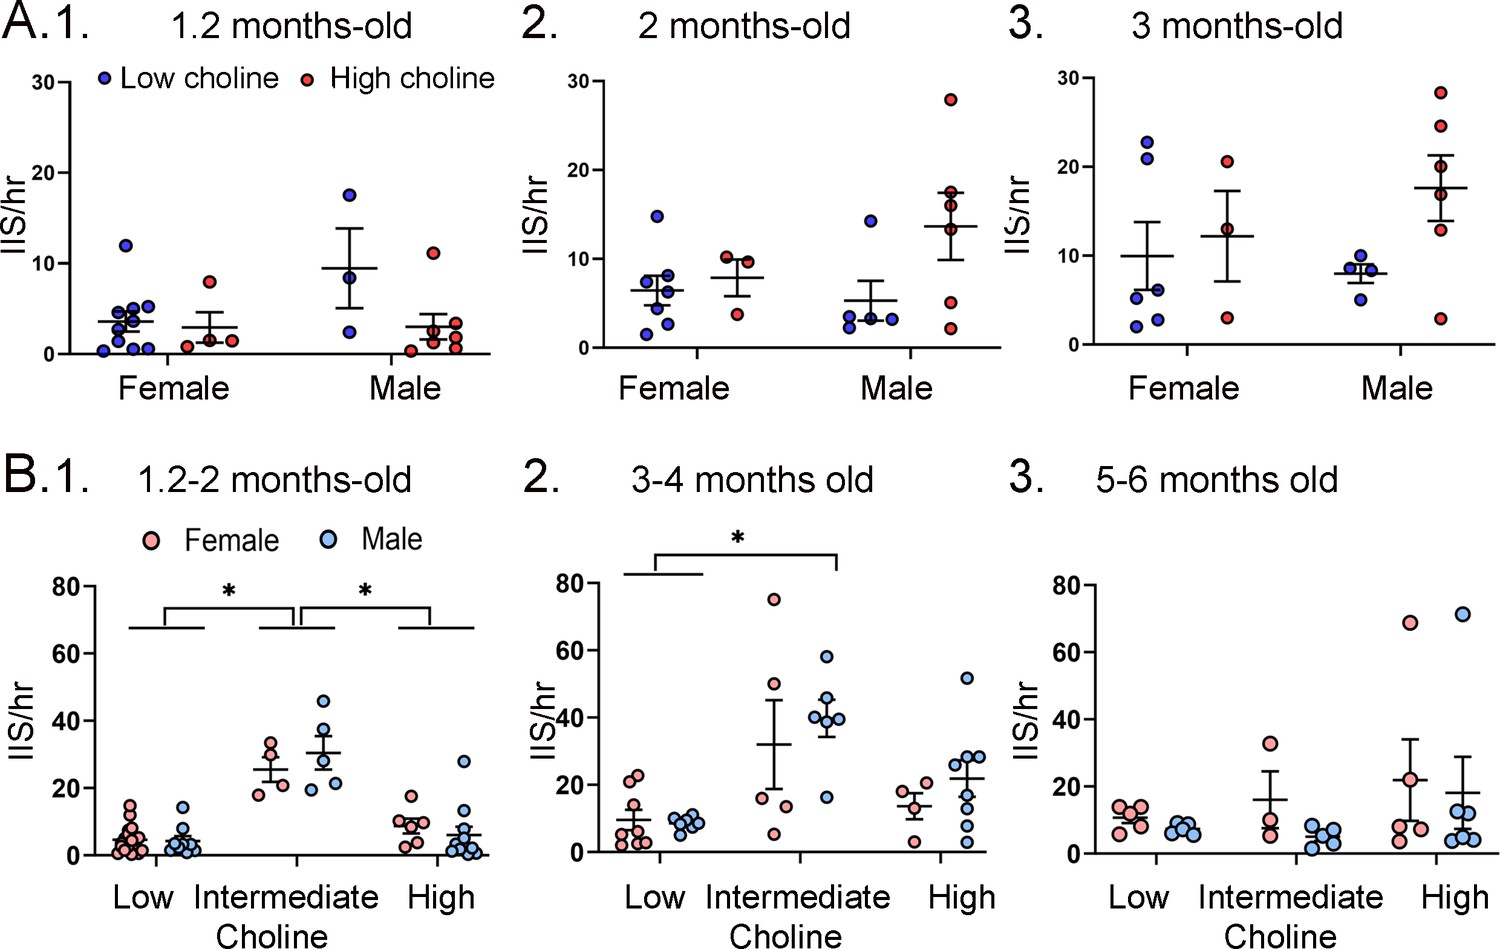
Interictal spike (IIS) frequency was similar for each sex.
(A) IIS frequency was compared for females and males at 1.2 months (1), 2 months (2), and 3 months (3). Two-way ANOVA was used to analyze the effects of sex and diet. Female and male Tg2576 mice were not significantly different. (B) Mice were pooled at 1.2 and 2 months (1), 3 and 4 months (2), and 5 and 6 months (3). Two-way ANOVA analyzed the effects of sex and diet. There were significant effects of diet for (1) and (2) but not (3). There were no effects of sex at any age. 1. There were significant effects of diet (F(2,47) = 46.21, p<0.0001) but not sex (F(1,47) = 0.11, p=0.746). Female and male mice fed the low choline diet or high choline diet were significantly different from female and male mice fed the intermediate diet (all p<0.05, asterisk). 2. There were significant effects of diet (F(2,32) = 10.82, p=0.0003) but not sex (F(1,32) = 1.05, p=0.313). Both female and male mice of the low choline group were significantly different from male mice fed the intermediate diet (both p<0.05, asterisk) but no other pairwise comparisons were significant. 3. There were no significant differences (diet, F(2,23)=1.21, p=0.317); sex, (F(1,23)=0.84, p=0.368).
Figure 9
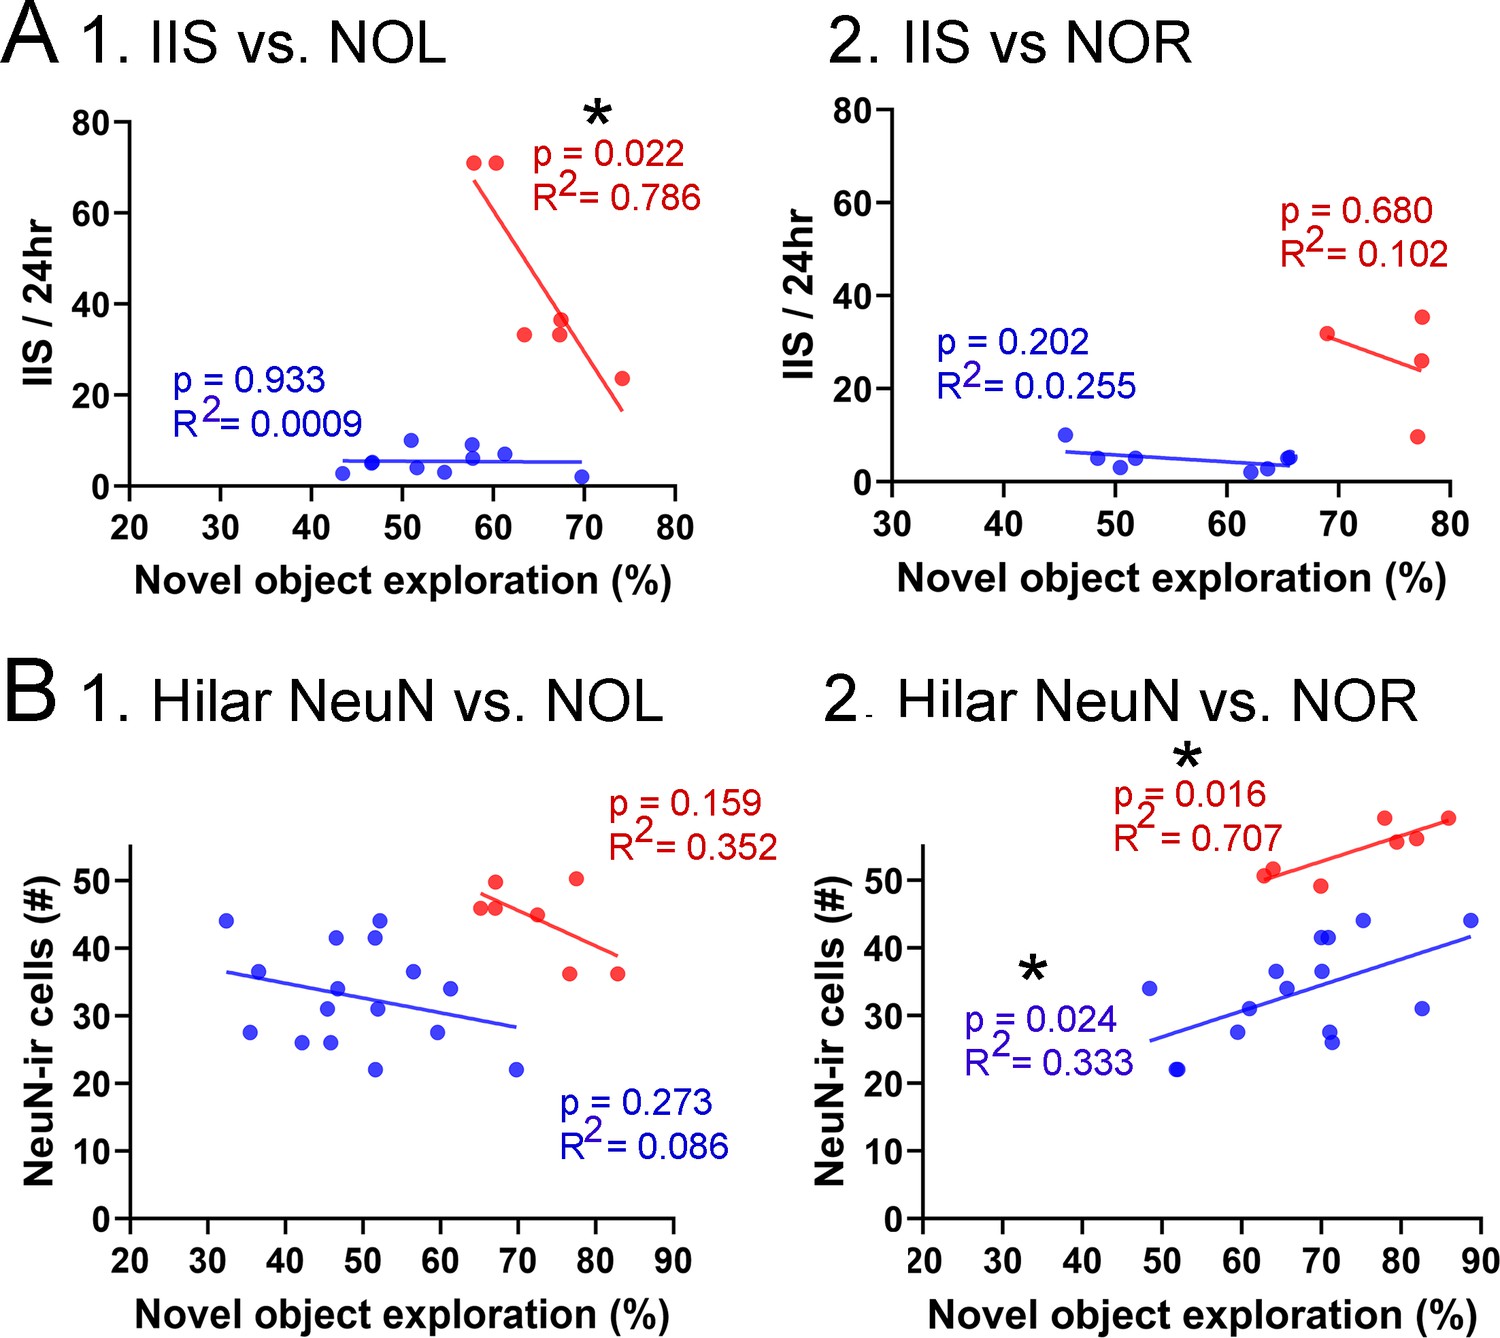
Correlations between interictal spikes (IIS), behavior, and hilar NeuN-ir.
(A) IIS frequency over 24 hr is plotted against the preference for the novel object in the test phase of novel object location (NOL). A greater preference is reflected by a greater percentage of time exploring the novel object. 1. The mice fed the high choline diet (red) showed greater preference for the novel object when IIS were low. These data suggest IIS impaired object location memory in the high choline-treated mice. The low choline-treated mice had very weak preference and very few IIS, potentially explaining the lack of correlation in these mice. 2. There were no significant correlations for IIS and novel object recognition (NOR). However, there were only four mice for the high choline group, which is a limitation. (B) IIS frequency over 24 hr is plotted against the number of dorsal hilar cells expressing NeuN. The dorsal hilus was used because there was no effect of diet on the posterior hilus. 1. Hilar NeuN-ir is plotted against the preference for the novel object in the test phase of NOL. There were no significant correlations. 2. Hilar NeuN-ir was greater for mice that had better performance in NOR, both for the low choline (blue) and high choline (red) groups. These data support the idea that hilar cells contribute to object recognition (Kesner et al., 2015; Botterill et al., 2021; GoodSmith et al., 2022).
Tables
Key resources table
| Reagent type (species) or resource | Designation | Source or reference | Identifiers | Additional information |
|---|---|---|---|---|
| Antibody | Anti-NeuN (mouse monoclonal) | Cat# MAB377; Millipore | RRID:AB_2313673 | 1:5000 |
| Antibody | Anti-ΔFosB (rabbit monoclonal; D3S8R) | Cat# 14695, Cell Signaling | RRID:AB_2798577 | 1:1000 |
| Antibody | Biotinylated horse anti-mouse IgG antibody | Cat# BP-2000; Vector Laboratories | RRID:AB_2798577 | 1:500 |
| Antibody | Biotinylated goat anti-rabbit IgG antibody | Cat# BA-1000; Vector Laboratories | RRID:AB_2313606 | 1:500 |
| Chemical compound, drug | Triton-X 100 | Cat# X100; Sigma-Aldrich | 0.25% | |
| Chemical compound, drug | Paraformaldehyde (PFA) | Cat# 19210; Electron Microscopy Sciences | 4% | |
| Chemical compound, drug | Normal goat serum | Cat# S-1000; Vector Laboratories | 5% | |
| Chemical compound, drug | Normal horse serum | Cat# S-2000; Vector Laboratories | 5% | |
| Chemical compound, drug | TRIS hydrochloride | Cat# T3253; Sigma-Aldrich | 97 g/8 L | |
| Chemical compound, drug | Tris base (TRIZMA base) | Cat# T1503; Sigma-Aldrich | 22 g/8 L | |
| Chemical compound, drug | H2O2; hydrogen peroxide | Cat# 95321; Sigma-Aldrich | 1% w/v | |
| Chemical compound, drug | Avidin-biotin complex (ABC) | Cat# PK6100; Vector Laboratories | 1:1000 | |
| Chemical compound, drug | 3,3-Diamino-benzidine (DAB) | Cat# D5905; Sigma-Aldrich | 0.5 mg/mL | |
| Chemical compound, drug | Ammonium chloride | Cat# A514; Sigma-Aldrich | 40 ug/mL | |
| Chemical compound, drug | D(+)-glucose | Cat# G5767; Sigma-Aldrich | 25 mg/mL | |
| Chemical compound, drug | Glucose oxidase | Cat# G2133; Sigma-Aldrich | 3 g/mL | |
| Chemical compound, drug | Gelatin | Cat# G9391; Sigma-Aldrich | 1% | |
| Chemical compound, drug | Xylene | Cat# 534056; Sigma-Aldrich | Undiluted | |
| Chemical compound, drug | Permount | Cat# 17986-01; Electron Microscopy Sciences | Undiluted | |
| Chemical compound, drug | Glycerol | #G7893; Sigma-Aldrich | 30% | |
| Chemical compound, drug | Ethylene glycol | Cat# 324558; Sigma-Aldrich | 30% | |
| Chemical compound, drug | Sterile 0.9% sodium chloride solution; saline | NDC# 50989-885-17; Vedco, Inc | ||
| Chemical compound, drug | Dental cement | Cat# 4734FIB, Lang Dental Mfg. Co | ||
| Chemical compound, drug | Lactated Ringer’s solution | NDC# 099355000476; Aspen Veterinary Resources Ltd | 50 mL/kg | |
| Chemical compound, drug | Isoflurane | NDC# 07-893-1389; Patterson Veterinary | ||
| Chemical compound, drug | Urethane | Cat# U2500; Sigma-Aldrich | 2.5 g/kg | |
| Chemical compound, drug | Buprenorphine | Buprenex; NDC#12496-075705; Reckitt Benckiser | 0.2 mg/kg | |
| Strain, strain background (Mus musculus) | Tg2576 mice, C57BL6/SJL background | Jackson Labs | Stock# 100012 | |
| Software, algorithm | ImagePro Plus V7.0 | Media Cybernetics | ||
| Software, algorithm | Sirenia acquisition | Pinnacle Technology | RRID:SCR_016183 | |
| Software, algorithm | Sirenia Seizure | Pinnacle Technology | RRID:SCR_016184 | |
| Software, algorithm | Neuroscore | Data Science International | ||
| Software, algorithm | Prism | GraphPad | RRID:SCR_002798 | |
| Software, algorithm | Photoshop | Adobe | RRID:SCR_014199 | |
| Software, algorithm | ImageJ | NIH | RRID:SCR_003070 | Version 1.44 |
| Software, algorithm | G*Power | G*Power | RRID:SCR_013726 | |
| Other | Connector | Cat# ED85100-ND; Digi-key Corporation | For EEG | |
| Other | Commutator | Cat# 8408; Pinnacle | For EEG | |
| Other | 0.10” stainless steel screws | Cat# 8209; Pinnacle Technology | For EEG | |
| Other | Low choline diets | AIN-76A; #110098 or #110194 Dyets, Inc | ||
| Other | High choline diet | AIN-76A; #110194 Dyets, Inc | ||
| Other | Intermediate diet | Purina 5008; W.F. Fisher and Son | ||
| Other | VIbratome | VT1000P; Leica Biosystems | For sectioning | |
| Other | Microscope slides | Cat# ZA0262; Zefon International | 3" x 1" | |
| Other | Coverslips | Cat# 48393-106 VWR Scientific Products Corp. | #1; 24 × 60 mm | |
| Other | Camera | Logitech HD Pro C920; Logitech | For behavior | |
| Other | Infrared camera | AP-DCS100W; Apex CCTV | For EEG | |
| Other | Digital camera | Model RET 2000R-F-CLR-12; Q imaging | For microscopy | |
| Other | Microscope | BX61; Olympus of America | ||
| Other | Stereotaxic apparatus | Model 902; David Kopf Instruments | ||
| Other | Peristaltic pump | Minipulse1; Gilson | For perfusion-fixation |
Additional files
-
Supplementary file 1
Comparison of the 3 diets used in this study.
The major constituents of the diets are shown. Concentrations are g nutrient/kg chow. Food was provided ad libitum to breeders during mating, gestation and until weaning. After weaning all mice were fed the intermediate diet. WT mice were fed the intermediate diet during breeding, gestation, until weaning and after weaning.
- https://cdn.elifesciences.org/articles/89889/elife-89889-supp1-v1.xls
Download links
A two-part list of links to download the article, or parts of the article, in various formats.
Downloads (link to download the article as PDF)
Open citations (links to open the citations from this article in various online reference manager services)
Cite this article (links to download the citations from this article in formats compatible with various reference manager tools)
Choline supplementation in early life improves and low levels of choline can impair outcomes in a mouse model of Alzheimer’s disease
eLife 12:RP89889.
https://doi.org/10.7554/eLife.89889.4


