Determinantal point process attention over grid cell code supports out of distribution generalization
- Department of Electrical and Computer Engineering, Princeton University, United States
- Princeton Neuroscience Institute, Princeton University, United States
- Department of Psychology, University of California, Los Angeles, United States
Figures
Figure 1
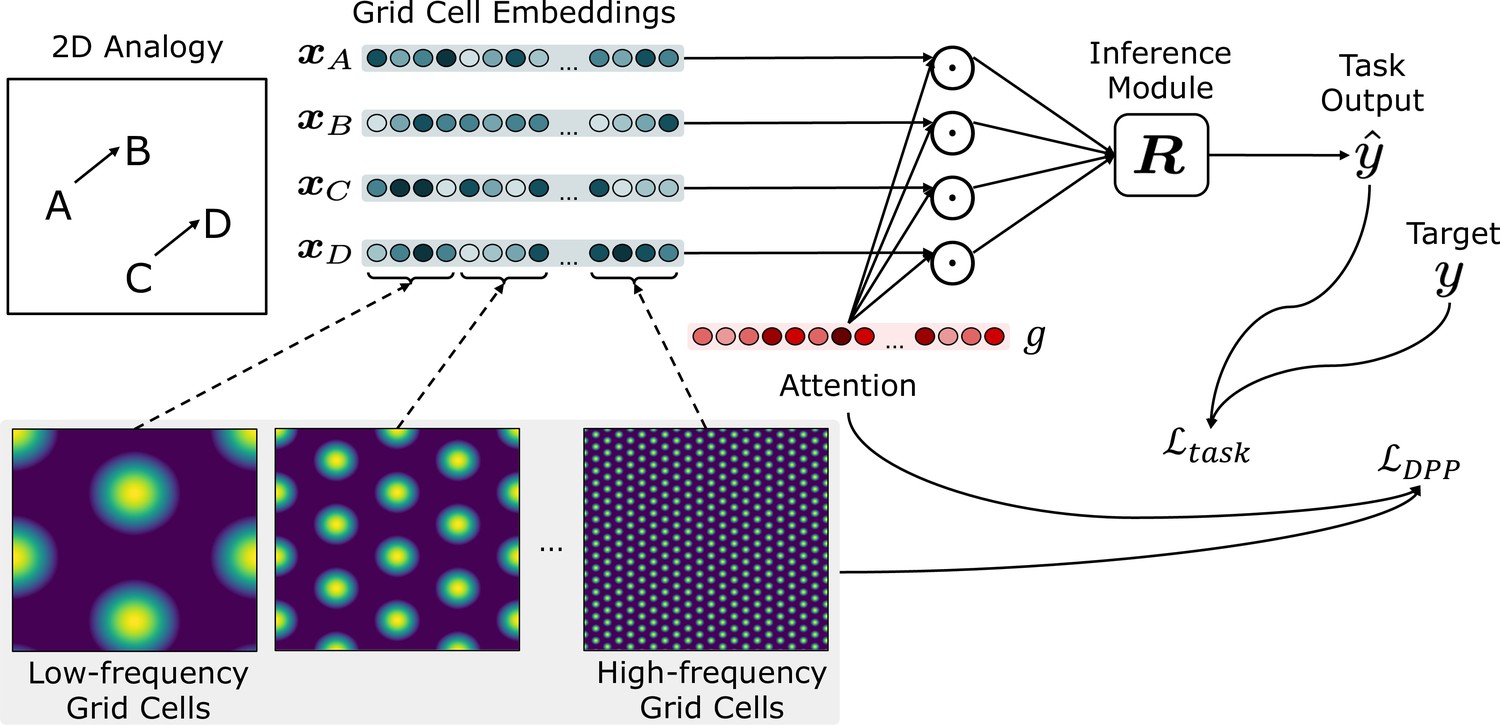
Schematic of the overall framework.
Given a task (e.g., an analogy to solve), inputs (denoted as ) are represented by the grid cell code, consisting of units (grid cells) representing different combinations of frequencies and phases. Grid cell embeddings (, , , ) are multiplied elementwise (represented as a Hadamard product ) by a set of learned attention gates , then passed to the inference module . The attention gates are optimized using , which encourages attention to grid cell embeddings that maximize the volume of the representational space. The inference module outputs a score for each candidate analogy (consisting of and a candidate answer choice ). The scores for all answer choices are passed through a softmax to generate an answer , which is compared against the target to generate the task loss .
Figure 2
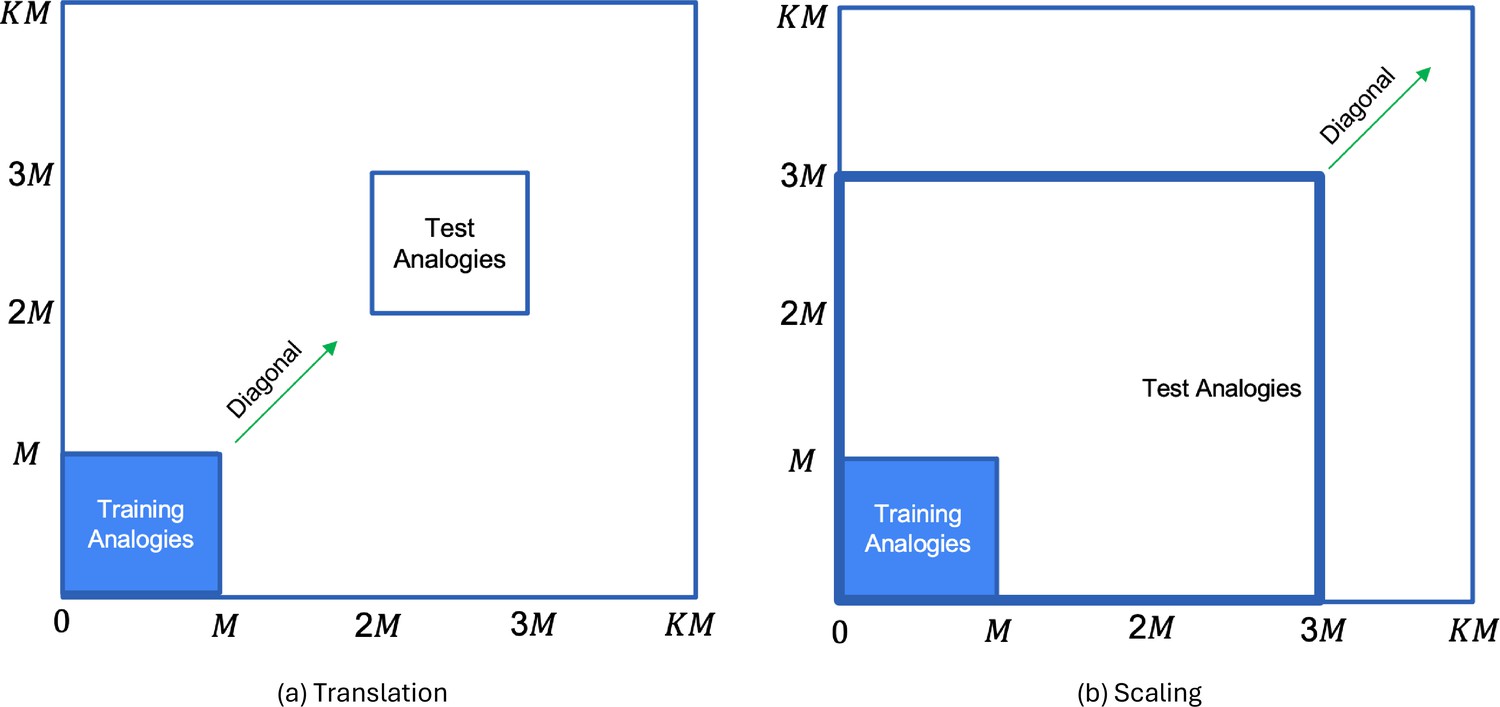
Generation of test analogies from training analogies (region marked in blue) by: (a) translating both dimension values of by the same amount; and (b) scaling both dimension values of by the same amount.
Since both dimension values are transformed by the same amount, each input gets transformed along the diagonal.
-
Figure 2—source data 1
The zip file contains the data for the analogy task depicted in Figure 2.
- https://cdn.elifesciences.org/articles/89911/elife-89911-fig2-data1-v1.zip
Figure 3
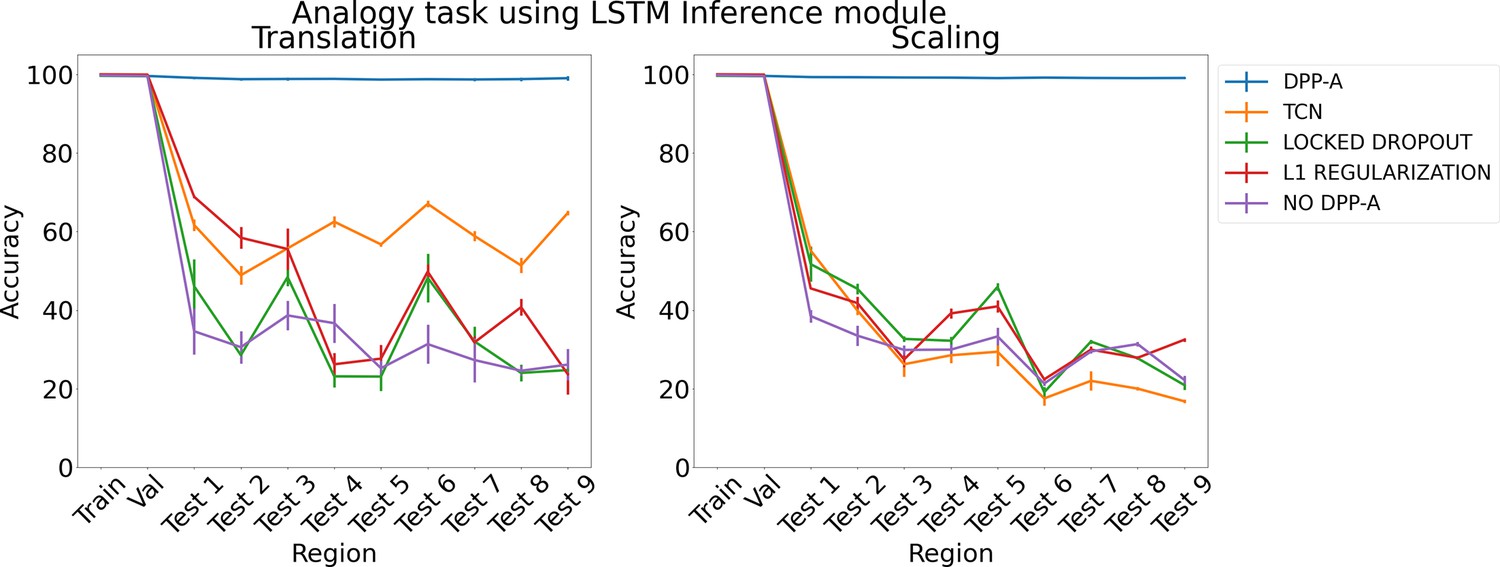
Results on analogy on each region for translation and scaling using LSTM in the inference module.
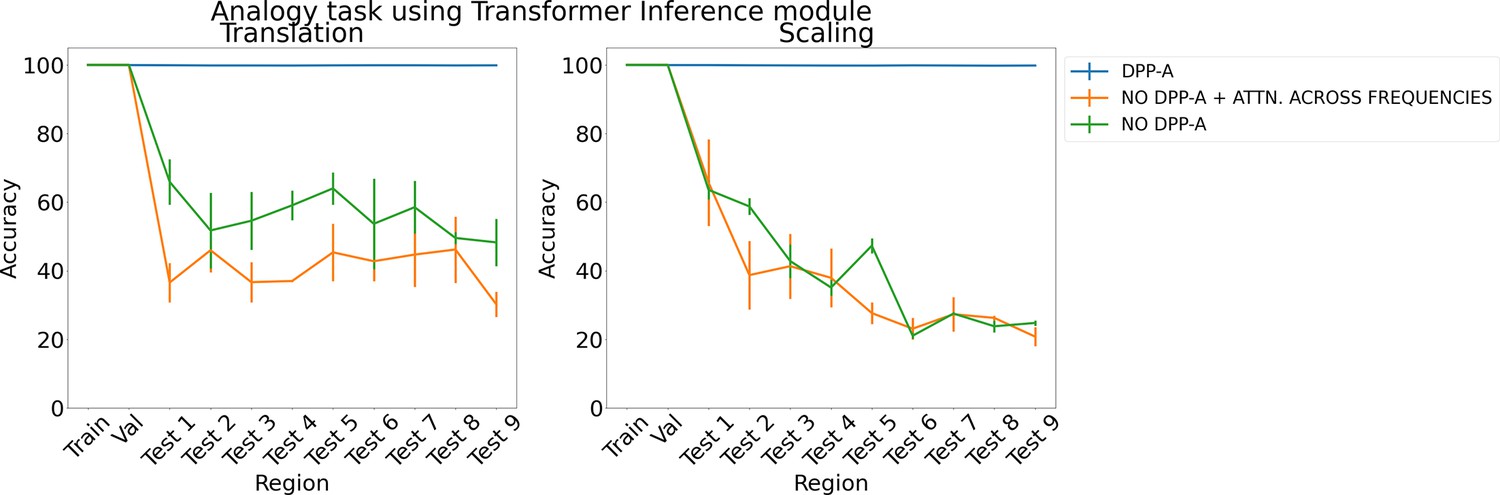
Figure 4
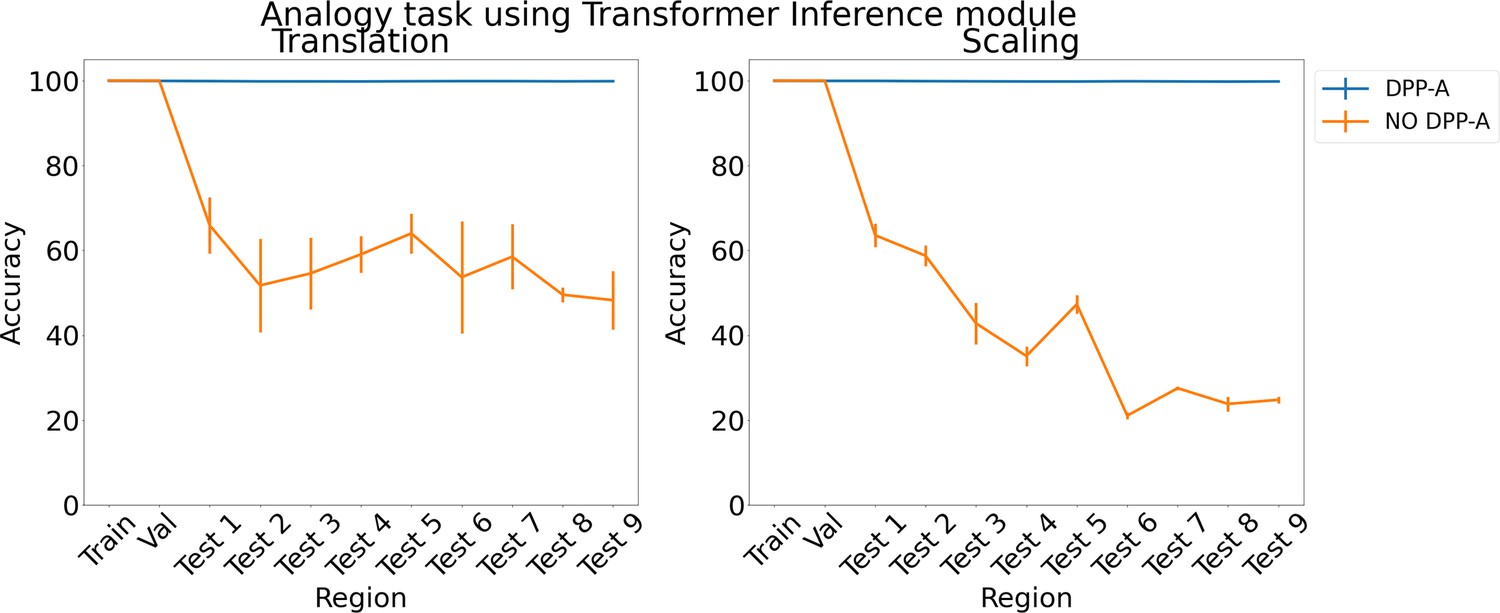
Results on analogy on each region for translation and scaling using the transformer in the inference module.
Figure 5
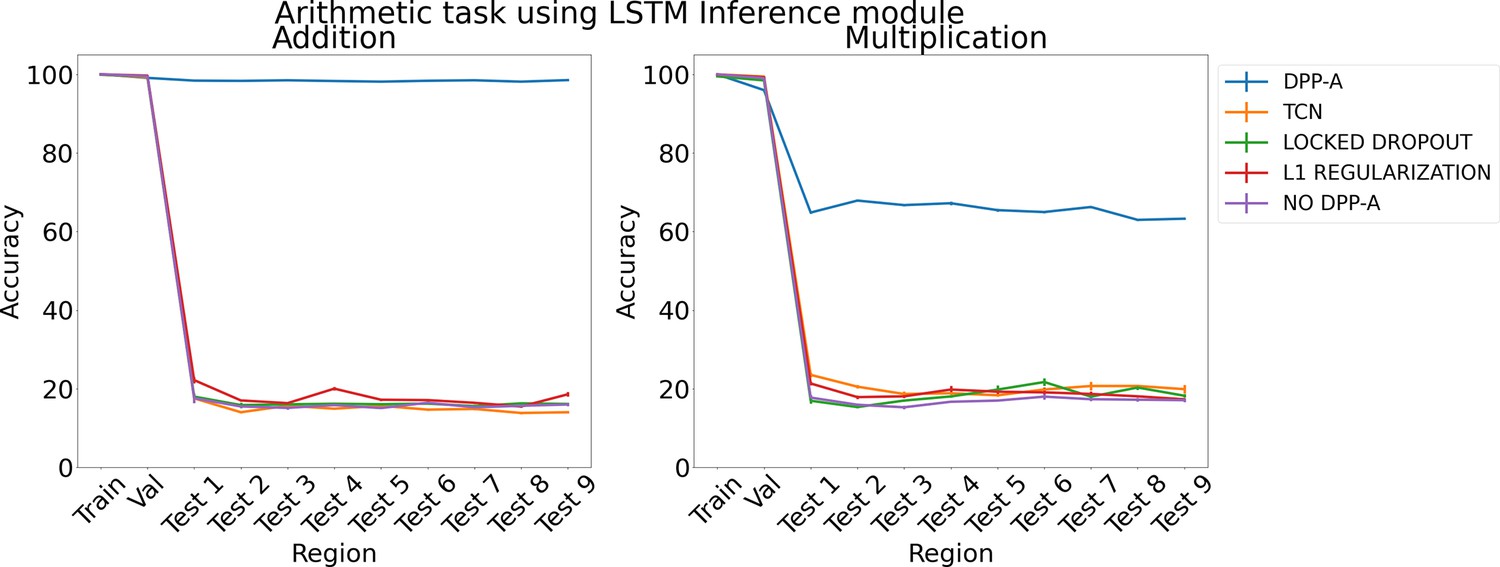
Results on arithmetic on each region using LSTM in the inference module.
Figure 6
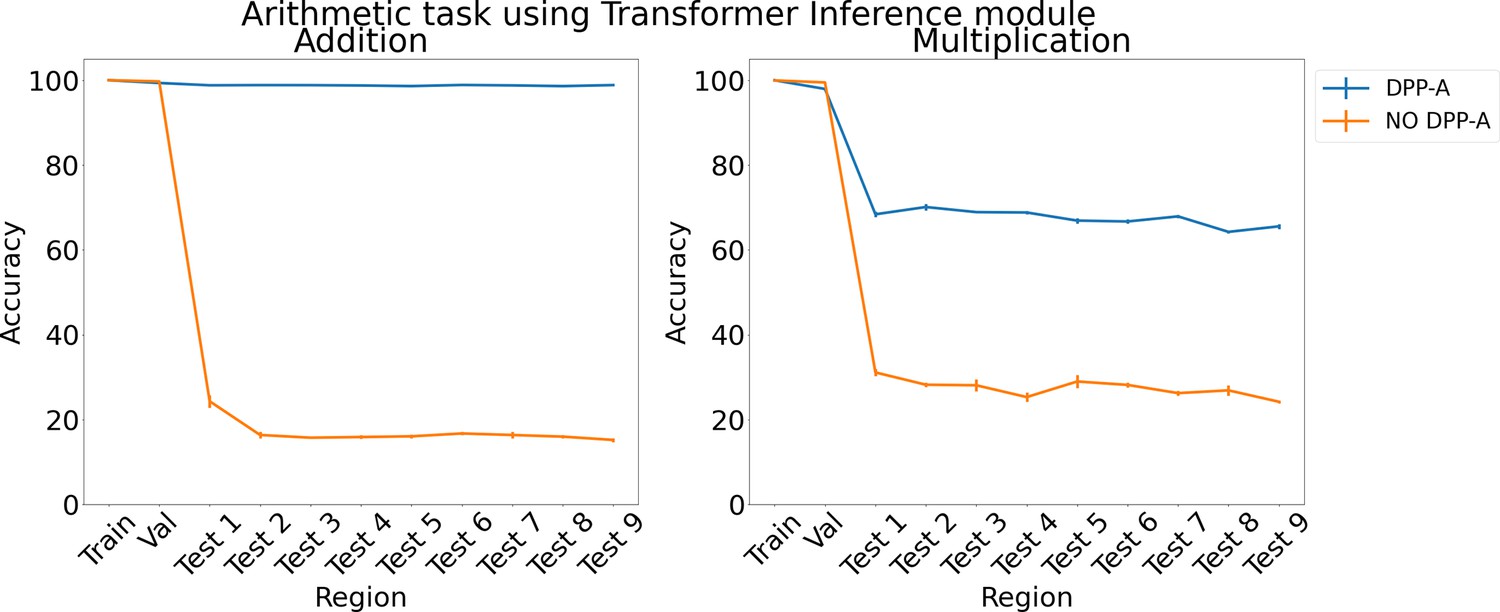
Results on arithmetic on each region using the transformer in the inference module.
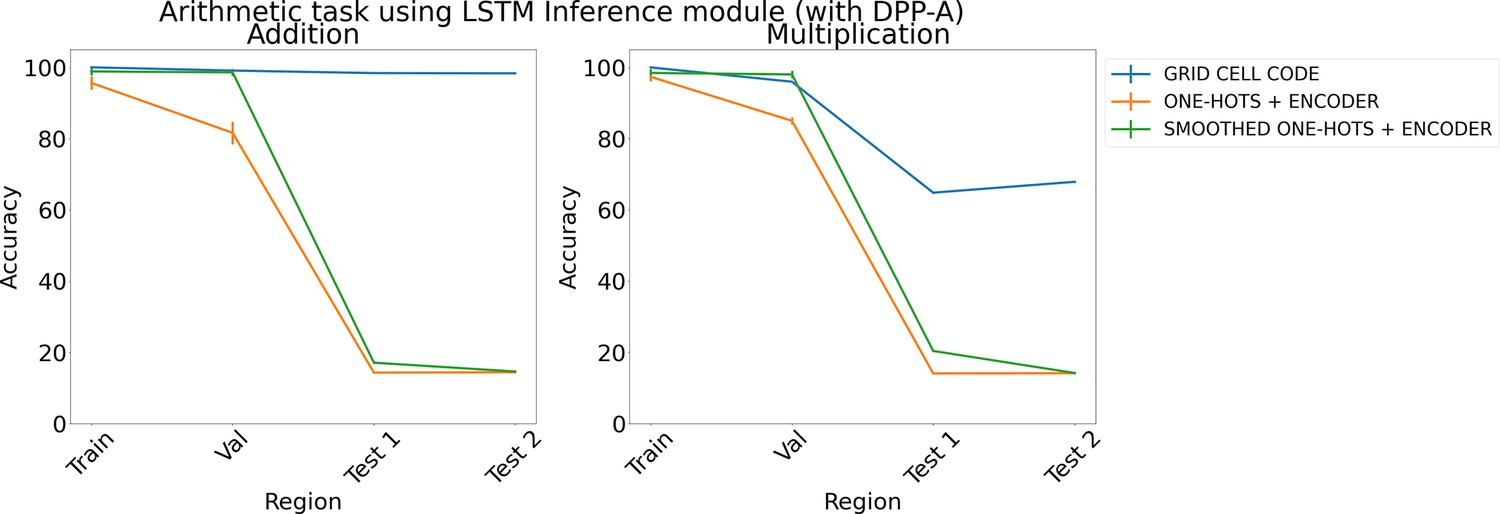
Figure 7
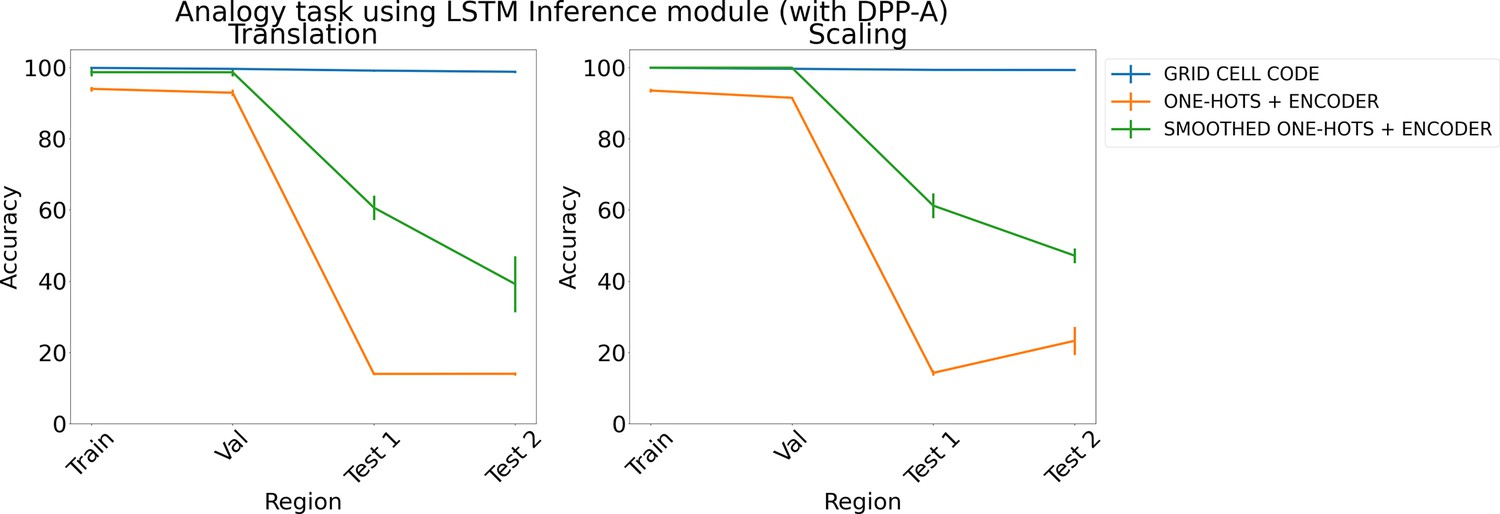
Results on analogy on each region using determinantal point process attention (DPP-A), an LSTM in the inference module, and different embeddings (grid cell code, one-hots, and smoothed one-hots passed through a learned encoder) for translation (left) and scaling (right).
Each point is mean accuracy over three networks, and bars show standard error of the mean.
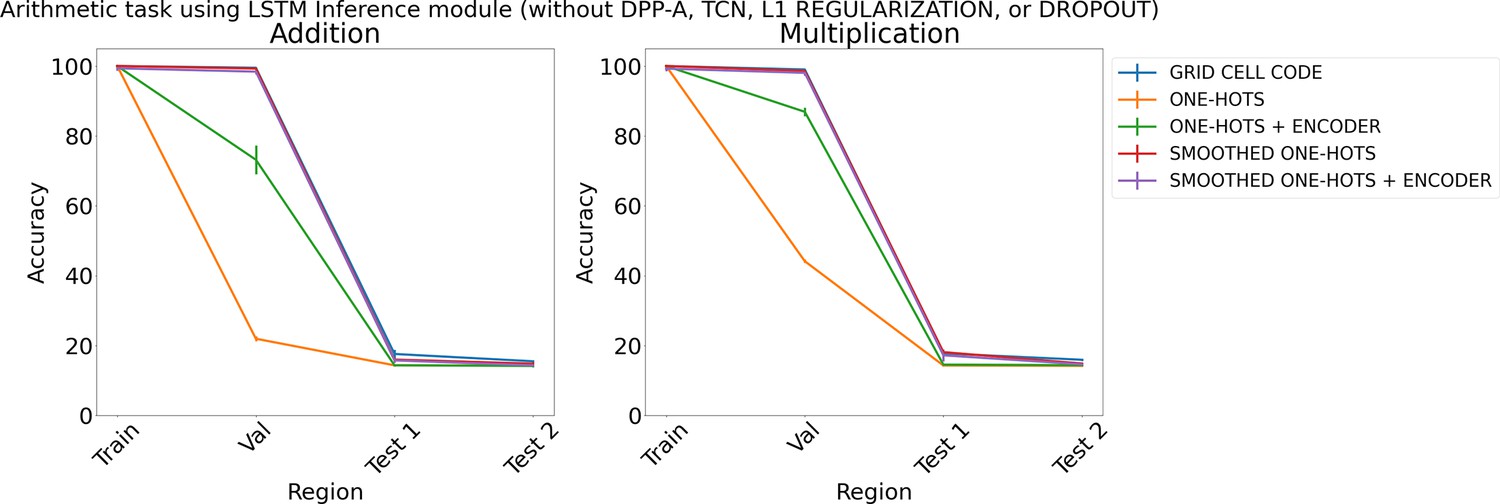
Figure 8
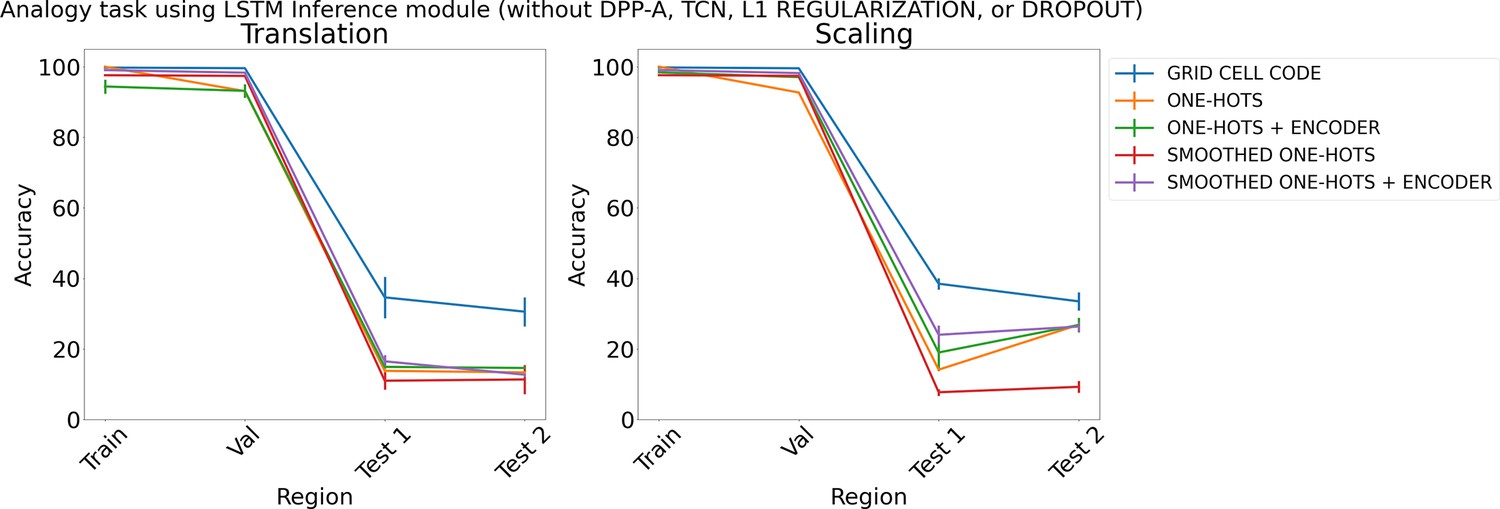
Results on analogy on each region using different embeddings (grid cell code, and one-hots or smoothed one-hots with and without an encoder) and an LSTM in the inference module, but without determinantal point process attention (DPP-A), temporal context normalization (TCN), L1 Regularization, or Dropout for translation (left) and scaling (right).
Appendix 1—figure 1
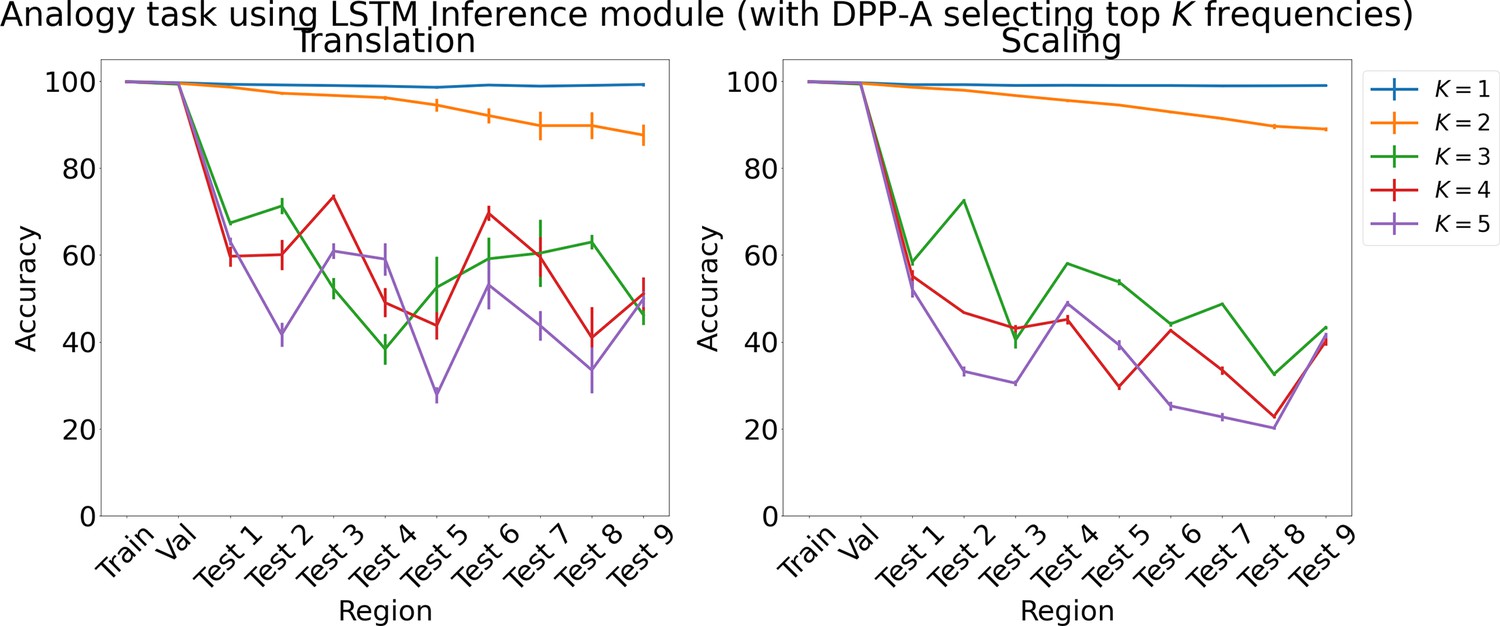
Results on analogy on each region using LSTM in the inference module for choosing top frequencies with in Algorithm 1.
Results show mean accuracy on each region averaged over three trained networks along with errorbar (standard error of the mean).
Appendix 1—figure 2
Results on analogy on each region for translation and scaling using the transformer in the inference module.
Appendix 1—figure 3
Results on arithmetic with different embeddings (with determinantal point process attention [DPP-A]) using LSTM in the inference module.
Results show mean accuracy on each region averaged over three trained networks along with errorbar (standard error of the mean).
Appendix 1—figure 4
Results on arithmetic with different embeddings (without determinantal point process attention [DPP-A], temporal context normalization [TCN], L1 Regularization, or Dropout) using LSTM in the inference module.
Results show mean accuracy on each region averaged over three trained networks along with errorbar (standard error of the mean).
Appendix 1—figure 5
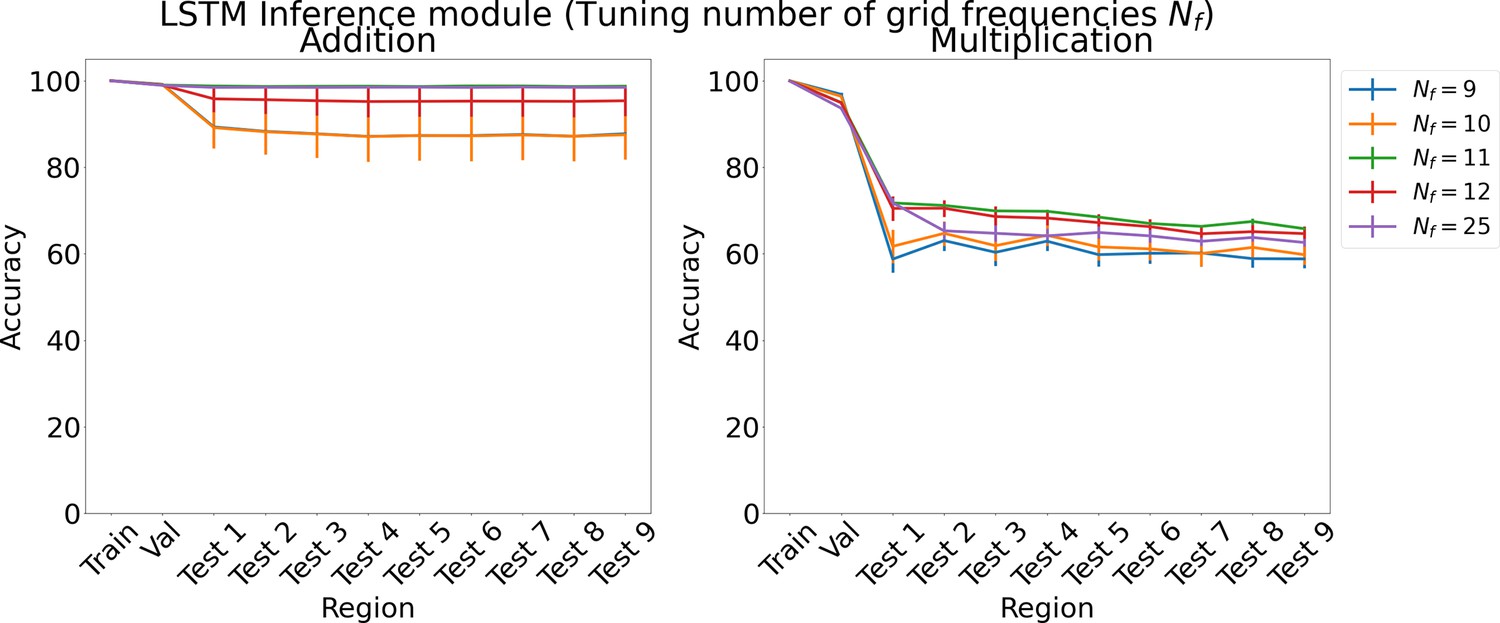
Results on arithmetic for increasing number of grid cell frequencies on each region using LSTM in the inference module.
Results show mean accuracy on each region averaged over three trained networks along with errorbar (standard error of the mean).
Appendix 1—figure 6
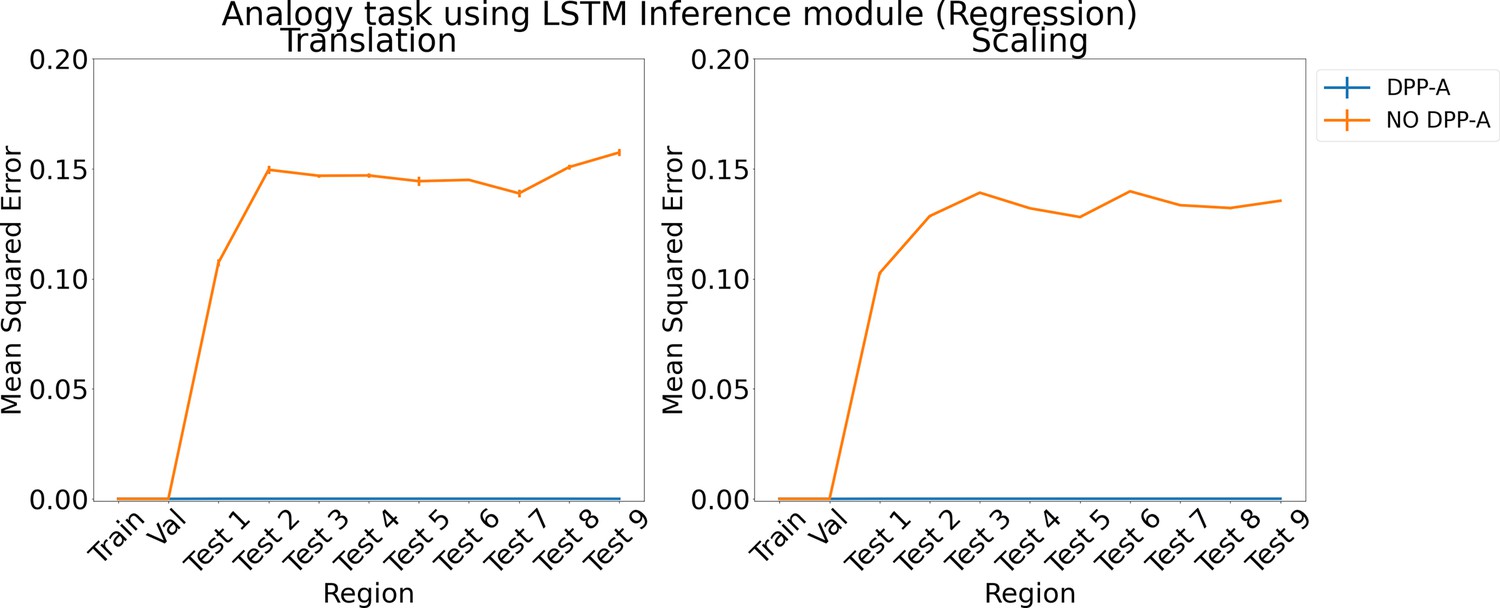
Results for regression on analogy using LSTM in the inference module.
Results show mean squared error on each region averaged over three trained networks along with errorbar (standard error of the mean).
Appendix 1—figure 7
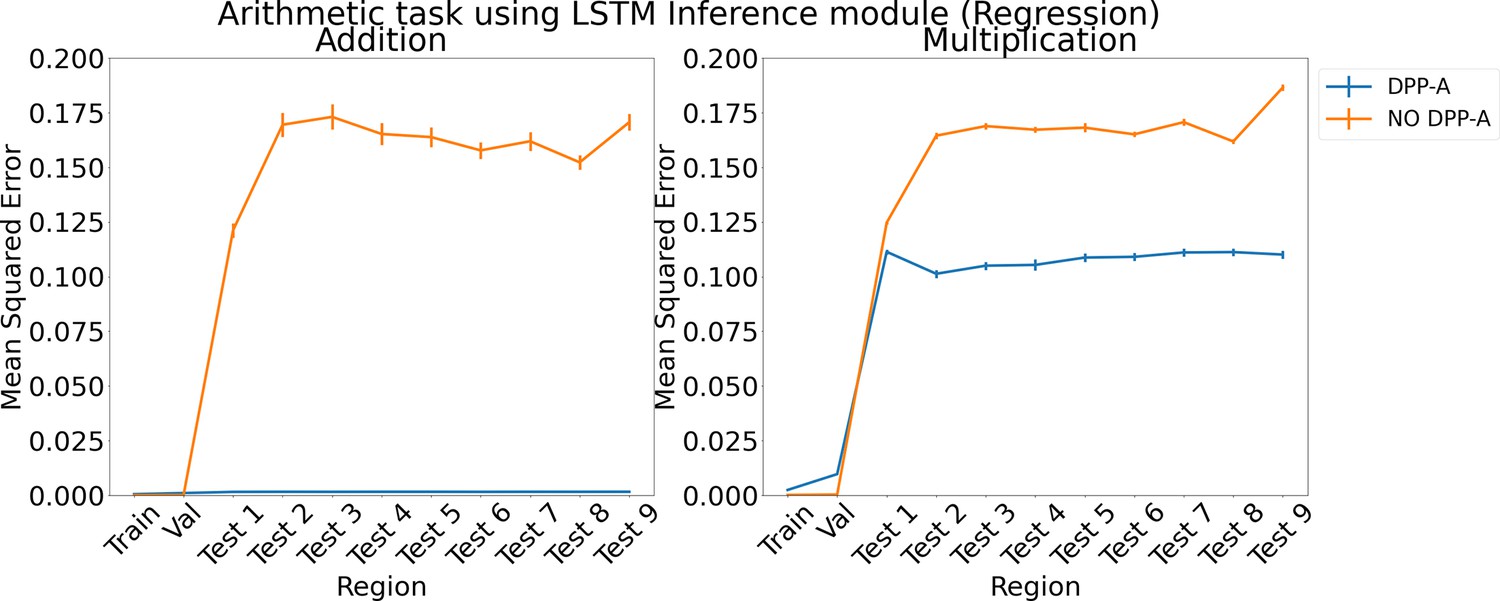
Results for regression on arithmetic on each region using LSTM in the inference module.
Results show mean squared error on each region averaged over three trained networks along with errorbar (standard error of the mean).
Appendix 1—figure 8
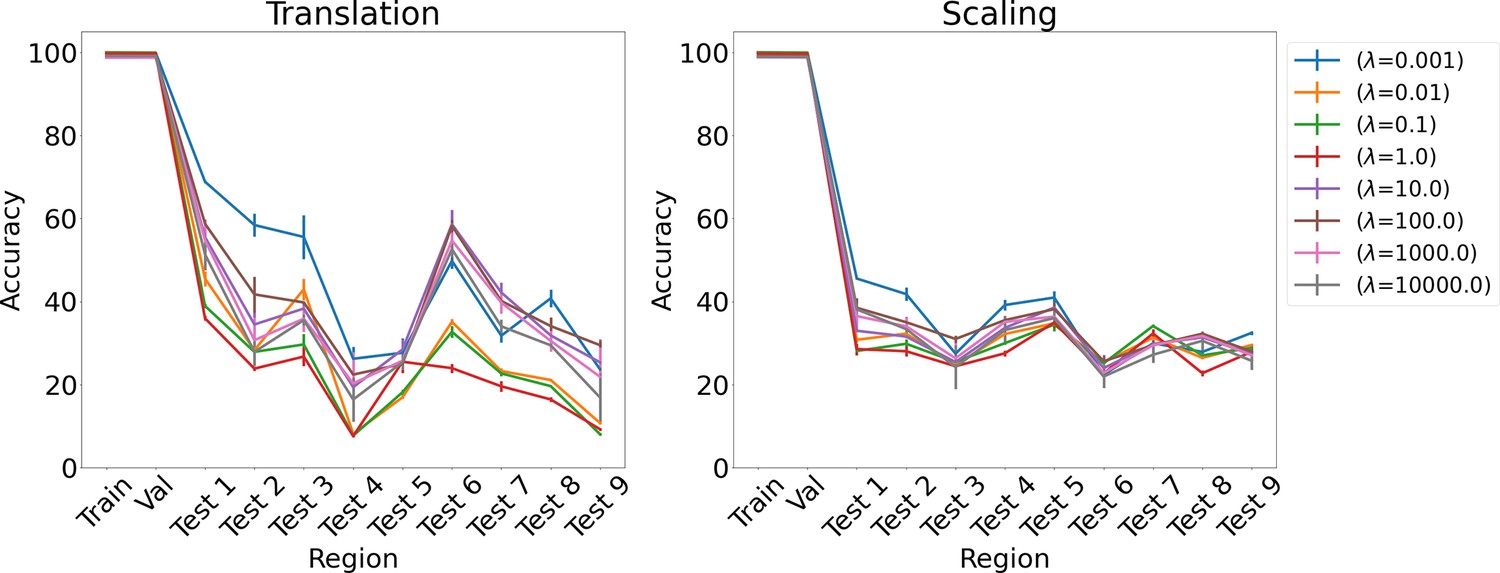
Results on analogy for L1 regularization for various λs for translation and scaling using LSTM in the inference module.
Results show mean accuracy on each region averaged over three trained networks along with errorbar (standard error of the mean).
Appendix 1—figure 9
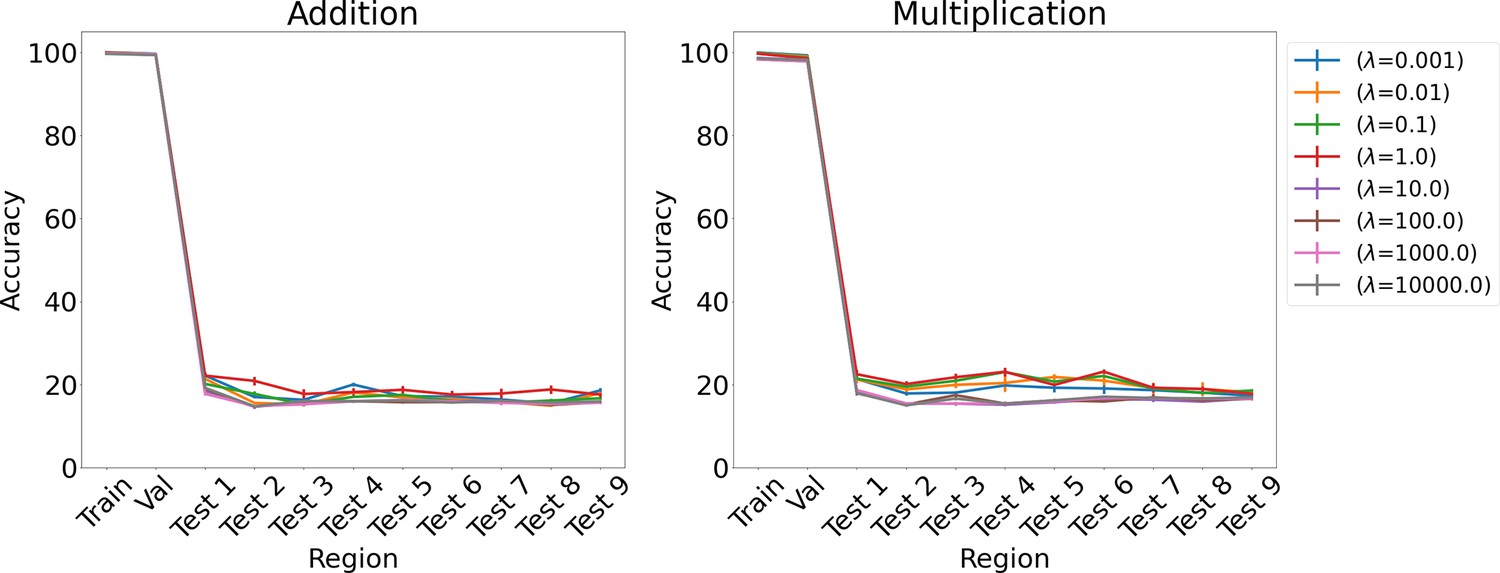
Results on arithmetic for L1 regularization for various λs using LSTM in the inference module.
Results show mean accuracy on each region averaged over three trained networks along with errorbar (standard error of the mean).
Appendix 1—figure 10
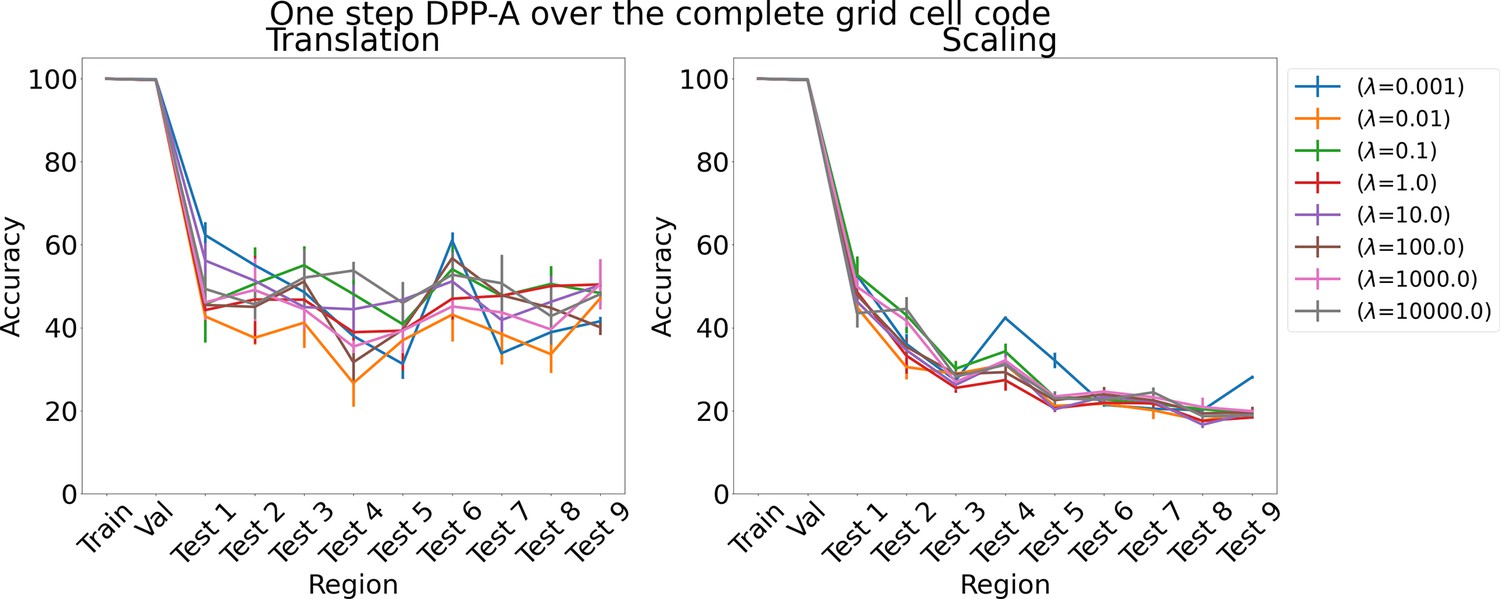
Results on analogy for one step determinantal point process attention (DPP-A) over the complete grid cell code for various λs for translation and scaling using LSTM in the inference module.
Results show mean accuracy on each region averaged over three trained networks along with errorbar (standard error of the mean).
Appendix 1—figure 11
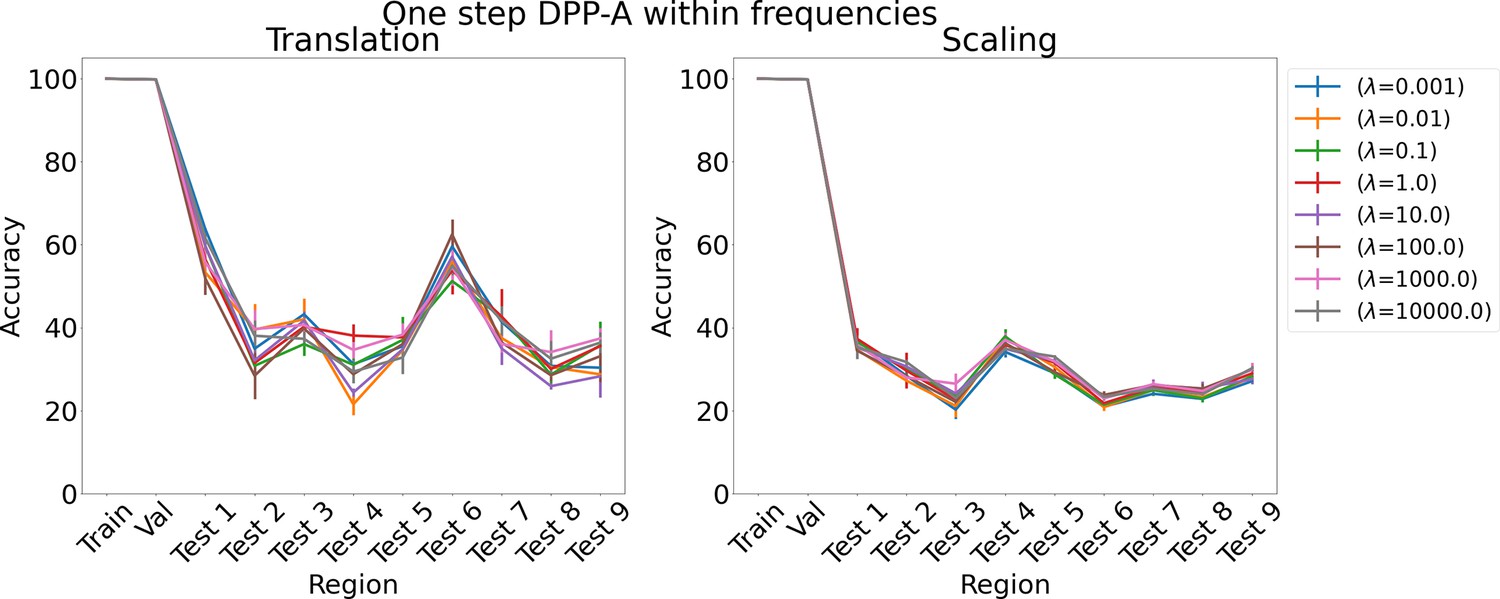
Results on analogy for one step determinantal point process attention (DPP-A) within frequencies for various λs for translation and scaling using LSTM in the inference module.
Results show mean accuracy on each region averaged over three trained networks along with errorbar (standard error of the mean).
Appendix 1—figure 12

Approximate maximum log determinant of the covariance matrix over the grid cell embeddings (y-axis) for each frequency (x-axis), obtained after maximizing Equation 6.
Appendix 1—figure 13
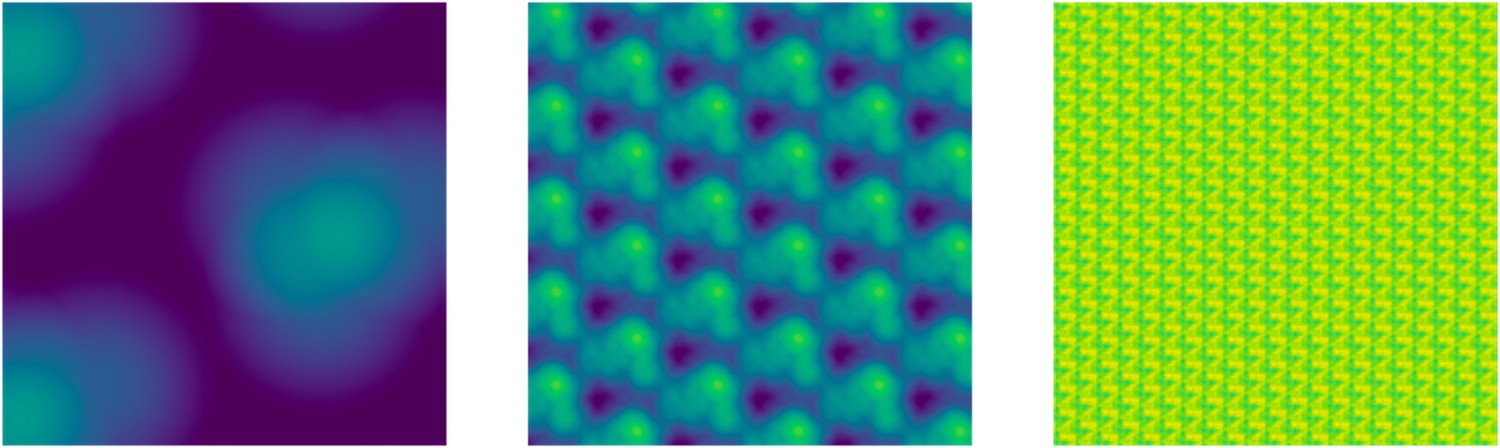
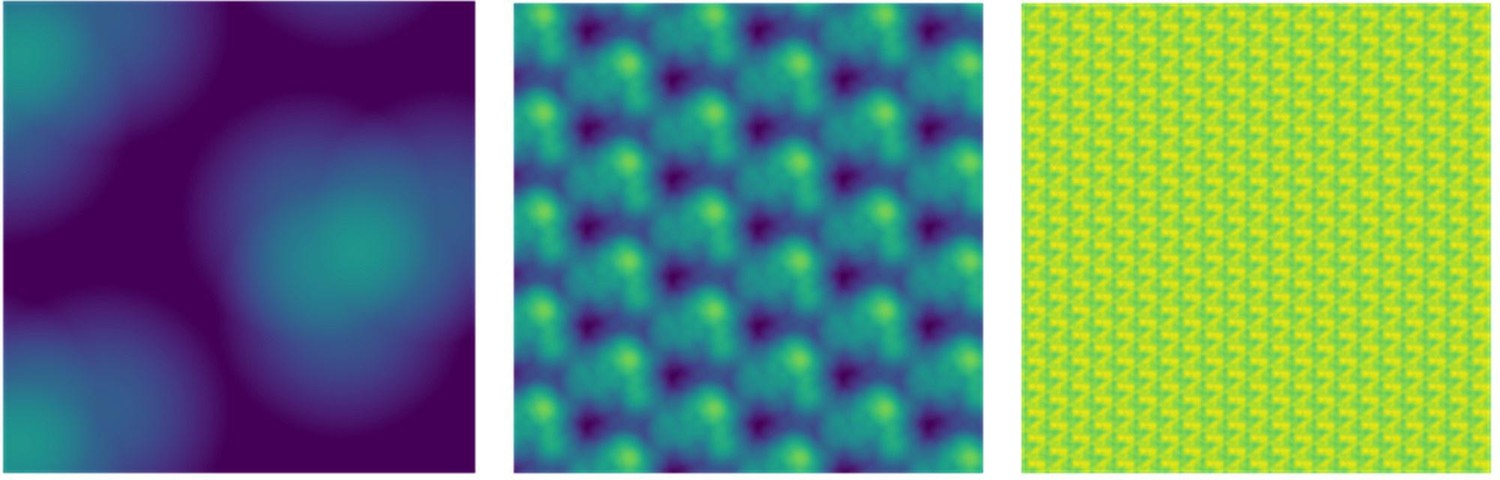
Each panel shows the results after summation of the multiplication of the grid cell embeddings over the 2D space of 1000 × 1000 locations, with their corresponding gates for a particular frequency, obtained after maximizing Equation 6 for each grid cell frequency.
The left, middle, and right panels show results for the lowest, middle, and highest grid cell frequencies, respectively, of the nine used in the model. Lighter color in each panel corresponds to greater responsiveness of grid cells at that particular location in the 2D space.
Author response image 1

Approximate maximum log determinant of the covariance matrix over the grid cell embeddings (y-axis) for each frequency (x-axis), obtained after maximizing Equation 6.
Author response image 2
Each panel shows the results after summation of the multiplication of the grid cell embeddings over the 2d space of 1000x1000 locations, with their corresponding gates for a particular frequency, obtained after maximizing Equation 6 for each grid cell frequency.
The left, middle, and right panels show results for the lowest, middle, and highest grid cell frequencies, respectively, of the 9 used in the model. Lighter color in each panel corresponds to greater responsiveness of grid cells at that particular location in the 2d space.
Additional files
-
MDAR checklist
- https://cdn.elifesciences.org/articles/89911/elife-89911-mdarchecklist1-v1.docx
-
Source data 1
The zip file contains the data for the arithmetic task.
- https://cdn.elifesciences.org/articles/89911/elife-89911-data1-v1.zip
-
Source code 1
The zip file contains the code downloaded from the github repo provided earlier.
- https://cdn.elifesciences.org/articles/89911/elife-89911-code1-v1.zip
Download links
A two-part list of links to download the article, or parts of the article, in various formats.
Downloads (link to download the article as PDF)
Open citations (links to open the citations from this article in various online reference manager services)
Cite this article (links to download the citations from this article in formats compatible with various reference manager tools)
Determinantal point process attention over grid cell code supports out of distribution generalization
eLife 12:RP89911.
https://doi.org/10.7554/eLife.89911.3


