Task-specific invariant representation in auditory cortex
- Neuroscience Graduate Program, Oregon Health and Science University, United States
- Otolaryngology, Oregon Health & Science University, United States
Figures
Figure 1 with 1 supplement
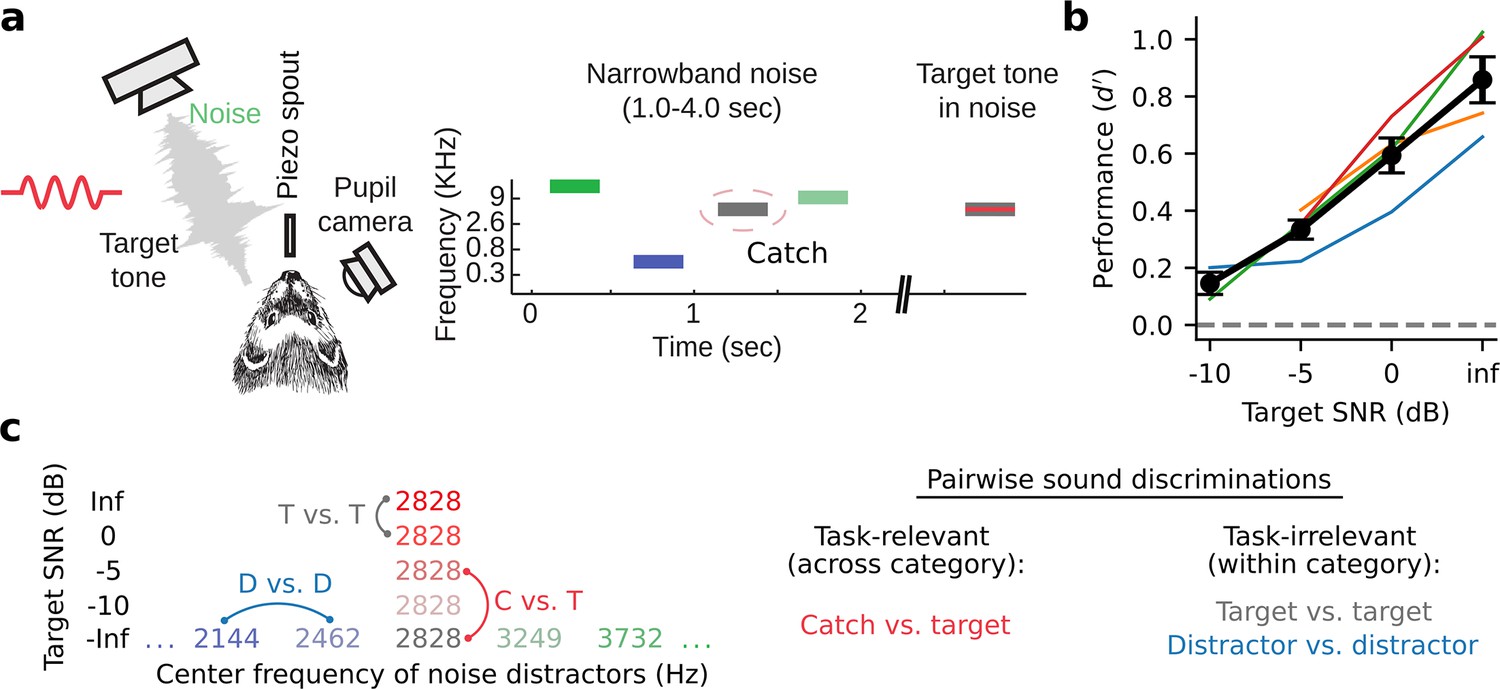
Tone-in-noise detection behavior.
(a) Schematic of go/no-go tone-in-noise detection task. Licking responses to target tones were rewarded, while responses to narrowband noise distractors were penalized with a timeout. Target tone frequency was fixed during a single behavior session and masked by narrowband (0.3 octave) noise centered at the same frequency with variable signal-to-noise ratio (SNR). Variable SNR was achieved by varying the overall SPL of the target relative to the fixed (60 dB SPL) distractor noise, e.g., –5 dB SNR corresponds to a 55 dB SPL target with 60 dB SPL masking noise. Infinite (inf) dB SNR corresponds to a target tone presented in isolation (60 dB SPL). The ‘Catch’ distractor was identical to the masking noise but with no tone. (b) Behavioral performance of individual animals as a function of SNR (d-prime=Z[target response rate] - Z[catch response rate], n=4 animals). Black lines and error bars indicate the mean and standard error of the mean across animals. (c) Left: Stimulus set for an example experiment where the target tone frequency was 2828 Hz. Right: both task-relevant (catch vs. target) and task-irrelevant (target vs. target, distractor vs. distractor) sound discriminations were studied.
Figure 1—figure supplement 1
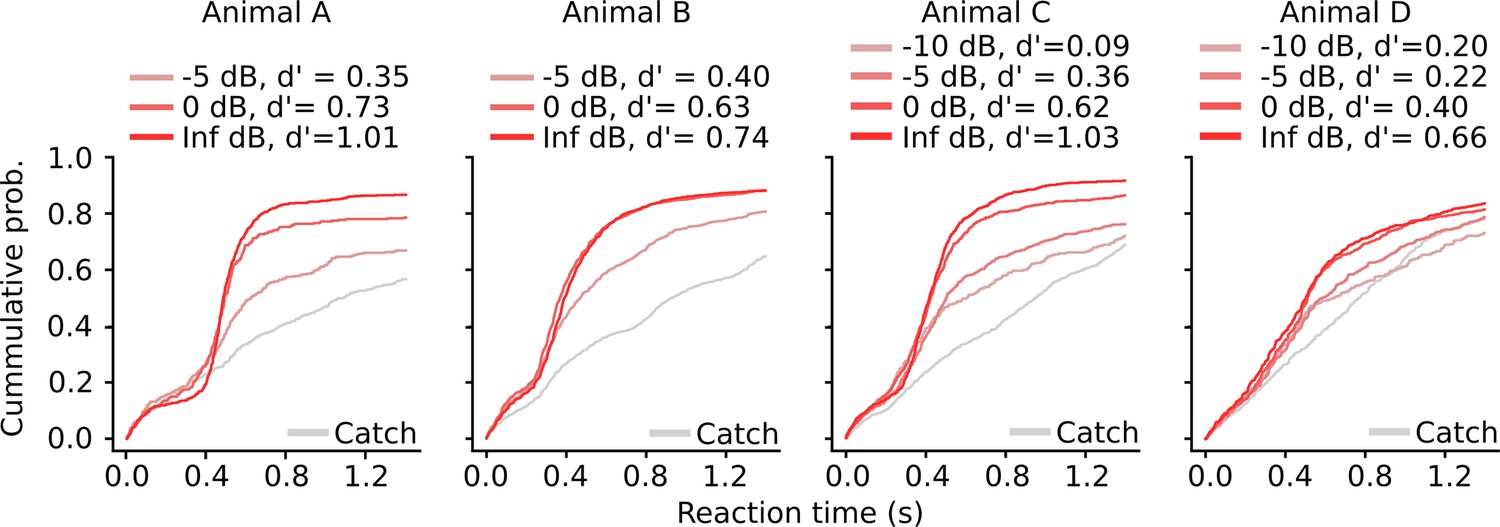
Behavioral performance of individual animals.
Cumulative reaction time histogram for each animal and target sound across all behavior sessions. Color indicates sound identity. Animals were rewarded for responses to all sounds except the catch.
Figure 2 with 4 supplements
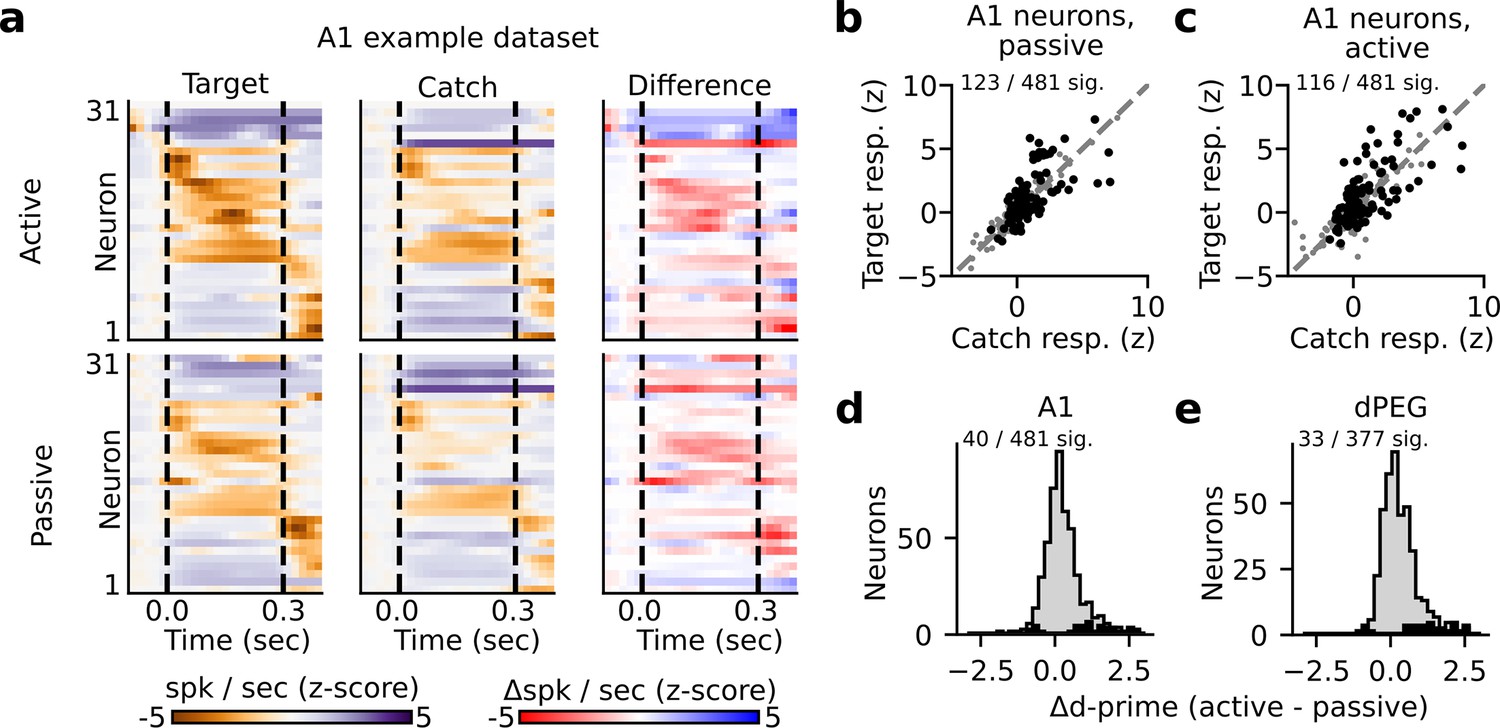
State-dependent modulation of single neuron target vs. catch discrimination.
(a) Example peristimulus time histogram (PSTH) responses from a single recording site in A1. Heatmap color in each row indicates the PSTH amplitude of one neuron. Dashed lines indicate sound onset/offset. Spikes were binned (20 ms), z-scored, and smoothed (σ=30 ms Gaussian kernel). Example target responses are to the pure tone (Inf dB) target. Difference is computed as the z-scored response to the target minus the z-scored catch response (resulting in a difference shown in units of z-score). (b–c) Mean z-scored response evoked by-catch vs. Inf dB stimulus for each A1 neuron (n=481 neurons) across passive (b) and active (c) trials. Responses were defined as the total number of spikes recorded during the 300ms of sound presentation (area between dashed lines in panel A). Neurons with a significantly different response to the catch vs. target stimulus are indicated in black and quantified on the respective figure panel. (d) Histogram plots the state-dependent change in target vs. catch stimulus discriminability for each A1 neuron. Neural d-prime is defined |Z[target] - Z[catch]|, and Δd-prime is the difference of active minus passive d-prime. The distribution of neurons with a significant change in d-prime between passive and active conditions is overlaid in black. (e) Histogram of Δd-prime for dPEG neurons, plotted as in D.
Figure 2—figure supplement 1
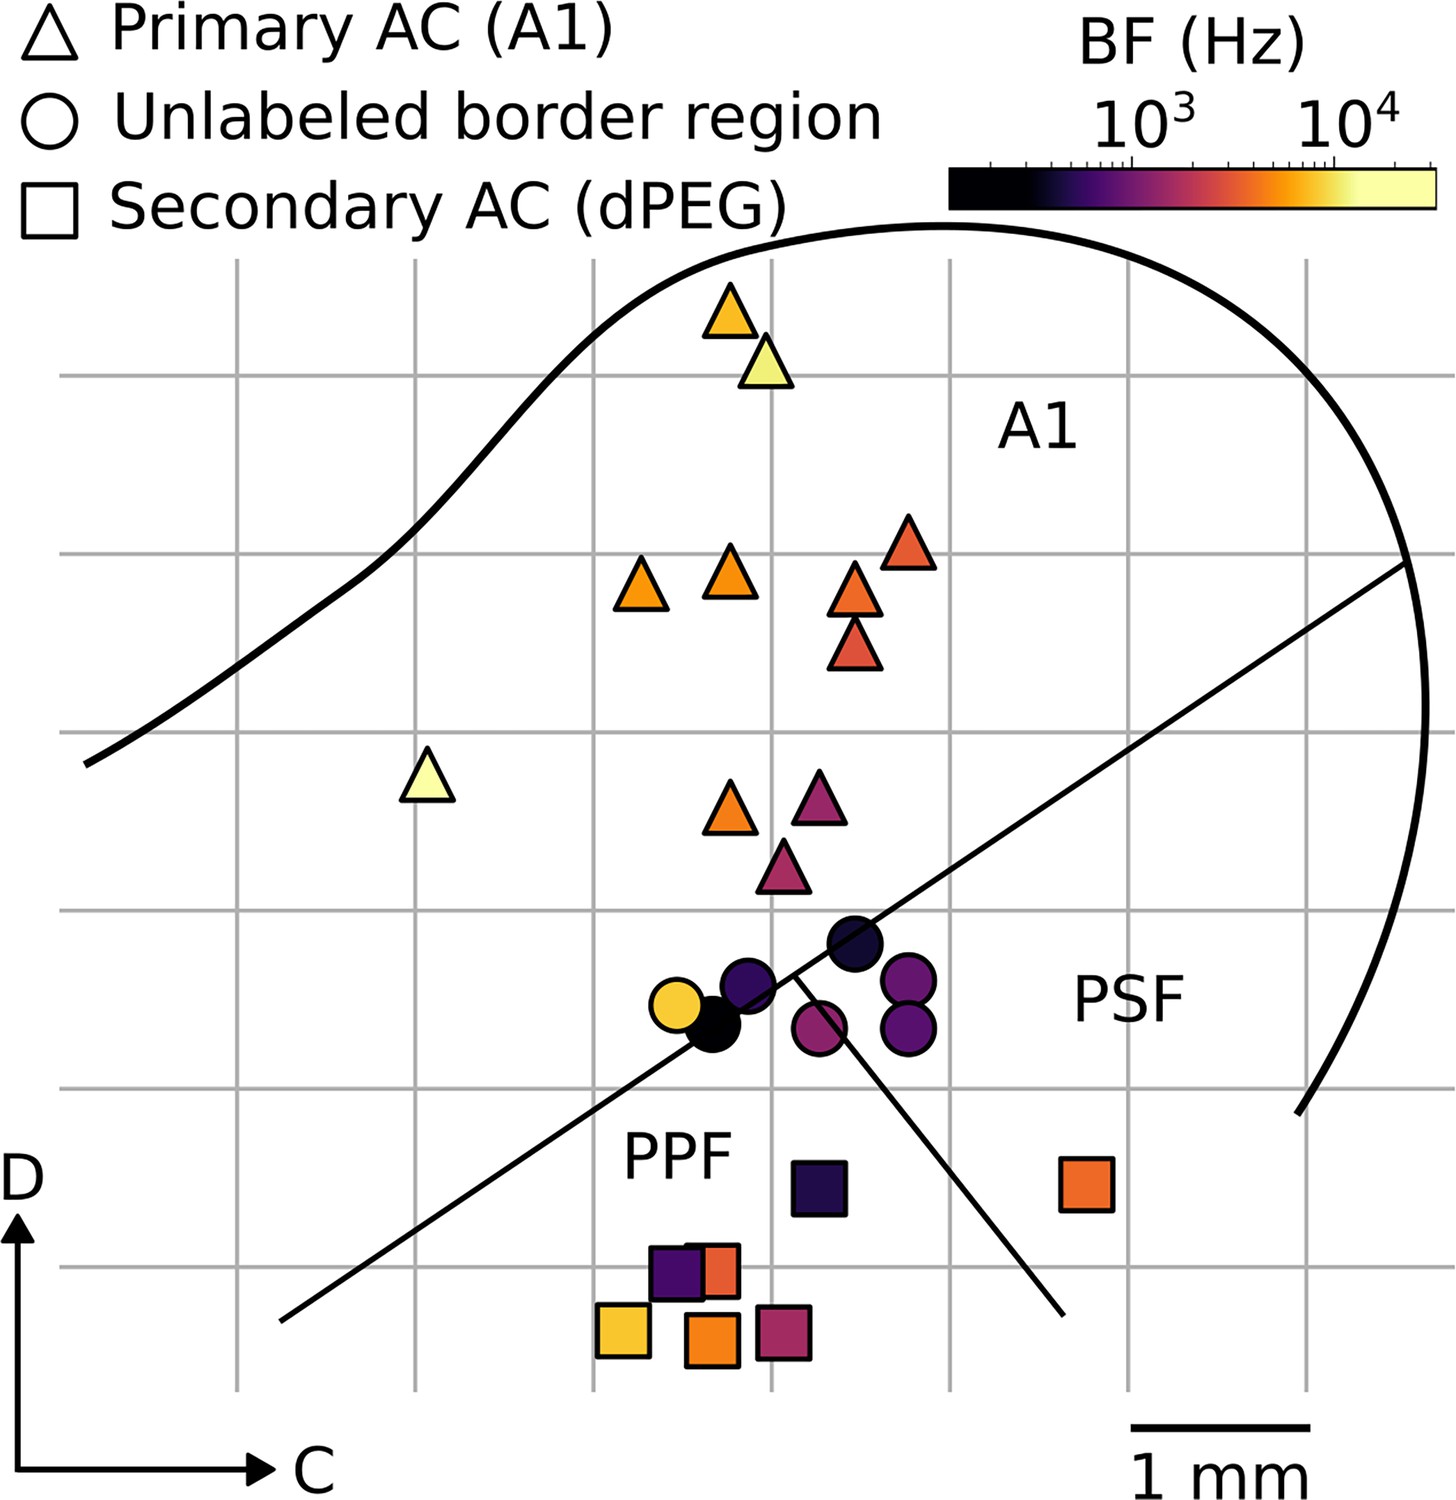
Penetration map for one example animal.
Left hemisphere from one animal. Each marker indicates the anatomical location of a single electrode penetration. Color indicates the average best frequency (BF) of neurons recorded at each location and marker type indicates which brain region each penetration belongs to. Overlaid black lines represent a rough estimate of region boundaries. A1: Primary auditory cortex, PSF/PPF: Anterior/posterior fields of secondary auditory cortex (dPEG).
Figure 2—figure supplement 2
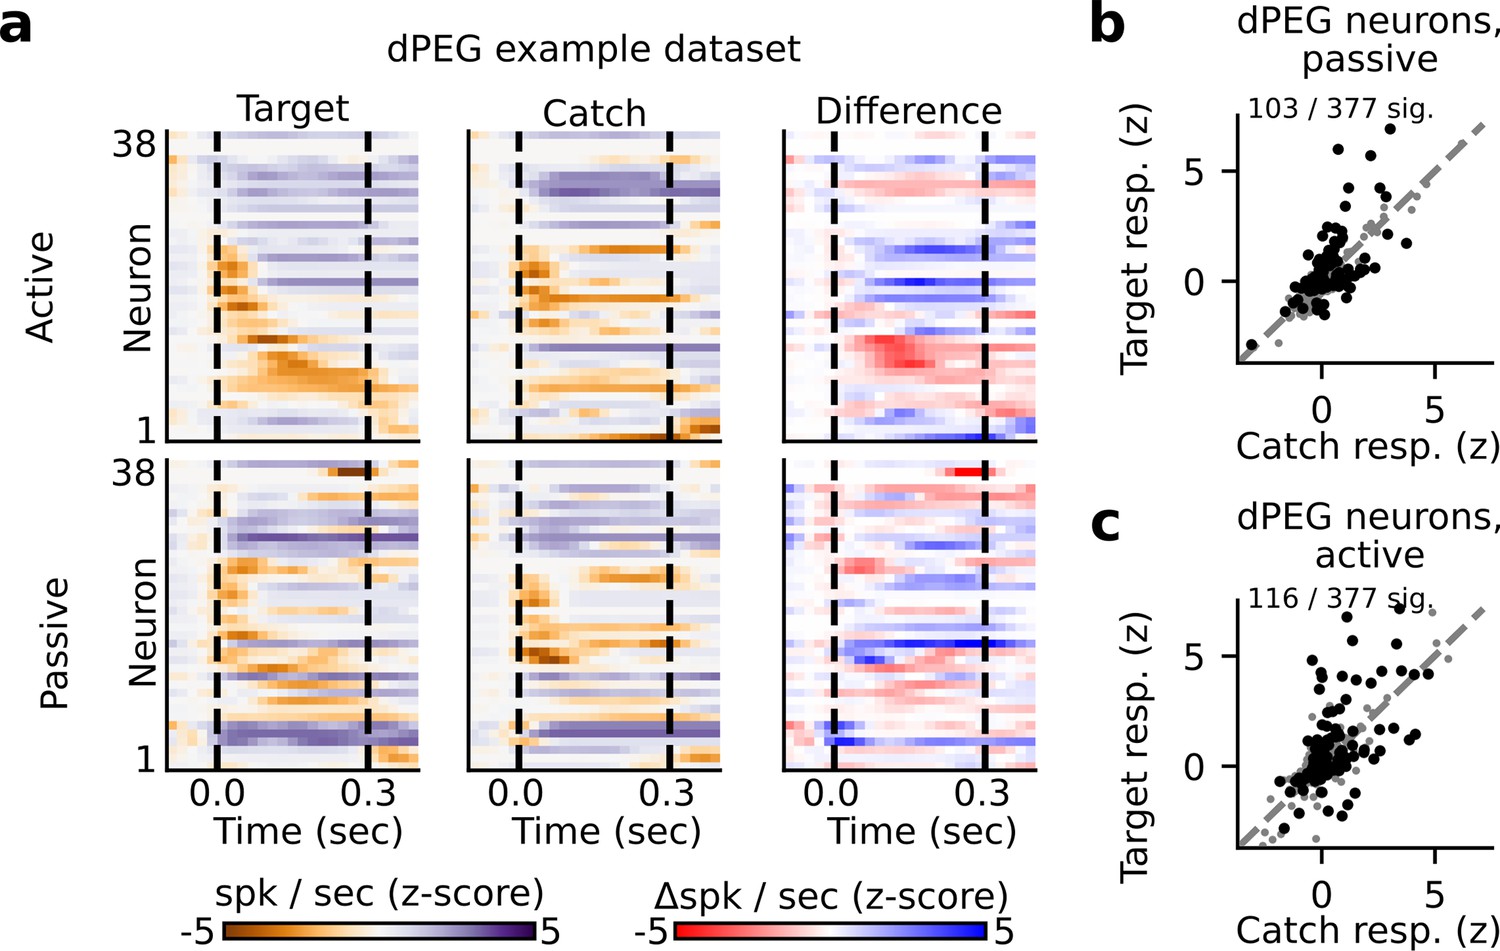
State-dependent modulation of singe neuron target vs. catch discrimination in dPEG.
(a) Example peristimulus time histogram (PSTH) responses from a single recording site in dPEG. Heatmap color in each row indicates the PSTH amplitude of one neuron. Dashed lines indicate sound onset/offset. Spikes were binned (20 ms), z-scored, and smoothed (30 ms Gaussian kernel). Example target responses are to the pure tone (Inf dB) target. Difference is computed as the z-scored response to the target minus the z-scored catch response (resulting in a difference shown in units of z-score). (b, c) Mean z-scored response evoked by catch vs. Inf dB stimulus for each dPEG neuron across passive (b) and active (c) trials. Responses were defined as the total number of spikes recorded during the 300 ms of sound presentation (area between dashed lines in panel A). Neurons with a significantly different response to the catch vs. target stimulus are indicated in black and quantified on the respective figure panel.
Figure 2—figure supplement 3
Single neuron target vs. catch raster plots for all A1 recording sites.
Example peristimulus time histogram (PSTH) responses from all recording sites in A1. Each group of six panels corresponds to a single recording site, as in Figure 2. Heatmap color in each row of each panel indicates the PSTH amplitude of one neuron. Dashed lines indicate sound onset/offset. Spikes were binned (20 ms), z-scored, and smoothed (30 ms Gaussian kernel). Example target responses are to the pure tone (Inf dB) target. Difference is computed as the z-scored response to the target minus the z-scored catch response (resulting in a difference shown in units of z-score).
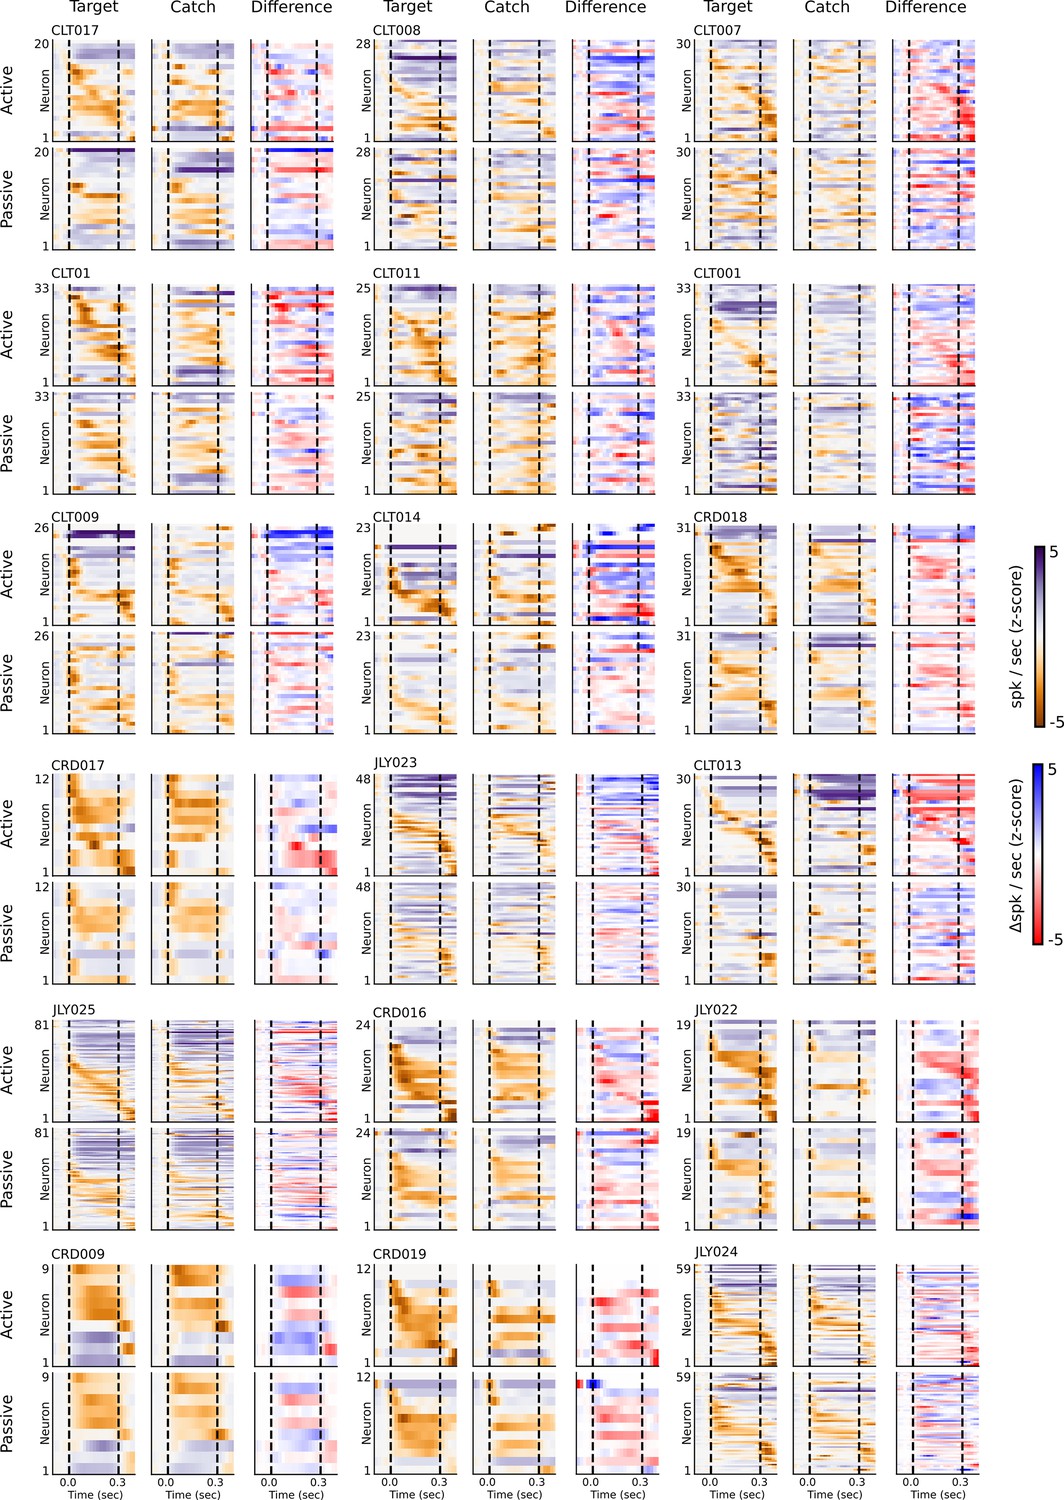
Figure 2—figure supplement 4
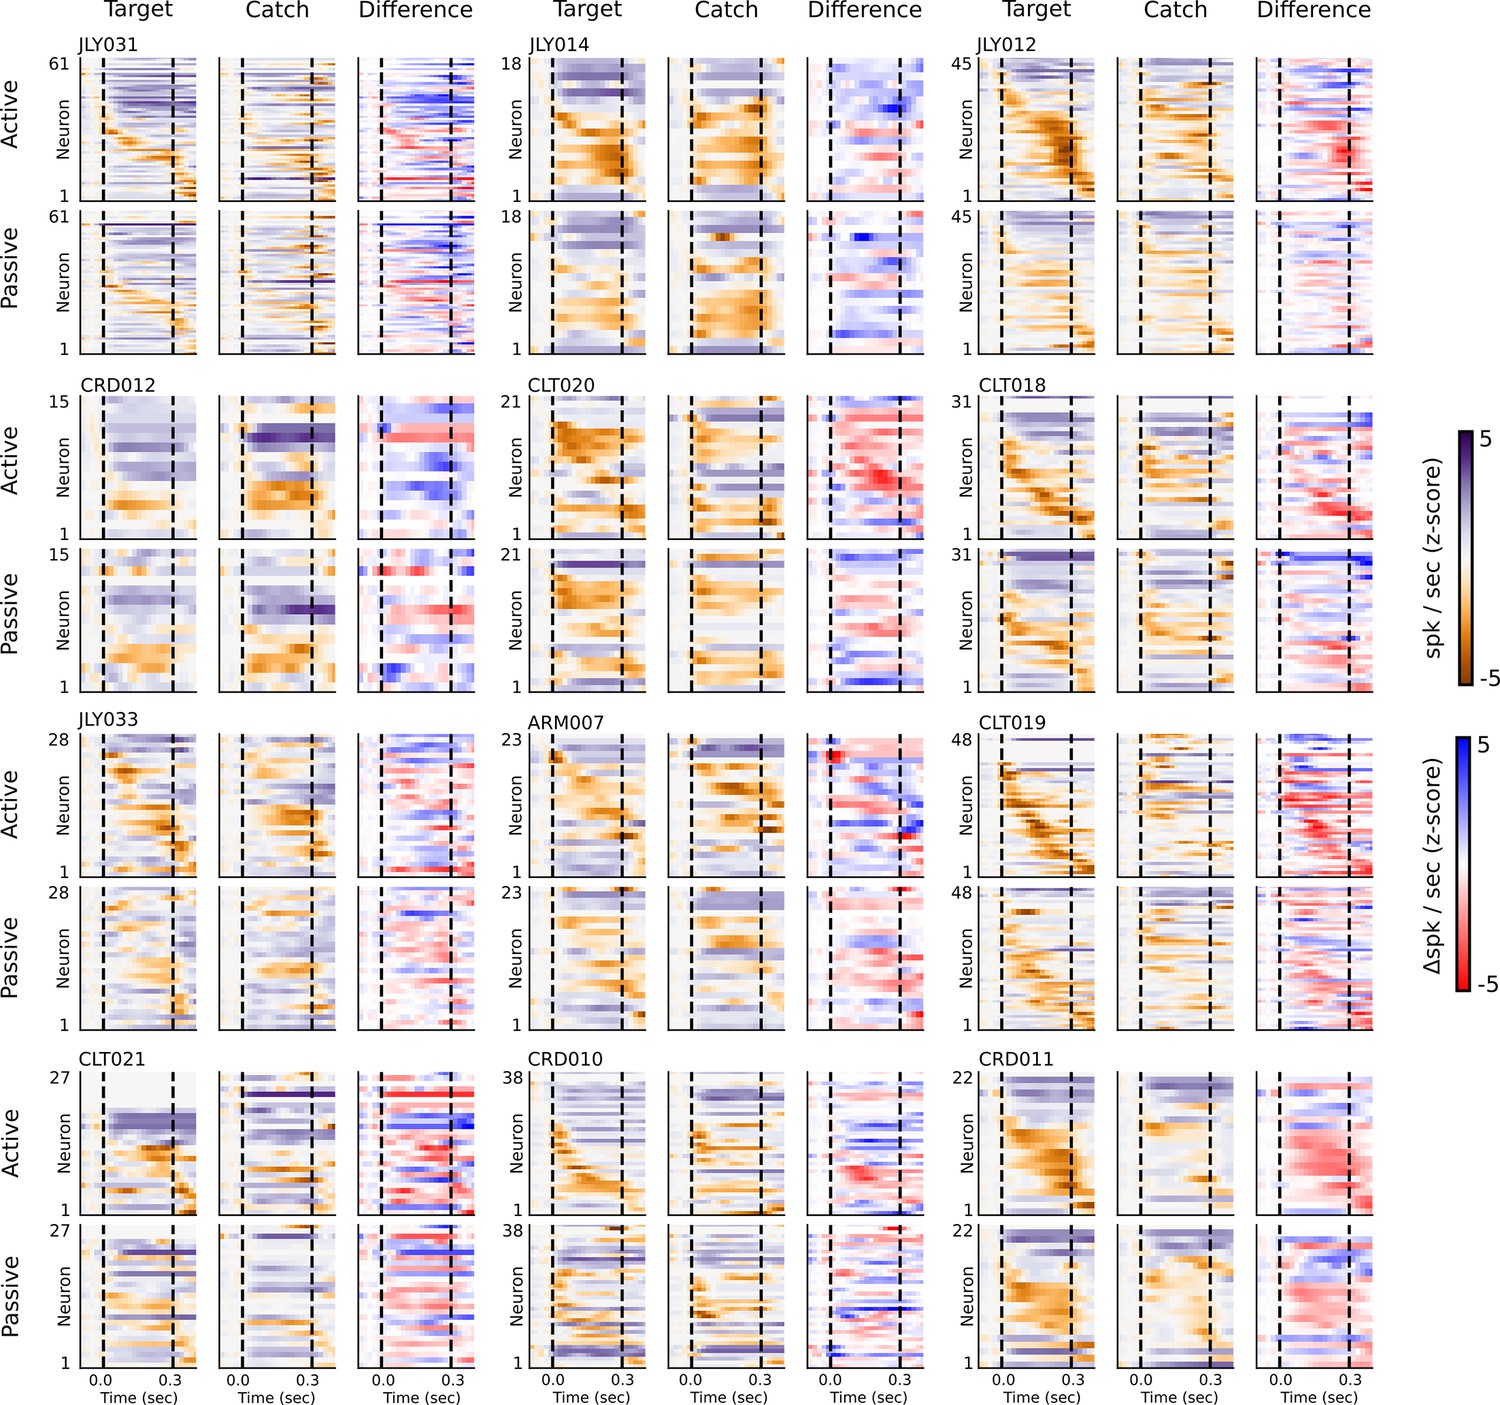
Single neuron target vs. catch raster plots for all dPEG recording sites.
Example peristimulus time histogram (PSTH) responses from all recording sites in dPEG. Each group of six panels corresponds to a single recording site, as in Figure 2. Heatmap color in each row of each panel indicates the PSTH amplitude of one neuron. Dashed lines indicate sound onset/offset. Spikes were binned (20 ms), z-scored, and smoothed (30 ms Gaussian kernel). Example target responses are to the pure tone (Inf dB) target. Difference is computed as the z-scored response to the target minus the z-scored catch response (resulting in a difference shown in units of z-score).
Figure 3 with 2 supplements
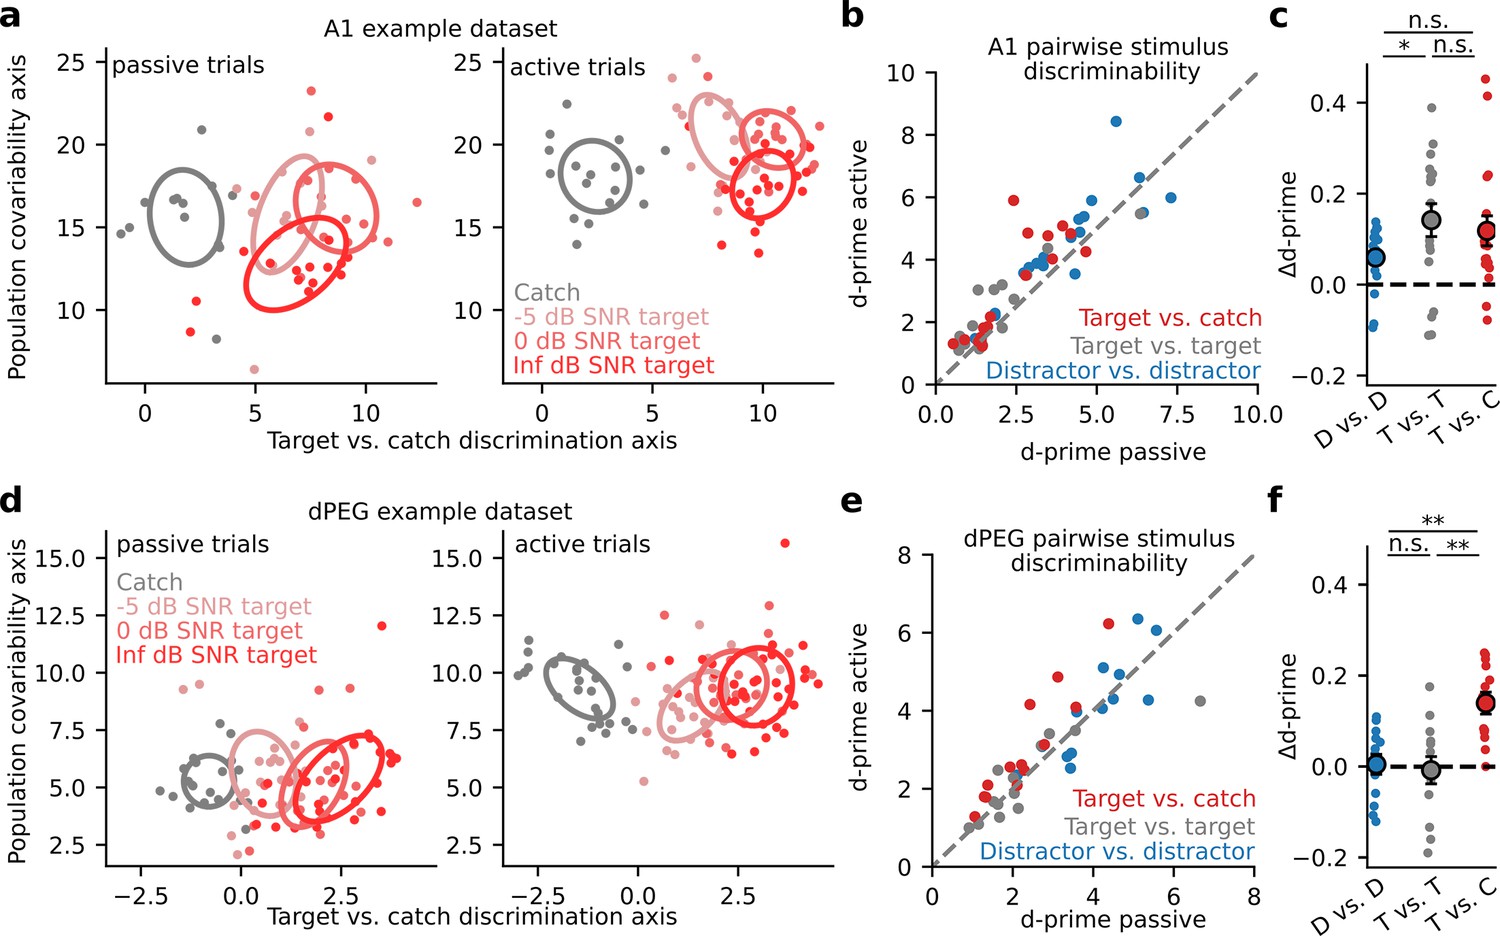
Selective enhancement of task-relevant category representation in the secondary auditory cortex.
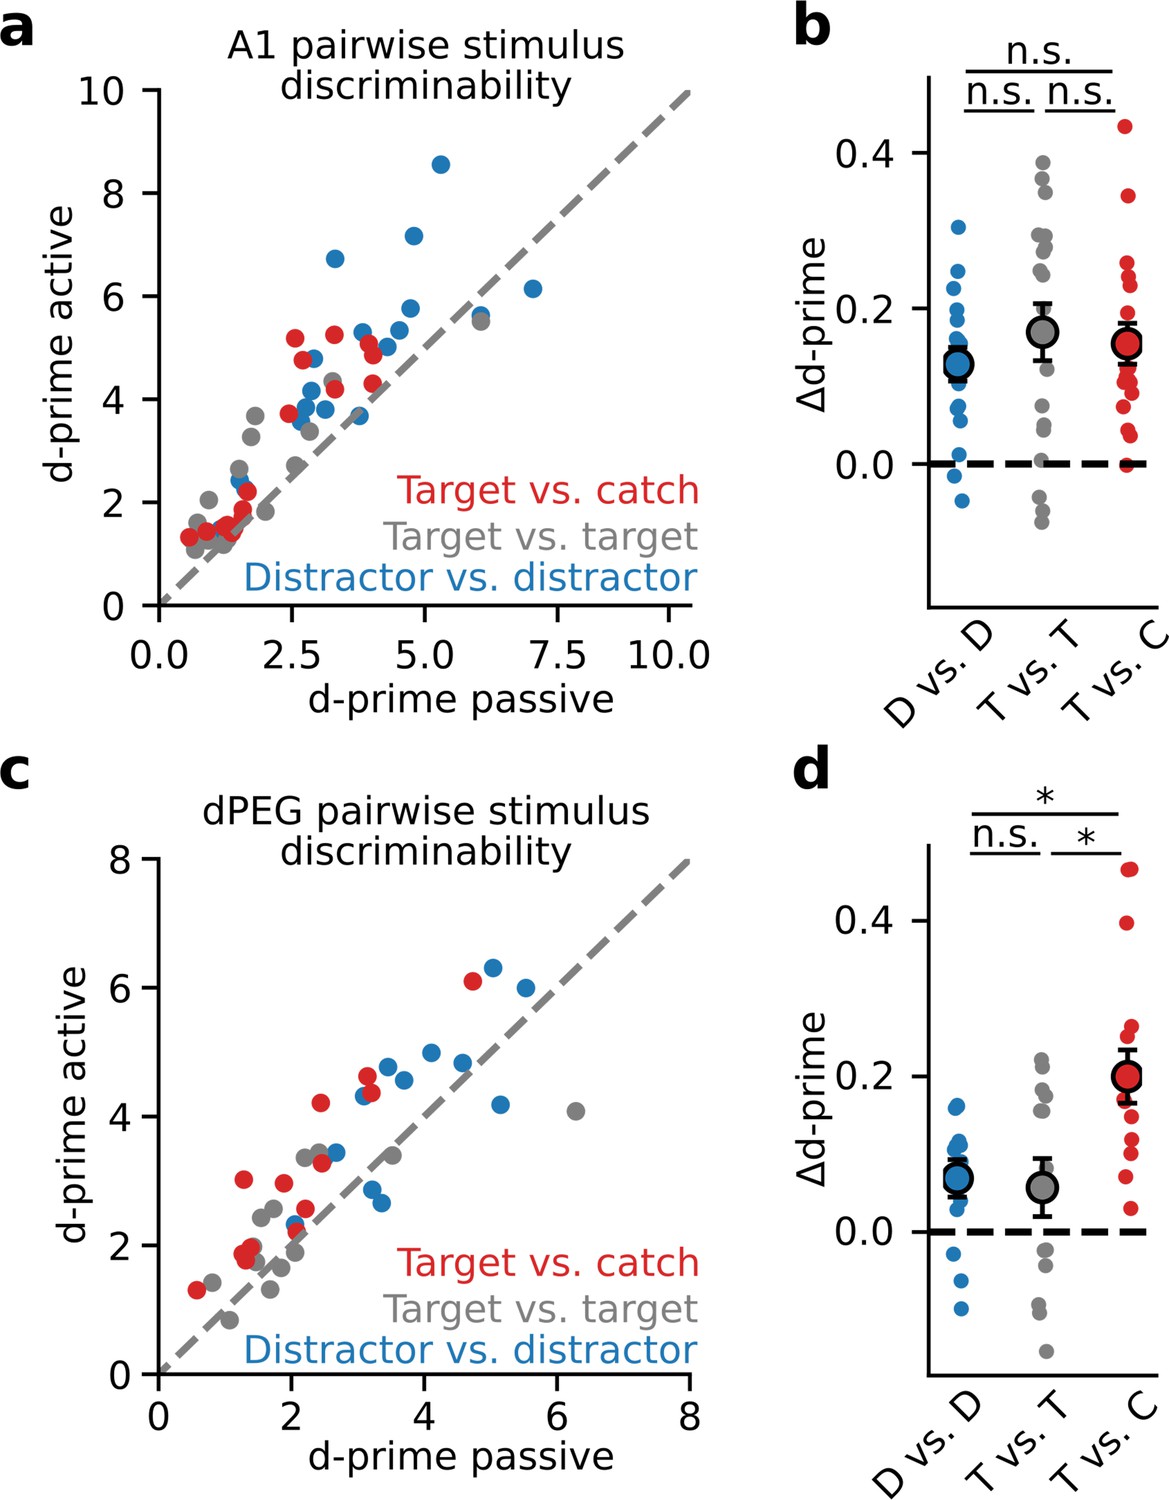
(a) Left: Representative A1 population activity during passive listening projected into a two-dimensional space optimized for discriminating target versus catch responses. Each dot indicates the population response on a single trial, color indicates different noise (catch) or tone-in-noise (target) stimuli, and ellipses describe the standard deviation of responses across trials. The degree of ellipse overlap provides a visualization of the neural discriminability (d-prime) between the corresponding stimuli. Right: A1 population activity during active behavior. (b) Mean population d-prime between sounds from each category (target vs. catch, target vs. target, and distractor vs. distractor, Figure 1C) for each A1 recording site (n=18 sessions, n=3 animals). (c) Δd-prime is the difference between active and passive d-prime, normalized by their sum (D vs. D / T vs. T p=0.048, Wilcoxon signed-rank test). Each small dot represents the mean for a single A1 recording site, as in panel b (n=18 sessions, n=3 animals). Large dots and error bars represent the mean and standard error across sessions. (d) Single-trial population responses for a single site in non-primary auditory cortex (dPEG), plotted as in A. (e) Passive vs. Active category discriminability for dPEG recording sites, plotted as in B (n=12 sessions, n=4 animals). (f) Data shown as in panel c but for changes in discriminability per category in dPEG (n=12 sessions, n=4 animals). Δd-prime for target vs. catch pairs (T vs. C) was significantly greater than for the other categories (D vs. D: p=0.003; T vs. T: p=0.005, Wilcoxon signed-rank test).
Figure 3—figure supplement 1
Pupil dynamics reflect both generalized arousal as well as trial outcome.
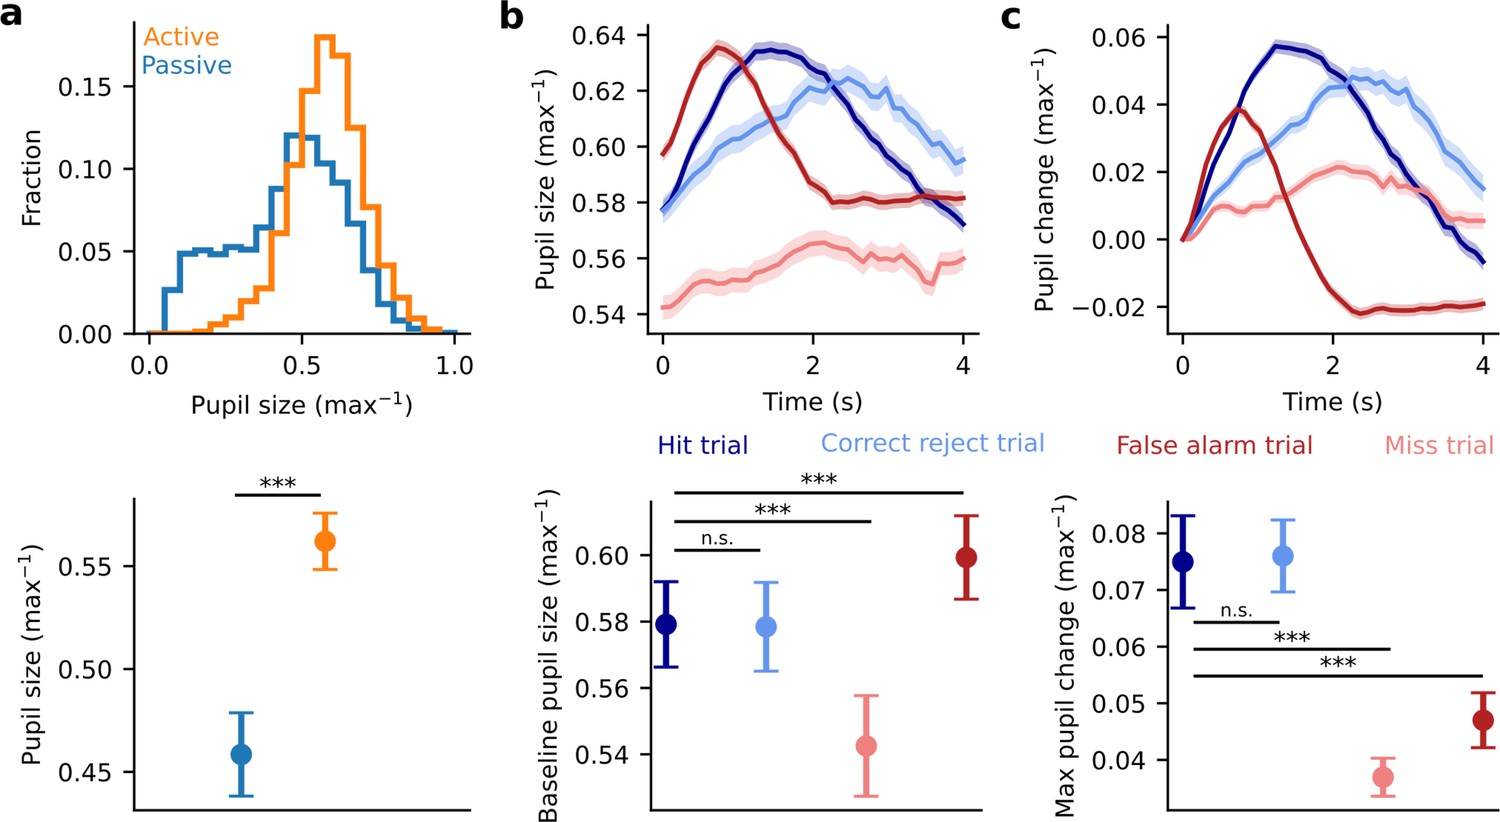
(a) Top: Histogram of pupil size across all experiments (n=39 sessions, n=4 animals) during active (orange) and passive (blue) trials. Pupil size is normalized to the max pupil size observed within each experiment. Bottom: Mean pupil size +/-the standard error under each condition. Data were first averaged within each experiment before computing the mean, and standard error across experiments, and before performing the significance test. Pupil size was significantly larger on active trials than on passive trials (p=1.48e-6, Wilcoxon signed rank test) (b) Top: Raw, trial-weighted average of per-trial pupil on hit (dark blue), correct reject (light blue), false alarm (dark red), and miss (light red) trials. Bottom: Summary of the mean pre-trial pupil for each type of trial outcome. Data were first averaged within each experiment before computing the mean, and the standard error, and before performing significance tests (hit vs. correct reject p=0.36, hit vs. miss p=8.81e-5, hit vs. false alarm p=2.83e-5, Wilcoxon signed-rank test). (c). Top: Same as in (b) after first normalizing pupil size to the pretrial mean. Bottom: Summary of the max change in pupil size during each trial for each type of trial outcome. Data were first averaged within each experiment before computing the mean, and the standard error, and before performing significance tests (hit vs. correct reject p=0.29, hit vs. miss p=3.01e-5, hit vs. false alarm p=1.62e-5, Wilcoxon signed-rank test).
Figure 3—figure supplement 2
Selective enhancement of task-relevant category representation in the secondary auditory cortex is not affected by global arousal.
Same as in Figure 3, without first correcting for pupil-indexed arousal explainable variance (i.e. decoding stimulus identity from raw neural activity, without controlling for global arousal). (a) Mean population d-prime between sounds from each category (target vs. catch, target vs. target, and distractor vs. distractor, Figure 1C) for each A1 recording site (n=18 sessions, n=3 animals). (b) Δd-prime is the difference between active and passive d-prime, normalized by their sum (no significant difference, Wilcoxon signed-rank test). Each small dot represents the mean for a single A1 recording site, as in panel b (n=18 sessions, n=3 animals). Large dots and error bars represent the mean and standard error across sessions. (c) Passive vs. Active category discriminability for dPEG recording sites, plotted as in A (n=12 sessions, n=4 animals). (d) Data plotted as in panel b for changes in discriminability per category in dPEG (n=12 sessions, n=4 animals). Δd-prime for target vs. catch pairs (T vs. C) was significantly greater than for the other categories (D vs. D: p=0.013; T vs. T: p=0.017, Wilcoxon signed-rank test).
Figure 4 with 1 supplement
Changes in neural decoding are correlated with behavior performance in dPEG, but not A1.
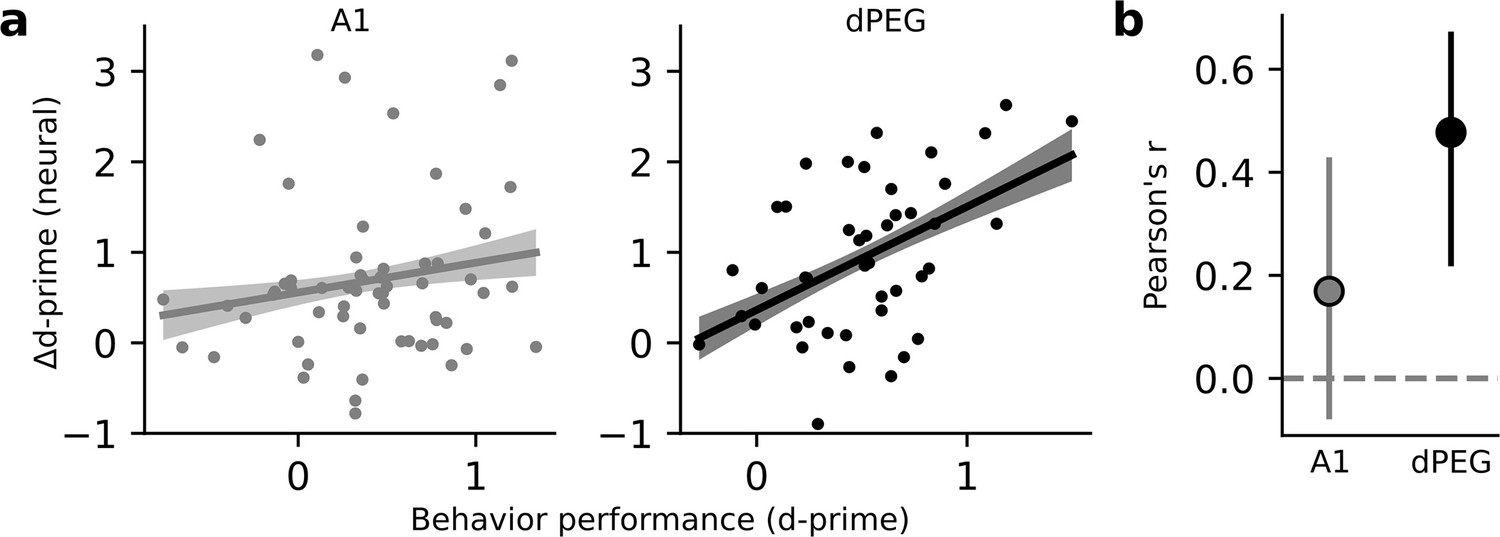
(a) Scatter plot compares neural Δd-prime (active minus passive) for all tone-in-noise target vs. catch noise combinations against the corresponding behavioral d-prime for that target vs. catch discrimination. Line shows the best linear fit, and shading represents a bootstrapped 95% confidence interval for slope. Left, data from A1 (n=60 unique target vs. catch combinations, n=3 animals, 18 recording sessions). Right, data from dPEG (n=44 unique target vs. catch combinations, n=4 animals, 12 recording sessions). (b) Pearson correlation between neural d-prime and behavioral d-prime in each brain region. Error bars indicate bootstrapped 95% confidence intervals (A1: p=0.082; dPEG: p=0.002, bootstrap test).
Figure 4—figure supplement 1
Choice decoding in auditory cortex primarily reflects impulsivity.
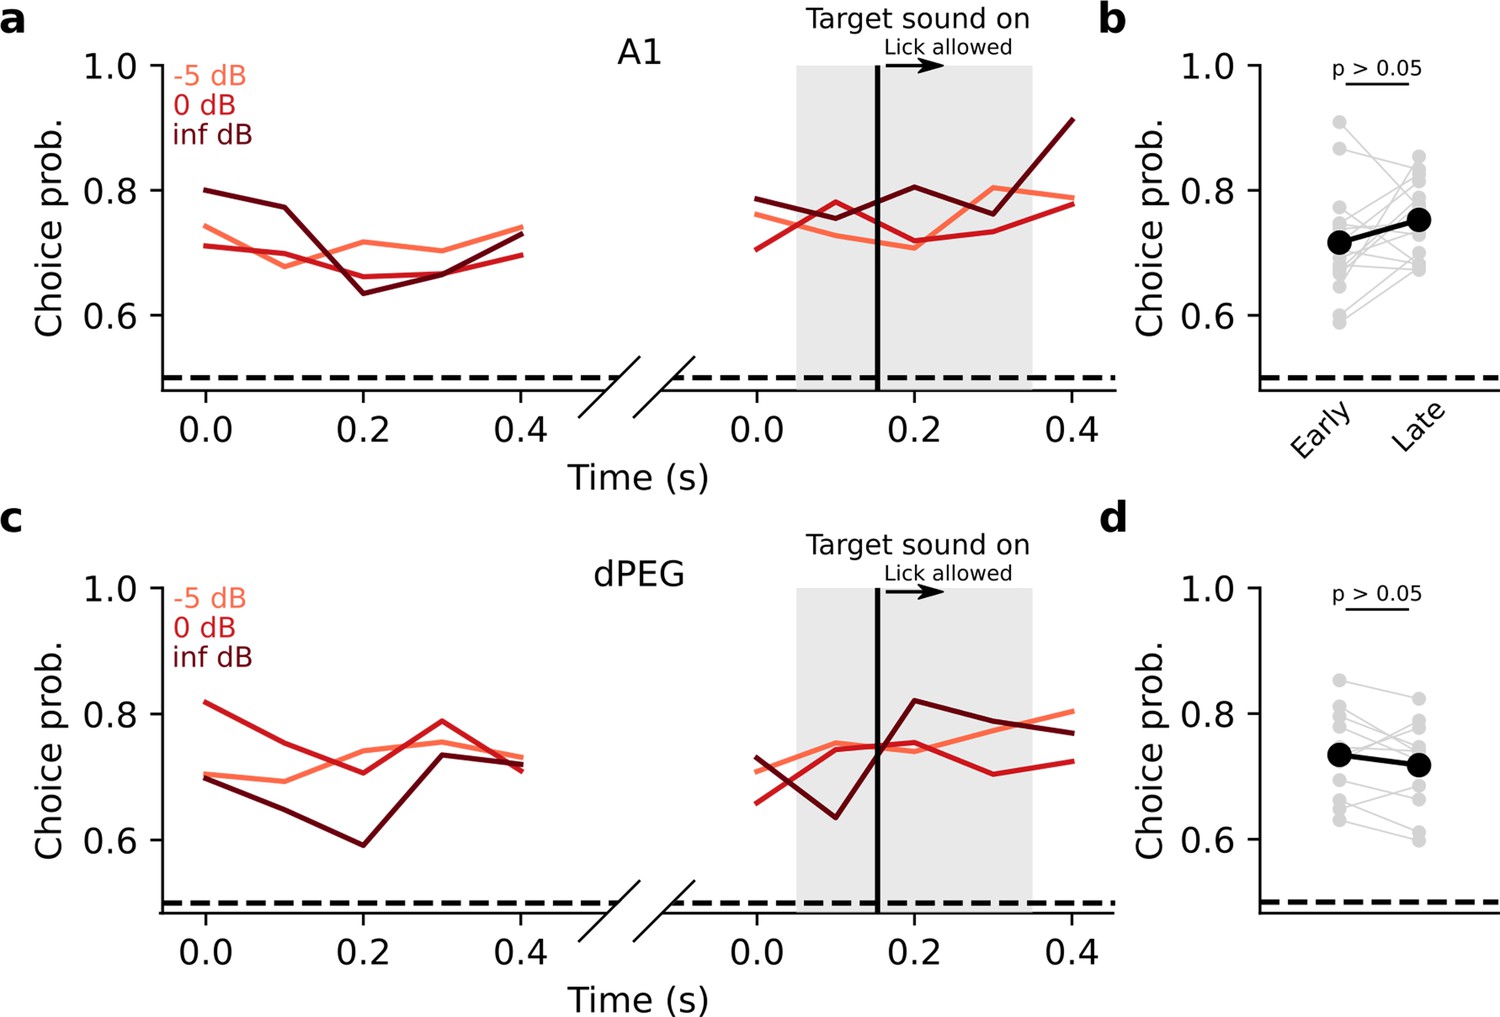
(a) Mean choice probability on hit vs. miss trials across all A1 experiments, split by target stimulus signal-to-noise ratio (SNR). Gray shading represents the time when the target sound stimulus is on. The vertical black line indicates when animals could begin licking in response to the target sound. Choice decoding is shown for the first distractor sound presentation on each trial (curves on the left) and for the target sound presentation (curves on the right). (b). Comparison of mean choice probability during the first distractor sound (Early) to the mean choice probability during the target sound (Late). Each gray line represents one experiment, and the black line is the mean across experiments. Only bins prior to the lick window onset were analyzed to avoid motor activity confounds. There was no significant difference between early and late choice probability (p>0.05, Wilcoxon signed-rank test). (c, d) Same as a-b for dPEG experiments.
Figure 5 with 2 supplements
Task-related changes in shared population covariability do not impact the coding of task-relevant features.
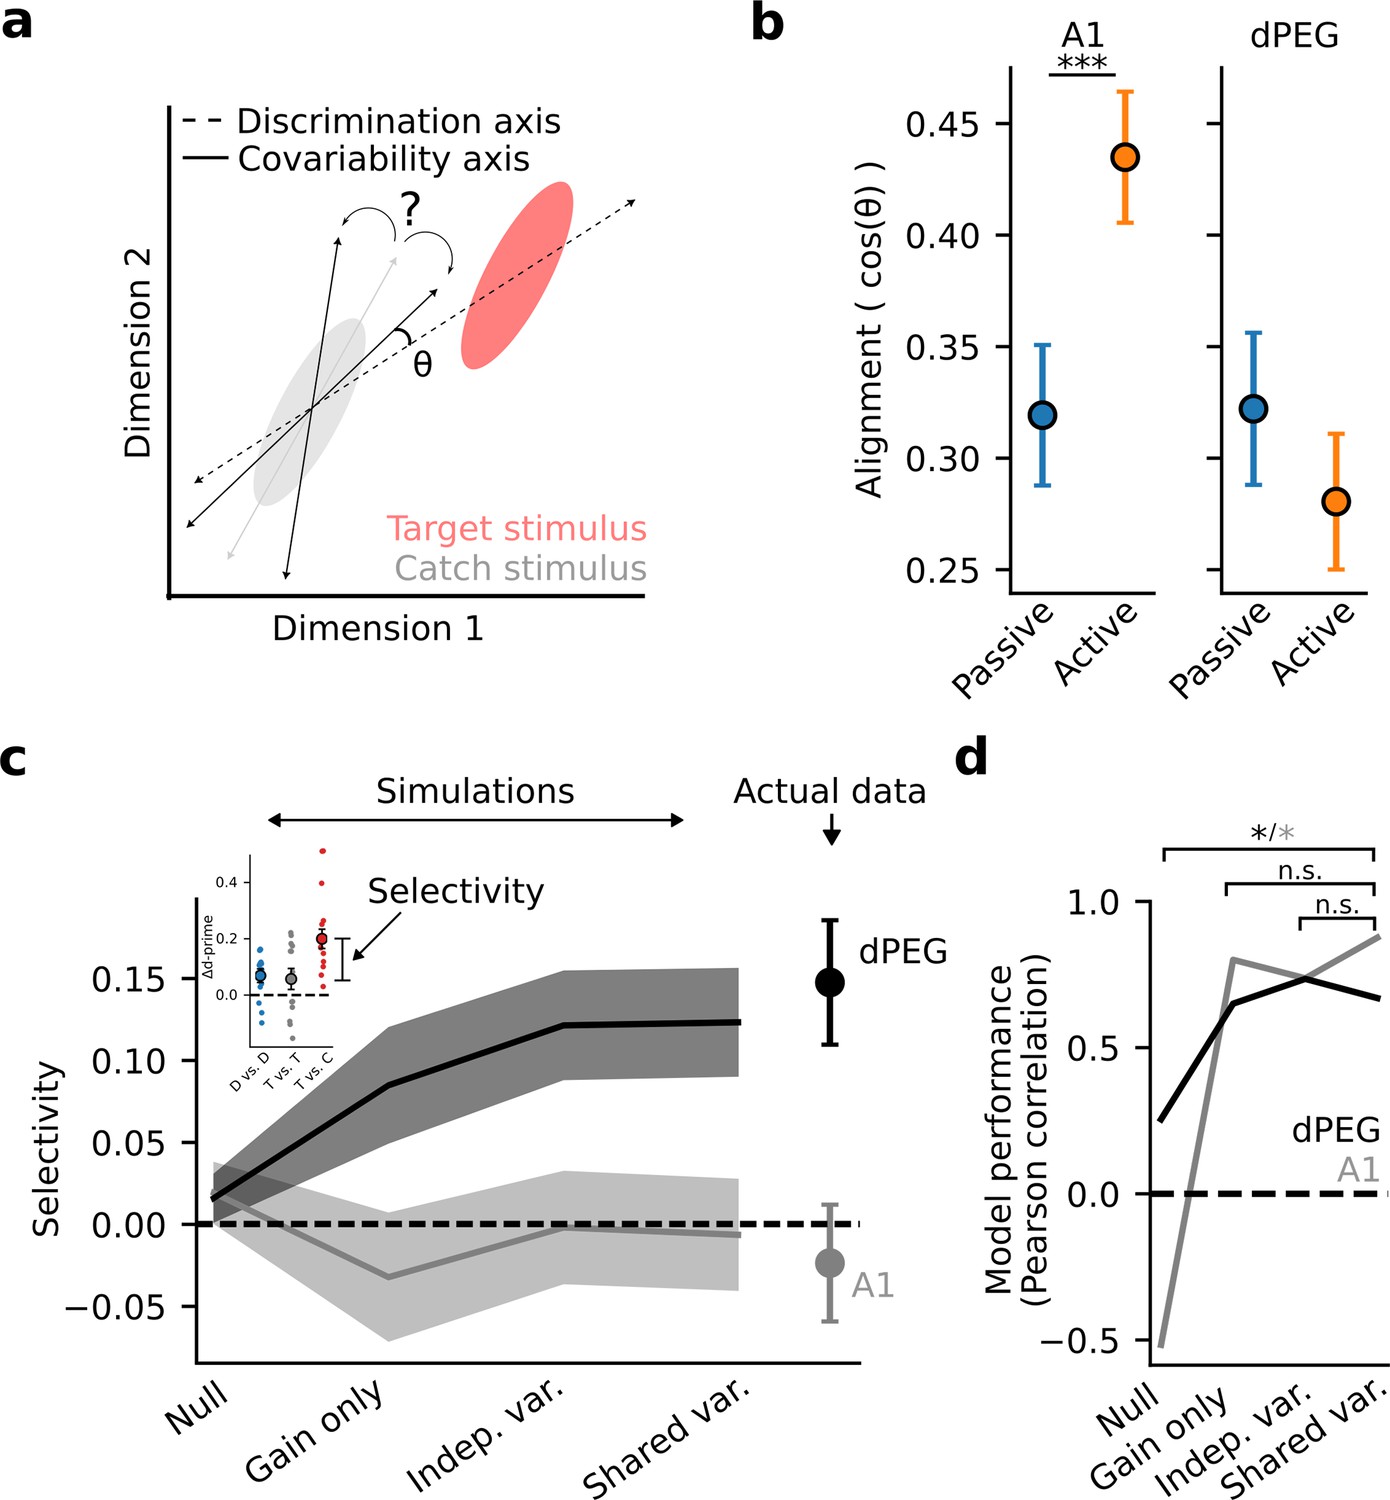
(a) Schematic of population response over many trials to a catch stimulus (gray) and target stimulus (red), projected into a low-dimensional space. Dashed line indicates the sensory discrimination axis and the gray line indicates the axis of shared variability across trials during passive listening. Black lines indicate possible rotations in the axis of shared variability either toward or away from the discrimination axis during the task-engaged state. A larger angle (θ) between the shared variability and the discrimination axes leads to increased discrimination accuracy. (b) Alignment (cosine similarity) between the discrimination and shared variability axes during passive and active conditions. Error bars represent the standard error of the mean. The axes become more aligned during task engagement in A1 (p<0.001, Wilcoxon signed-rank test) and do not change in dPEG. (c) Mean selective enhancement of neural target vs. catch discriminability across recording sites for simulated and actual data. Shading represents the standard error of the mean across experiments (A1: n=18 sessions, n=3 animals, dPEG: n=12 sessions, n=4 animals). Selective enhancement is the difference in Δd-prime for target vs. catch and target vs. target (inset). Simulations sequentially introduced task-dependent changes in mean sound-evoked response gain, single neuron variance, and population covariance matching changes in the actual neural data. (d) Model performance is defined as the correlation coefficient between simulated and actual selective enhancement across all sessions. Performance of each model was evaluated against the performance of the shared variance model to check for stepwise improvements in predictions. Stars indicate significance at alpha = 0.05 level, bootstrap test. Colors indicate brain regions: dPEG/black, A1 /gray.
Figure 5—figure supplement 1
Modulation of population covariability metrics by task engagement.
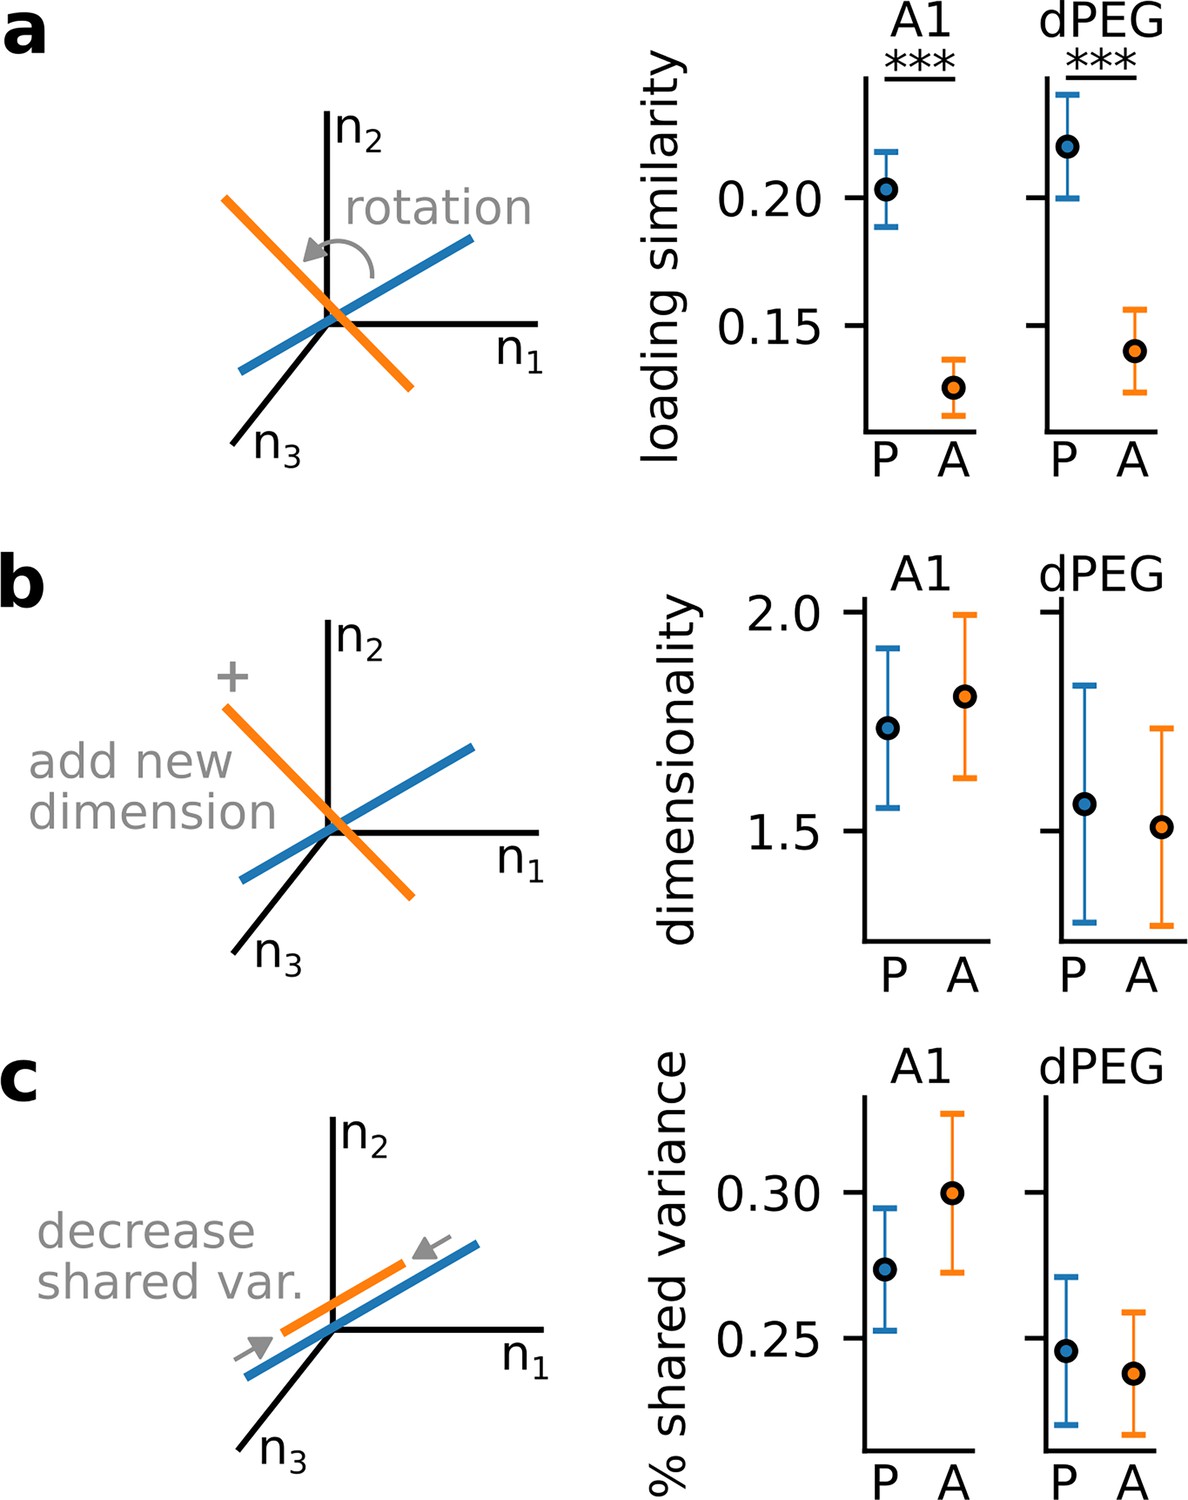
Population metrics extracted from factor analysis model fit. Models were fit to the catch stimulus only to control for variability due to stimulus identity. P=passive, A=active. (a) Loading similarity is defined as the similarity of the neuronal loading weights onto the primary covariability axis (largest variance factor). Ranges from 0 (dissimilar) to 1 (similar). Loading similarity was significantly larger during passive conditions for both brain regions (A1: p=6.8e-5, n=18 sessions/3 animals; dPEG: p=6.9e-5, n=12 sessions/4 animals; Wilcoxon signed-rank test). (b) Dimensionality is defined as the number of significant dimensions of shared variability in the data determined by log-likelihood. No significant change in dimensionality was observed in either brain region. (c) % shared variance is defined as the percentage of single neuron variance that can be explained by the shared, covariability axes. Ranges from 0 to 1. No significant change in % shared variance was observed in either brain region. In all panels, dots represent the mean across sessions (A1: n=18 sessions, n=3 animals; dPEG: n=12 sessions, n=4 animals) and error bars show the standard error of the mean.
Figure 5—figure supplement 2
Modeling task-dependent changes in shared population covariability improves predictions of decoding changes in A1, but not dPEG.
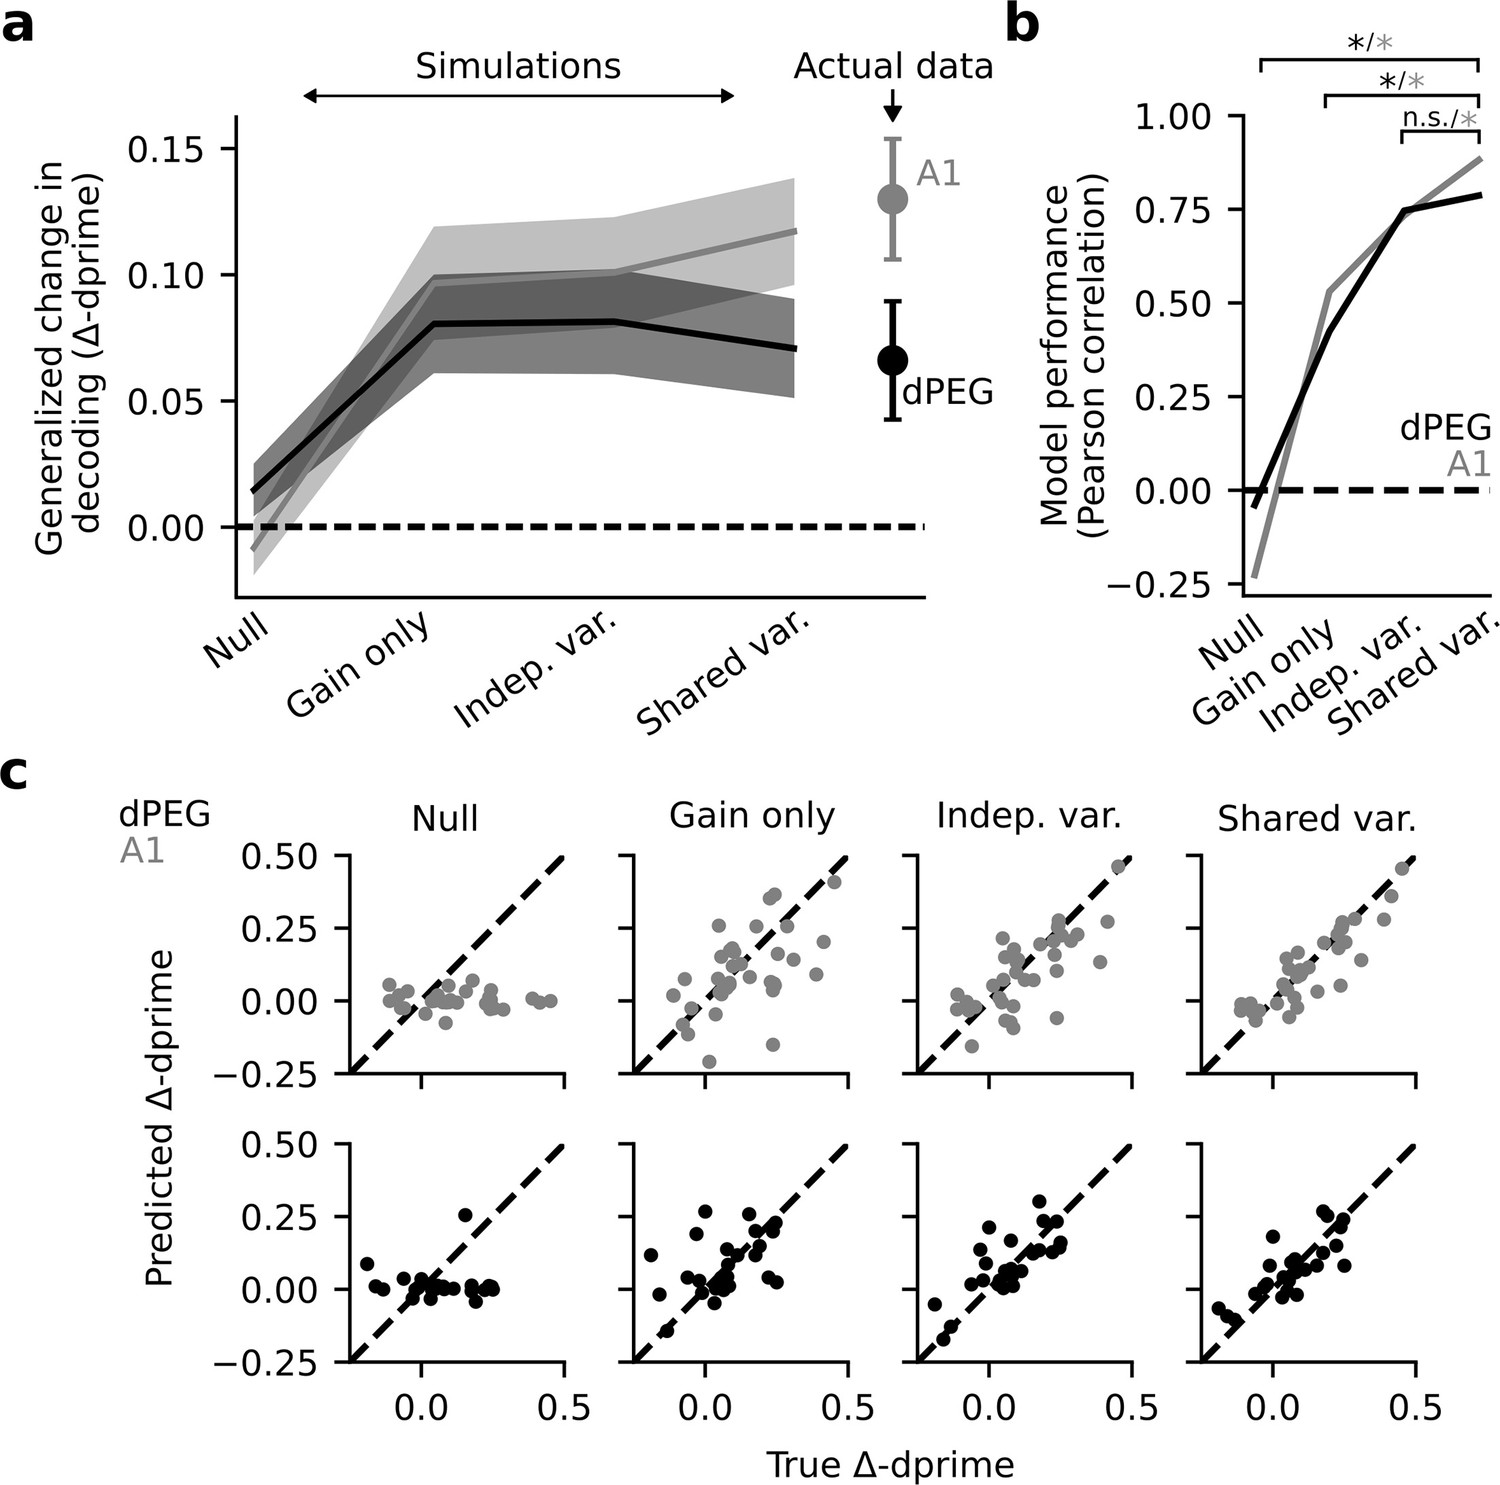
(a) Mean Δd-prime across all target vs. target and target vs. catch stimulus pairs for each factor analysis based simulation: Null model, gain only model, independent variance model, and shared variance model. Actual Δd-prime is shown on the right. Shading represents the standard error of the mean across experiments (A1: n=18 sessions, n=3 animals, dPEG: n=12 sessions, n=4 animals). (b) Model performance is measured as the Pearson correlation between actual and predicted Δd-prime. In A1, model performance increases monotonically. In dPEG, including gain and independent variance both improve predictions but there is no significant improvement when including shared population covariability. Significance measured using the bootstrap test with alpha = 0.05. (c) Scatter plots show predicted vs. actual Δd-prime for each factor analysis simulation in both dPEG (black) and A1 (gray). Model performance (shown in B) was measured as the Pearson correlation of these scatter plots.
Additional files
Download links
A two-part list of links to download the article, or parts of the article, in various formats.
Downloads (link to download the article as PDF)
Open citations (links to open the citations from this article in various online reference manager services)
Cite this article (links to download the citations from this article in formats compatible with various reference manager tools)
Task-specific invariant representation in auditory cortex
eLife 12:RP89936.
https://doi.org/10.7554/eLife.89936.3


