Membrane contact sites regulate vacuolar fission via sphingolipid metabolism
- Graduate School of Integrated Sciences for Life, Hiroshima University, Japan
- School of Applied Biological Science, Hiroshima University, Japan
Figures
Figure 1 with 1 supplement
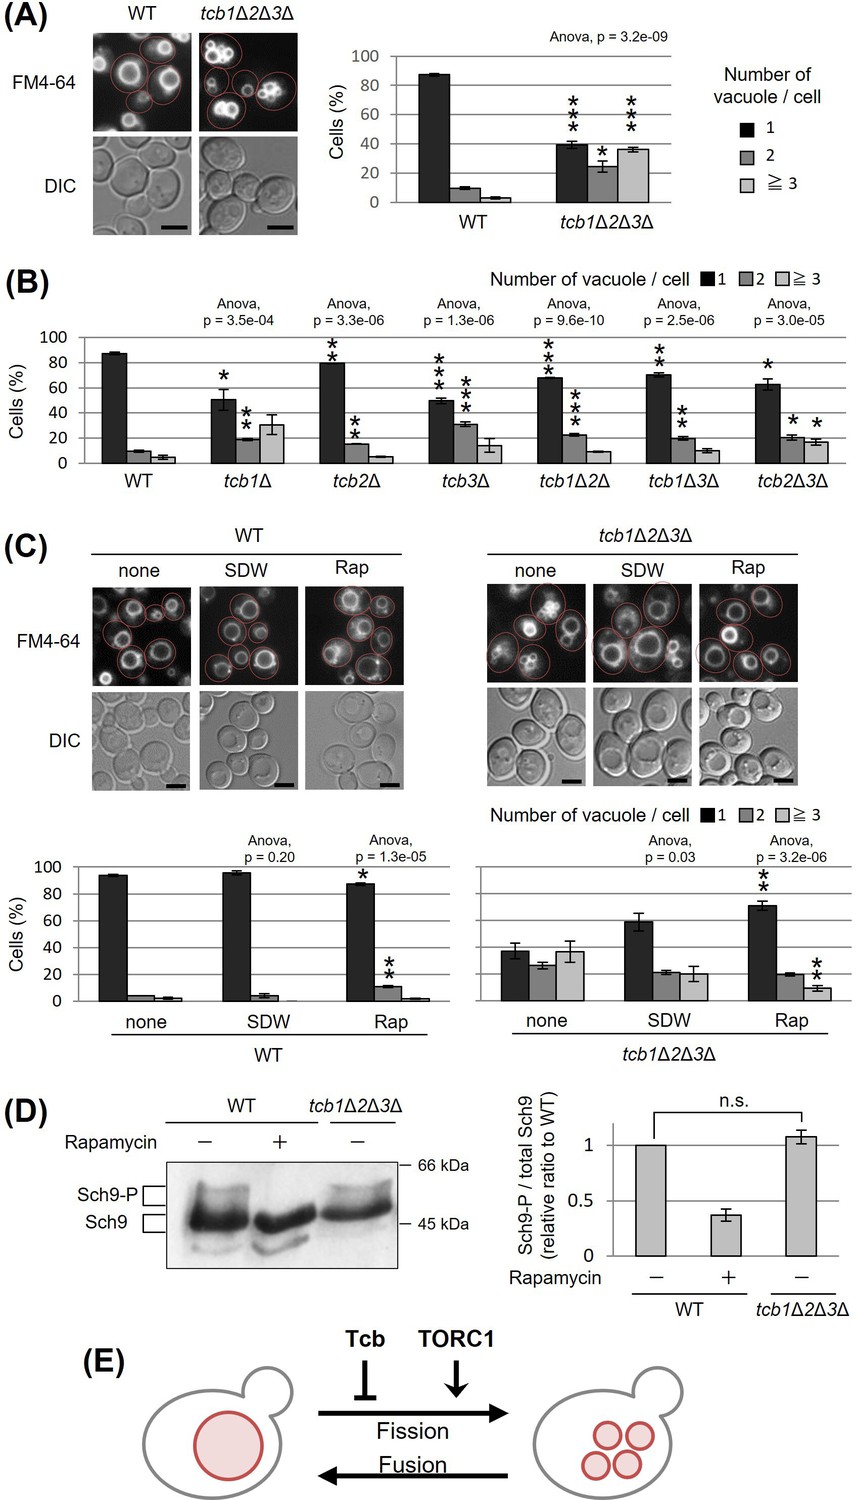
Deletion of tricalbin proteins causes vacuole fragmentation.
(A, B) Cells (FKY2577 and FKY2927 in A; FKY2577, FKY2909, FKY3819, FKY2924, FKY3023, FKY3820, and FKY3008 in B) were grown overnight at 25°C in YPD. Then vacuoles were stained with FM4-64 and imaged by fluorescence microscopy. Scale bar, 5 mm. The number of vacuoles per cell was counted and categorized into one of three groups. The data represent mean ± standard error (SE) of three independent experiments, each based on more than 100 cells. *p < 0.05, **p < 0.01, and ***p < 0.001 by Student’s t-test compared with wild-type (WT). (C) Cells (FKY2577 and FKY2927) were grown overnight at 25°C in YPD. Cells were then incubated in sterile distilled water (SDW) for more than 45 min or YPD with 200 nM of rapamycin (Rap) for 2 hr. Vacuoles were stained with FM4-64 and imaged by fluorescence microscopy. Scale bar, 5 mm. The number of vacuoles per cell was counted and categorized into one of three groups. The data represent mean ± SE of more than three independent experiments, each based on more than 90 cells. *p < 0.05, **p < 0.01 by Student’s t-test compared with none treated cells. (A–C) Significant differences analysis between the pairwise combination of groups was performed using two-way analysis of variance (ANOVA). (D) Cells (FKY2577 and FKY2927) transformed with pRS416-SCH9-5HA were cultured in YPD, treated with 200 nM rapamycin (control) or untreated. The extracts from cells expressing Sch9-5HA were reacted with 2-nitro-5-thiocyanobenzoic acid and analyzed by immunoblotting using anti-HA. Phosphorylated Sch9 relative to the total Sch9 was calculated and shown in comparison to untreated WT cells. The data represent mean ± SE of three independent experiments. n.s., not significant by Student’s t-test. (E) Illustration shows that tricalbin proteins negatively regulate the vacuole fission in a target of rapamycin complex 1 (TORC1)-independent manner.
-
Figure 1—source data 1
Excel file of numerical data represented as a graph in Figure 1A.
- https://cdn.elifesciences.org/articles/89938/elife-89938-fig1-data1-v1.xlsx
-
Figure 1—source data 2
Excel file of numerical data represented as a graph in Figure 1B.
- https://cdn.elifesciences.org/articles/89938/elife-89938-fig1-data2-v1.xlsx
-
Figure 1—source data 3
Excel file of numerical data represented as two graphs in Figure 1C.
- https://cdn.elifesciences.org/articles/89938/elife-89938-fig1-data3-v1.xlsx
-
Figure 1—source data 4
Excel file of numerical data represented as a graph in Figure 1D.
- https://cdn.elifesciences.org/articles/89938/elife-89938-fig1-data4-v1.xlsx
-
Figure 1—source data 5
Original file for the Western blot analysis in Figure 1D.
- https://cdn.elifesciences.org/articles/89938/elife-89938-fig1-data5-v1.zip
-
Figure 1—source data 6
JPEG containing Figure 1D and original scans of the relevant Western blot analysis with highlighted bands and sample labels.
- https://cdn.elifesciences.org/articles/89938/elife-89938-fig1-data6-v1.zip
Figure 1—figure supplement 1
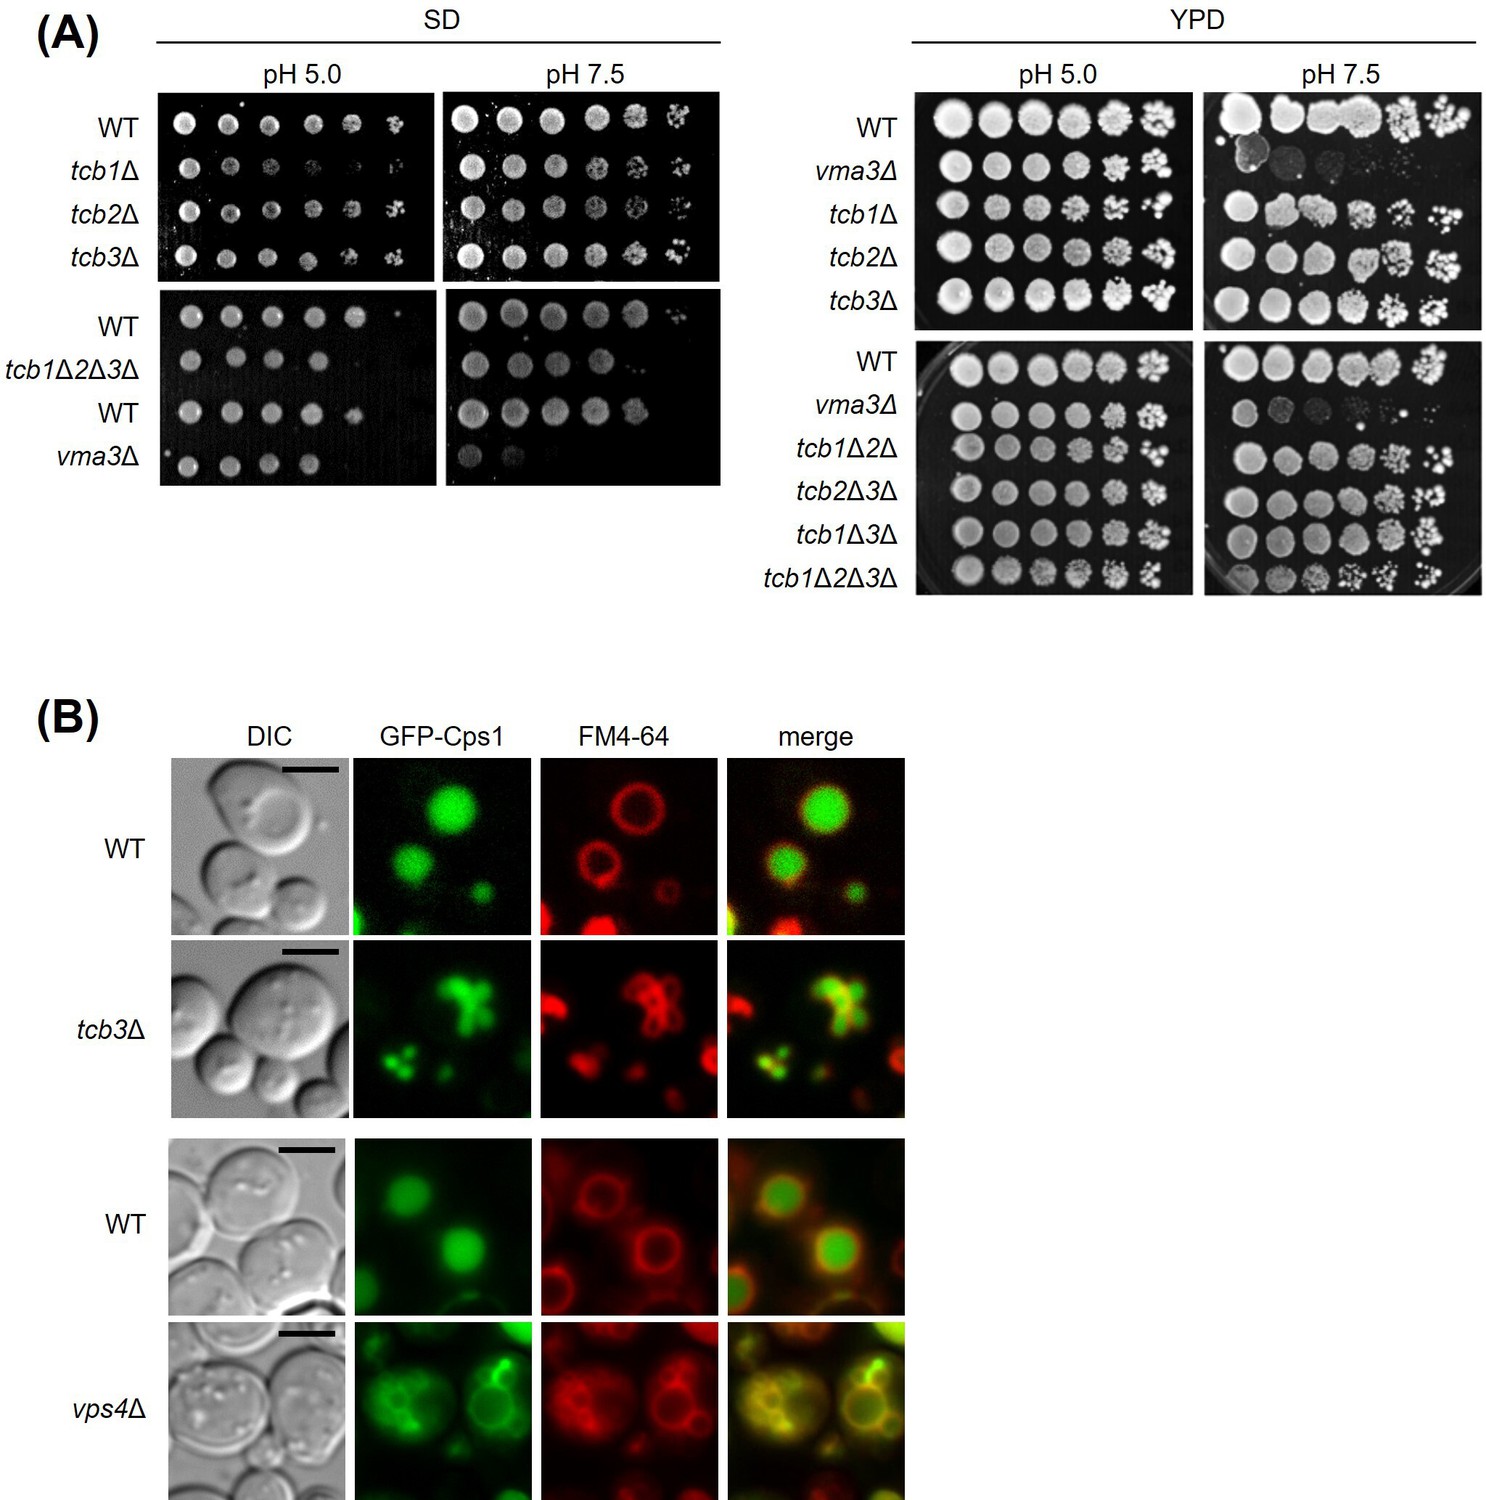
Vacuolar acidification and Cps1p delivery are not affected by tricalbin deletion.
(A) Cells (FKY2577, FKY2909, FKY3819, FKY2924, FKY2927, FKY3340, and YKC112-01) were adjusted to OD600 = 1.0 and fivefold serial dilutions were then spotted on YPD plates of indicated pH, then incubated at 25°C. (B) GFP-Cps1p fusion protein was transformed into WT (FKY2577), tcb3Δ (FKY2924), WT (FKY3340), and vps4Δ (YKC149-61) strains and analyzed its subcellular localization with respect to FM4-64-stained vacuoles using by fluorescent microscopy. Scale bar, 5 mm.
Figure 2 with 1 supplement
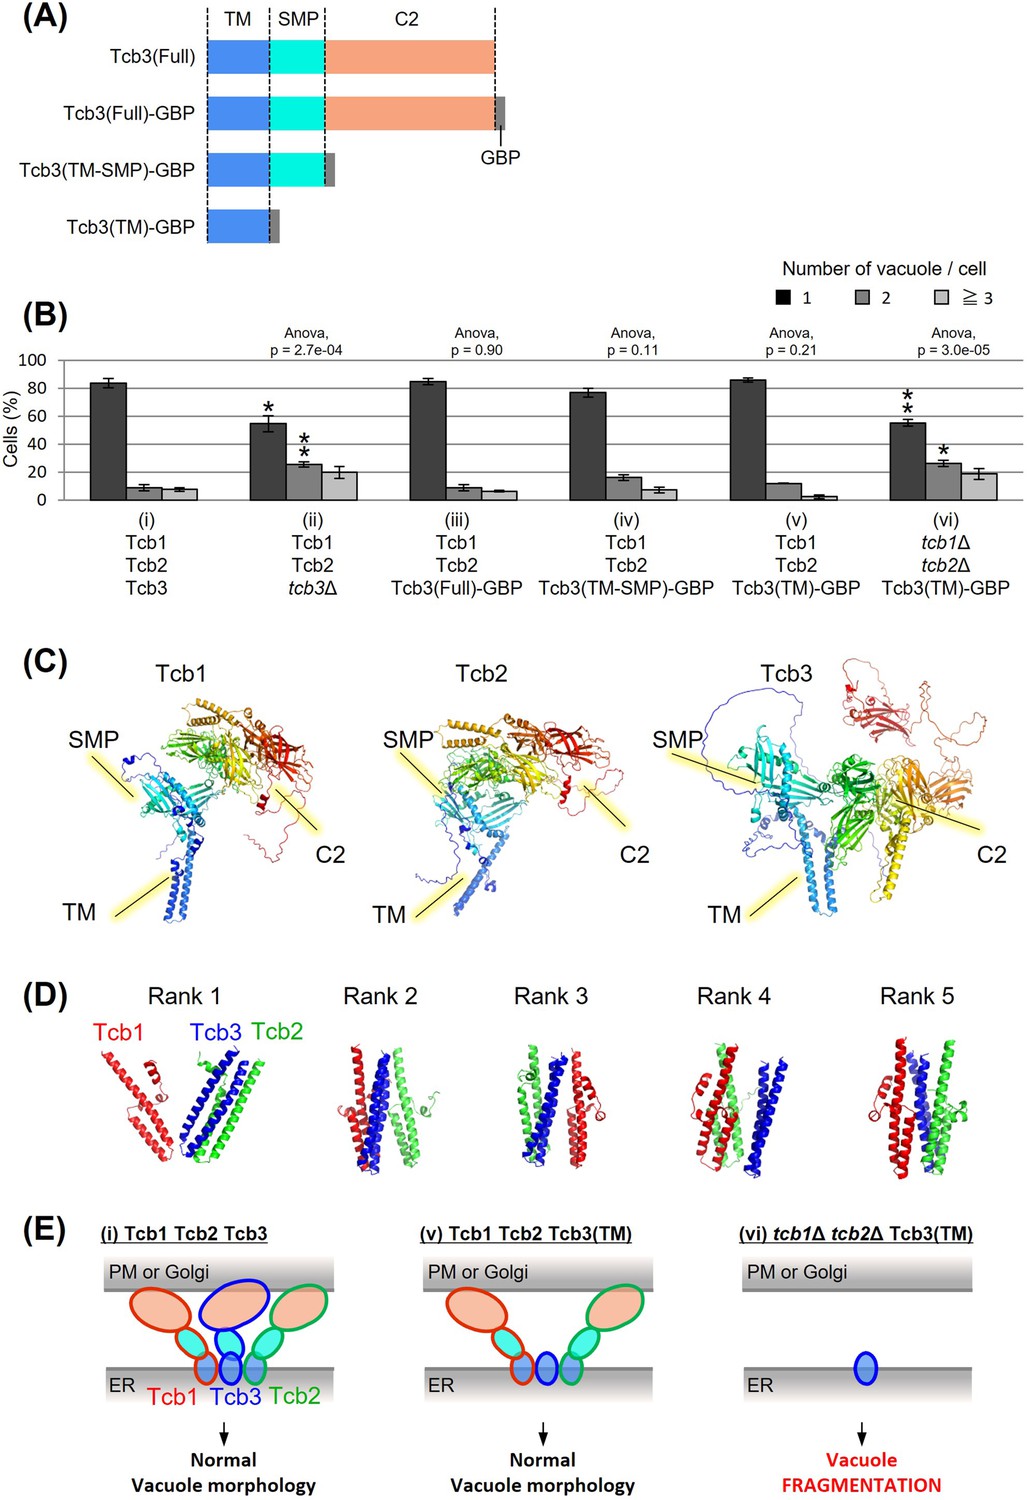
Effects of domain deletion on vacuole morphology.
(A) Diagram of domain organization of Tcb3 protein. TM, transmembrane domain; SMP, synaptotagmin-like mitochondrial lipid-binding protein; C2, calcium-dependent lipid-binding domain; GBP, GFP-binding protein. (B) Cells (FKY2577 (i), FKY2924 (ii), FKY3903 (iii), FKY3904 (iv), FKY3905 (v), and FKY4754 (vi)) were grown overnight at 25°C in YPD. Then vacuoles were stained with FM4-64 and imaged by fluorescence microscopy. The number of vacuoles per cell was counted and categorized into one of three groups. The data represent mean ± standard error (SE) of three independent experiments, each based on more than 90 cells. *p < 0.05 and **p < 0.01 by Student’s t-test compared with Tcb1 Tcb2 Tcb3 (i). Significant differences analysis between the pairwise combination of groups was performed using two-way analysis of variance (ANOVA). (C) The modeled structures of the Tcb1p, Tcb2p, and Tcb3p proteins. The ribbons and arrows in the models indicate alpha-helices and beta-sheets, respectively. (D) TM domain complex in Tcb1p (red), Tcb2p (green), and Tcb3p (blue). The rank ‘X’ indicates the order in which the complexes are most likely to form. (E) Illustrations show that TM domain of Tcb3 contributes to mediating protein interactions between the tricalbin family to maintain vacuolar morphology.
-
Figure 2—source data 1
Excel file of numerical data represented as a graph in Figure 2B.
- https://cdn.elifesciences.org/articles/89938/elife-89938-fig2-data1-v1.xlsx
Figure 2—figure supplement 1
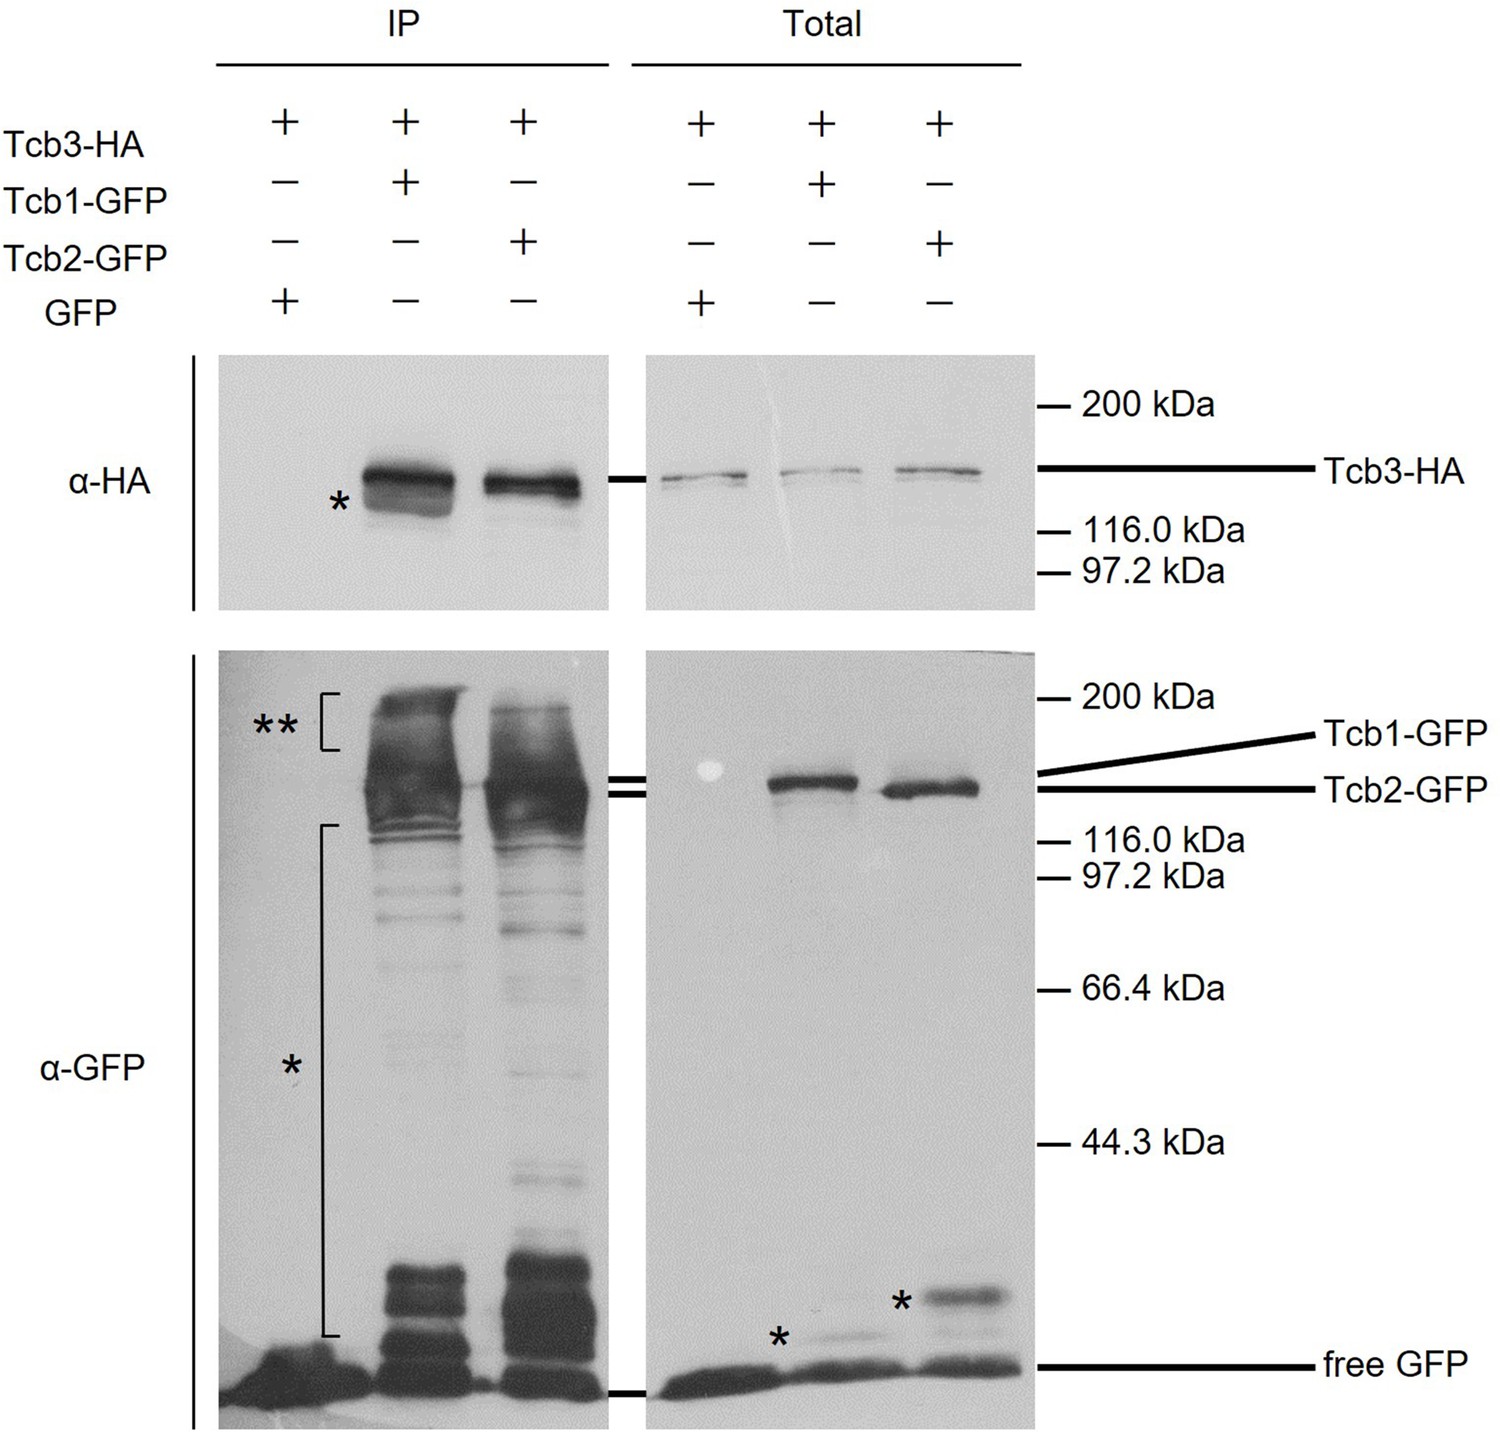
Coimmunoprecipitation assay between Tcb3-HA and Tcb1-GFP or Tcb2-GFP.
Tcb1-GFP (FKP1127), Tcb2-GFP (FKP1131), or GFP (FKP851) plasmids were transformed into TCB3-HA pep4Δ strain (FKY3209). Cells were grown overnight at 25°C in semi-synthetic dextrose (SD) (SD medium containing 0.2% yeast extract). Enriched endoplasmic reticulum (ER) fractions were processed for coimmunoprecipitation. Bound material (IP) was separated by sodium dodecyl sulfate–polyacrylamide gel electrophoresis (SDS–PAGE) and analyzed by immunoblotting using antibodies against HA and GFP. Total represents a fraction of the solubilized input material. Single star (*) indicates presumable degradation products. Double star (**) indicates presumable phosphorylation or other modification bands of Tcb1-GFP or Tcb2-GFP.
-
Figure 2—figure supplement 1—source data 1
Original file for the Western blot analysis in Figure 2—figure supplement 1 (anti-HA).
- https://cdn.elifesciences.org/articles/89938/elife-89938-fig2-figsupp1-data1-v1.zip
-
Figure 2—figure supplement 1—source data 2
Original file for the Western blot analysis in Figure 2—figure supplement 1 (anti-GFP).
- https://cdn.elifesciences.org/articles/89938/elife-89938-fig2-figsupp1-data2-v1.zip
-
Figure 2—figure supplement 1—source data 3
JPEG containing Figure 2—figure supplement 1 and original scans of the relevant Western blot analysis (anti-HA and anti-GFP) with highlighted bands and sample labels.
- https://cdn.elifesciences.org/articles/89938/elife-89938-fig2-figsupp1-data3-v1.zip
Figure 3
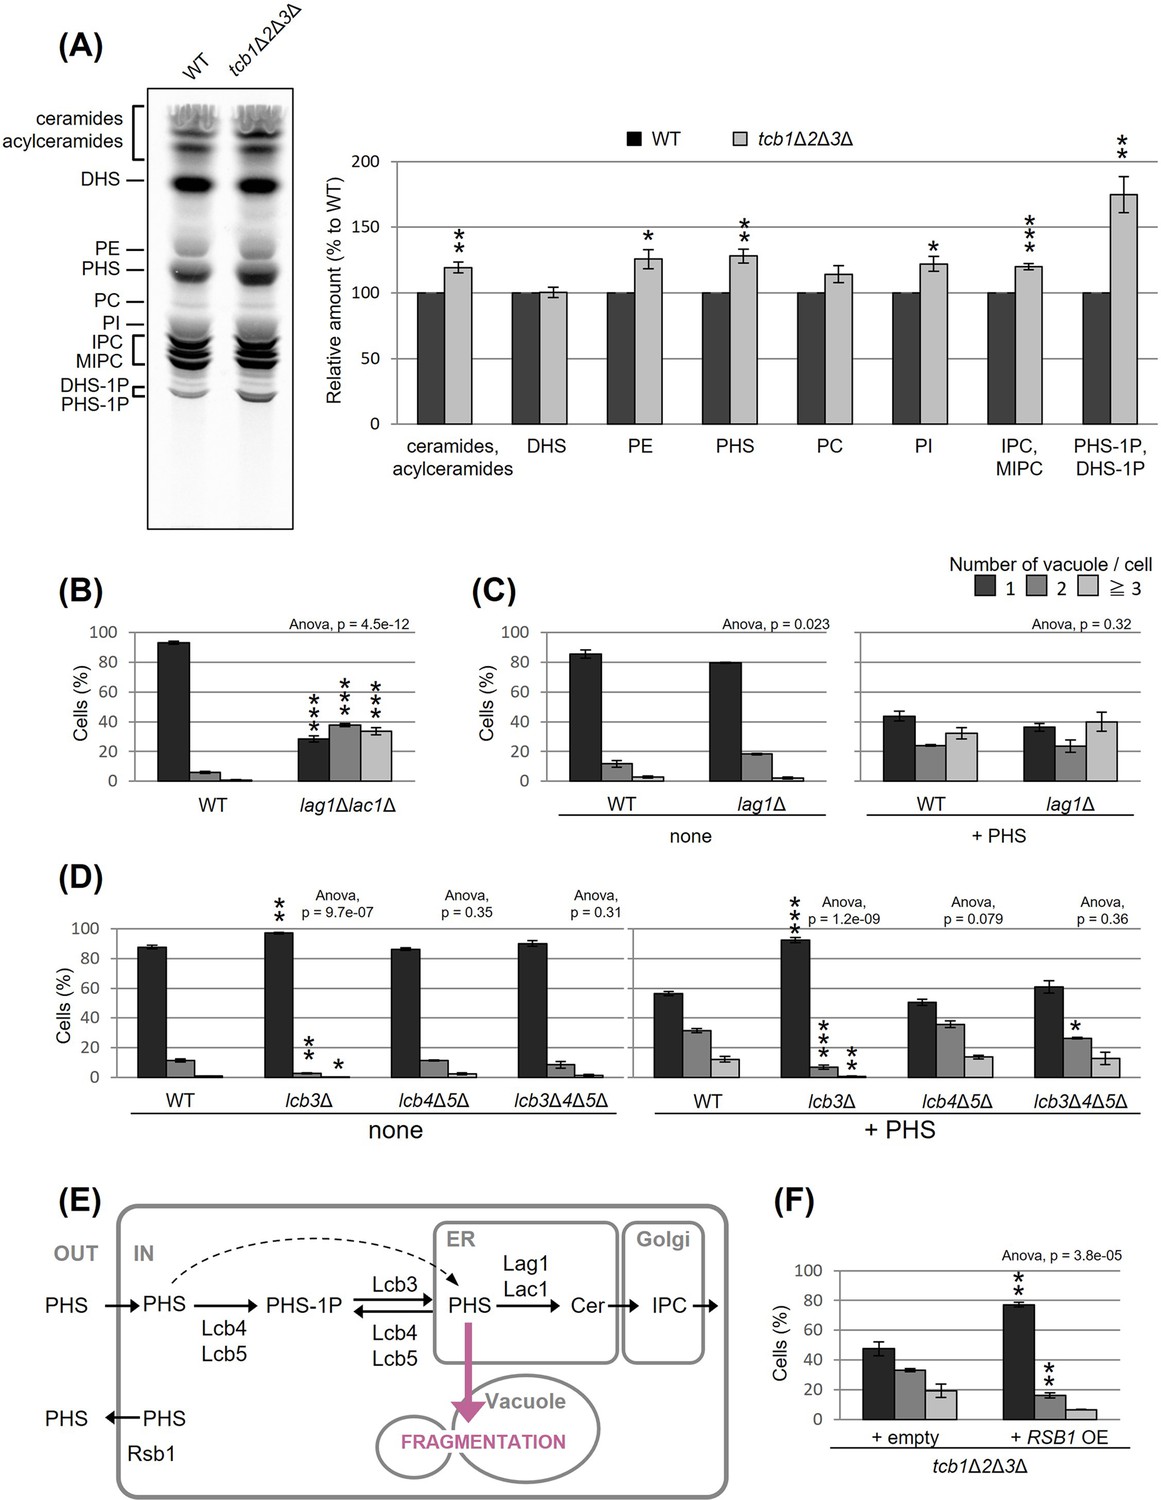
Accumulated phytosphingosine (PHS) in tcb1Δ2Δ3Δ causes vacuole fragmentation.
(A) Cells (FKY2577 and FKY2927) were grown at 25°C, and labeled with [3H]DHS for 3 hr. Labeled lipids were applied to thin-layer chromatography (TLC) plates using solvent system (chloroform-methanol-4.2N ammonium hydroxide (9:7:2, vol/vol/vol)). Incorporation of [3H]DHS into each lipid was quantified and the percentage of the total radioactivity (%) in WT cells was determined. Data represent mean ± standard error (SE) of four independent experiments. **p < 0.01 by Student’s t-test. (B–D, F) Cells (FKY5687 and FKY5688 in B; FKY3340 and YKC121-59 in C; FKY36, FKY37, FKY33, and FKY38 in D; FKY2927 in F) were grown overnight at 25°C in YPD. PHS was added at 160 µM (C) or 80 µM (D) for 2 hr. Vacuoles were stained with FM4-64 and imaged by fluorescence microscopy. The number of vacuoles per cell was counted and categorized into one of three groups. The data represent mean ± SE of three independent experiments, each based on more than 100 cells. *p < 0.05, **p < 0.01, and ***p < 0.001 by Student’s t-test compared with WT (B, D) or empty cells (F). Significant differences analysis between the pairwise combination of groups was performed using two-way analysis of variance (ANOVA). (E) Illustration showing intracellular utilization pathway of exogenous PHS.
-
Figure 3—source data 1
Original file for the thin-layer chromatography (TLC) analysis in Figure 3A.
- https://cdn.elifesciences.org/articles/89938/elife-89938-fig3-data1-v1.zip
-
Figure 3—source data 2
JPEG containing Figure 3A and original scans of the relevant thin-layer chromatography (TLC) analysis with highlighted bands and sample labels.
- https://cdn.elifesciences.org/articles/89938/elife-89938-fig3-data2-v1.zip
-
Figure 3—source data 3
Excel file of numerical data represented as a graph in Figure 3A.
- https://cdn.elifesciences.org/articles/89938/elife-89938-fig3-data3-v1.xlsx
-
Figure 3—source data 4
Excel file of numerical data represented as a graph in Figure 3B.
- https://cdn.elifesciences.org/articles/89938/elife-89938-fig3-data4-v1.xlsx
-
Figure 3—source data 5
Excel file of numerical data represented as two graphs in Figure 3C.
- https://cdn.elifesciences.org/articles/89938/elife-89938-fig3-data5-v1.xlsx
-
Figure 3—source data 6
Excel file of numerical data represented as two graphs in Figure 3D.
- https://cdn.elifesciences.org/articles/89938/elife-89938-fig3-data6-v1.xlsx
-
Figure 3—source data 7
Excel file of numerical data represented as a graph in Figure 3F.
- https://cdn.elifesciences.org/articles/89938/elife-89938-fig3-data7-v1.xlsx
Figure 4 with 1 supplement
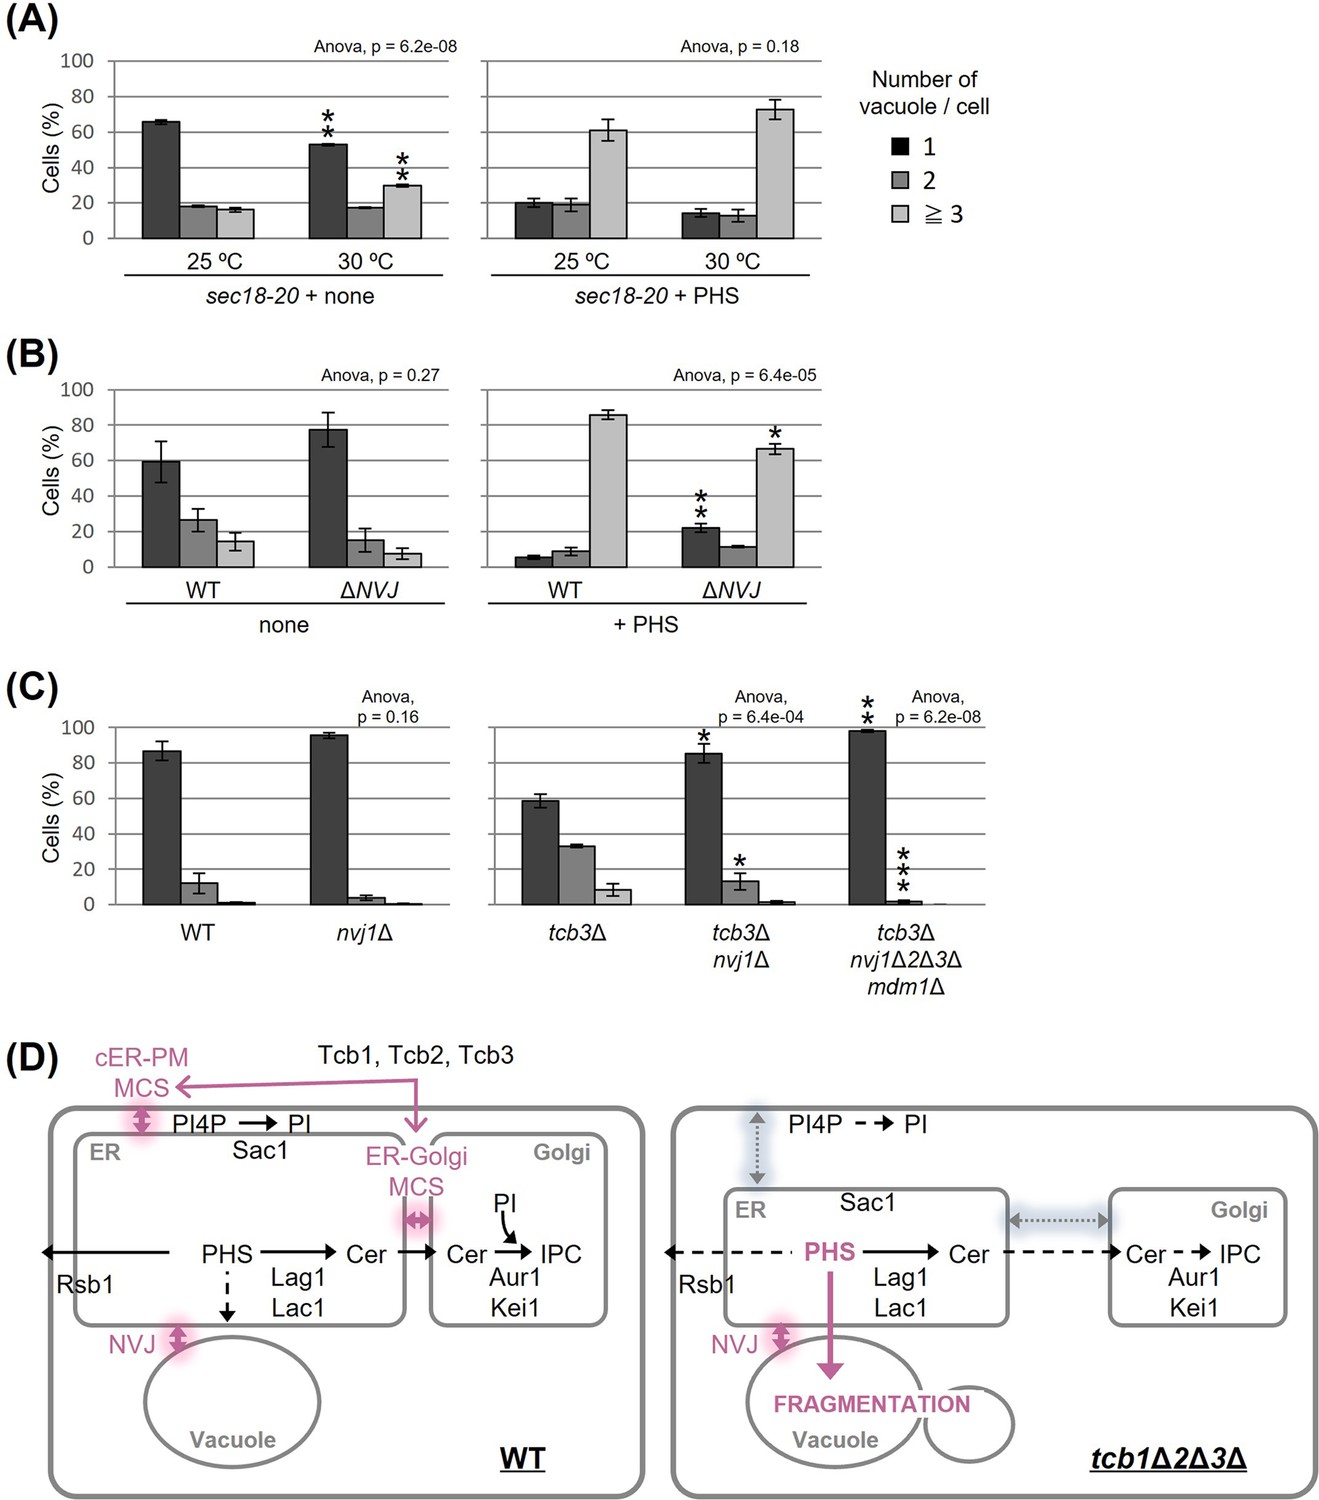
Nucleus–vacuole junction (NVJ) is required for phytosphingosine (PHS)-induced vacuole fragmentation.
(A–C) Cells (FKY2929 in A; FKY3868 and FKY5560 in B; FKY6187, FKY6189, FKY6190, FKY6188, and FKY6409 in C) were grown overnight at 25°C in YPD. PHS was added at 40 µM for 2 hr at 30°C (A) and 25°C (A, B). Vacuoles were stained with FM4-64 and imaged by fluorescence microscopy. The number of vacuoles per cell was counted and categorized into one of three groups. The data represent mean ± standard error (SE) of three independent experiments, each based on more than 100 cells. *p < 0.05, **p < 0.01, and ***p < 0.001 by Student’s t-test. Significant differences analysis between the pairwise combination of groups was performed using two-way analysis of variance (ANOVA). (D) Membrane contact sites regulate vacuole morphology via sphingolipid metabolism. See the main text for details.
-
Figure 4—source data 1
Excel file of numerical data represented as two graphs in Figure 4A.
- https://cdn.elifesciences.org/articles/89938/elife-89938-fig4-data1-v1.xlsx
-
Figure 4—source data 2
Excel file of numerical data represented as two graphs in Figure 4B.
- https://cdn.elifesciences.org/articles/89938/elife-89938-fig4-data2-v1.xlsx
-
Figure 4—source data 3
Excel file of numerical data represented as two graphs in Figure 4C.
- https://cdn.elifesciences.org/articles/89938/elife-89938-fig4-data3-v1.xlsx
Figure 4—figure supplement 1
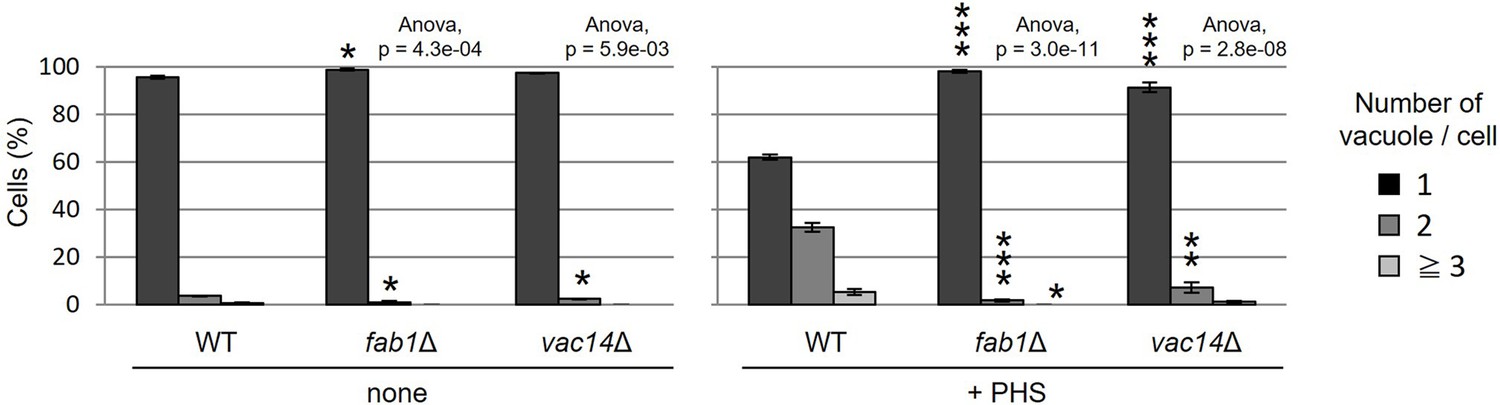
Cells (FKY3340, YKC145-21, and YKC149-61) were grown overnight at 25°C in YPD.
Phytosphingosine (PHS) was added at 80 µM for 2 hr. Vacuoles were stained with FM4-64 and imaged by fluorescence microscopy. The number of vacuoles per cell was counted and categorized into one of three groups. The data represent mean ± standard error (SE) of three independent experiments, each based on more than 100 cells. *p < 0.05, **p < 0.01, and ***p < 0.001 by Student’s t-test. Significant differences analysis between the pairwise combination of groups was performed using two-way analysis of variance (ANOVA).
-
Figure 4—figure supplement 1—source data 1
Excel file of numerical data represented as two graphs in Figure 4—figure supplement 1.
- https://cdn.elifesciences.org/articles/89938/elife-89938-fig4-figsupp1-data1-v1.xlsx
Figure 5
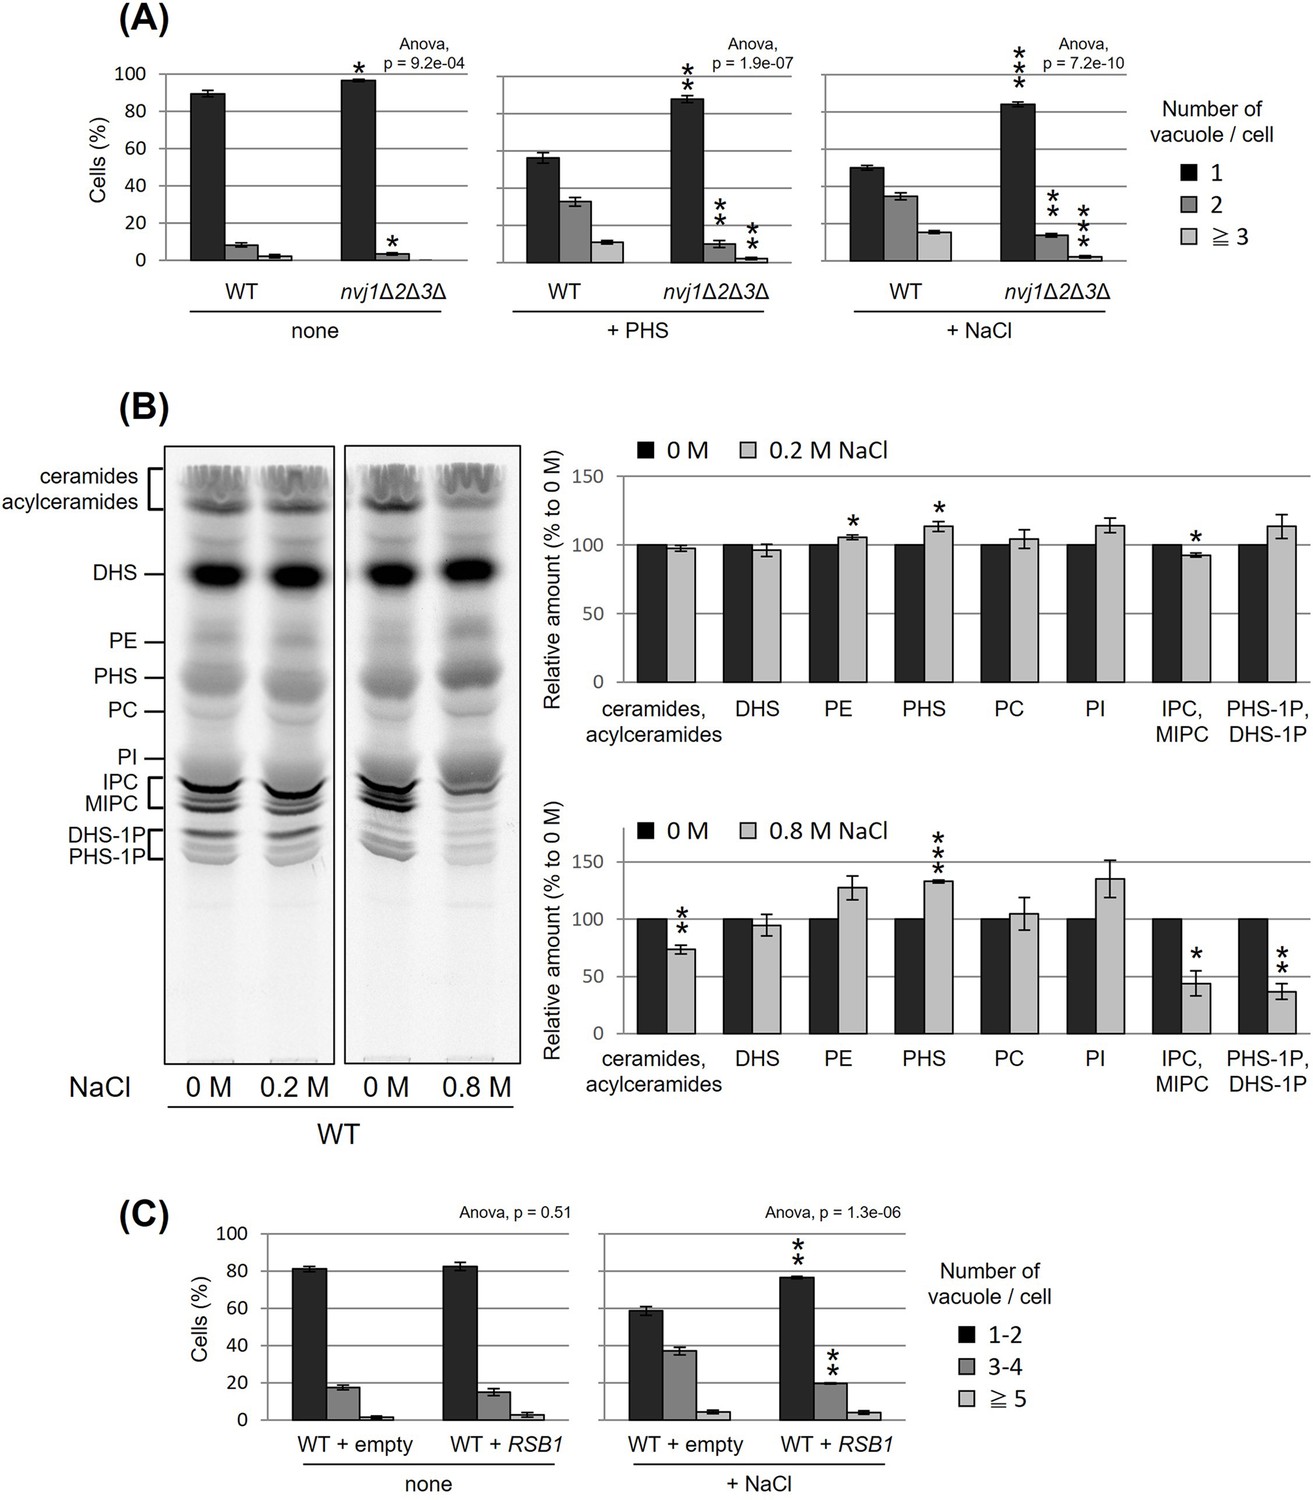
Nucleus–vacuole junction (NVJ) and phytosphingosine (PHS) accumulation mediate hyperosmotic shock-induced vacuole fission.
(A) Cells (FKY6187 and FKY6140) were grown overnight at 25°C in YPD, incubated with 80 µM of PHS or 0.2 M of NaCl for 2 hr. Vacuoles were stained with FM4-64 and imaged by fluorescence microscopy. The number of vacuoles per cell was counted and categorized into one of three groups. (B) Cells (FKY2577) were grown at 25°C then labeled with [3H]DHS and incubated with 0.2 or 0.8 M of NaCl for 2 hr. Labeled lipids were applied to thin-layer chromatography (TLC) plates using solvent system (chloroform-methanol-4.2N ammonium hydroxide (9:7:2, vol/vol/vol)). Incorporation of [3H]DHS into each lipid was quantified and the percentage of the total radioactivity (%) in WT cells was determined. Data represent mean ± standard error (SE) of four independent experiments. (C) Cells (FKY2577) were grown overnight at 25°C in SD, then incubated with 0.2 M of NaCl for 2 hr. Vacuoles were stained with FM4-64 and imaged by fluorescence microscopy. The number of vacuoles per cell was counted and categorized into one of three groups. (A–C) The data represent mean ± SE of three independent experiments. *p < 0.05, **p < 0.01, and ***p < 0.001 by Student’s t-test. Significant differences analysis between the pairwise combination of groups was performed using two-way analysis of variance (ANOVA).
-
Figure 5—source data 1
Excel file of numerical data represented as three graphs in Figure 5A.
- https://cdn.elifesciences.org/articles/89938/elife-89938-fig5-data1-v1.xlsx
-
Figure 5—source data 2
Original file for the thin-layer chromatography (TLC) analysis in Figure 5B.
- https://cdn.elifesciences.org/articles/89938/elife-89938-fig5-data2-v1.zip
-
Figure 5—source data 3
JPEG containing Figure 5B and original scans of the relevant thin-layer chromatography (TLC) analysis with highlighted bands and sample labels.
- https://cdn.elifesciences.org/articles/89938/elife-89938-fig5-data3-v1.zip
-
Figure 5—source data 4
Excel file of numerical data represented as two graphs in Figure 5B.
- https://cdn.elifesciences.org/articles/89938/elife-89938-fig5-data4-v1.xlsx
-
Figure 5—source data 5
Excel file of numerical data represented as two graphs in Figure 5C.
- https://cdn.elifesciences.org/articles/89938/elife-89938-fig5-data5-v1.xlsx
Additional files
-
Supplementary file 1
Yeast strains used in this study.
Related to all figures.
- https://cdn.elifesciences.org/articles/89938/elife-89938-supp1-v1.xlsx
-
Supplementary file 2
Plasmids used in this study.
Related to all figures.
- https://cdn.elifesciences.org/articles/89938/elife-89938-supp2-v1.xlsx
-
MDAR checklist
- https://cdn.elifesciences.org/articles/89938/elife-89938-mdarchecklist1-v1.pdf
Download links
A two-part list of links to download the article, or parts of the article, in various formats.
Downloads (link to download the article as PDF)
Open citations (links to open the citations from this article in various online reference manager services)
Cite this article (links to download the citations from this article in formats compatible with various reference manager tools)
Membrane contact sites regulate vacuolar fission via sphingolipid metabolism
eLife 12:RP89938.
https://doi.org/10.7554/eLife.89938.4


