SPOP targets the immune transcription factor IRF1 for proteasomal degradation
- Department of Microbiology, Immunobiology and Genetics, Max Perutz Labs, University of Vienna, Austria
- Vienna BioCenter PhD Program, Doctoral School of the University of Vienna and Medical University of Vienna, Vienna Biocenter, Austria
- Research Institute of Molecular Pathology, Vienna Biocenter, Austria
- Medical University of Vienna, Vienna BioCenter, Austria
Figures
Figure 1 with 1 supplement
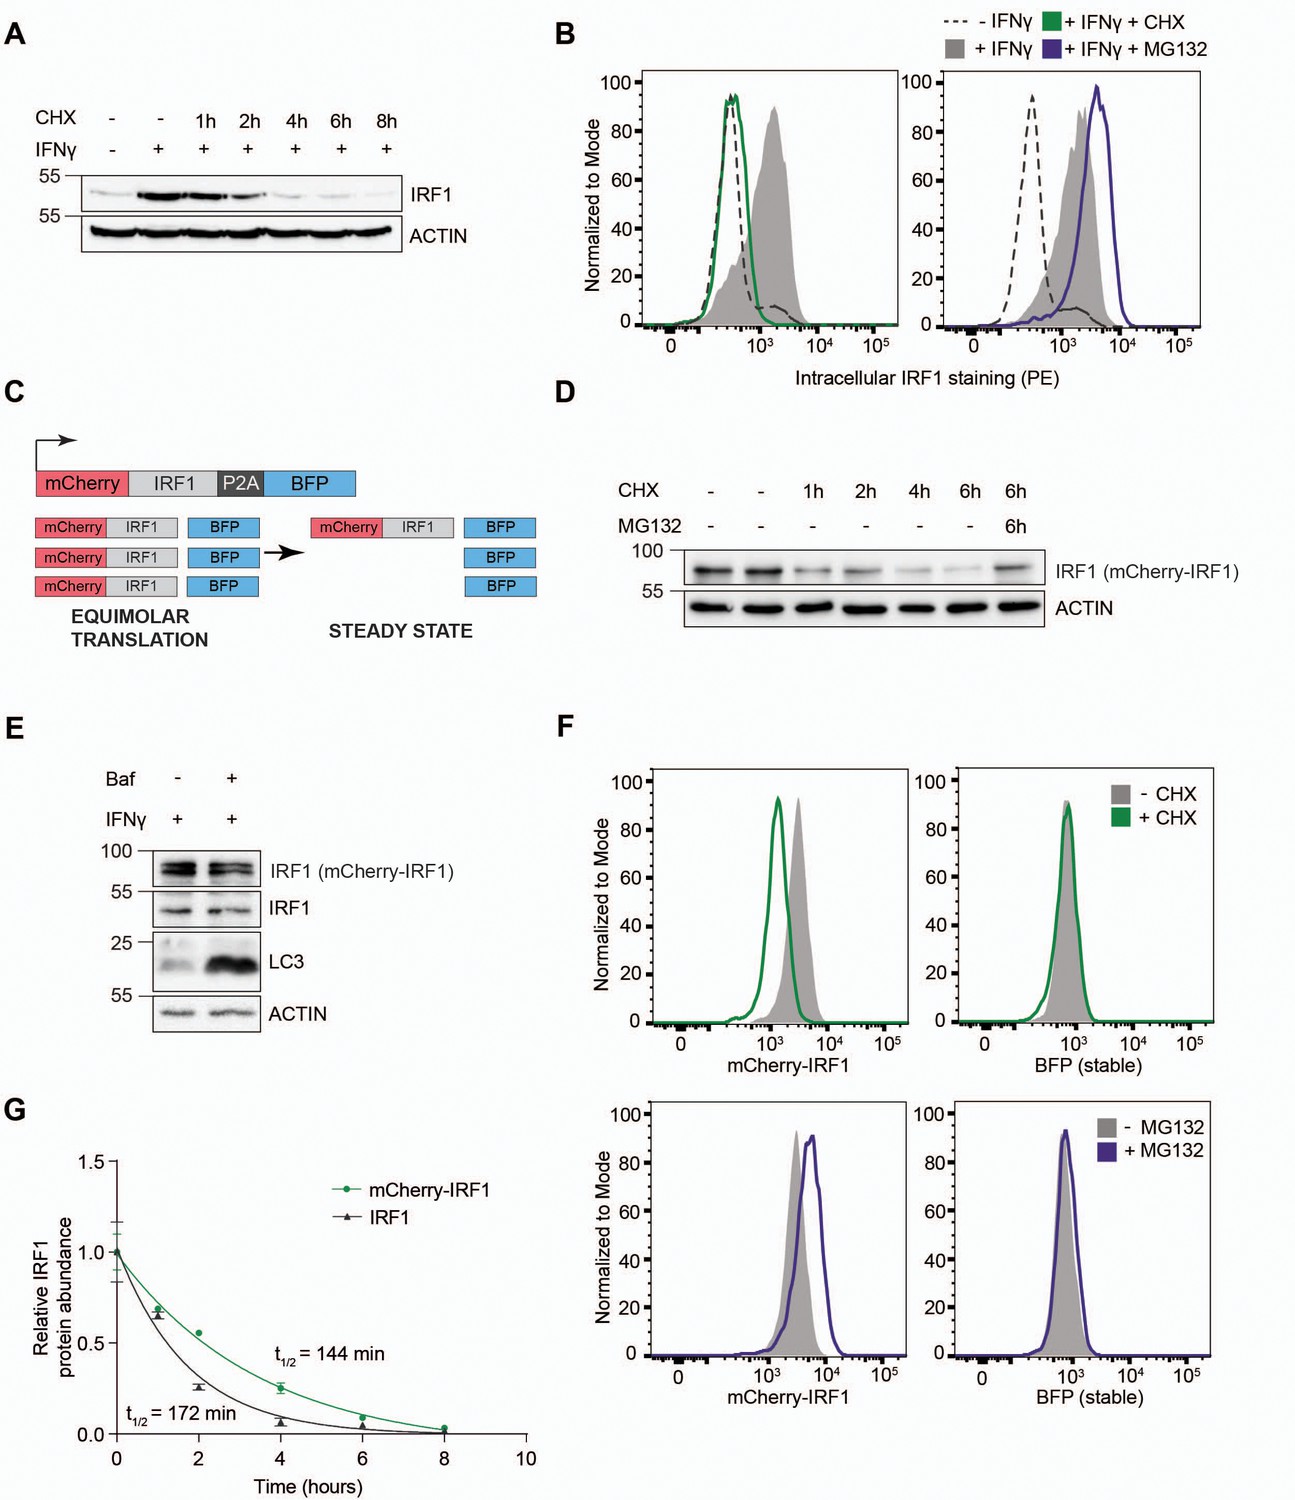
Establishment of an interferon regulatory factor 1 (IRF1) protein abundance reporter cell line for genetic screening.
RKO cells were stimulated with IFNγ for 4 hr, and subsequently incubated with the translation inhibitor cycloheximide (CHX) in the absence or presence of proteasome inhibitor MG132, after which endogenous IRF1 levels were analyzed by (A) western blot or (B) intracellular staining and flow cytometry. (C) A dual-color reporter construct, from which unstable mCherry-IRF1 and stable BFP are synthesized in equimolar amounts, yet mCherry-IRF1 accumulates at low steady-state protein concentrations resulting from its proteasomal degradation. (D) RKO-mCherry-IRF1-P2A-BFP cells were incubated with CHX for the indicated times in the absence or presence of proteasome inhibitor MG132, after which mCherry-IRF1 levels were analyzed by western blot through detection of IRF1 protein. (E) RKO-mCherry-IRF1-P2A-BFP cells were stimulated with IFNγ for 4 hr, and subsequently incubated with lysosomal degradation inhibitor Bafilomycin A (Baf) for 4 hr, after which IRF1 levels were determined by western blot. (F) RKO-mCherry-IRF1-P2A-BFP cells were incubated with CHX or MG132 for 4 hr, after which mCherry-IRF and BFP protein levels were analyzed by flow cytometry. (G) RKO-mCherry-IRF1-P2A-BFP cells were incubated with CHX for the indicated times. Non-saturated western blot signals for mCherry-IRF1 and endogenous IRF1 protein were quantified, and normalized to ACTIN levels. Data represent means and s.d. (n=2 biological replicates). Half-life calculations were performed with GraphPad Prism (v9) by fitting the data to a one-phase decay nonlinear regression curve.
-
Figure 1—source data 1
Western blots corresponding to Figure 1A.
- https://cdn.elifesciences.org/articles/89951/elife-89951-fig1-data1-v2.zip
-
Figure 1—source data 2
Western blots corresponding to Figure 1D.
- https://cdn.elifesciences.org/articles/89951/elife-89951-fig1-data2-v2.zip
-
Figure 1—source data 3
Western blots corresponding to Figure 1E.
- https://cdn.elifesciences.org/articles/89951/elife-89951-fig1-data3-v2.zip
Figure 1—figure supplement 1

Establishment of an interferon regulatory factor 1 (IRF1) protein abundance reporter cell line for genetic screening.
(A) RKO cells were stimulated with IFNγ for 4 hr, and subsequently incubated with the translation inhibitor cycloheximide (CHX) for the indicated times in the presence or absence of Bafilomycin A (Baf), and (B) half-lives of endogenous IRF1 protein levels quantified by fitting the data to a one-phase decay nonlinear regression curve. Data represent means and s.d.; n=3 biological replicates. (C) RKO-mCherry-cMYC-P2A-BFP cells were incubated with CHX for the indicated times in the absence or presence of proteasome inhibitor MG132, after which mCherry-cMYC and endogenous cMYC levels were analyzed by western blot, and (D) their half-lives quantified by fitting the data to a one-phase decay nonlinear regression curve. Data represent means and s.d.; n=2 biological replicates. (E) RKO-mCherry-cMYC-P2A-BFP cells were incubated with CHX or MG132 for 4 hr, after which mCherry-cMYC and BFP protein levels were analyzed by flow cytometry. (F) RKO-mCherry-IRF1-P2A-BFP cells were stimulated with IFNγ for 4 hr, after which mCherry-IRF1 and BFP protein levels were determined by flow cytometry. (G) RKO-mCherry-cMYC-P2A-BFP cells or (H) RKO-mCherry-IRF1-P2A-BFP cells expressing Dox-inducible Cas9-P2A-GFP and sgRNAs targeting either AAVS1, or the essential gene RRM1 were cultured in the presence or absence of Dox. At the indicated times, the relative abundances of sgRNA vector-positive cells were analyzed by flow cytometry and plotted. Data represent means and s.d.; n=2 biological replicates.
-
Figure 1—figure supplement 1—source data 1
Western blots corresponding to Figure 1—figure supplement 1A.
- https://cdn.elifesciences.org/articles/89951/elife-89951-fig1-figsupp1-data1-v2.zip
-
Figure 1—figure supplement 1—source data 2
Western blots corresponding to Figure 1—figure supplement 1C.
- https://cdn.elifesciences.org/articles/89951/elife-89951-fig1-figsupp1-data2-v2.zip
Figure 2 with 5 supplements
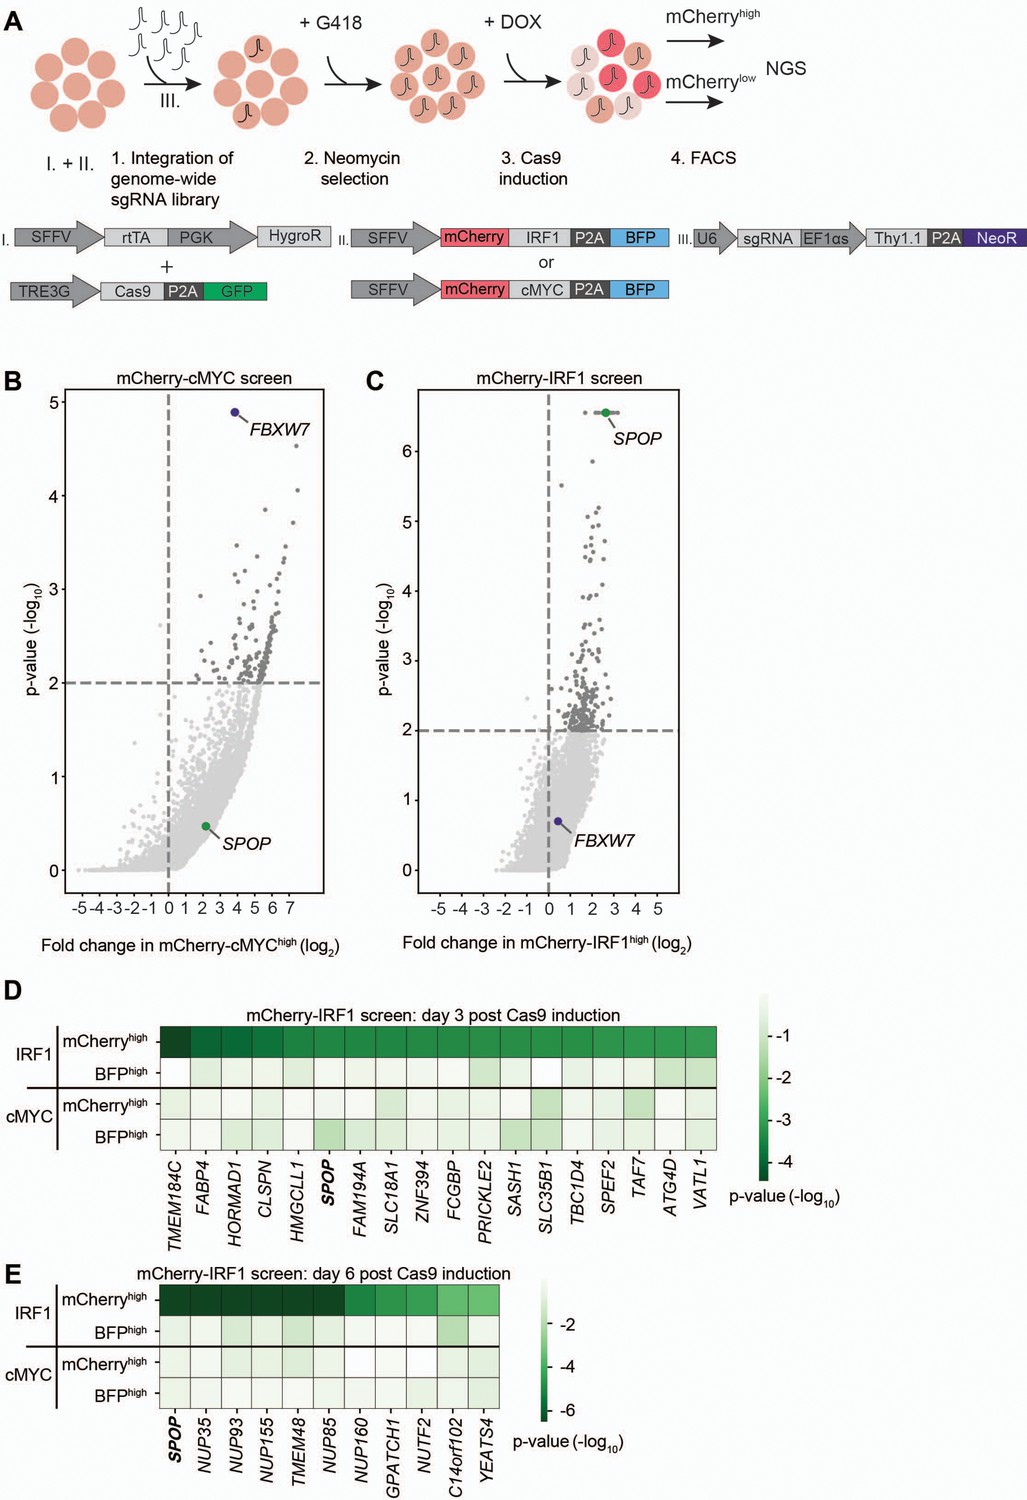
Identification of SPOP as a regulator of interferon regulatory factor 1 (IRF1) abundance.
(A) Overview of fluorescence-activated cell sorting (FACS)-based CRISPR-Cas9 knockout screening procedure using the RKO-mCherry-IRF1-P2A-BFP or RKO-mCherry-cMYC-P2A-BFP cell lines. Cells expressing high and low levels of mCherry-cMYC or mCherry-IRF1 protein were sorted and their integrated sgRNA coding sequences determined by next-generation sequencing. (B–C) Read counts per million in the mCherry-cMYChigh and mCherry-IRF1high cells at 6 days after Cas9 induction were compared to those in unsorted cells from the same day, sgRNA enrichment calculated by MAGeCK analysis, and log2-fold change and adjusted p-value plotted. Specific top hits SPOP and FBXW7 are shown for the (B) mCherry-cMYC or (C) mCherry-IRF1 screen. (D–E) 20 genes enriched in the mCherry-IRF1high sorted populations with lowest adjusted p-values were selected and any genes enriched in BFPhigh or mCherrylow populations were excluded. Screen-specific adj. p-value heatmaps were generated for mCherry-IRF1high cells at (D) 3 days or (E) 6 days post-Cas9 induction.
Figure 2—figure supplement 1
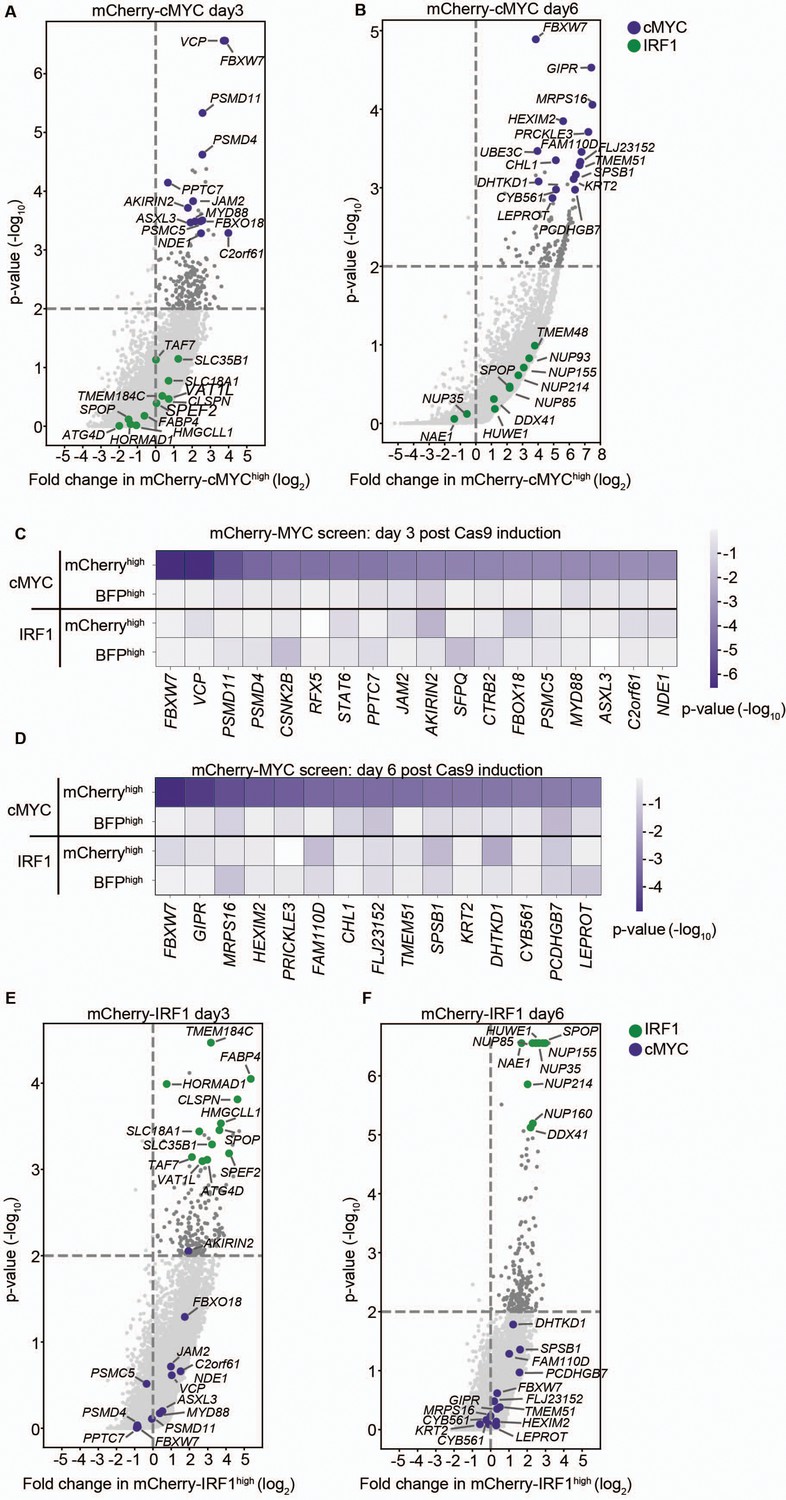
Identification of SPOP as a regulator of interferon regulatory factor 1 (IRF1) abundance.
(A–B) Read counts per million in the mCherry-cMYChigh cells at (A) 3 days post-Cas9 induction and (B) 6 days post-Cas9 induction were compared to those in unsorted cells from the same day, sgRNA enrichment calculated by MAGeCK analysis, and log2-fold change and adjusted p-value plotted. Specific top hits for the cMYC screen are shown in purple, whereas IRF1 screen-specific genes are shown in green. (C–D) 20 genes enriched in the mCherry-cMYChigh sorted populations with lowest adjusted p-values were selected and any genes enriched in BFPhigh or mCherrylow populations were excluded. Screen-specific adj. p-value heatmaps were generated for mCherry-cMYChigh cells at (C) 3 days or (D) 6 days post-Cas9 induction. (E–F) mCherry-IRF1 screen log2-fold change and adjusted p-values were plotted for mCherry-IRF1high sorted cells at (E) 3 days or (F) 6 days post-Cas9 induction. Specific top hits for the IRF1 screen are shown in green, whereas cMYC screen-specific genes are shown in purple.
Figure 2—figure supplement 2

Identification of SPOP as a regulator of interferon regulatory factor 1 (IRF1) abundance.
(A) Time line and key steps in the genome-wide mCherry-cMYC and mCherry-IRF1 pooled forward genetic screens. (B) RKO-mCherry-cMYC-P2A-BFP cells or (C) RKO-mCherry-IRF1-P2A-BFP cells were transduced with a lentiviral genome-wide sgRNA library, harboring a neomycin resistance cassette. Transduction efficiency before (left panels) and after (right panels) G418 selection was determined by Thy1.1 staining and flow cytometry.
Figure 2—figure supplement 3
Identification of SPOP as a regulator of interferon regulatory factor 1 (IRF1) abundance.
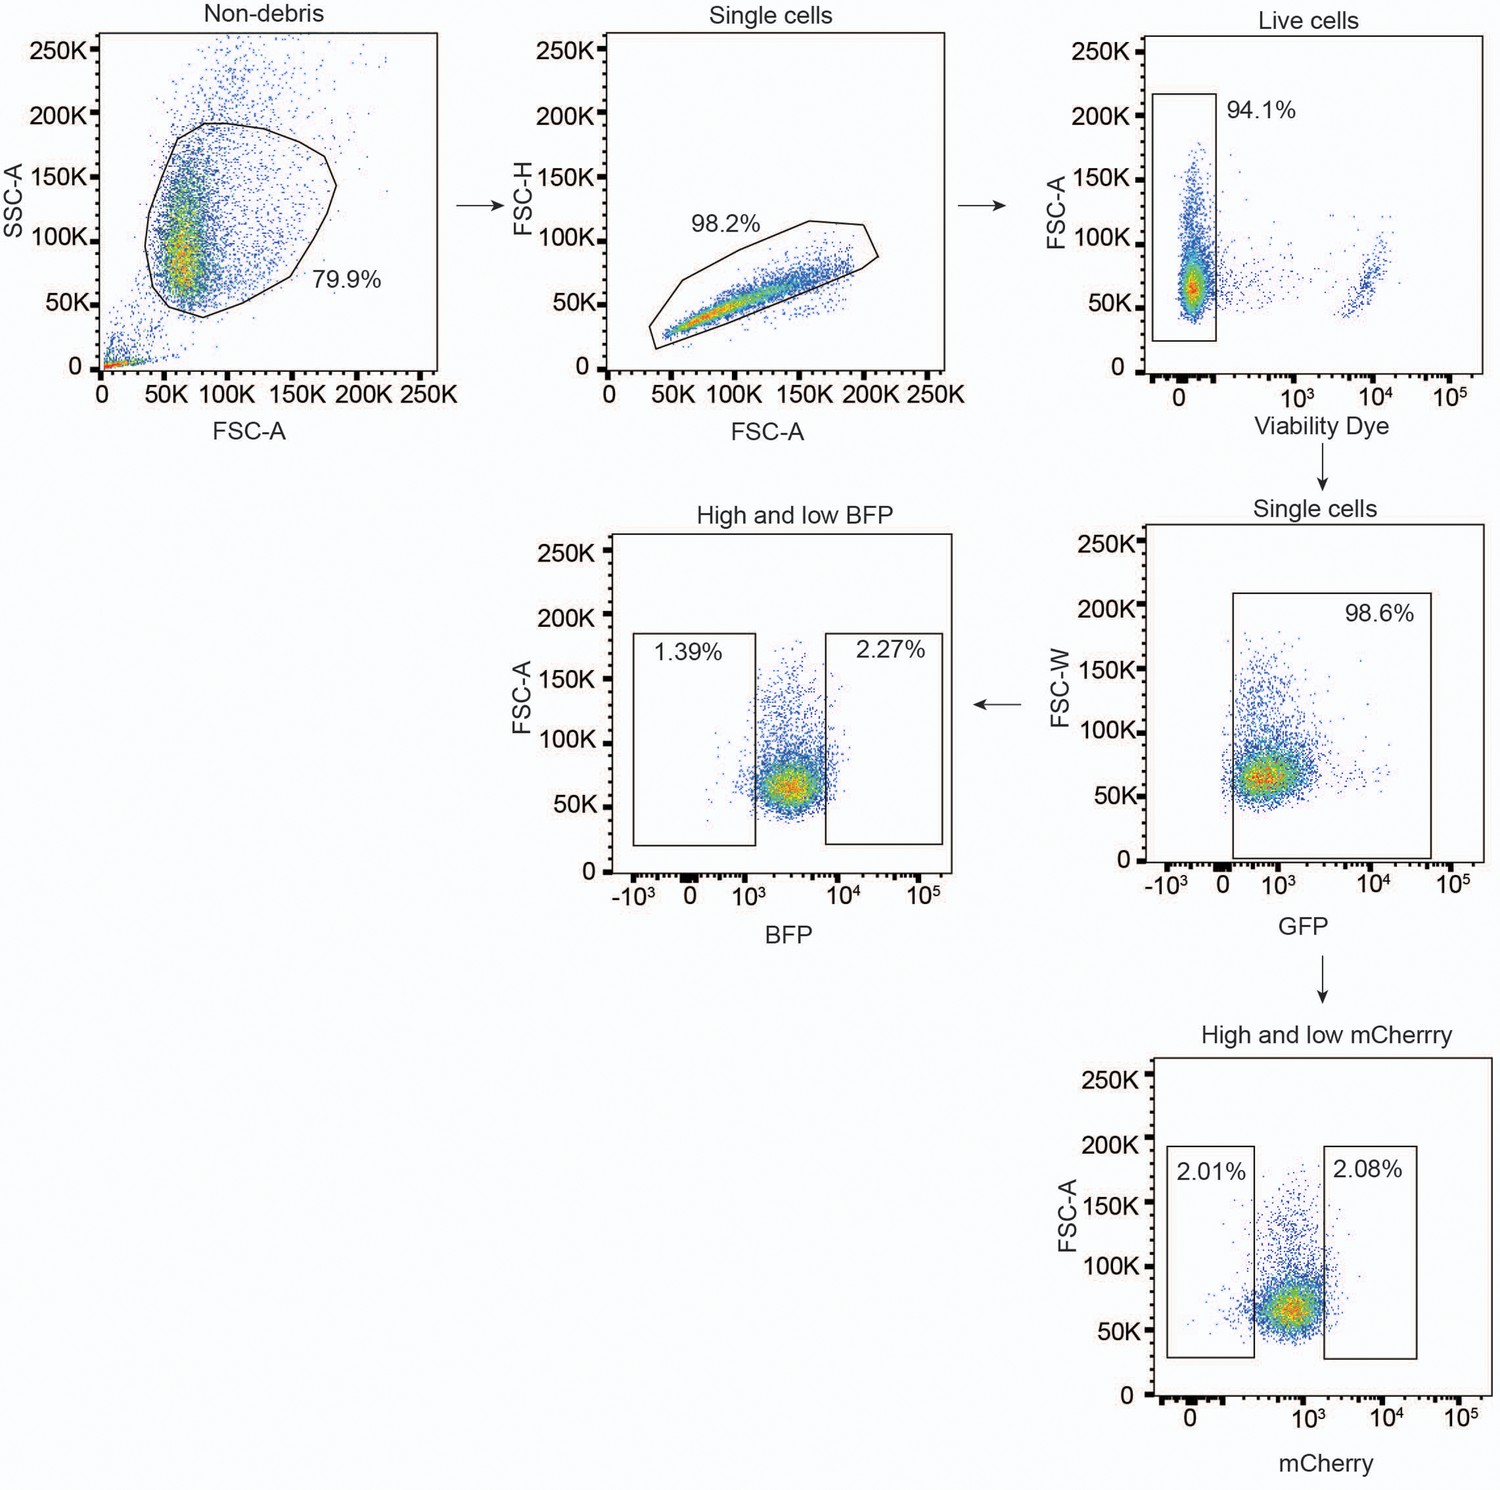
Gating strategy for the mCherry-cMYC screen.
Figure 2—figure supplement 4
Identification of SPOP as a regulator of interferon regulatory factor 1 (IRF1) abundance.
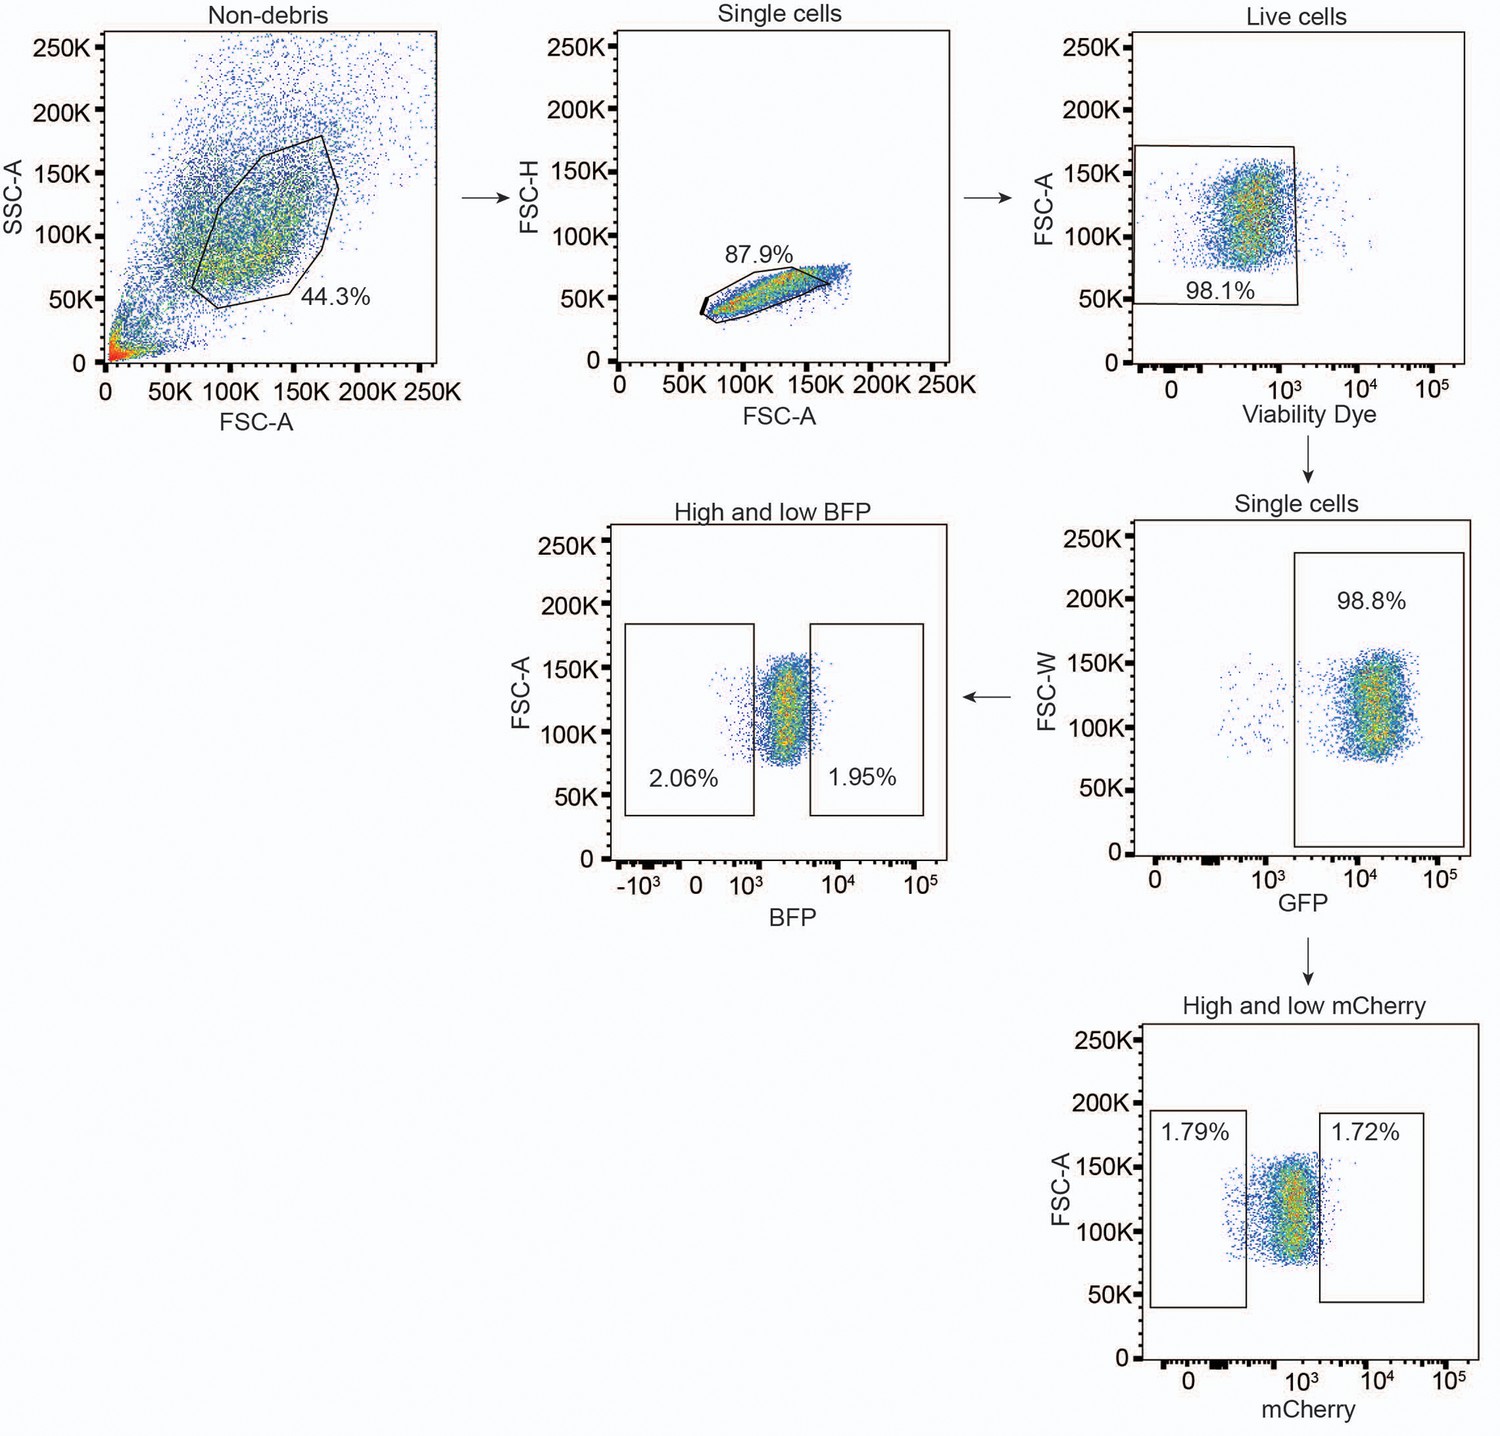
Gating strategy for the mCherry-IRF1 screen.
Figure 2—figure supplement 5
Identification of SPOP as a regulator of interferon regulatory factor 1 (IRF1) abundance.
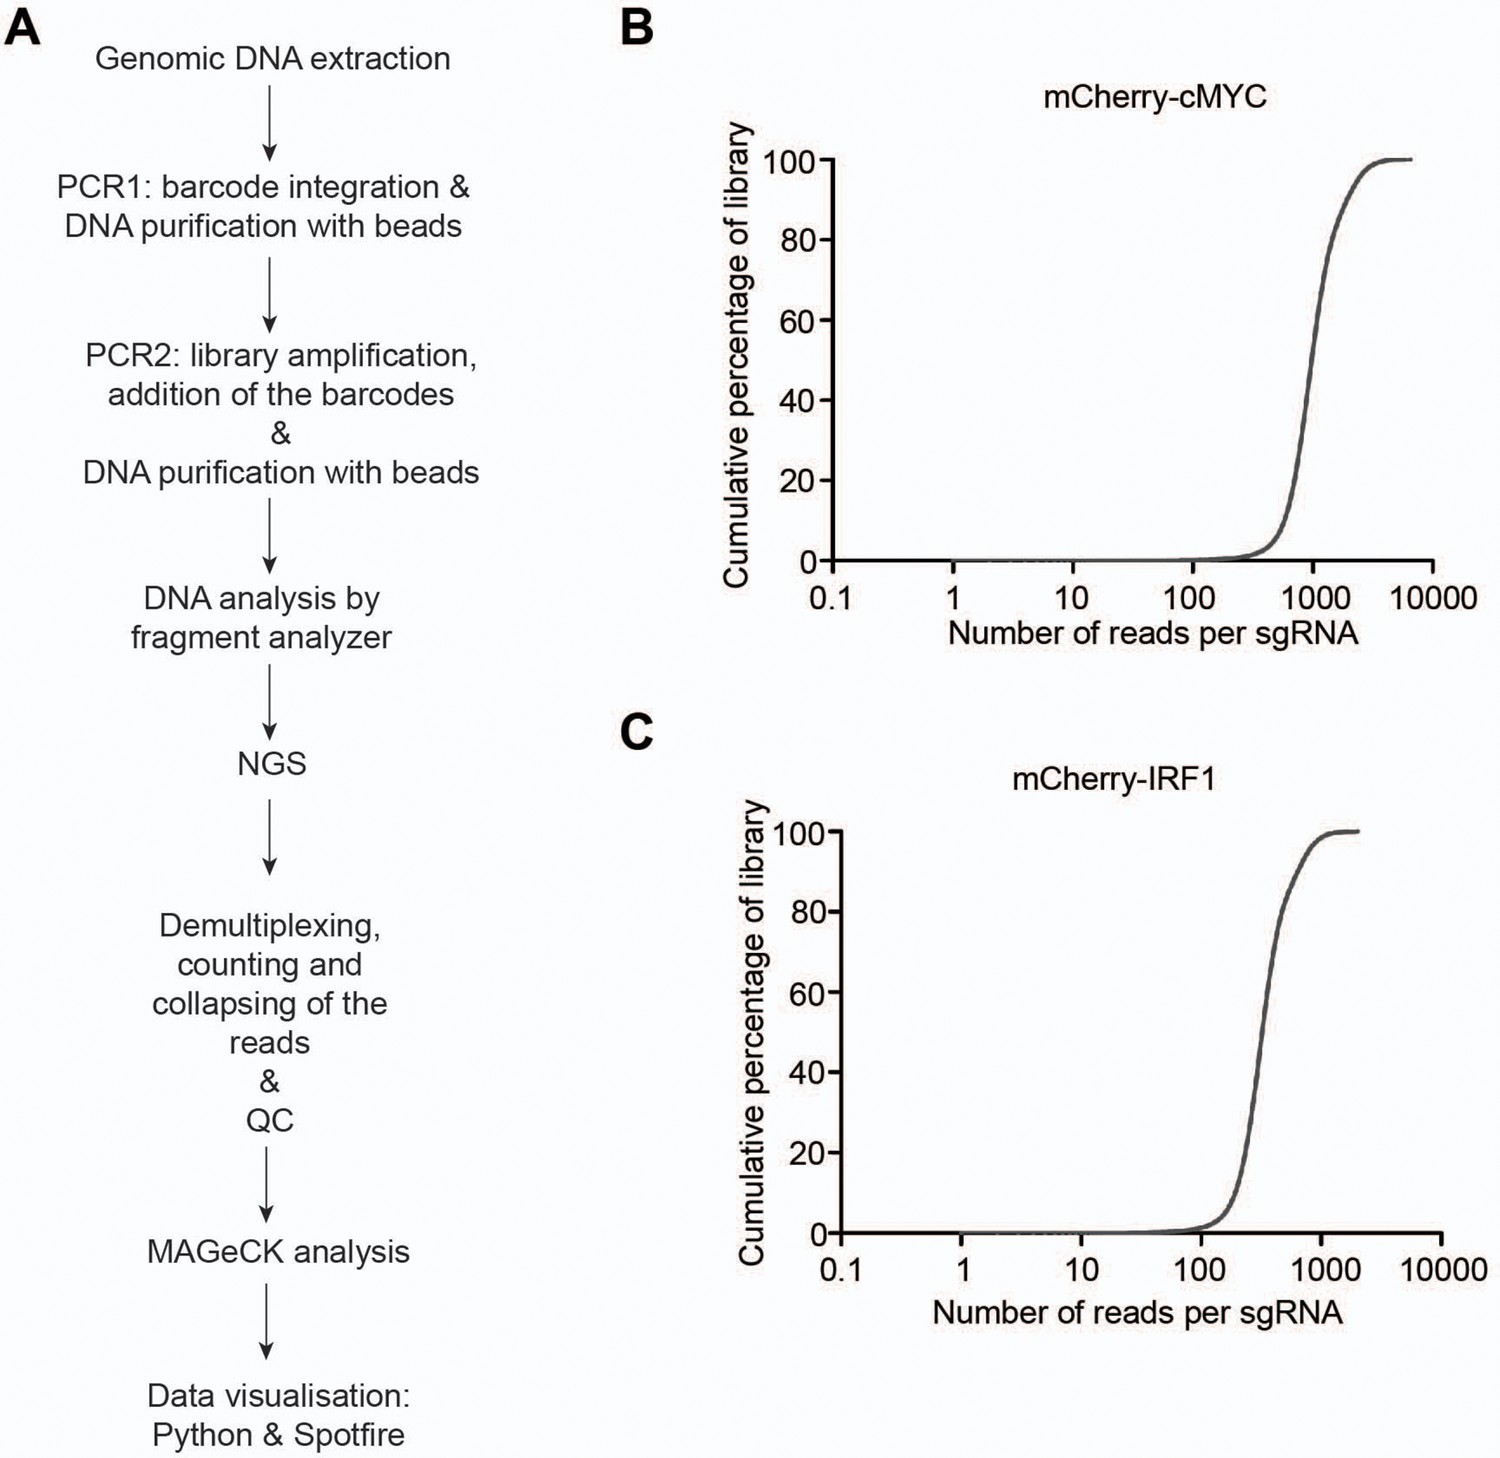
(A) Flow chart for analysis of screen next-generation sequencing (NGS) data sets. (B–C) Cumulative percentage of library coverage per sgRNA coding sequence for the (B) mCherry-cMYC screen and (C) mCherry-IRF1 screen.
Figure 3 with 1 supplement
SPOP regulates interferon regulatory factor 1 (IRF1) protein levels.
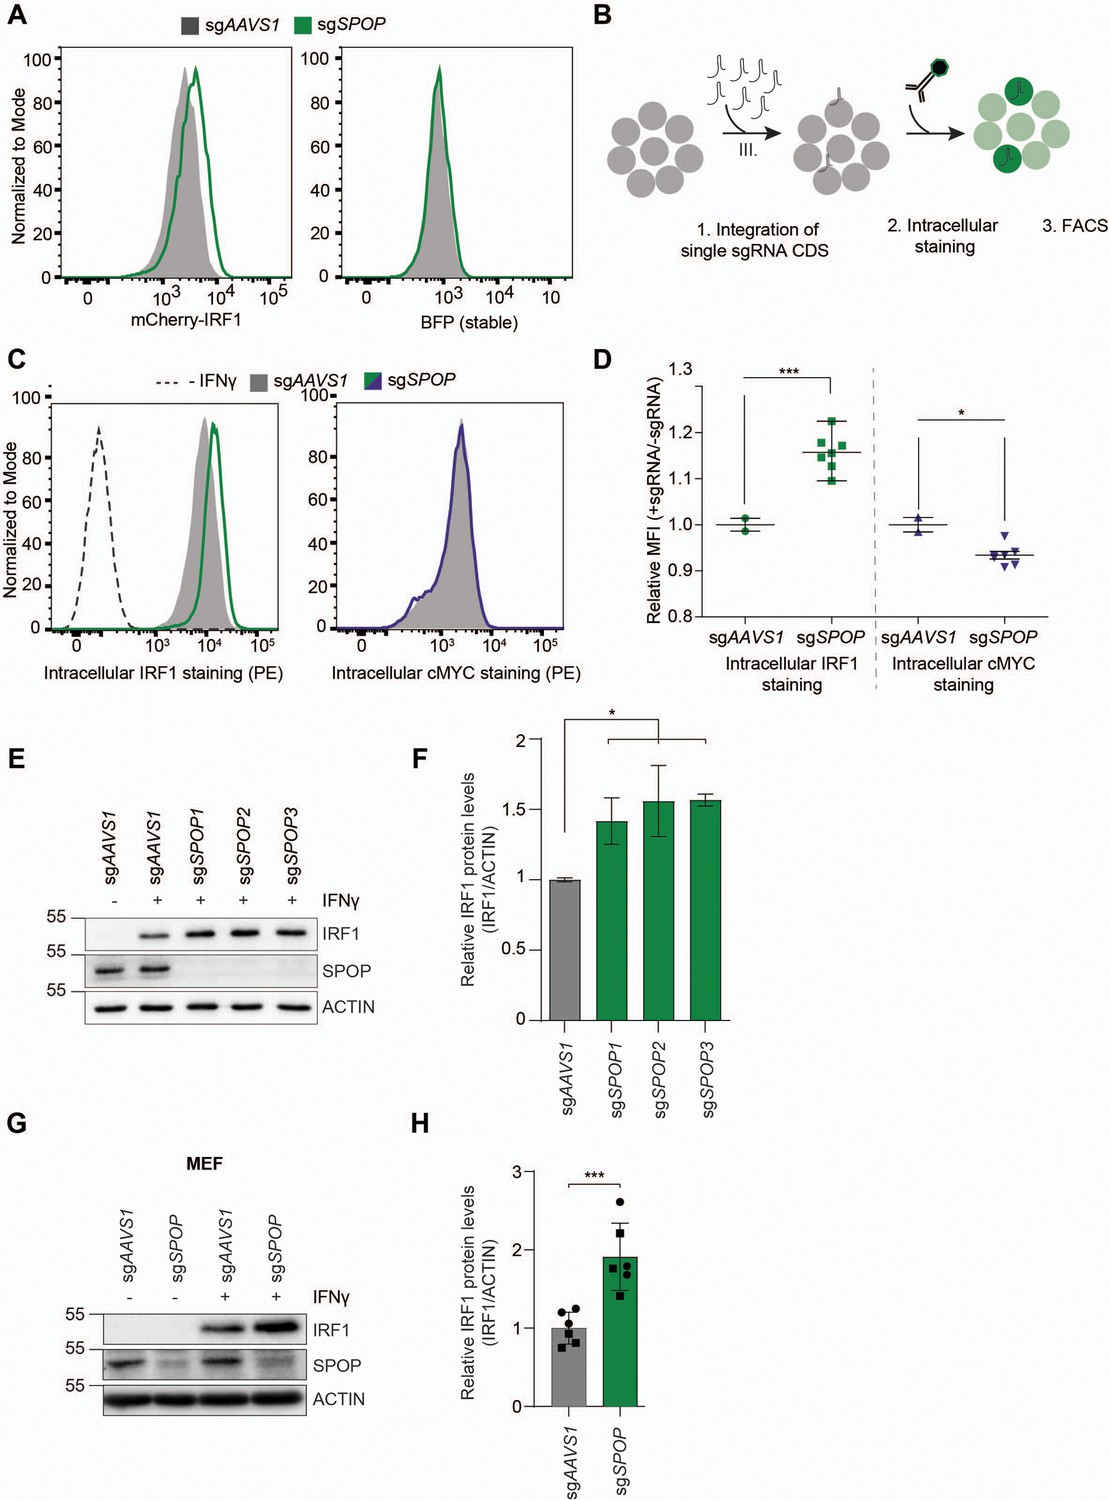
(A) RKO-mCherry-IRF1-P2A-BFP cells expressing sgAAVS1 or sgSPOP were treated with Dox to induce Cas9. Subsequently, mCherry-IRF1 and BFP protein levels were analyzed by flow cytometry. (B) RKO-Cas9-P2A-GFP cells expressing sgAAVS1 or sgSPOP were treated with Dox to induce Cas9, treated with IFNγ for 4 hr, after which endogenous IRF1 or cMYC levels were determined by (C–D) intracellular staining and flow cytometry. In (D), each data point represents targeting with a different, independent sgSPOP sequence. Data were analyzed by unpaired two-tailed t-test; n=2 biological replicates. *p<0.05, ***p<0.001. (E) Independent monoclonal RKO-Cas9-GFP cell lines with wt IRF1 alleles derived from sgAAVS1 expressing cells, or homozygous SPOP disrupted alleles were stimulated with IFNγ for 4 hr, after which their IRF1 and SPOP protein levels were determined by western blot (WB), and (F) quantified (unpaired t-test, n=2). (G) Mouse embryonic fibroblast (MEF) cells were treated with IFNγ for 4 hr, after which endogenous IRF1 levels were analyzed by WB and (H) quantified (unpaired t-test, n=6 biological replicates from two independently established MEF cell lines indicated by circle and square symbols), ***p<0.001.
-
Figure 3—source data 1
Western blots corresponding to Figure 3E.
- https://cdn.elifesciences.org/articles/89951/elife-89951-fig3-data1-v2.zip
-
Figure 3—source data 2
Western blots corresponding to Figure 3G.
- https://cdn.elifesciences.org/articles/89951/elife-89951-fig3-data2-v2.zip
Figure 3—figure supplement 1
SPOP regulates interferon regulatory factor 1 (IRF1) protein levels.
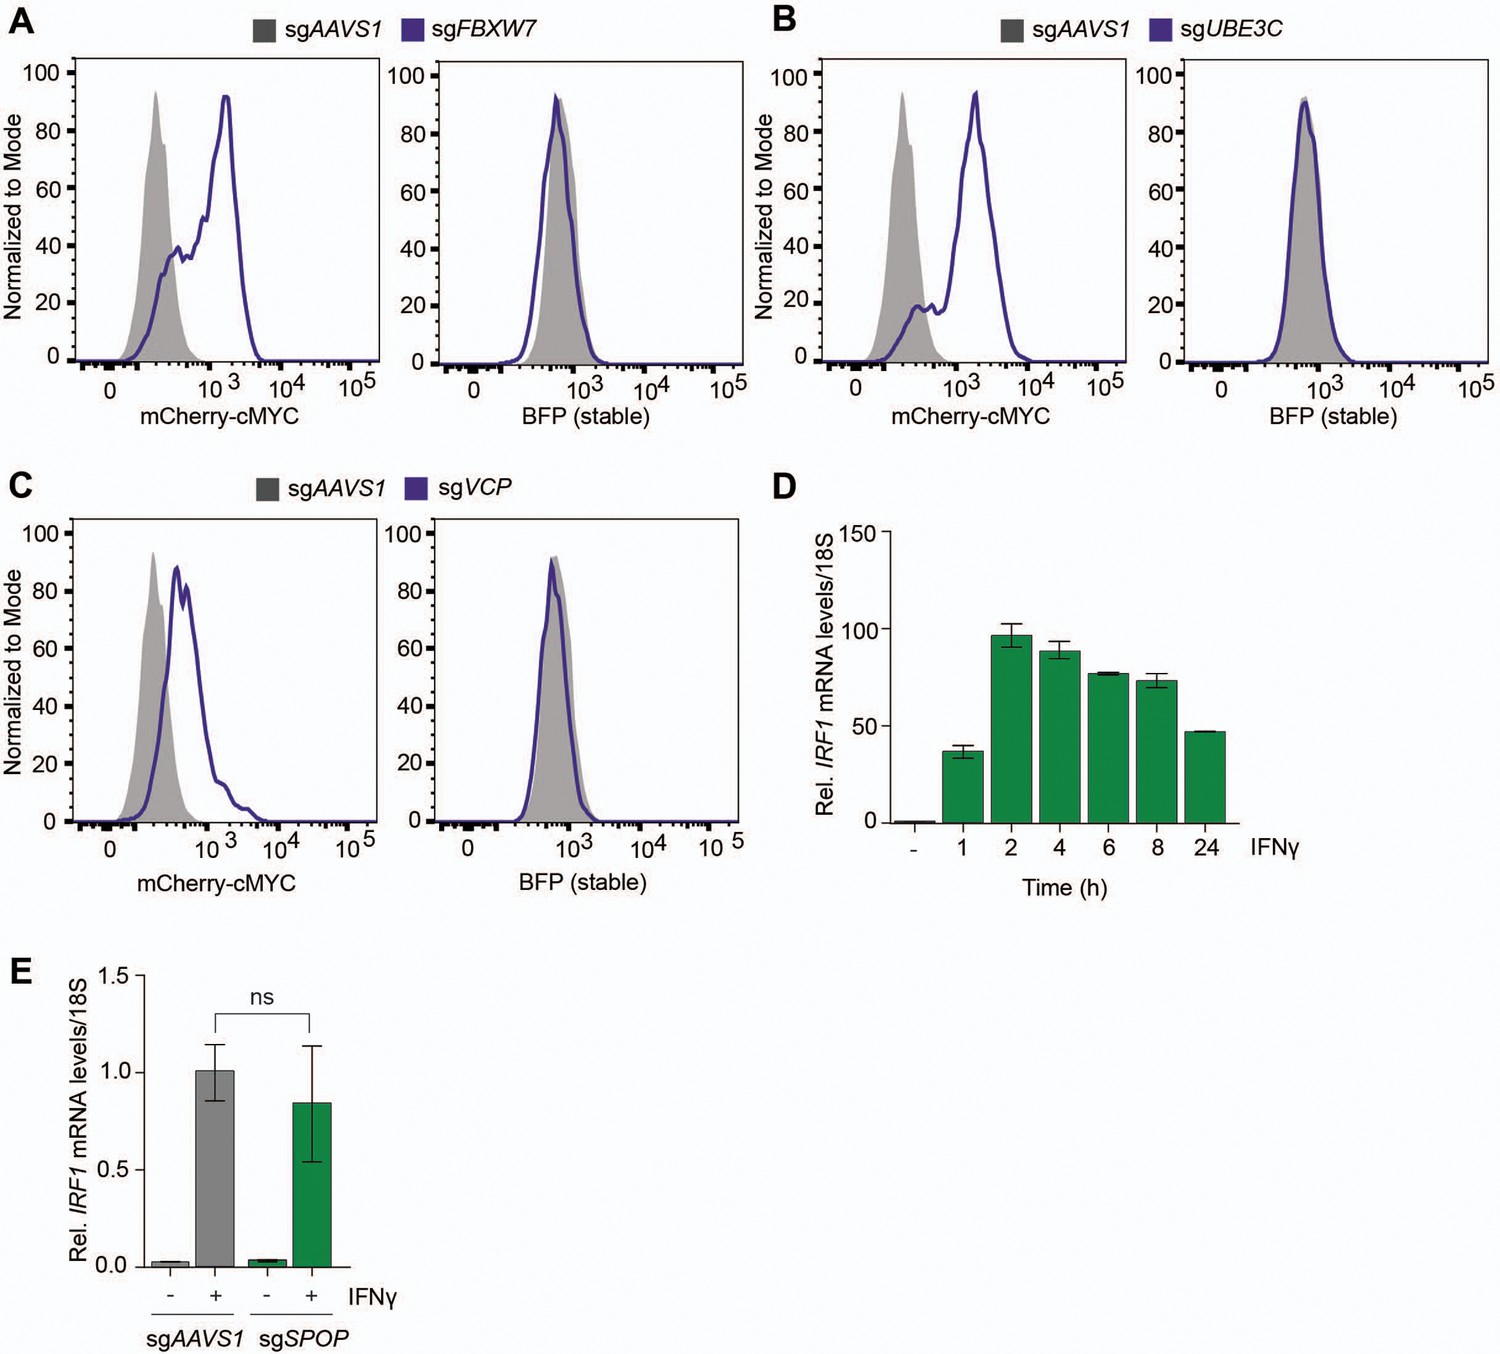
(A–C) RKO-mCherry-cMYC-P2A-BFP cells expressing sgAAVS1 were compared with cells expressing (A) sgFBXW7, (B) sgUBE3C, or (C) sgVCP after treatment with Dox for 6 (sgFBXW7, sgUBE3C) or 3 days (sgVCP) to induce Cas9, after which mCherry-cMYC and BFP protein levels were analyzed by flow cytometry. (D) RKO-Cas9-P2A-BFP cells were stimulated with IFNγ for the indicated times, after which IRF1 mRNA levels were analyzed by RT-qPCR. Data represent means and s.d.; n=2 biological replicates. (E) RKO-Cas9-P2A-BFP cells expressing either sgAAVS or sgSPOP were stimulated with IFNγ for 4 hr. Subsequently, IRF1 mRNA levels were analyzed by RT-qPCR. Data represent means and s.d.; n=2 biological replicates. Data were analyzed by unpaired two-tailed t-test.
Figure 4 with 3 supplements
SPOP targets S/T-rich degrons in interferon regulatory factor 1 (IRF1).
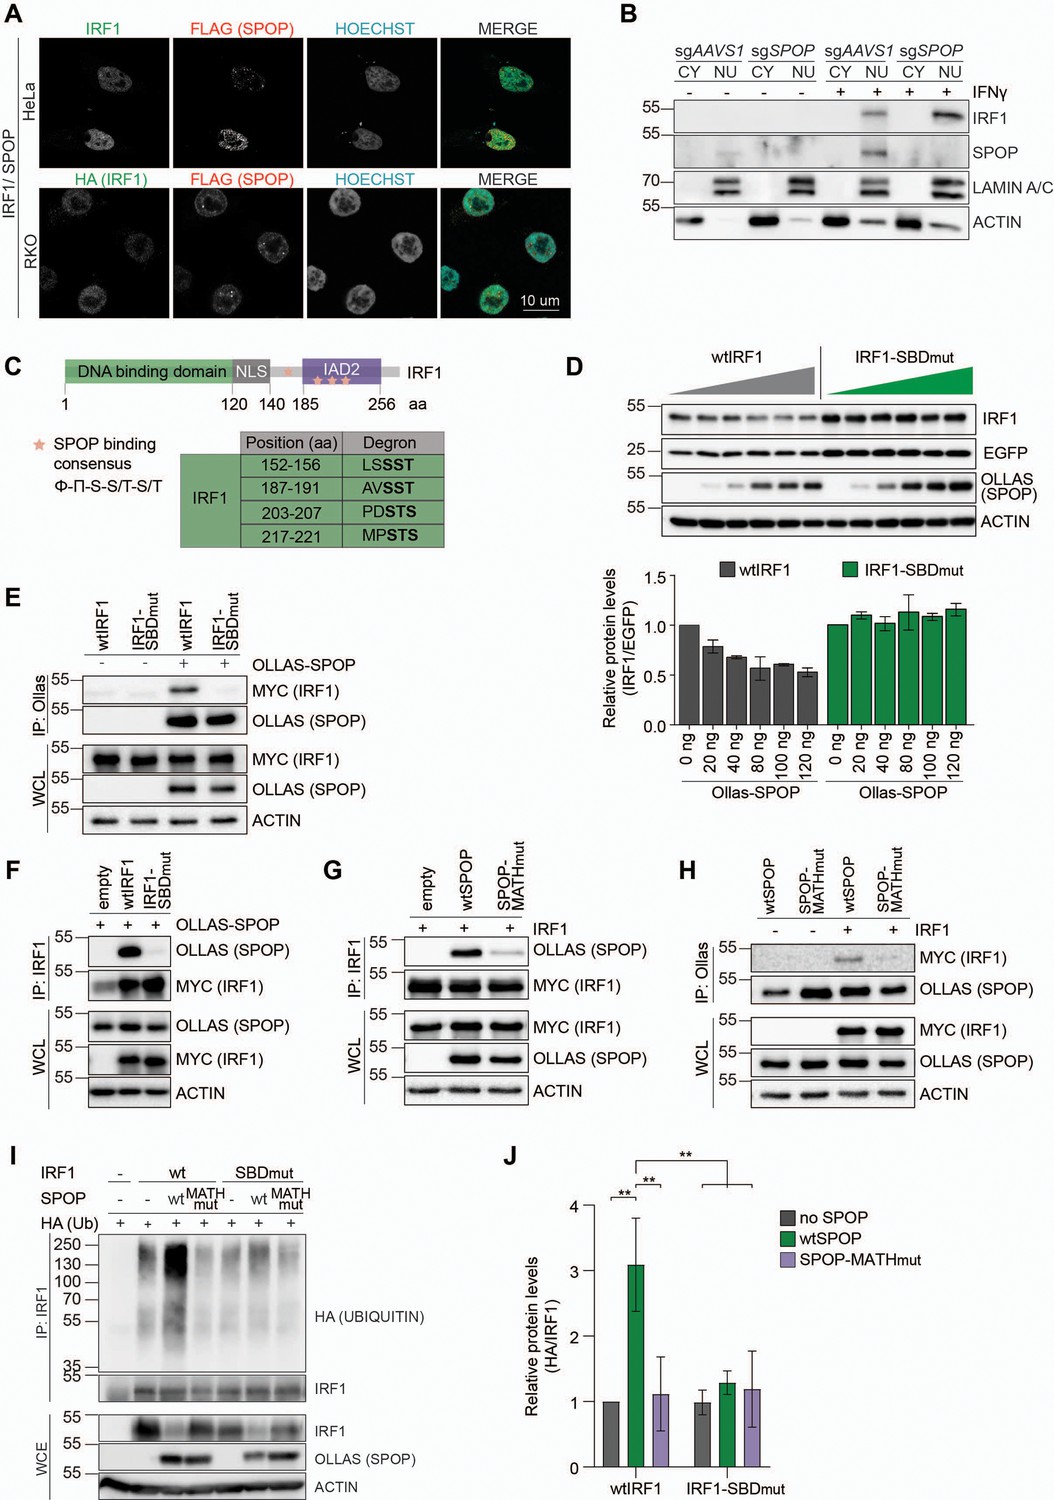
(A) Representative images of HeLa cells, transfected with expression plasmids for MYC-tagged IRF1 and FLAG-tagged SPOP, and RKO cells, stably expressing HA-tagged IRF1 and FLAG-tagged SPOP. At 48 hr post-transfection (HeLa) or 48 hr after seeding (RKO), cells were fixed, stained for the indicated factors, and their localization analyzed by confocal immunofluorescence microscopy. (B) Independent monoclonal RKO-Cas9-GFP cells lines with wt IRF1 alleles derived from sgAAVS1 expressing cells, or homozygous SPOP disrupted alleles were stimulated with IFNγ for 4 hr, after which whole cell (WCL), cytosolic (CY), and nuclear (NU) fractions were collected. IRF1 and SPOP protein levels were determined by western blot. (C) Schematic representation of human IRF1 and its conserved domains. The SPOP consensus binding sequence is displayed and matching degron sequences in human IRF1 indicated. (D) HEK-293T cells were co-transfected with expression plasmids for EGFP, Ollas-tagged wtSPOP, and either wtIRF1 or an IRF1 mutant in which the S/T residues in the four indicated SPOP binding domains (SBD) were mutated to A (IRF1-SBDmut). At 36 hr post-transfection, cell lysates were analyzed by western blot and quantified. Data represent means and s.d. (n=3). (E–H) HEK-293T cells were transfected with the indicated expression plasmids for wtIRF1, IRF1-SBDmut, Ollas-tagged wtSPOP, or an SPOP mutant in which its substrate interaction site in its MATH domain was mutated (SPOP-MATHmut). At 36 hr post-transfection, cells were stimulated with epoxomicin (EPOX) for 4 hr, and subsequently interaction was analyzed by co-IP. (I–J) HEK-293T cells were transfected with the indicated plasmids encoding MYC-tagged wtIRF1 or IRF1-SBDmut, Ollas-tagged wtSPOP and SPOP-MATHmut, as well as HA-tagged ubiquitin. 36 hr post-transfection, cells were treated with EPOX for 4 hr, and subsequently MYC-tagged IRF1 was immunoprecipitated and (I) ubiquitination analyzed by western blot, and (J) quantified by densitometry. Data were analyzed by two-way ANOVA; n=3 biological replicates, data represent means and s.d., **p<0.01.
-
Figure 4—source data 1
Western blots corresponding to Figure 4A.
- https://cdn.elifesciences.org/articles/89951/elife-89951-fig4-data1-v2.zip
-
Figure 4—source data 2
Western blots corresponding to Figure 4B.
- https://cdn.elifesciences.org/articles/89951/elife-89951-fig4-data2-v2.zip
-
Figure 4—source data 3
Western blots corresponding to Figure 4D.
- https://cdn.elifesciences.org/articles/89951/elife-89951-fig4-data3-v2.zip
-
Figure 4—source data 4
Western blots corresponding to Figure 4E.
- https://cdn.elifesciences.org/articles/89951/elife-89951-fig4-data4-v2.zip
-
Figure 4—source data 5
Western blots corresponding to Figure 4F.
- https://cdn.elifesciences.org/articles/89951/elife-89951-fig4-data5-v2.zip
-
Figure 4—source data 6
Western blots corresponding to Figure 4G.
- https://cdn.elifesciences.org/articles/89951/elife-89951-fig4-data6-v2.zip
-
Figure 4—source data 7
Western blots corresponding to Figure 4H.
- https://cdn.elifesciences.org/articles/89951/elife-89951-fig4-data7-v2.zip
-
Figure 4—source data 8
Western blots corresponding to Figure 4I.
- https://cdn.elifesciences.org/articles/89951/elife-89951-fig4-data8-v2.zip
Figure 4—figure supplement 1
SPOP targets S/T-rich degrons in interferon regulatory factor 1 (IRF1).
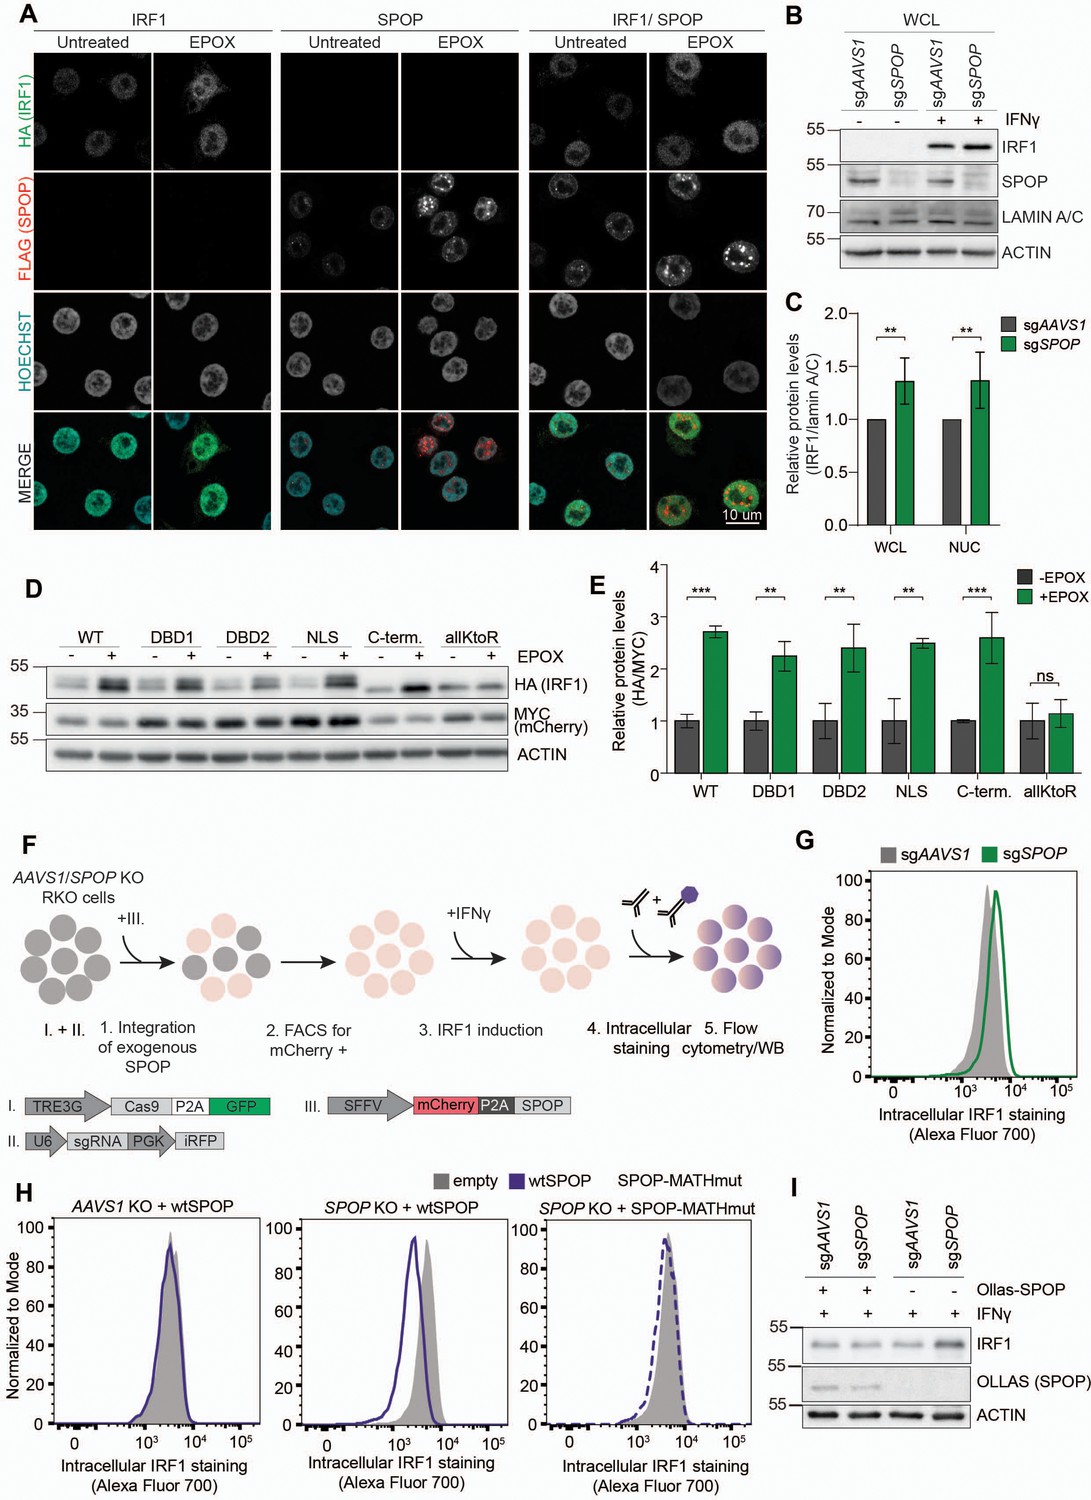
(A) Representative images of RKO cells, stably expressing HA-tagged IRF1 and FLAG-tagged SPOP. 48 hr after seeding, cells were treated with epoxomicin (EPOX) for 4 hr or left untreated. After fixation, cells were stained for the indicated factors, and their localization was analyzed by confocal immunofluorescence microscopy. Extended version of Figure 4A, including single-transduced controls and single channels. (B) Monoclonal RKO-Cas9-GFP cells lines with either wt IRF1 alleles derived from sgAAVS1 expressing cells or homozygous SPOP disrupted alleles were stimulated with IFNγ for 4 hr, after which cell lysates were fractionated. The non-fractionated whole-cell lysate was analyzed for IRF1 and SPOP protein levels by western blot. (C) Quantification of IRF1 protein levels in different subcellular fractions. IRF1 was not detected in the cytosolic fraction. Data represent means and s.d.; n=5 biological replicates. Data were analyzed by unpaired two-tailed t-test; **p<0.01. (D) HEK-293T cells were transfected with plasmids expressing HA-tagged wtIRF1 or IRF1 K-to-R mutants, in which all lysines in the indicated domains are mutated to arginines. MYC-tagged mCherry was expressed from all plasmids as an internal control through a P2A site. At 44 hr post-transfection, cells were treated with EPOX for 4 hr, after which the cells were lysed and analyzed by western blot, and (E) quantified by two-way ANOVA. Data represent means and s.d.; n=2 biological replicates. (F) Overview of rescue experiments. (G) Endogenous IRF1 protein levels determined in AAVS1-targeted, or SPOP-targeted RKO-Cas9-P2A-BFP cells by intracellular staining and flow cytometry. (H–I) AAVS1-targeted or SPOP-targeted RKO-Cas9-P2A-BFP cells were transduced with vectors expressing either mCherry-P2A-wtSPOP or mCherry-P2A-SPOP-MATHmut. Subsequently, endogenous IRF1 protein levels were determined by (H) flow cytometry or (I) western blot.
-
Figure 4—figure supplement 1—source data 1
Western blots corresponding to Figure 4—figure supplement 1A.
- https://cdn.elifesciences.org/articles/89951/elife-89951-fig4-figsupp1-data1-v2.zip
-
Figure 4—figure supplement 1—source data 2
Western blots corresponding to Figure 4—figure supplement 1B.
- https://cdn.elifesciences.org/articles/89951/elife-89951-fig4-figsupp1-data2-v2.zip
-
Figure 4—figure supplement 1—source data 3
Western blots corresponding to Figure 4—figure supplement 1I.
- https://cdn.elifesciences.org/articles/89951/elife-89951-fig4-figsupp1-data3-v2.zip
Figure 4—figure supplement 2
Identification of SPOP as a regulator of interferon regulatory factor 1 (IRF1) abundance.
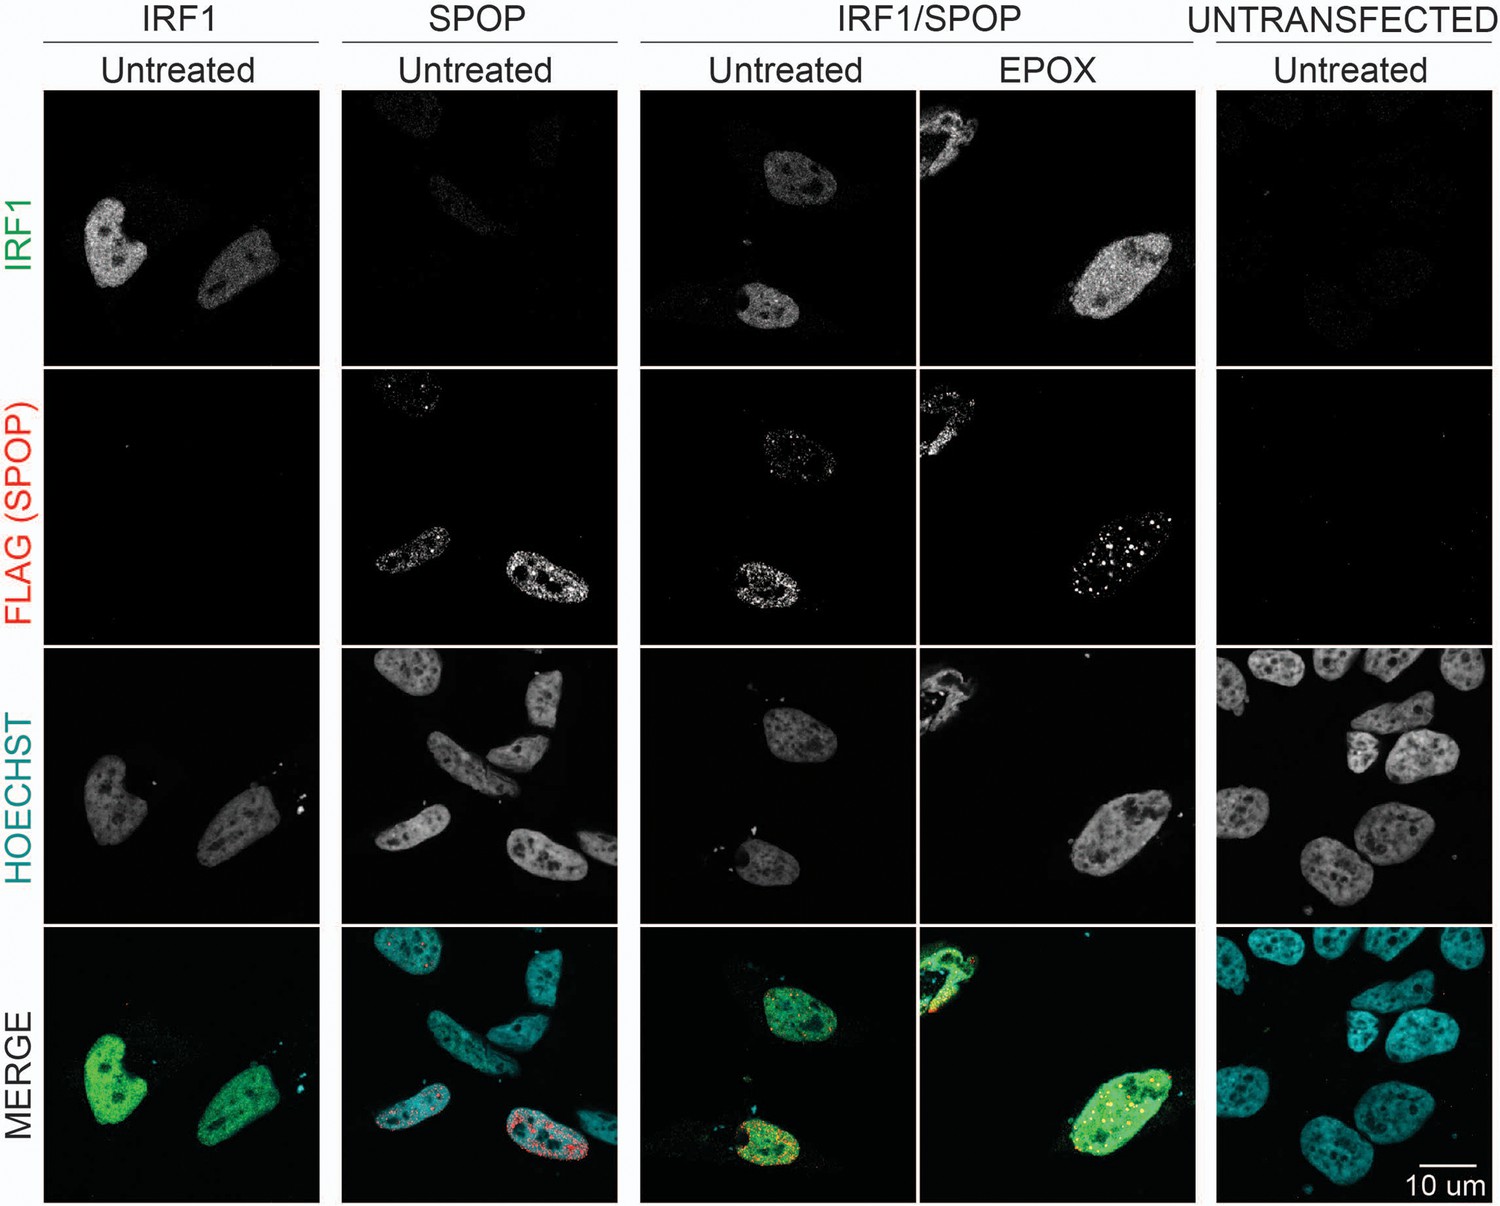
Representative images of HeLa cells transfected with expression plasmids for MYC-tagged IRF1 and FLAG-tagged SPOP. At 48 hr post-transfection, cells were treated with epoxomicin (EPOX) for 4 hr or left untreated. After fixation, cells were stained for HA (IRF1), FLAG (SPOP), and Hoechst (DNA), and localization was analyzed by confocal immunofluorescence microscopy. Extended version of data presented in Figure 4A, including single-transfected controls and single channels.
-
Figure 4—figure supplement 2—source data 1
Western blots corresponding to Figure 4—figure supplement 2.
- https://cdn.elifesciences.org/articles/89951/elife-89951-fig4-figsupp2-data1-v2.zip
Figure 4—figure supplement 3
Identification of SPOP as a regulator of interferon regulatory factor 1 (IRF1) abundance.
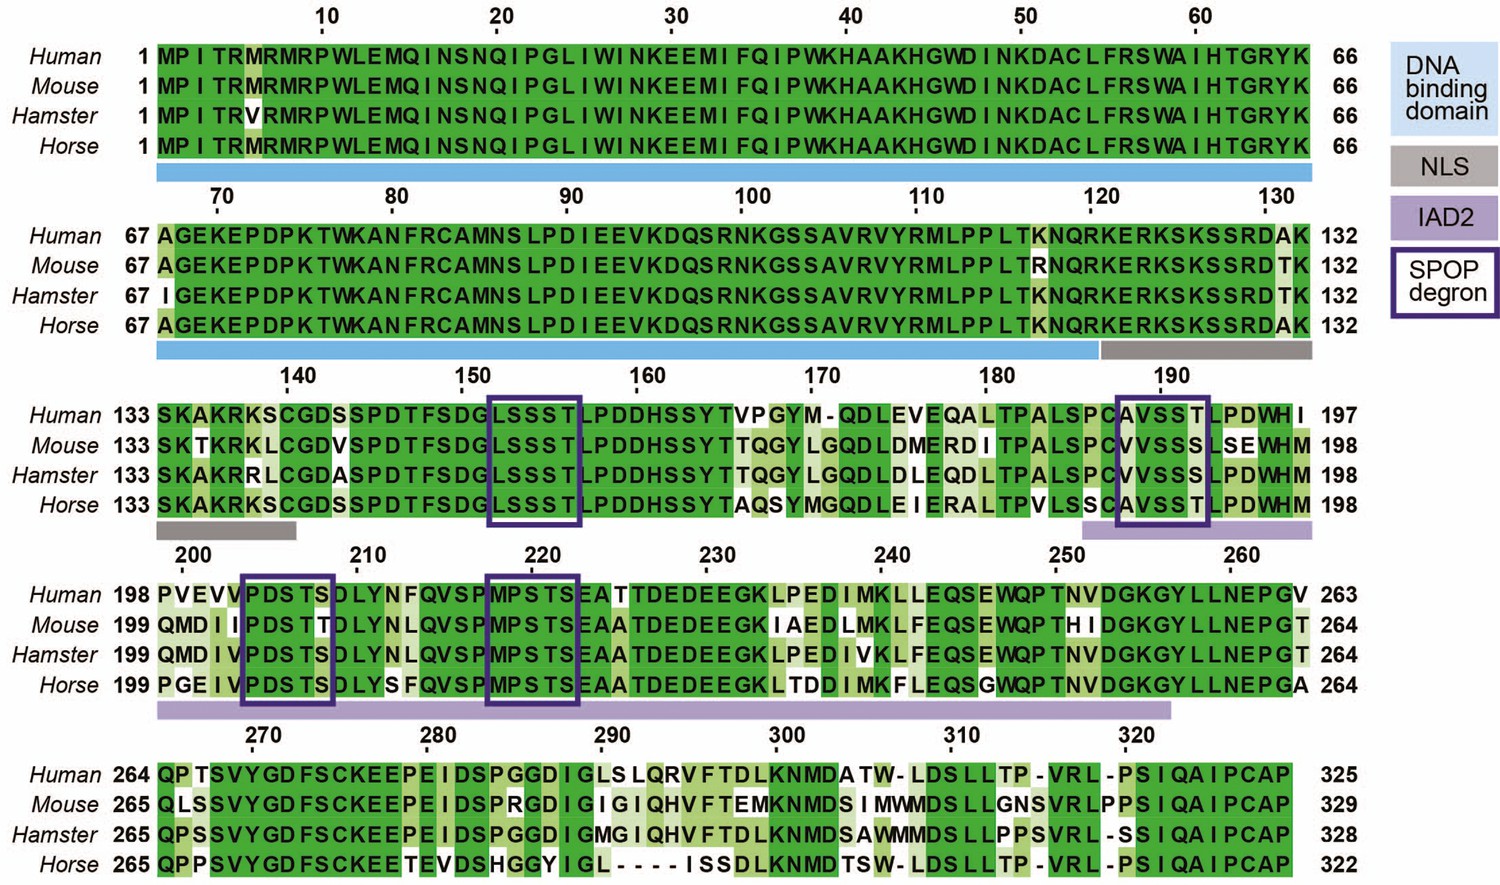
IRF1 protein multiple sequence alignment. Predicted SPOP binding domains are indicated with boxes.
Figure 5 with 1 supplement
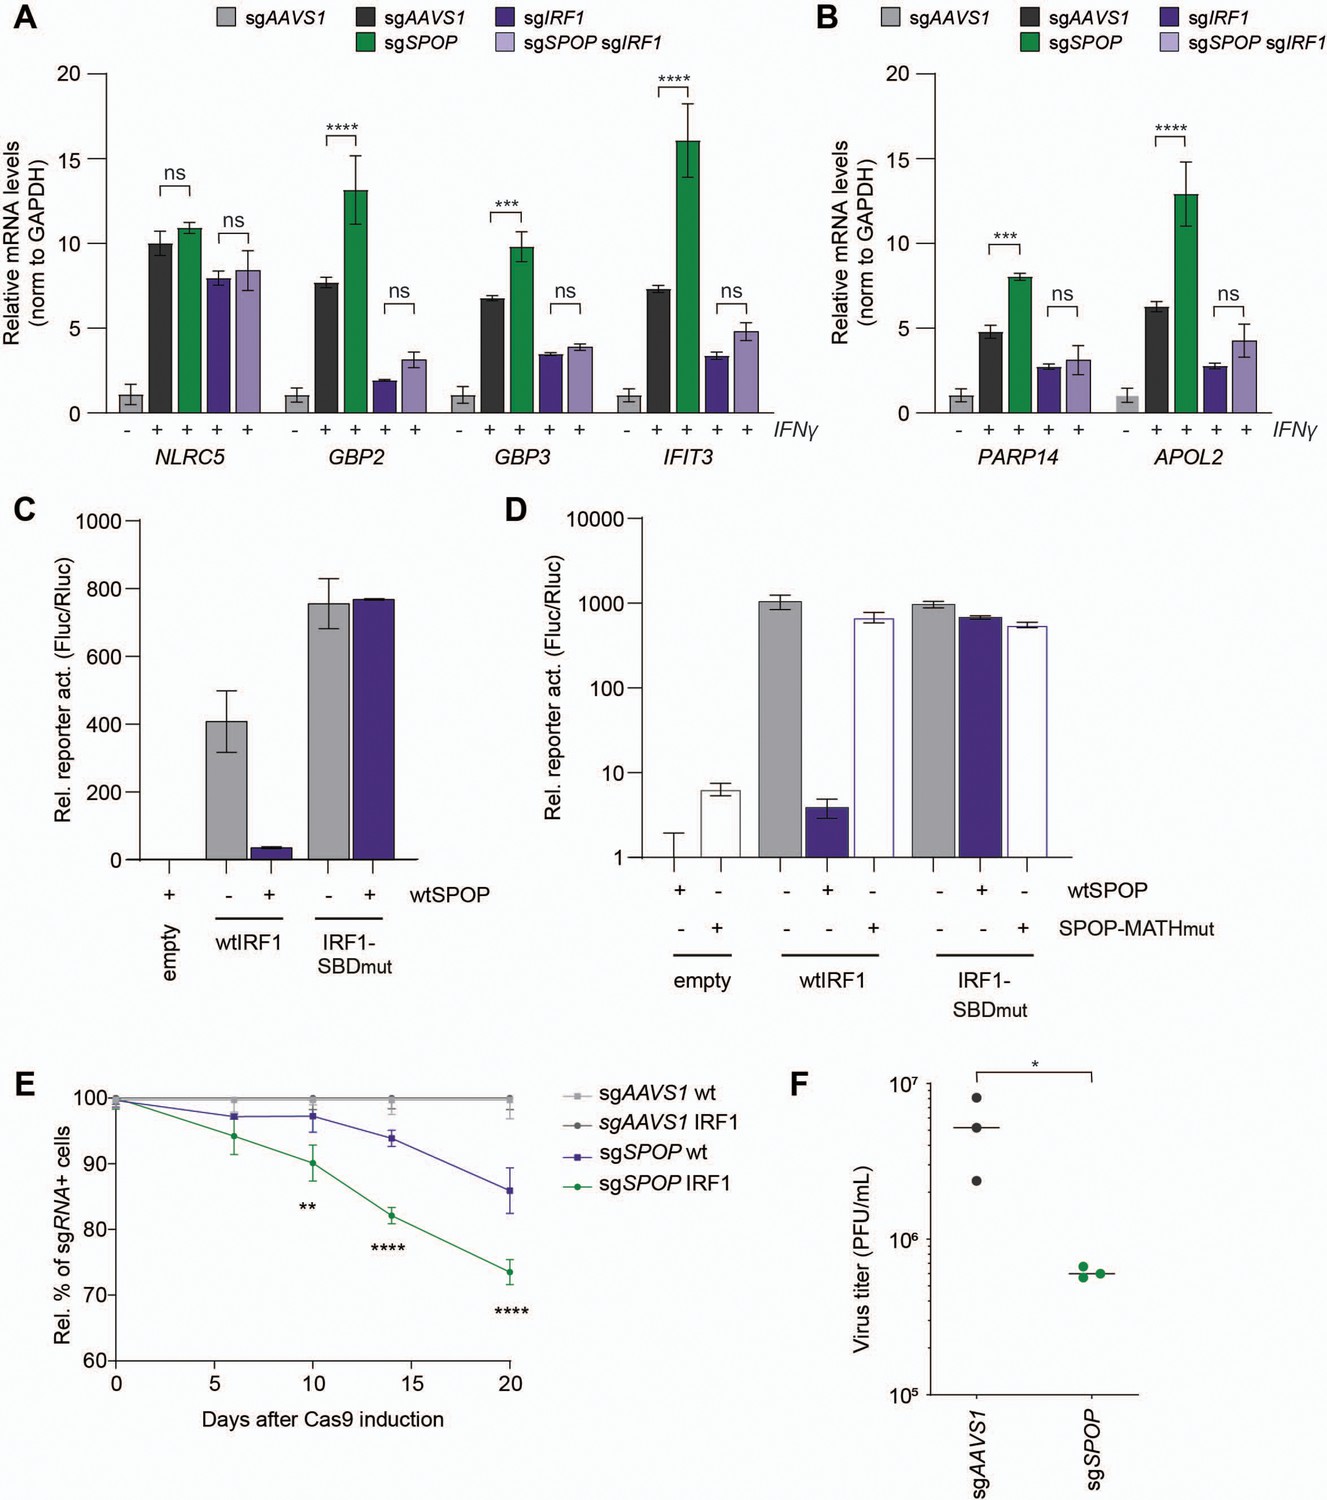
SPOP controls interferon regulatory factor 1 (IRF1)-dependent cellular output.
RKO cells expressing either sgAAVS1, sgSPOP, sgIRF1, or sgSPOP and sgIRF1 together were stimulated with IFNγ for 4 hr and concentrations of the indicated (A) immune-related or (B) non-immune-related mRNAs analyzed by RT-qPCR (n=2 biological replicates). Data represent means and s.d. Data were analyzed by unpaired two-tailed t-test. *p<0.05, ***p<0.001. (C–D) HEK-293T cells were transfected with expression plasmids for an ISRE-Fluc reporter, and (C) equal amounts of the indicated IRF1 and SPOP expression constructs, or (D) half of the amount of IRF1-SBDmut plasmid to match IRF1 protein levels. After 24 hr cell lysates were analyzed by dual luciferase assay. n=3 biological replicates. Data represent means and s.d. (E) RKO-mCherry-IRF1-P2A-BFP cells or the parental cell line with only dox-inducible Cas9-GFP (wt) were transduced with iRFP vectors expressing sgAAVS1 or sgSPOP in 30–60% of all cells. Gene editing was induced with Dox and the fraction of transduced cells monitored for 20 days. At the indicated times, the fraction of sgRNA vector-positive cells was determined by flow cytometry. Graphs show relative abundance of sgSPOP-positive cells normalized to sgAAVS1 of the same cell line on day 0. Data were analyzed by two-way ANOVA; n=3 biological replicates; **p<0.01, ****p<0.0001. (F) RKO-mCherry-IRF1-P2A-BFP cells in which IRF3 and STAT1 were targeted by sgRNAs, were transduced with expression vectors for either sgAAVS1 or sgSPOP. sgRNA-positive cells were sorted by fluorescence-activated cell sorting (FACS), and subsequently infected with vesicular stomatitis virus (VSV) at a multiplicity of infection (MOI) of 0.0005. After 26 hr, supernatants were collected, and progeny virus titers determined by plaque assays.
Figure 5—figure supplement 1
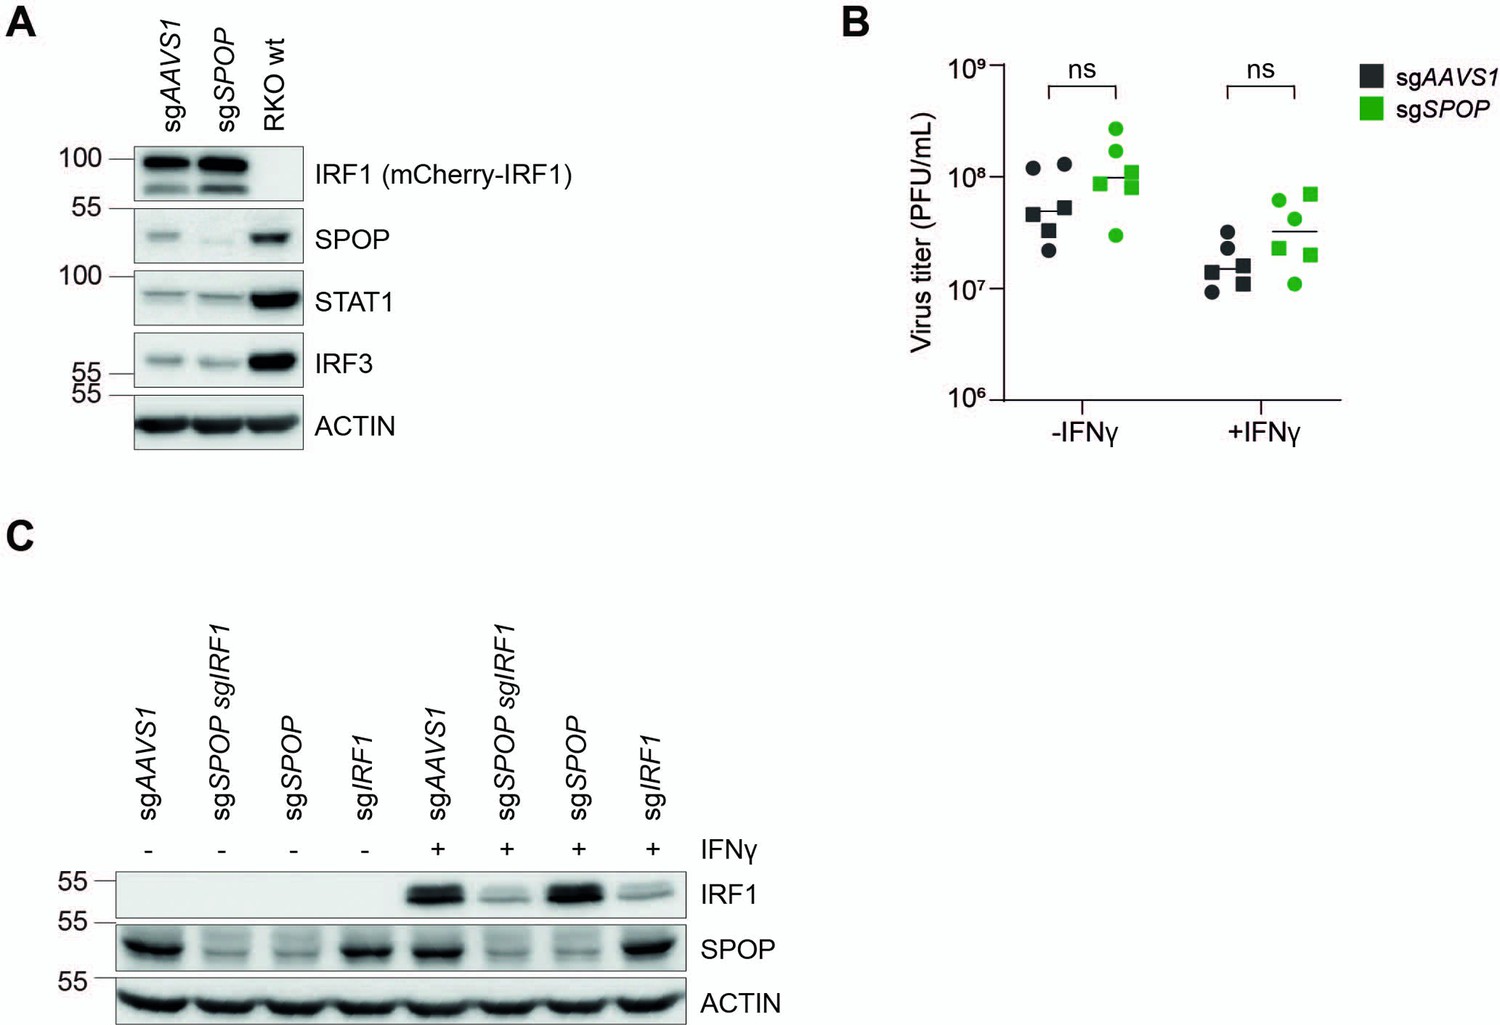
SPOP controls interferon regulatory factor 1 (IRF1)-dependent cellular output.
(A) RKO cells expressing either sgAAVS1, sgSPOP, sgIRF1, or sgSPOP and sgIRF1 together were stimulated with IFNγ for 4 hr, after which IRF1 protein levels were analyzed by western blot (WB). (B) Two independent monoclonal RKO cell lines with homozygous disruptions of either their AAVS1 or SPOP genes were infected with vesicular stomatitis virus (VSV) at a multiplicity of infection (MOI) of 0.0005. After 26 hr the virus-containing supernatants were collected, and virus titers determined by plaque assays. Data were analyzed by two-way ANOVA, n=3 biological replicates from each of two individual monoclonal cell lines from each genotype (indicated by triangle/square symbols). (C) RKO cells depleted of IRF3 and STAT1 were transduced with expression vectors of either sgAAVS1 or sgSPOP and sorted for sgRNA-positive cells. Subsequently, the indicated protein levels were analyzed by WB.
-
Figure 5—figure supplement 1—source data 1
Western blots corresponding to Figure 5—figure supplement 1A.
- https://cdn.elifesciences.org/articles/89951/elife-89951-fig5-figsupp1-data1-v2.zip
-
Figure 5—figure supplement 1—source data 2
Western blots corresponding to Figure 5—figure supplement 1C.
- https://cdn.elifesciences.org/articles/89951/elife-89951-fig5-figsupp1-data2-v2.zip
Additional files
-
Supplementary file 1
Antibodies used in this study.
- https://cdn.elifesciences.org/articles/89951/elife-89951-supp1-v2.xlsx
-
Supplementary file 2
Reagents used in this study.
- https://cdn.elifesciences.org/articles/89951/elife-89951-supp2-v2.xlsx
-
Supplementary file 3
Plasmids used in this study.
- https://cdn.elifesciences.org/articles/89951/elife-89951-supp3-v2.xlsx
-
Supplementary file 4
sgRNA sequences used in this study.
- https://cdn.elifesciences.org/articles/89951/elife-89951-supp4-v2.xlsx
-
Supplementary file 5
Cell lines used in this study.
- https://cdn.elifesciences.org/articles/89951/elife-89951-supp5-v2.xlsx
-
Supplementary file 6
qPCR primers used in this study.
- https://cdn.elifesciences.org/articles/89951/elife-89951-supp6-v2.xlsx
-
Supplementary file 7
Next-generation sequencing (NGS) library PCR primers used in this study.
- https://cdn.elifesciences.org/articles/89951/elife-89951-supp7-v2.xlsx
-
Supplementary file 8
Results from CRISPR-Cas9 genetic screens of mCherry-IRF1 and mCherry-cMYC.
- https://cdn.elifesciences.org/articles/89951/elife-89951-supp8-v2.xlsx
-
MDAR checklist
- https://cdn.elifesciences.org/articles/89951/elife-89951-mdarchecklist1-v2.pdf
Download links
A two-part list of links to download the article, or parts of the article, in various formats.
Downloads (link to download the article as PDF)
Open citations (links to open the citations from this article in various online reference manager services)
Cite this article (links to download the citations from this article in formats compatible with various reference manager tools)
SPOP targets the immune transcription factor IRF1 for proteasomal degradation
eLife 12:e89951.
https://doi.org/10.7554/eLife.89951


