WRNIP1 prevents transcription-associated genomic instability
- Section of Mechanisms Biomarkers and Models, Department of Environment and Health, Istituto Superiore di Sanita, Italy
Figures
Figure 1 with 2 supplements
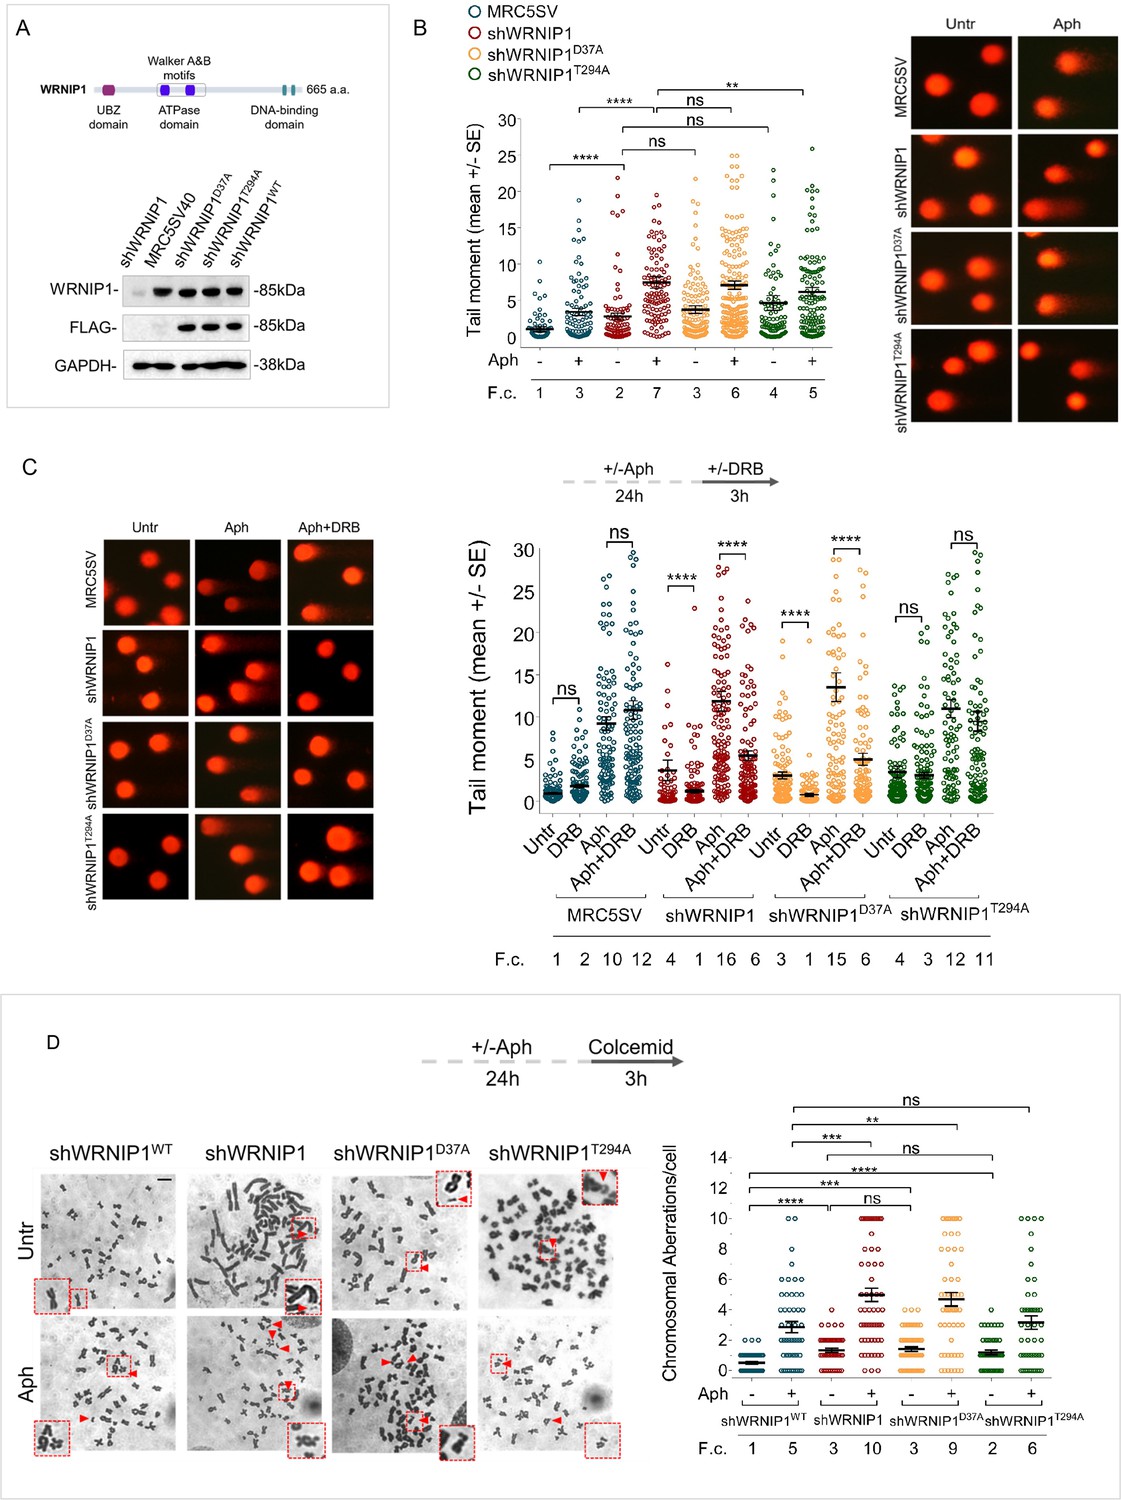
Loss of WRNIP1 or its UBZ domain results in DNA damage accumulation and enhanced chromosomal instability upon MRS.
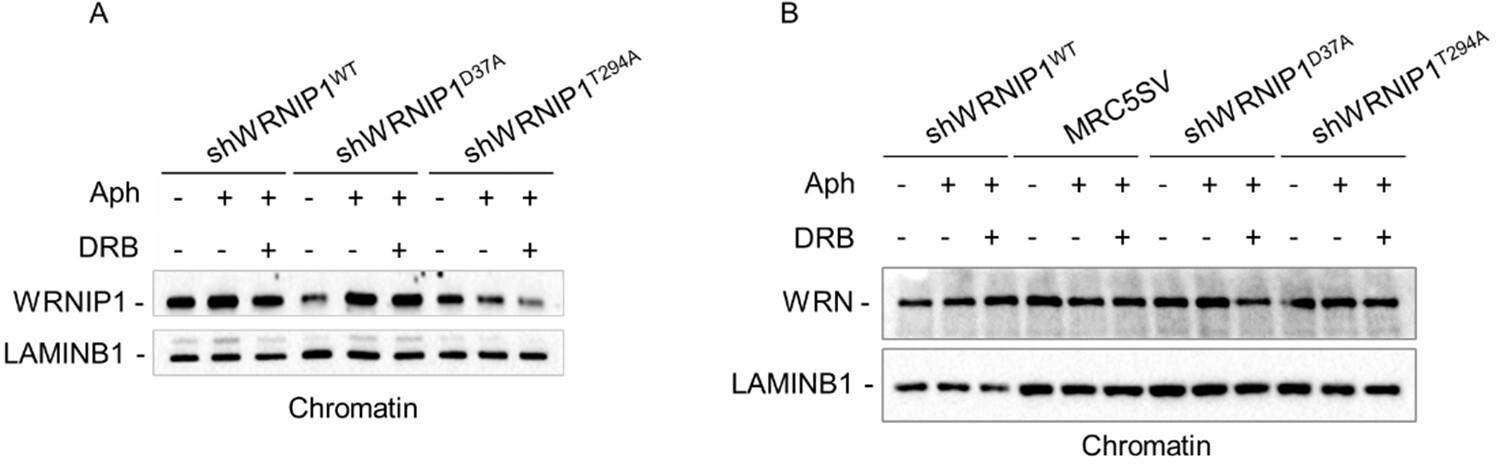
(A) Schematic representation of human WRNIP1 protein structure. Western blot analysis shows WRNIP1 protein expression in wild-type cells (shWRNIP1WT), WRNIP1-deficient cells (shWRNIP1) and WRNIP1 ATPase mutant (shWRNIP1T294A) or WRNIP1 UBZ mutant (shWRNIP1D37A) cells. MRC5SV40 fibroblasts were used as a positive control. The membrane was probed with an anti-FLAG or anti-WRNIP1 antibody. GAPDH was used as a loading control. (B) Analysis of DNA damage accumulation evaluated by alkaline Comet assay. MRC5SV, shWRNIP1, shWRNIP1D37A, and shWRNIP1T294A cells were treated or not with 0.4 µM Aph for 24 hr, followed by Comet assay. Data are presented as means from three independent experiments. Horizontal black lines represent the mean (ns, not significant; **, p<0.01; ****, p<0.0001; Mann-Whitney test). Representative images are provided. (C) Analysis of chromosomal aberrations in the indicated cell lines treated according to the experimental scheme. Dot plot displays the number of chromosomal aberrations per cell ±SE from three independent experiments. Horizontal black lines represent the mean (ns, not significant; **, p<0.01; ***, p<0.001; ****, p<0.0001; two-tailed Student’s t test). Representative images, including insets with enlarged metaphases for better visualization of chromosomal aberrations, are included. (D) Evaluation of DNA damage accumulation by alkaline Comet assay. Cells were treated according to the experimental scheme and subjected to Comet assay. Dot plot presents as means from three independent experiments. Horizontal black lines represent the mean (ns, not significant; ****, p<0.0001; Mann-Whitney test). Representative images are provided. Scale bar, 2.5 μm. Fold changes (F. c) were calculated as ratio of means between each experimental sample and the relative wild-type untreated.
-
Figure 1—source data 1
PDF containing original scans of the western blot (anti-WRNIP1, anti-FLAG, and anti-GAPDH) and related original TIFF images.
- https://cdn.elifesciences.org/articles/89981/elife-89981-fig1-data1-v1.zip
Figure 1—figure supplement 1
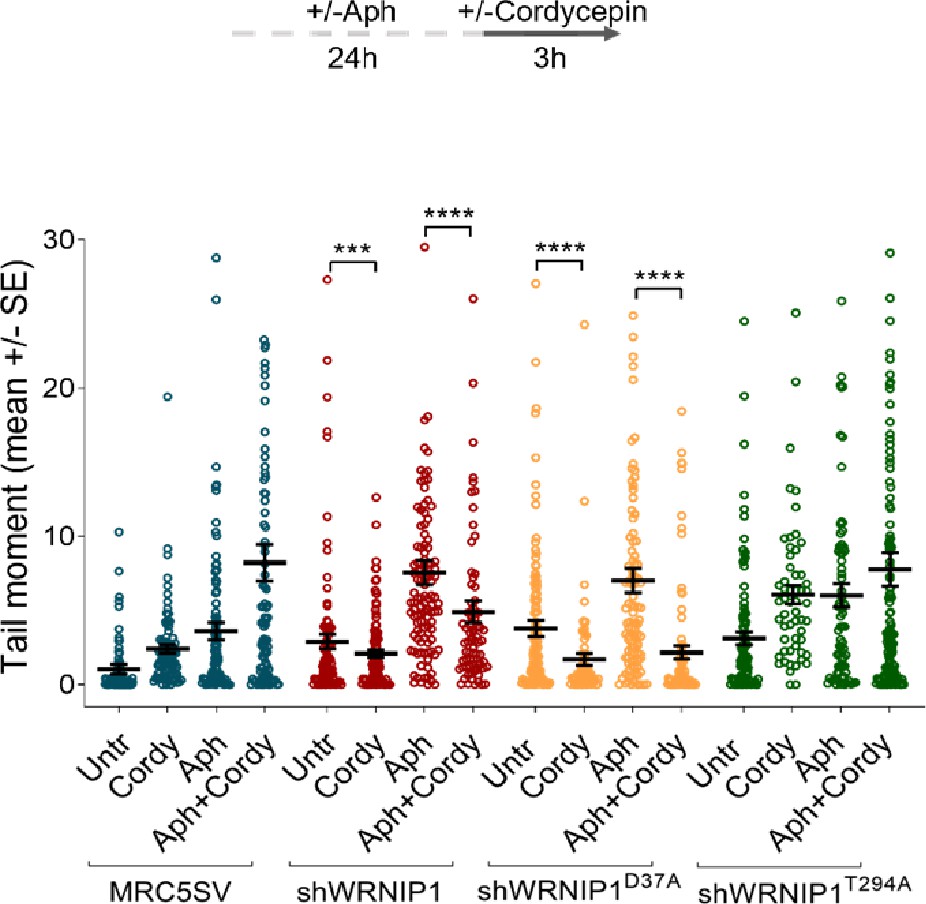
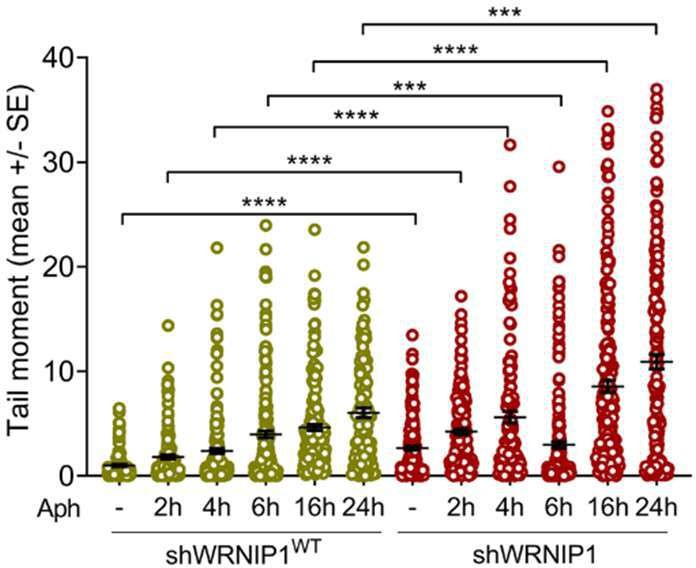
Loss of WRNIP1 or its UBZ domain increases DNA damage upon MRS.
Evaluation of DNA damage accumulation by alkaline Comet assay. MRC5SV, shWRNIP1, shWRNIP1D37A, and shWRNIP1T294A cells were treated according to the experimental scheme (0.4 µM Aph and 50 µM Cordy), and then subjected to Comet assay. Dot plot displays data as means from three independent experiments. Horizontal black lines represent the mean (***, p<0.001; ****, p<0.0001; Mann-Whitney test).
Figure 1—figure supplement 2
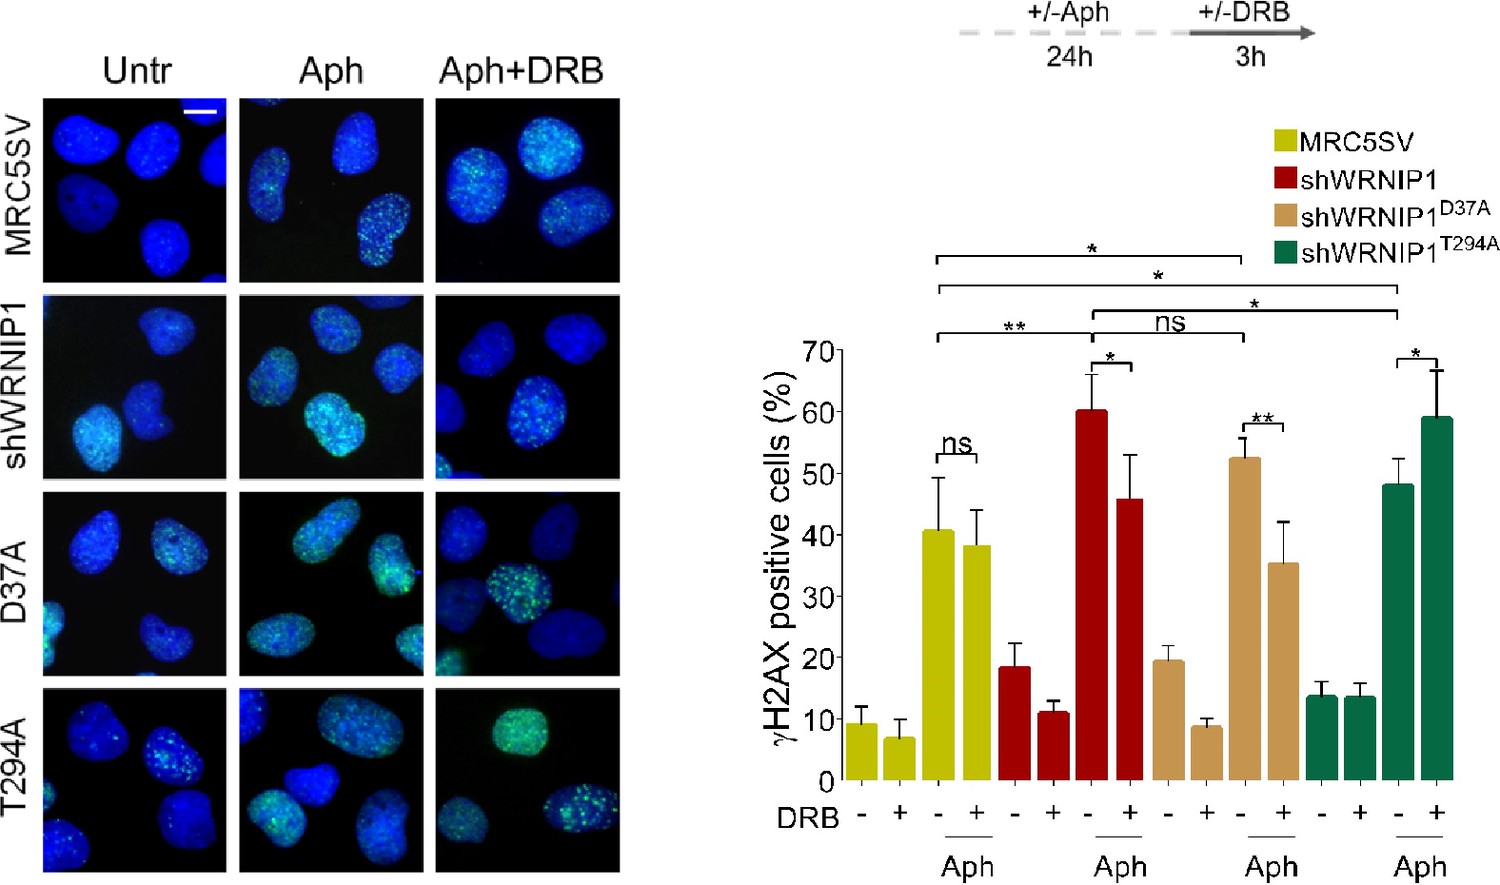
Loss of WRNIP1 or its UBZ domain increases levels of γH2AX.
MRC5SV, shWRNIP1, shWRNIP1D37A, and shWRNIP1T294A cells were treated according to the experimental scheme (0.4 µM Aph and 50 µM DRB), and then immunostained for γ-H2AX. The graph displays data presented as percentage of γ-H2AX-positive cells ± SE from three independent experiments (ns, not significant; *, p<0.05; **, p<0.01; ***, p<0.001; two-tailed Student’s t test). Representative images of nuclei showing the different number of foci per nucleus are provided. Scale bar, 2.5 μm.
Figure 2
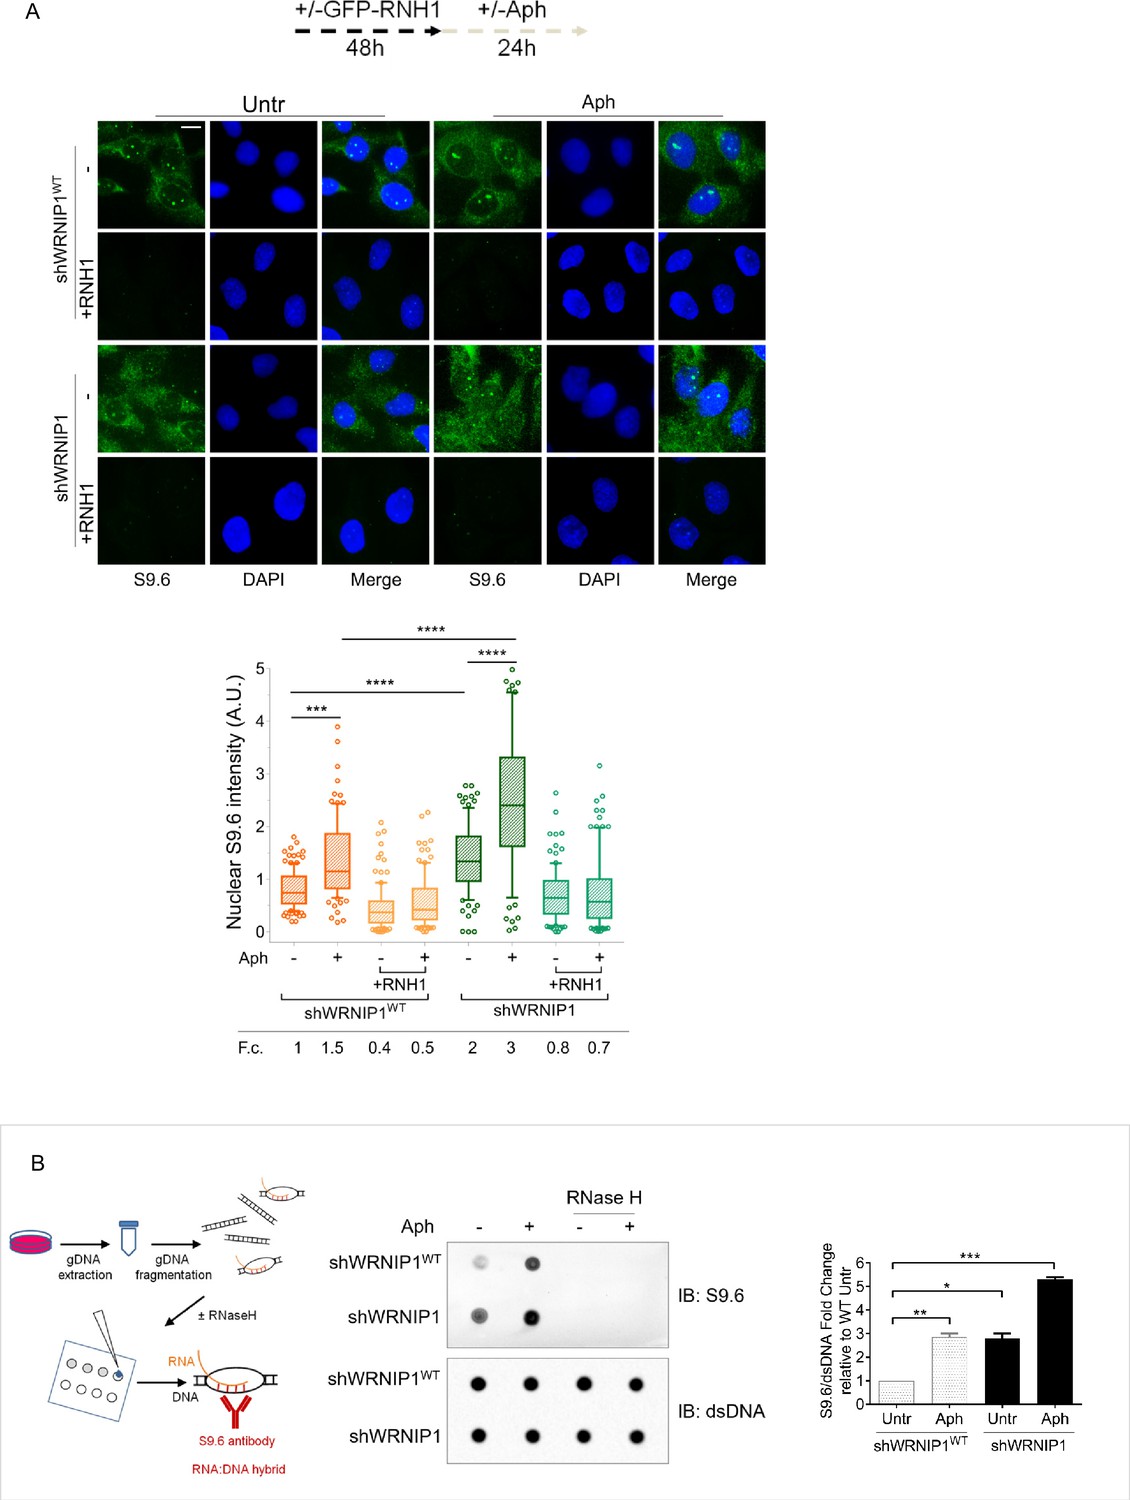
Loss of WRNIP1 or its UBZ domain results in R-loop accumulation upon MRS.
(A) Evaluation of R-loop accumulation by immunofluorescence analysis in shWRNIP1WT and shWRNIP1 cells, following treatment as reported in the experimental design post-transfection with GFP-tagged RNase H1 or empty vector. Cells were fixed, stained with anti-RNA-DNA hybrid S9.6 antibody, and DNA counterstained with DAPI. Representative images are provided for each single color channel. Box plot displays nuclear S9.6 fluorescence intensity, with boxes and whiskers representing 20–75 and 10–90 percentiles, respectively. The line represents the median value. Data are presented as means from three independent experiments. Horizontal black lines represent the mean. Error bars represent standard error (***, p<0.001; ****, p<0.0001; two-tailed Student’s t test). Scale bar, 2.5 μm. (B) Dot blot to confirm R-loop accumulation. Genomic DNA isolated from shWRNIP1WT and shWRNIP1 cells, treated as reported in the experimental design, was spotted onto a nitrocellulose membrane. The membranes was probed with anti-RNA-DNA hybrid S9.6 and anti-dsDNA antibodies. Treatment with RNase H was used as a negative control. Representative gel images of at least three replicates are shown (* p<0.05; ** p<0.01; *** p<0.001; two-tailed Student’s t test). Fold changes (F. c) were calculated as ratio of means between each experimental sample and the relative wild-type untreated.
-
Figure 2—source data 1
PDF containing original scans of the dot blot (anti-S9.6, anti-dsDNA) and related original TIFF images used for the analysis.
- https://cdn.elifesciences.org/articles/89981/elife-89981-fig2-data1-v1.zip
Figure 3 with 1 supplement
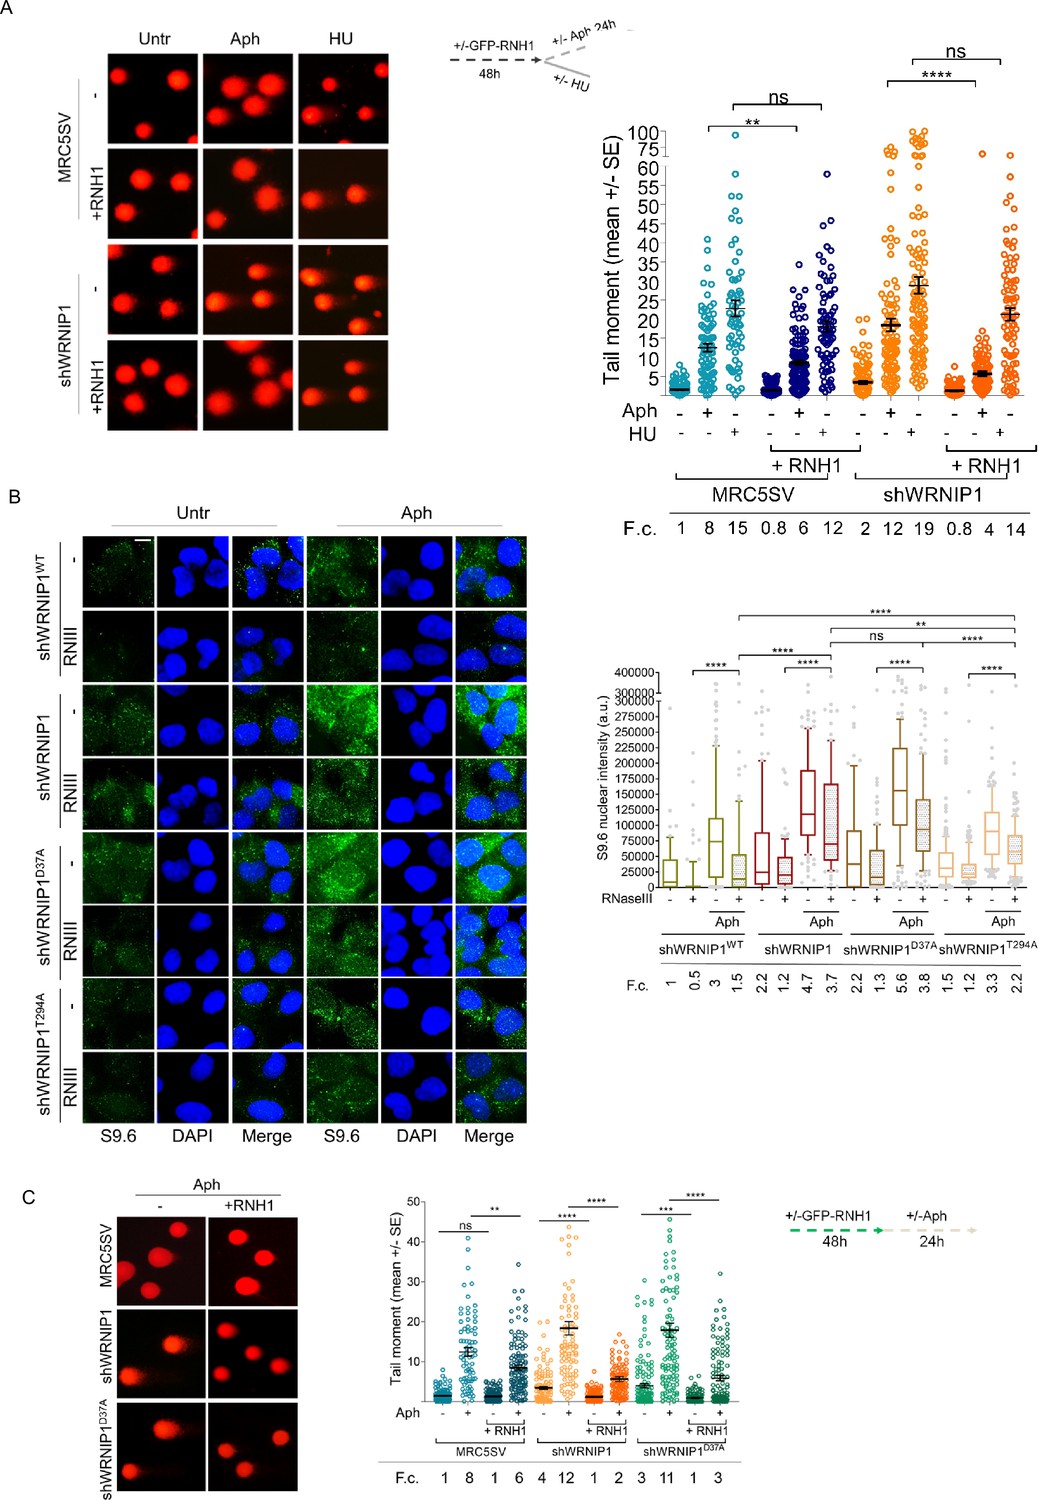
Loss of WRNIP1 or its UBZ domain leads to R-loop-dependent accumulation upon MRS.
(A) Analysis of DNA damage accumulation by alkaline Comet assay. MRC5SV and shWRNIP1 cells, post-transfection with GFP-tagged RNaseH1 or empty vector (-), were treated or not with Aph or HU, following the experimental scheme. Subsequently, they were subjected to Comet assay. Dot plot shows data from three independent experiments (ns, not significant; **, p<0.01; **** p<0.0001; Mann-Whitney test). Representative images are provided. (B) Immunofluorescence analysis to determine R-loop levels in shWRNIP1WT, shWRNIP1, shWRNIP1D37A, and shWRNIP1T294A cells, treated or not with 0.4 µM Aph for 24 hr. After fixing, cells were subjected or not to RNase III digestion and stained with anti-RNA-DNA hybrid S9.6 antibody. Representative images are provided for each single color channel. Nuclei were counterstained with DAPI. Box plot displays nuclear S9.6 fluorescence intensity, with boxes and whiskers representing 20–75 and 10–90 percentiles, respectively. The line represents the median value. Horizontal black lines represent the mean. Error bars represent SE (ns, not significant; **, p<0.01; ****, p<0.0001; two-tailed Student’s t test). Scale bar, 2.5 μm. (C) Analysis of the effect of R-loop resolution on DNA damage accumulation using alkaline Comet assay. Cells, post-transfection with GFP-tagged RNase H1 or empty vector, were treated as reported in the experimental scheme and subjected to Comet assay. Dot plot represents data from three independent experiments. Horizontal black lines represent the mean (ns, not significant; ** p<0.01; *** p<0.001; **** p<0.0001; Mann-Whitney test). Representative images are provided. Fold changes (F.c) were calculated as ratio of means between each experimental sample and the relative wild-type untreated.
Figure 3—figure supplement 1
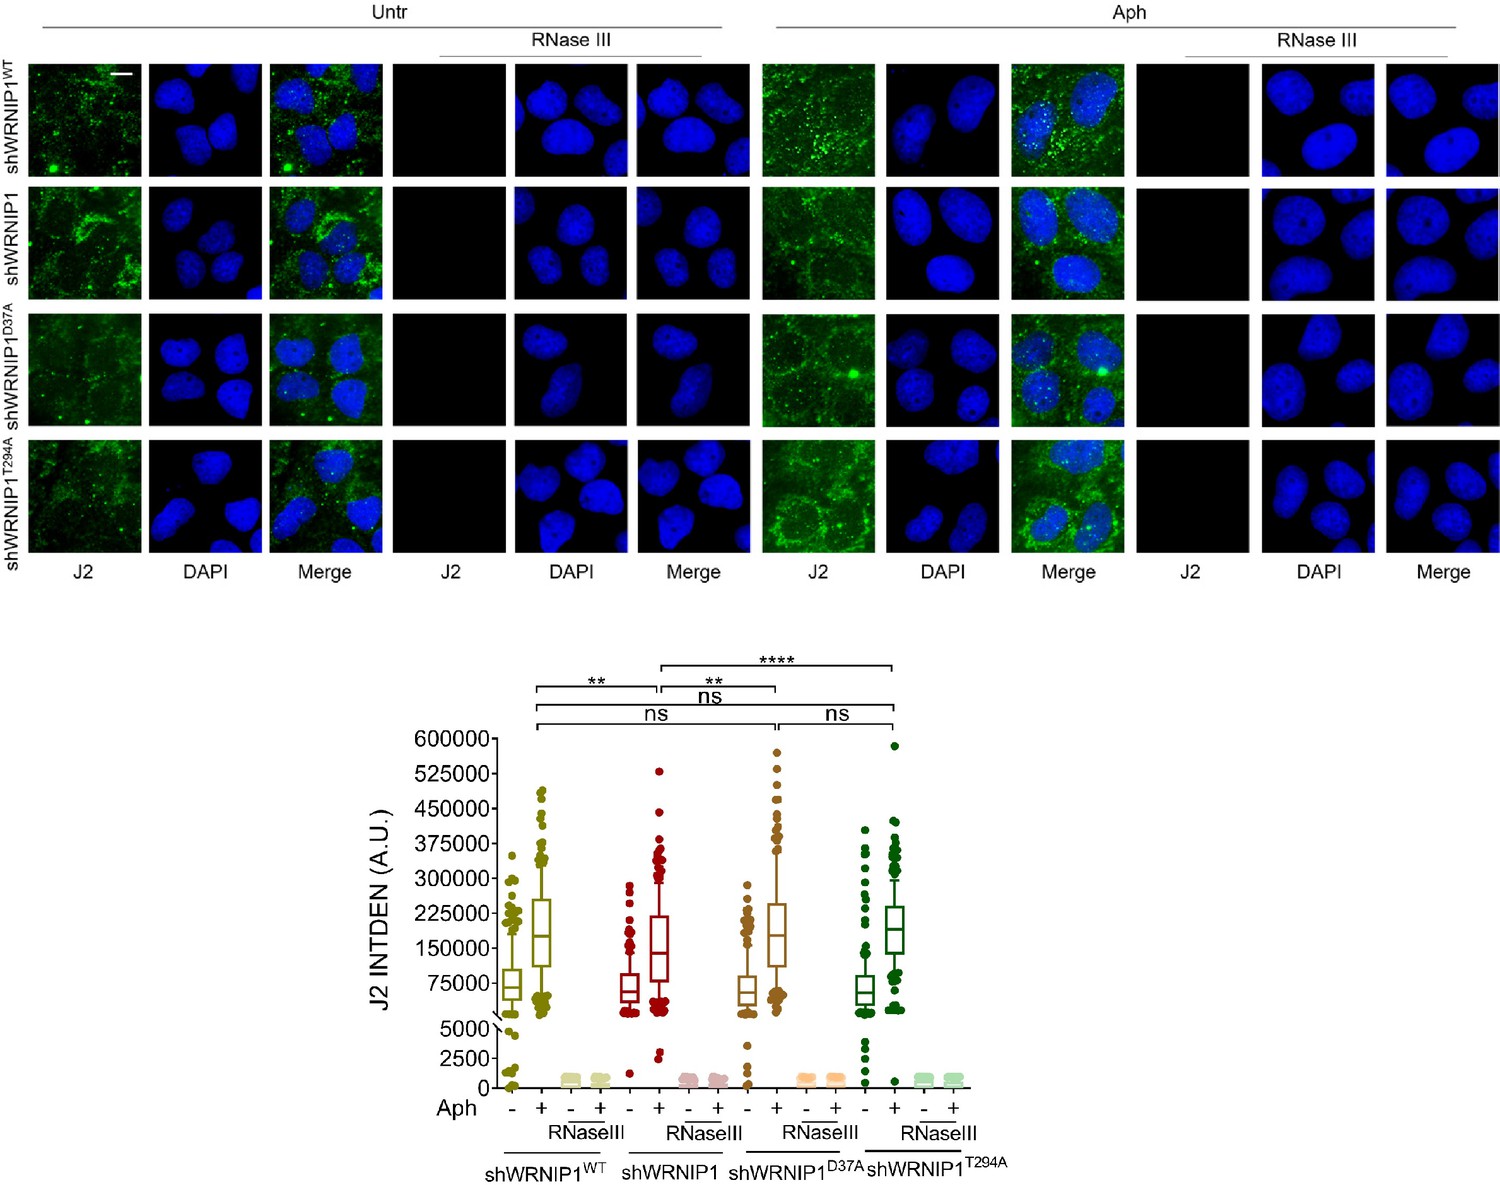
RNase III digestion significantly reduces the amount of dsRNA.
Immunofluorescence analysis to determine dsRNA signal in MRC5SV, shWRNIP1, shWRNIP1D37A, and shWRNIP1T294A cells treated or not with 0.4 µM Aph for 24 hr. Cells were then fixed, subjected or not to RNase III digestion, and stained with anti-dsRNA monoclonal antibody J2. Representative images are provided for each single color channel. Nuclei were counterstained with DAPI. Dot plot shows nuclear dsRNA fluorescence intensity. The line represents the median value. Data are presented as means from three independent experiments. Horizontal black lines represent the mean. Error bars represent SE (ns, not significant; **, p<0.01; ****, p<0.0001; two-tailed Student’s t test). Scale bar, 2.5 μm.
Figure 4
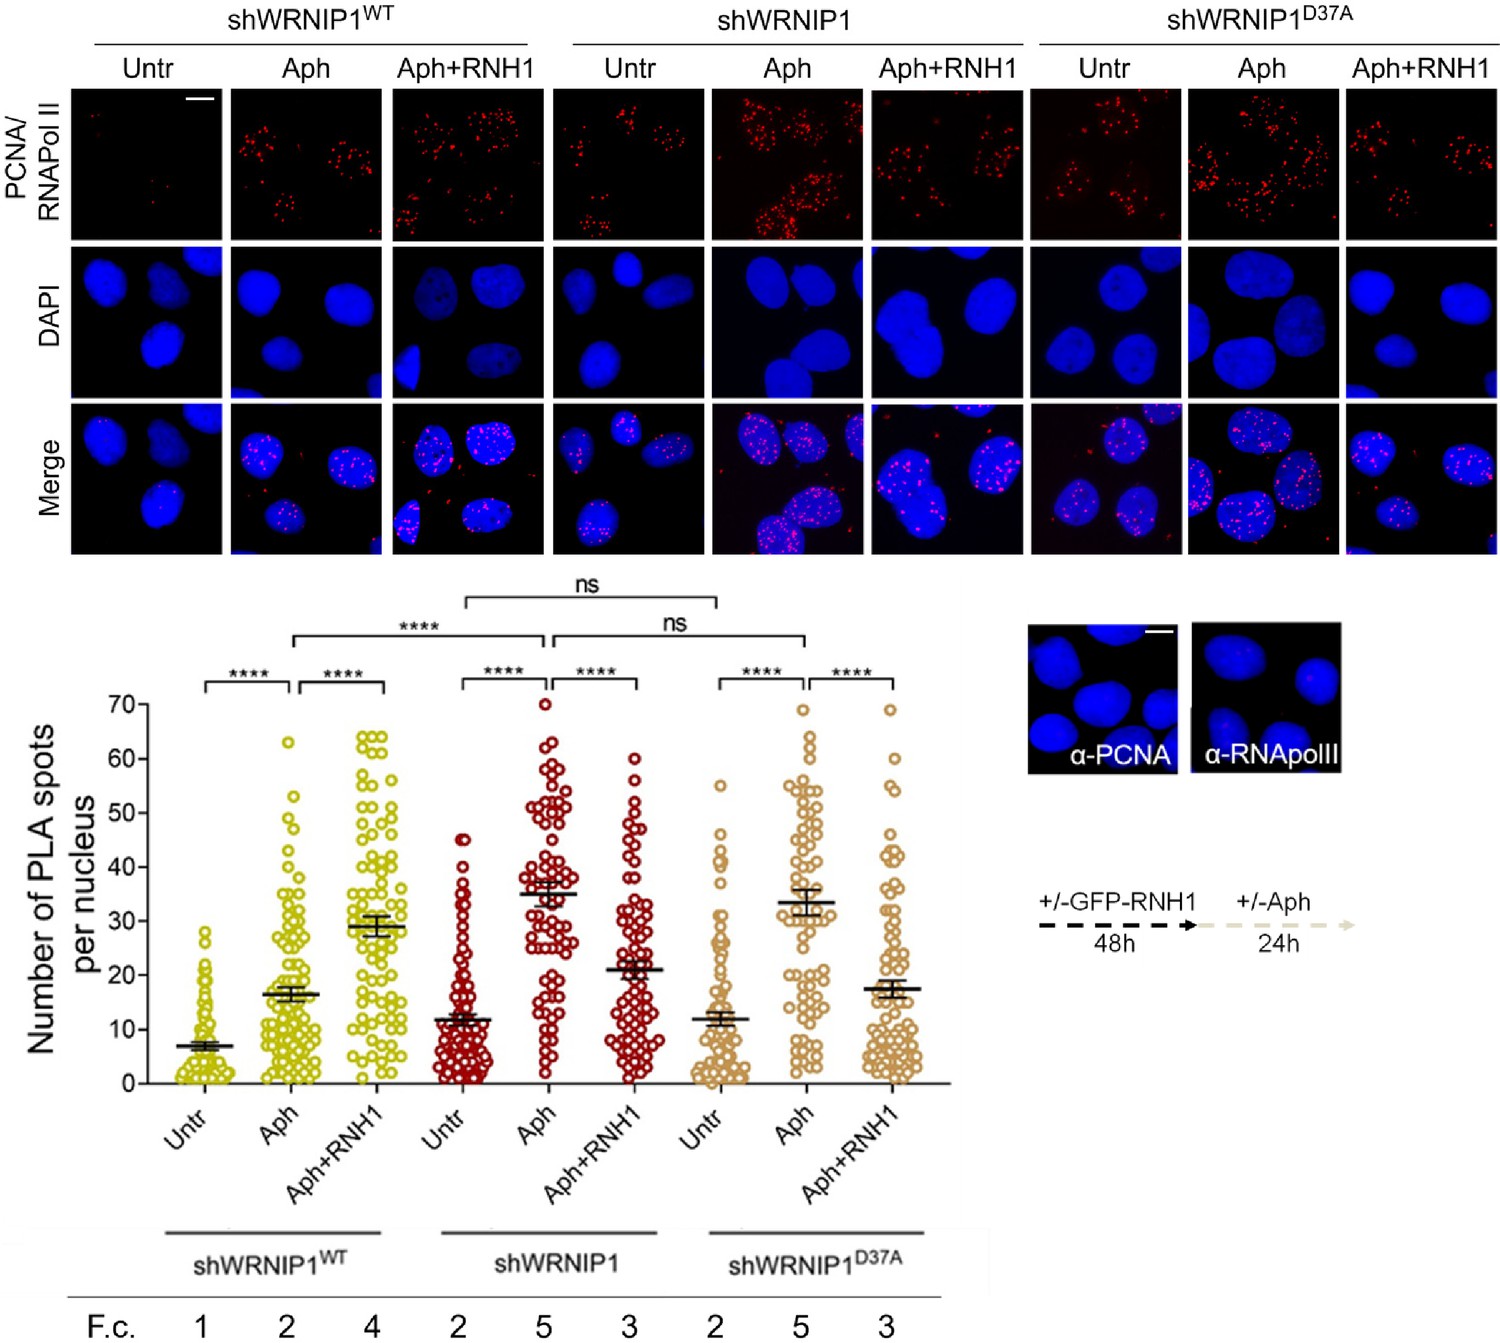
Loss of WRNIP1 or its UBZ domain promotes R-loop-dependent TRCs accumulation.
Detection of TRCs by fluorescence-based PLA assay in MRC5SV, shWRNIP1 and shWRNIP1D37A cells. Post-transfection with GFP-tagged RNase H1 or empty vector, cells treated according to the experimental scheme. After fixing, cells were stained with antibodies against PCNA and RNA pol II. Representative images are provided for each single color channel. Each red spot represents a single interaction between proteins. No spots were observed in cells stained with each single antibody (negative control). Nuclei were counterstained with DAPI. Dot plot shows the number of PLA spots per nucleus. Data are presented as means from three independent experiments. Horizontal black lines represent the mean ± SE (ns, not significant; ****, p<0.0001; one-way ANOVA test). Fold changes (F. c) were calculated as ratio of means between each experimental sample and the relative wild-type untreated. Scale bar, 2.5 μm.
Figure 5
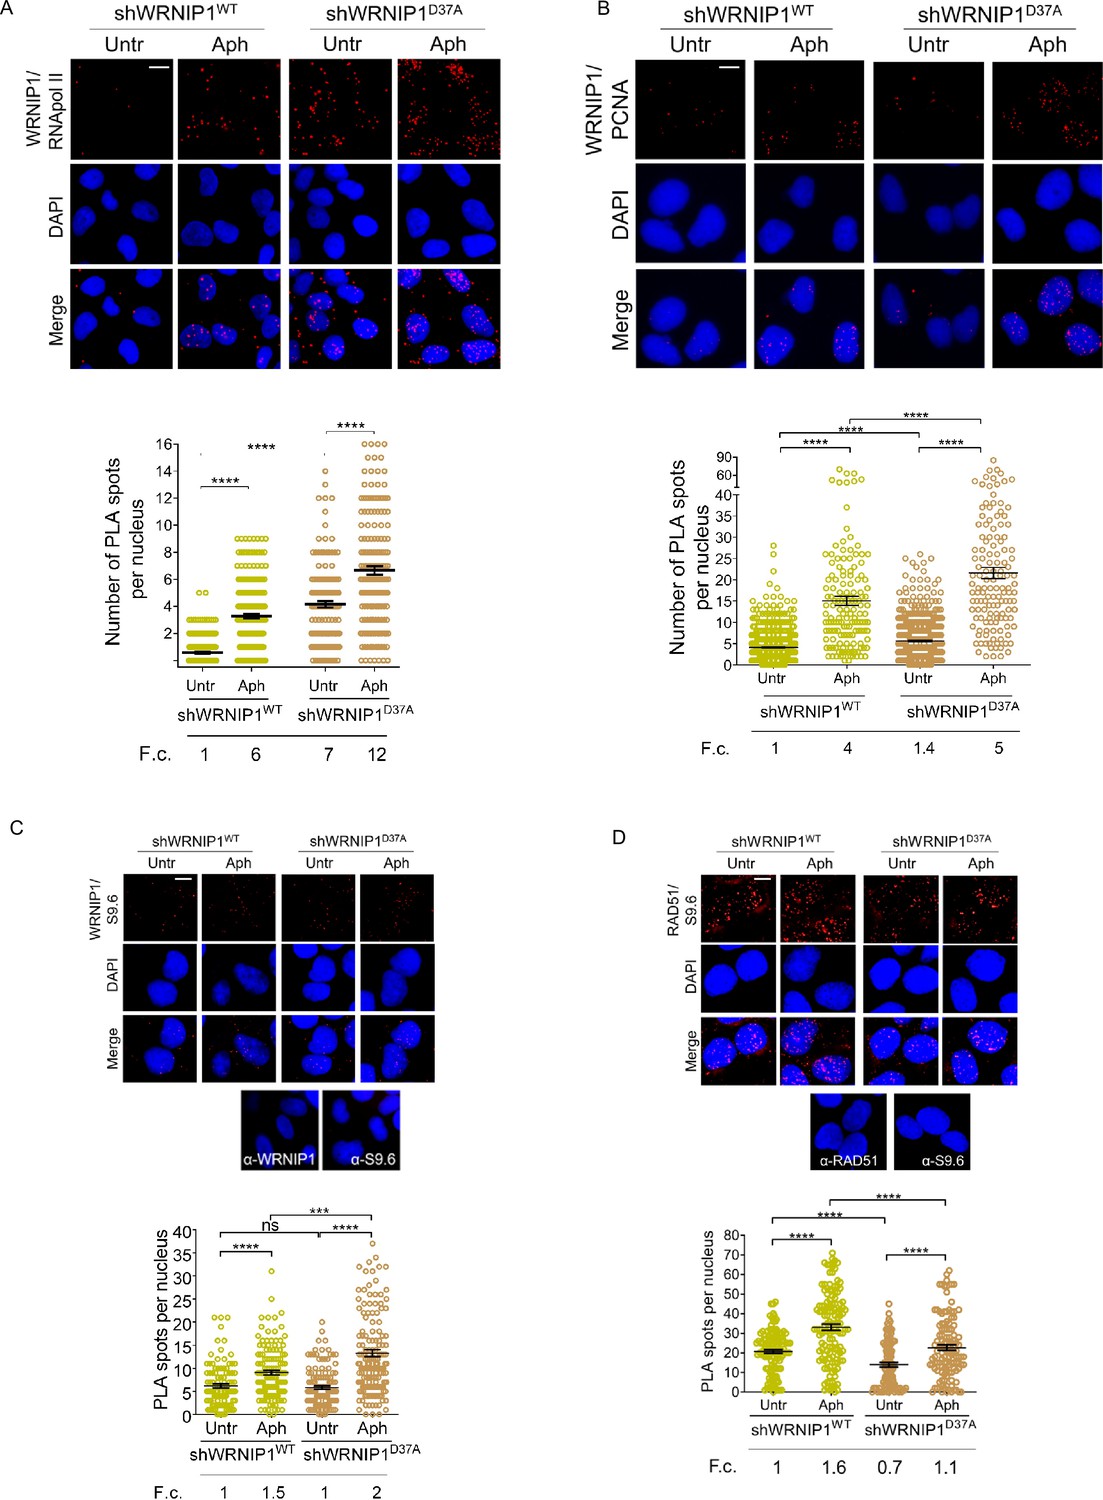
Analysis of localization of WRNIP1 or UBZ mutant by PLA assay.
(A and B) Analysis of the localization of WRNIP1 near/at the transcription and replication machineries by PLA. Cells were treated or not with 0.4 µM Aph for 24 hr, fixed, and stained with antibodies against WRNIP1 and RNA pol II (A) or WRNIP1 and PCNA (B) to visualize the interaction between WRNIP1 and replication or transcription machinery, respectively. Each red spot represents a single interaction between proteins. Representative images are provided for each single color channel. Nuclei were counterstained with DAPI. Dot plots show the number of PLA spots per nucleus. Data are presented as means from three independent experiments. Horizontal black lines represent the mean ± SE (****, p<0.0001; one-way ANOVA test). (C and D) Detection of physical interaction between WRNIP1 and R-loops (C) or R-loops and RAD51(D). Cells were treated or not with 0.4 µM Aph for 24 hr, followed by RNase III digestion and the PLA assay. Cells were stained with antibodies against RNA-DNA hybrid (anti-S9.6) and WRNIP1 (C) or RNA-DNA hybrid (anti-S9.6) and RAD51 (D). Representative images are provided for each individual color channel. Each red spot represents a single interaction between R-loops and the respective proteins (WRNIP1 or RAD51). No spots were observed in cells stained with each single antibody (negative control). Nuclei were counterstained with DAPI. Dot plot shows the number of PLA spots per nucleus. Horizontal black lines represent the mean ± SE (ns, not significant; ***, p<0.001; ****, p<0.0001; one-way ANOVA test). Fold changes (F. c) were calculated as ratio of means between each experimental sample and the relative wild-type untreated. Scale bar, 2.5 μm.
Figure 6 with 1 supplement
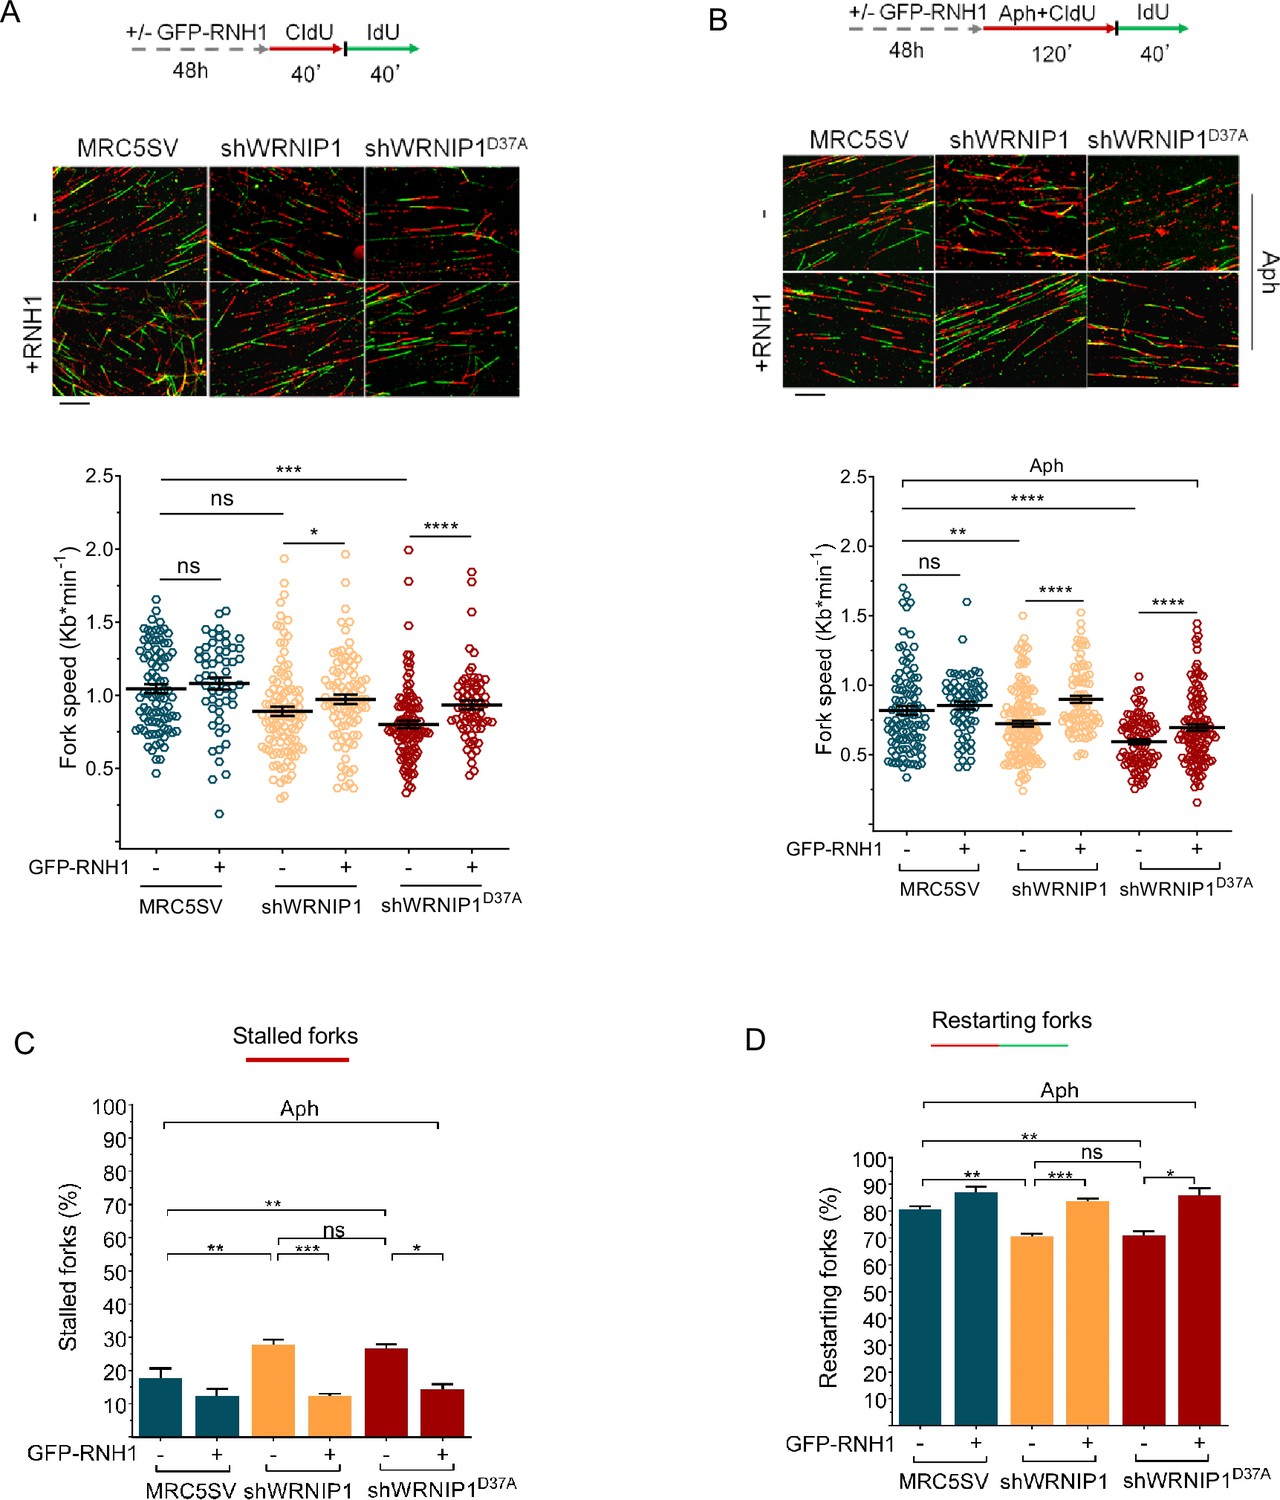
R-loops affects DNA replication in cells lacking WRNIP1 or its UBZ domain upon MRS.
Experimental scheme for dual labeling of DNA fibers in MRC5SV, shWRNIP1 and shWRNIP1D37A cells under unperturbed conditions (A) or upon MRS (B). After transfection with GFP-tagged RNaseH1 or empty vector (-), cells were pulse-labeled with CldU, treated or not with 0.4 µM Aph, then subjected to a pulse-labeling with IdU. Representative DNA fiber images are provided. Graphs display the analysis of replication fork velocity (fork speed) in the cells. The length of the green tracks was measured. Mean values are represented as horizontal black lines (ns, not significant; *, p<0.05; **, p<0.01; ***, p<0.001; ****, p<0.0001; Mann-Whitney test). Scale bar, 10 μm. (C and D) Graphs represent the percentage of red (CldU) tracts (stalled forks) or green (IdU) tracts (restarting forks) in the cells. Error bars represent standard error (ns, not significant; *, p<0.05; ** p<0.01; *** p<0.001; two-tailed Student t-test).
Figure 6—figure supplement 1

Transcription affects DNA replication in cells lacking WRNIP1 or its UBZ domain upon MRS.
Experimental scheme of dual labeling of DNA fibers in MRC5SV, shWRNIP1 and shWRNIP1D37A cells under unperturbed conditions (A) or upon MRS (B). After transcription inhibition by DRB, cells were pulse-labeled with CldU, treated or not with 0.4 µM Aph, and then subjected to a pulse-labeling with IdU. The graph displays the analysis of replication fork velocity (fork speed) in the cells. The length of the green tracks was measured. Mean values are represented as horizontal black lines (ns, not significant; **, p<0.01; ***, p<0.001; ****, p<0.0001; Mann-Whitney test). (C and D) The graph shows the percentage of red (CldU) tracts (stalled forks) or green (IdU) tracts (restarting forks) in the cells.
Figure 7 with 2 supplements
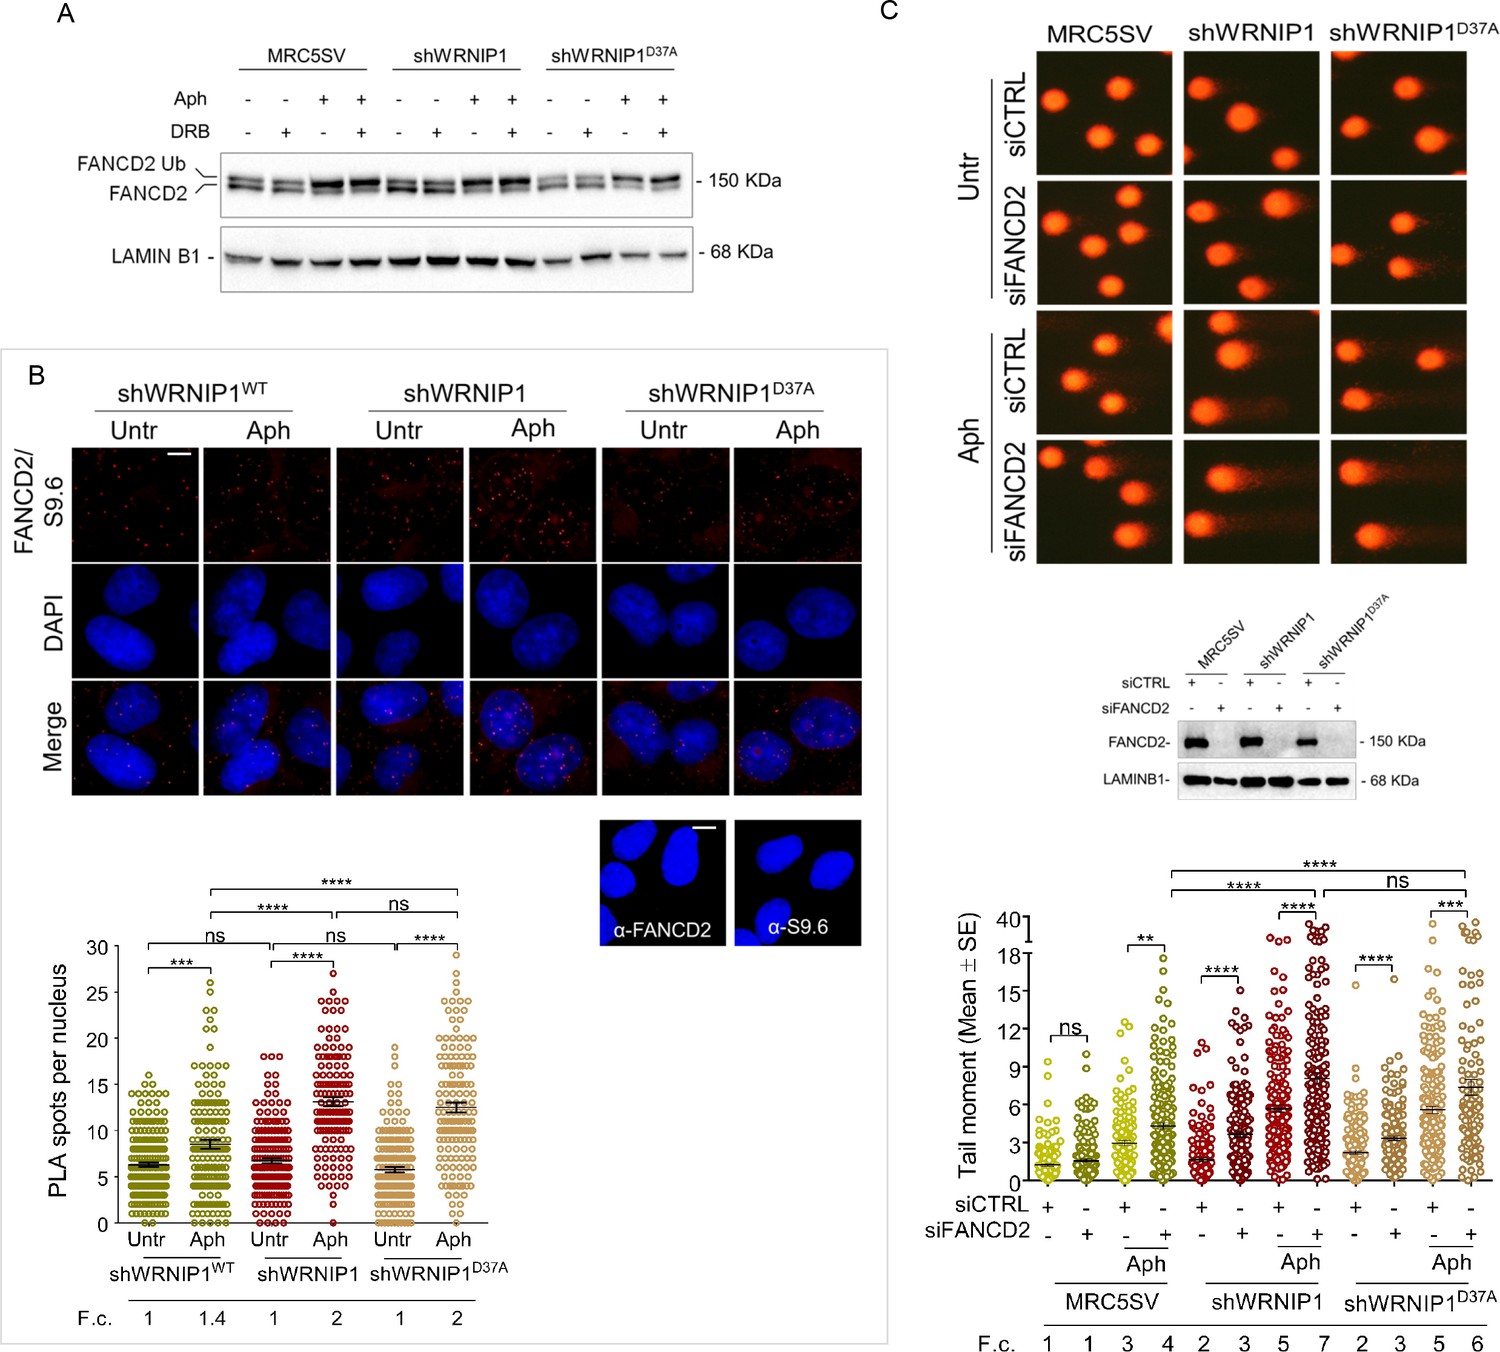
FANCD2 pathway activation in cells lacking WRNIP1 or its UBZ domain upon MRS.
(A) Western blot analysis showing FANCD2 ubiquitination in MRC5SV, shWRNIP1 and shWRNIP1D37A cells. The membrane was probed with an anti-FANCD2 antibody. LAMIN B1 was used as a loading control. (B) Detection of the physical interaction between FANCD2 and R-loops by PLA. shWRNIP1WT, shWRNIP1, and shWRNIP1D37A cells were treated or not with 0.4 µM Aph for 24 hr and subjected to RNase III digestion. Cells were stained with antibodies against RNA-DNA hybrid (anti-S9.6) and FANCD2. Representative images are provided. Each red spot represents a single interaction between R-loops and FANCD2. No spots were revealed in cells stained with each single antibody (negative control). Nuclei were counterstained with DAPI. Dot plot shows the number of PLA spots per nucleus. Data are presented as means from three independent experiments. Horizontal black lines represent the mean ±SE (ns, not significant; ***, p<0.001;****, p<0.0001; one-way ANOVA test). Scale bar, 2.5 μm. (C) Evaluation of DNA damage accumulation by alkaline Comet assay in MRC5SV, shWRNIP1 and shWRNIP1D37A transfected with control siRNAs (siCTRL) or siRNAs targeting FANCD2 (siFANCD2). After 48 hr, cells were treated or not with 0.4 µM Aph for 24 hr, then subjected to Comet assay. Dot plot shows data presented as means from three independent experiments. Horizontal black lines represent the mean (ns, not significant; ** p<0.01; *** p<0.001; **** p<0.0001; Mann-Whitney test). Representative images are provided. Western blot shows FANCD2 depletion in the cells. The membrane was probed with an anti-FANCD2, and LAMIN B1 was used as a loading control. Fold changes (F. c) were calculated as ratio of means between each experimental sample and the relative wild-type untreated.
-
Figure 7—source data 1
PDF containing original scans of the western blot (anti-FANCD2, anti-LAMINB1) and related original TIFF images.
- https://cdn.elifesciences.org/articles/89981/elife-89981-fig7-data1-v1.zip
-
Figure 7—source data 2
PDF containing original scans of the western blot (anti-FANCD2, anti-LAMINB1) and related original TIFF images.
- https://cdn.elifesciences.org/articles/89981/elife-89981-fig7-data2-v1.zip
Figure 7—figure supplement 1
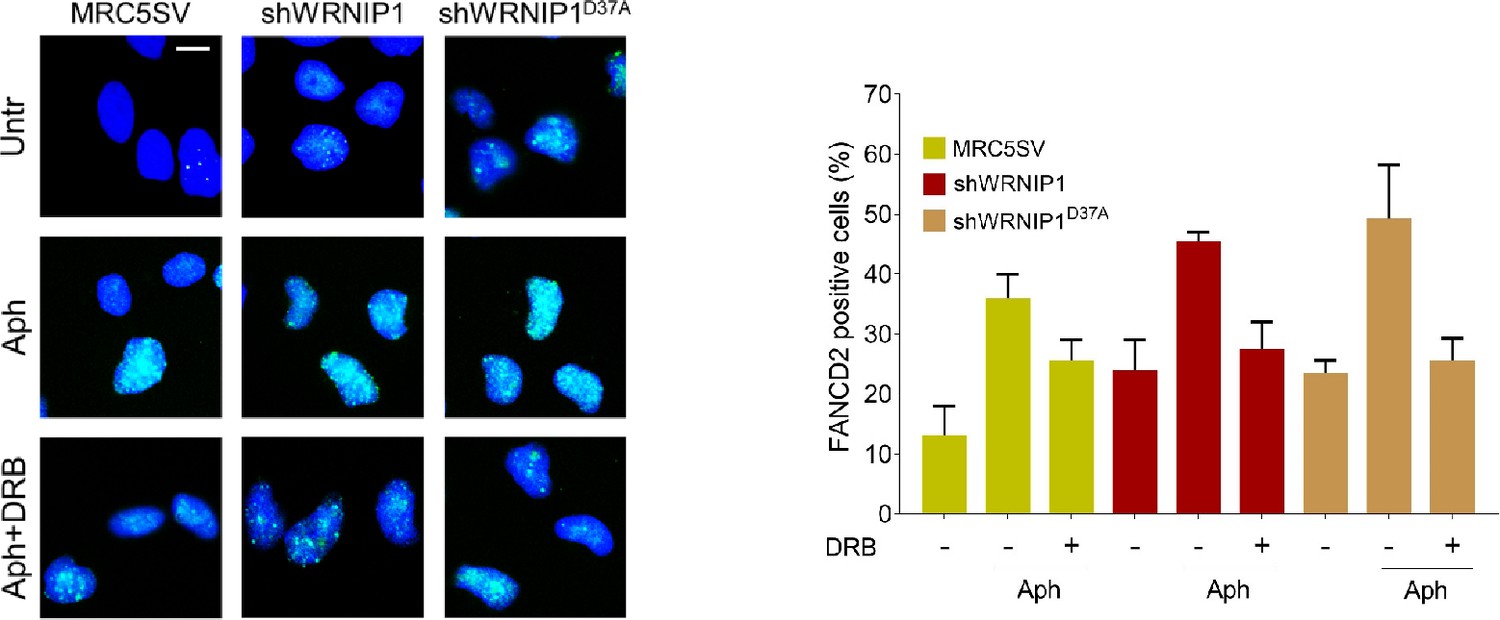
Loss of WRNIP1 or its UBZ domain results in FANCD2 pathway activation upon MRS.
Evaluation of FANCD2 activation by immunofluorescence analysis in MRC5SV, shWRNIP1 and shWRNIP1D37A cells treated or not with 0.4 µM Aph for 24 hr and 50 µM DRB for 3 hr. The graph displays data presented as the percentage of FANCD2-positive cells ± SE from three independent experiments. Representative images of nuclei showing the different number of foci per nucleus are provided. Scale bar, 2.5 μm.
Figure 7—figure supplement 2

Analysis of the dependency of FANCD2 activation on RAD18.
MRC5SV cells were depleted of RAD18, and 48 hr later, cells were fixed and immunostained for FANCD2. The graph shows data presented as the percentage of FANCD2-positive cells. Representative images of nuclei display the different number of foci per nucleus are provided. Western blot confirms RAD18 depletion in the cells. The membrane was probed with an anti-RAD18 and LAMIN B1 was used as a loading control.
-
Figure 7—figure supplement 2—source data 1
PDF containing original scans of the western blot (anti-RAD18, anti-LAMINB1) and related original TIFF images.
- https://cdn.elifesciences.org/articles/89981/elife-89981-fig7-figsupp2-data1-v1.zip
Figure 8
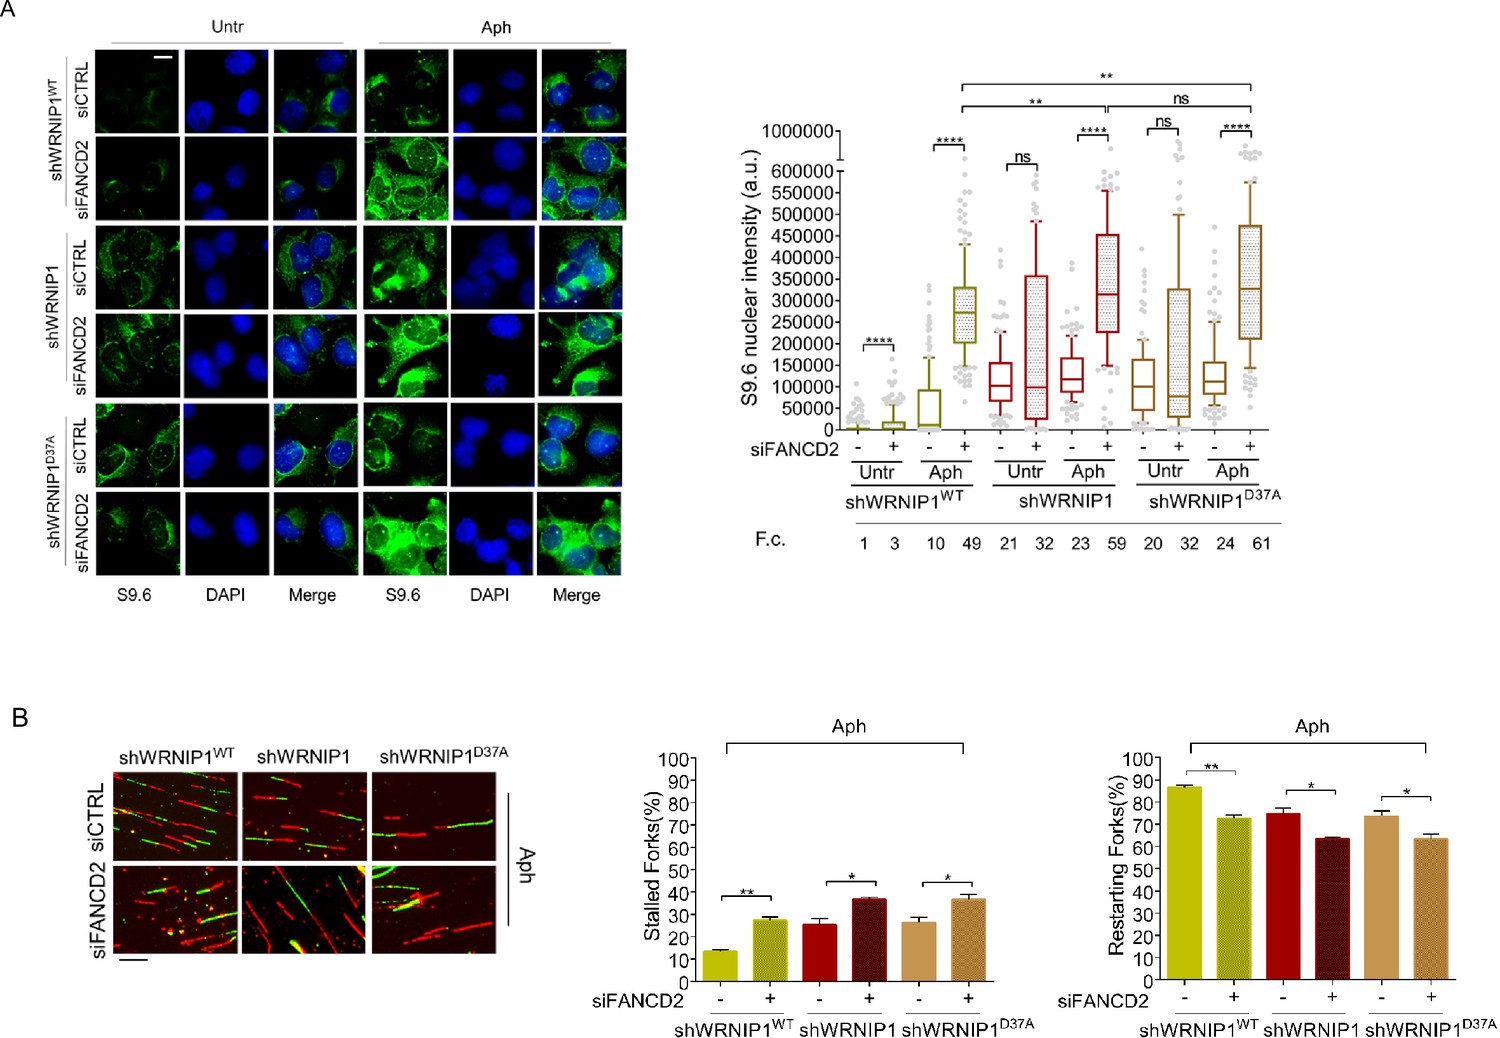
Evaluation of FANCD2 depletion on R-loop accumulation and replication dynamic.
(A) Immunofluorescence analysis to determine R-loop levels in shWRNIP1WT, shWRNIP1, and shWRNIP1D37A cells depleted or not of FANCD2 under untreated conditions or after MRS. Cells were fixed, subjected or not to RNase III digestion, and stained with anti-RNA-DNA hybrid S9.6 antibody. Representative images are provided. Nuclei were counterstained with DAPI. Dot plot shows nuclear S9.6 fluorescence intensity. Boxes and whiskers represent 20–75 and 10–90 percentiles, respectively. The line represents the median value. Data are presented as means from three independent experiments. Horizontal black lines represent the mean. Error bars represent SE (ns, not significant; **, p<0.01; ****, p<0.0001; two-tailed Student’s t test). Scale bar, 2.5 μm. (B) Experimental scheme of dual labeling of DNA fibers in shWRNIP1WT, shWRNIP1 and shWRNIP1D37A cells upon MRS. After transfection with control siRNAs (siCTRL) or targeting FANCD2 (siFANCD2), cells were pulse-labeled with CldU, treated or not with 0.4 µM Aph, then subjected to a pulse-labeling with IdU. Representative DNA fiber images are provided. Graphs represent the percentage of red (CldU) tracts (stalled forks) or green (IdU) tracts (restarting forks) in the cells. Error bars represent standard error (* p<0.05; ** p<0.01; two-tailed Student’s t test). Fold changes (F. c) were calculated as ratio of means between each experimental sample and the relative wild-type untreated. Scale bar, 10 μm.
Figure 9
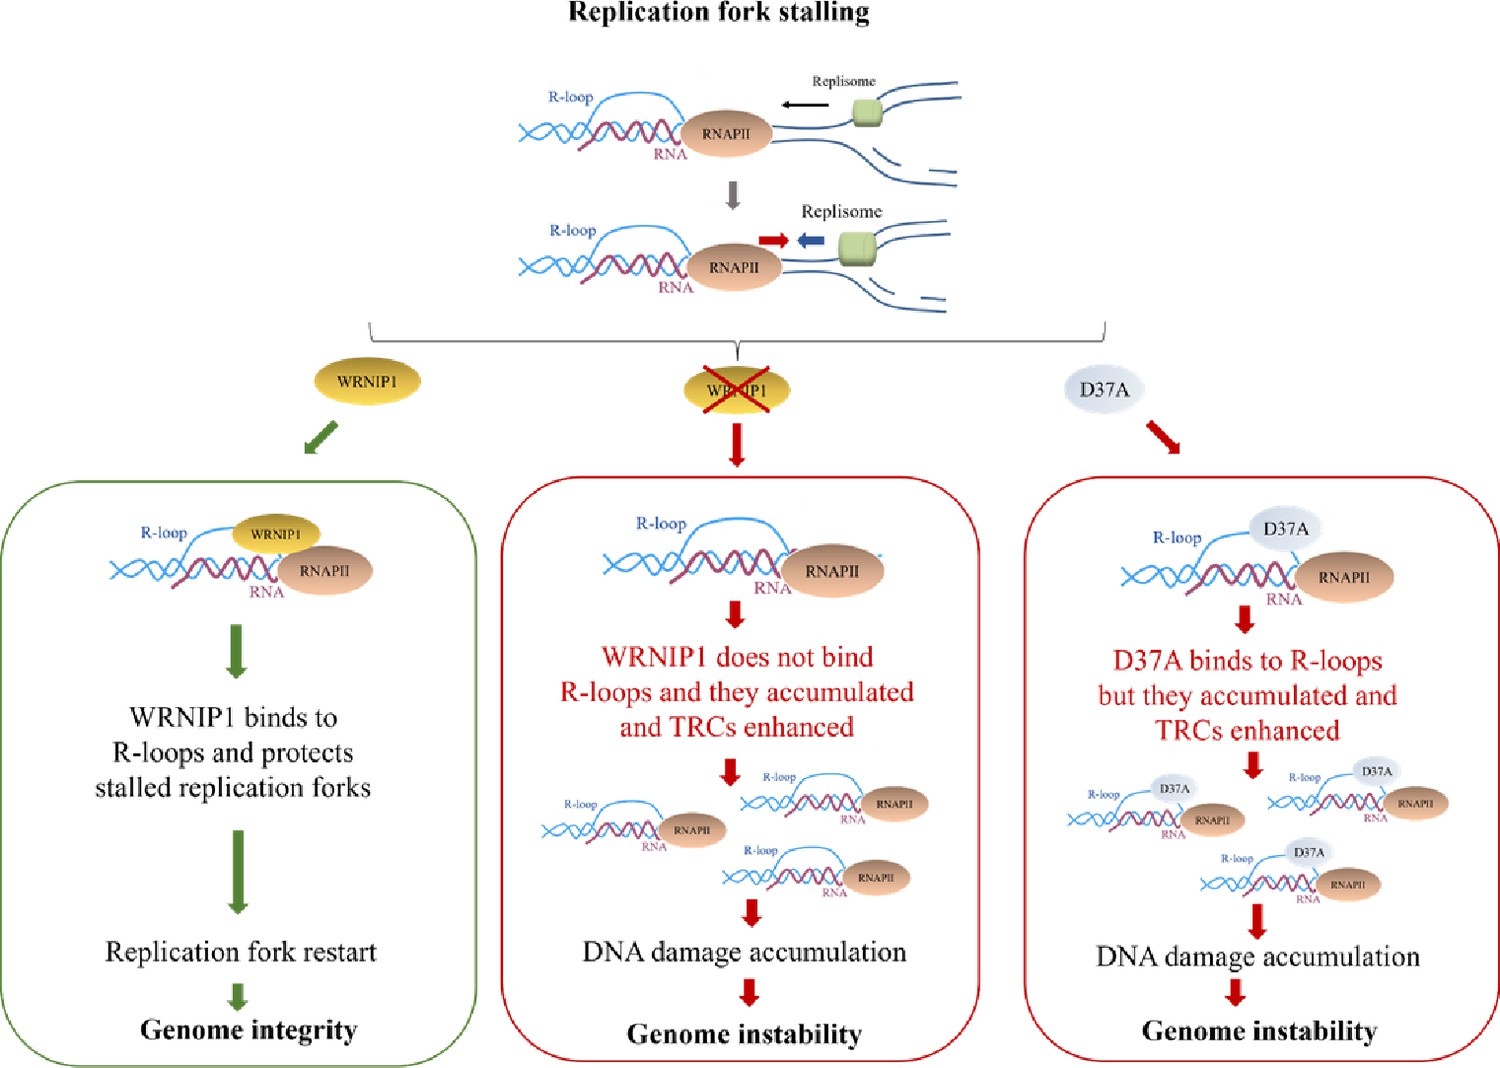
Working model for the potential role of WRNIP1 in R-loop accumulation.
Upon replication fork stalling, WRNIP1 binds to R-loops and protects stalled forks, promoting genomic integrity. In the absence of WRNIP1, R-loops accumulate, and TRCs are enhanced, leading to genome instability. In case of WRNIP1 UBZ mutation, the protein binds to R-loops but they accumulate, increasing TRCs and, thus, contributing to genomic instability.
Author response image 1
Author response image 2
Download links
A two-part list of links to download the article, or parts of the article, in various formats.
Downloads (link to download the article as PDF)
Open citations (links to open the citations from this article in various online reference manager services)
Cite this article (links to download the citations from this article in formats compatible with various reference manager tools)
WRNIP1 prevents transcription-associated genomic instability
eLife 12:RP89981.
https://doi.org/10.7554/eLife.89981.3


