Cholinergic input to mouse visual cortex signals a movement state and acutely enhances layer 5 responsiveness
- Friedrich Miescher Institute for Biomedical Research, Switzerland
- Faculty of Natural Sciences, University of Basel, Switzerland
Figures
Figure 1 with 1 supplement
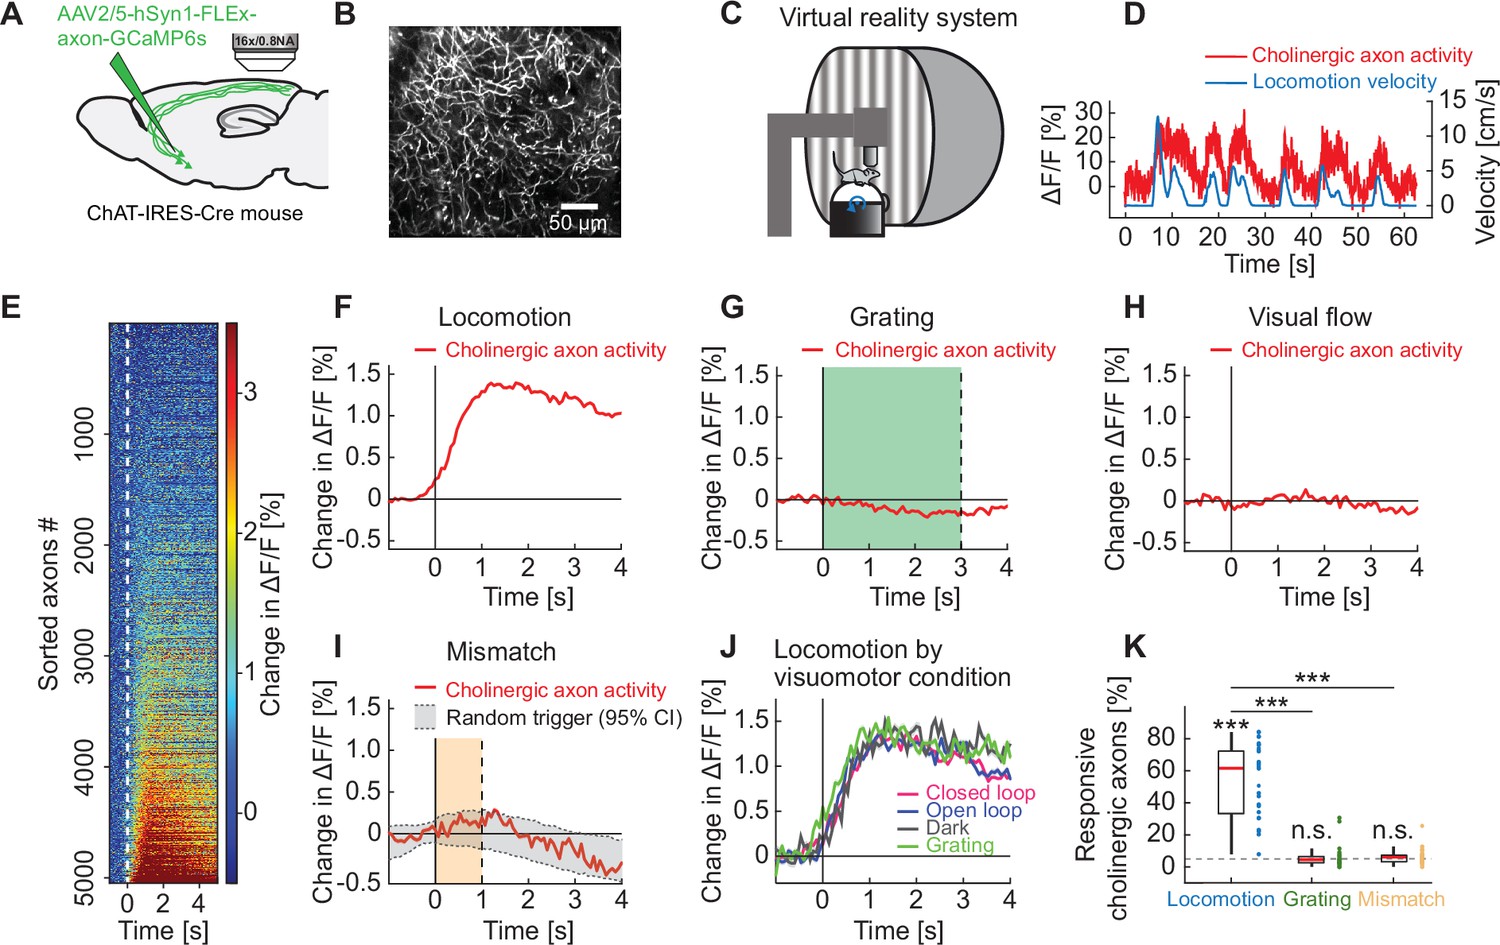
Cholinergic axons in visual cortex are activated during locomotion independent of visual stimuli.
(A) GCaMP6s was expressed by injecting an AAV2/5-hSyn1-FLEx-axon-GCaMP6s vector in basal forebrain of ChAT-IRES-Cre mice. We then imaged calcium activity of cholinergic axons projecting to visual cortex. (B) Example two-photon image of cholinergic axons in visual cortex. (C) Schematic of the virtual reality system. Mice were head-fixed on a spherical treadmill and surrounded by a toroidal screen on which we presented visual stimuli in different visuomotor conditions. (D) Example trace of the calcium activity of one cholinergic axon in visual cortex (red) and the corresponding locomotion velocity of the mouse (blue). (E) Average locomotion onset activity of all cholinergic axons (5048 axons in 14 mice), sorted by their average response during locomotion onset. (F) Average response of cholinergic axons to locomotion onset over all the cholinergic axons, of the data shown in E. Shading indicates SEM over axons. Due to SEM being very small, the shading is fully obscured by the red line. (G) As in F, but for grating onsets. Green shading marks the duration of grating presentation. (H) As in F, but for visual flow onset during the open loop condition. (I) As in F, but for visuomotor mismatch onset. Orange shading marks the duration of visuomotor mismatch. As mismatch events occur only during times of locomotion, and locomotion itself is a strong driver of cholinergic activity, we would expect to find an increase in cholinergic activity by chance at mismatch. To correct for this, we quantified the distribution of cholinergic activity on random triggers during locomotion (95% confidence interval (CI), gray shading). (J) Locomotion onset activity in different visuomotor conditions. (K) The fraction of cholinergic axons responsive to locomotion, grating, and visuomotor mismatch onset, quantified for each imaging site. Each datapoint is one imaging site. Boxes show 25th and 75th percentile, central mark is the median, and the whiskers extend to the most extreme data points not considered outliers. Dashed line marks chance level. n.s.: not significant; *p<0.05; **p<0.01; ***p<0.001; see Supplementary file 1 for all statistical information.
Figure 1—figure supplement 1
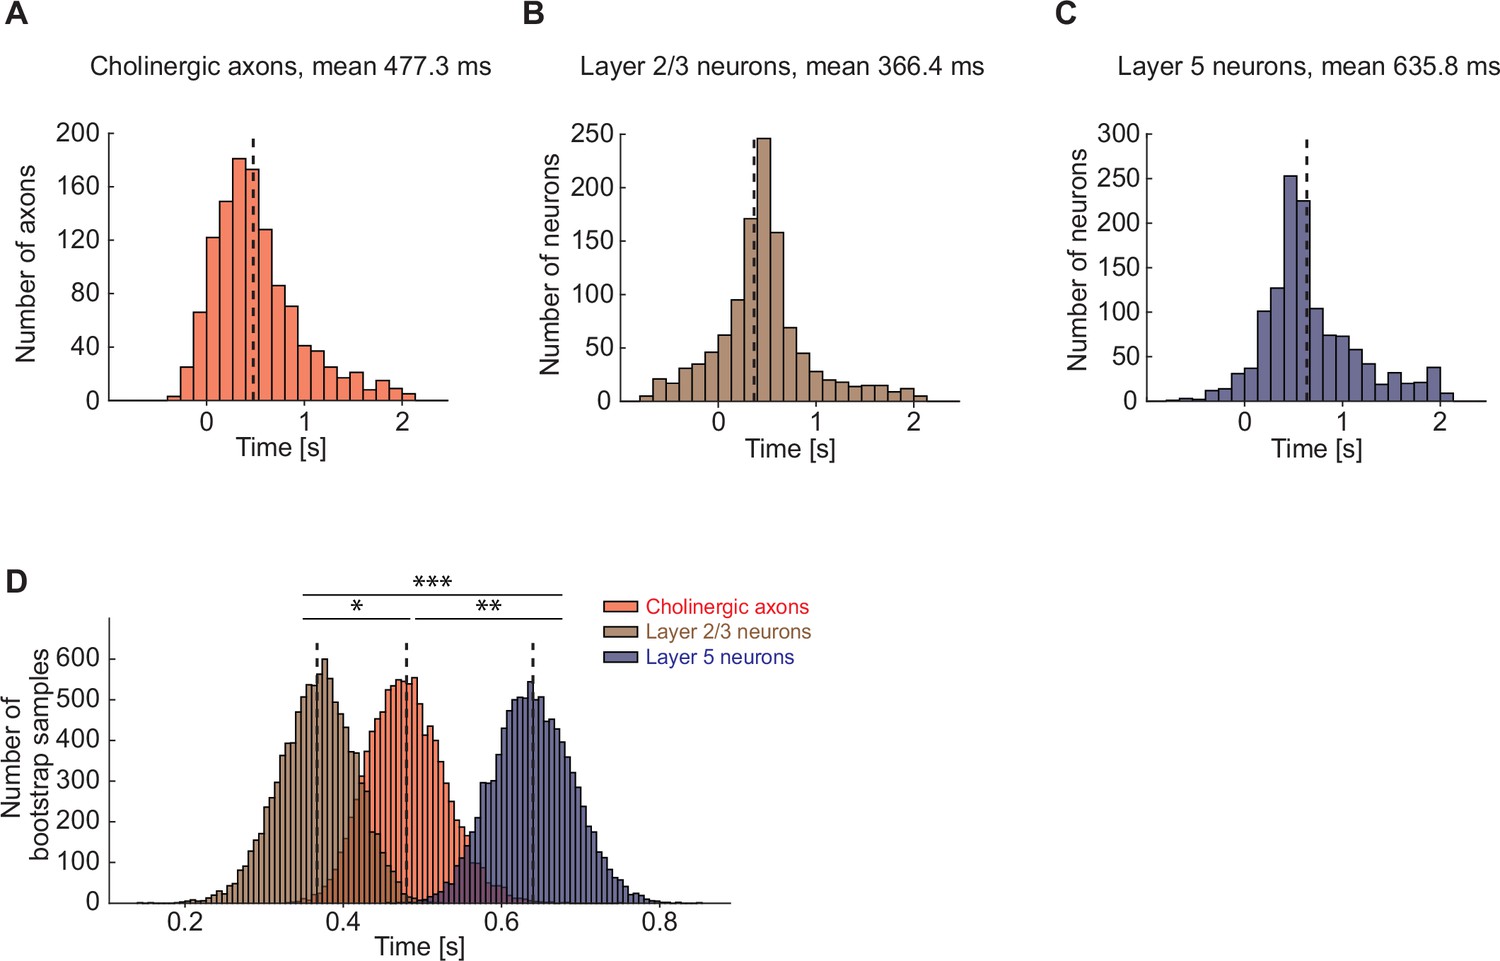
Cholinergic axons in visual cortex were activated after layer 2/3 but before layer 5 visual cortex neurons.
(A) Distribution of time to first significant response after locomotion onset for cholinergic axons in visual cortex. Axons without any response to locomotion onset are omitted. (B) As in A, but for layer 2/3 neurons in visual cortex. (C) As in A, but for layer 5 neurons in visual cortex. (D) Nested bootstrap resampling of the distributions shown in A–C. Here and elsewhere, n.s.: not significant; *p<0.05; **p<0.01; ***p<0.001; see Supplementary file 1 for all statistical information.
Figure 2 with 2 supplements
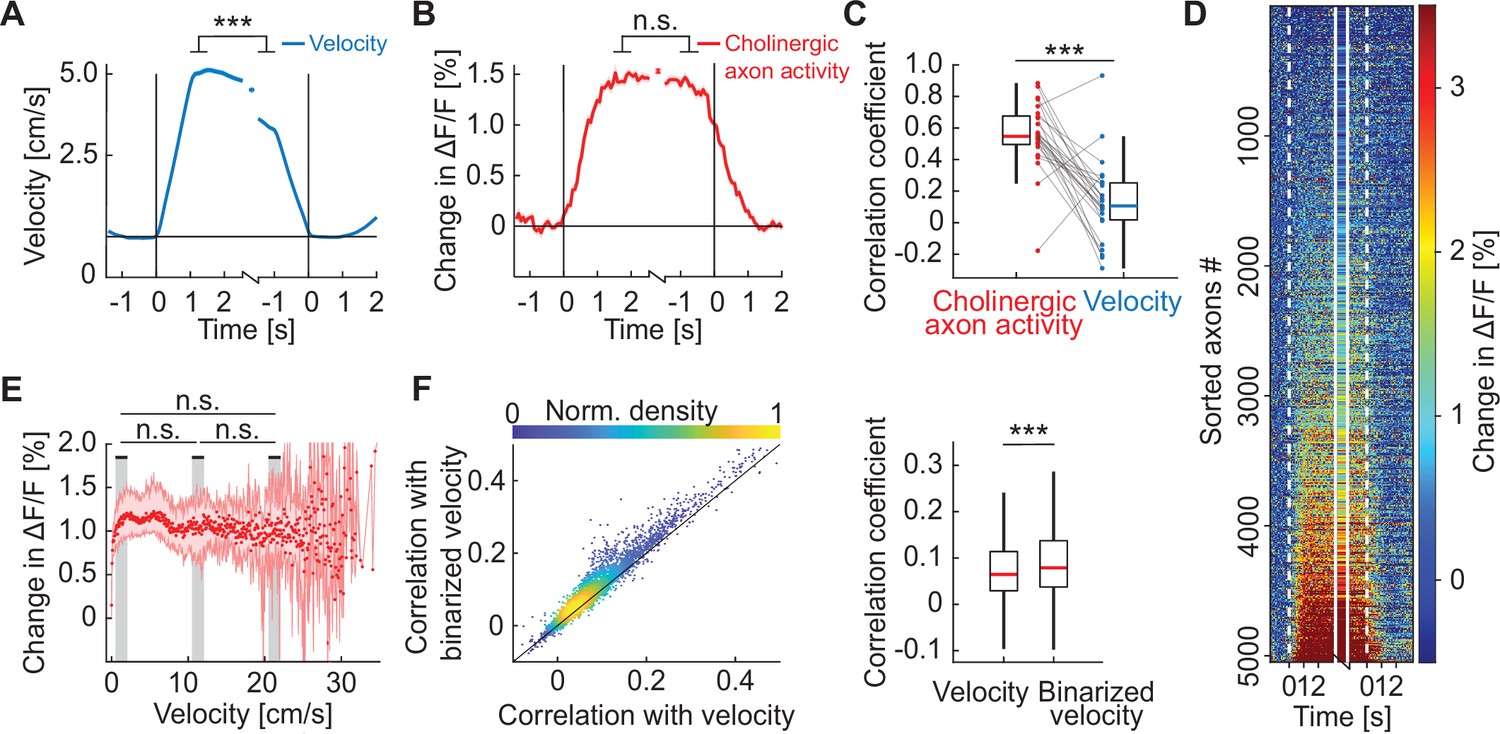
Activity in cholinergic axons was better explained by a binary locomotion state signal than by locomotion velocity.
(A) Average locomotion velocity profiles aligned to locomotion onset and offset. The isolated datapoint between the two traces is the average locomotion velocity over the locomotion bout. Shading marks SEM. Here and elsewhere, n.s.: not significant; *p<0.05; **p<0.01; ***p<0.001; see Supplementary file 1 for all statistical information. (B) As in A, but for activity of all cholinergic axons in visual cortex, for the data shown in D. Shading marks SEM over axons. (C) Bout-by-bout correlation coefficient between the locomotion onset and offset changes for average cholinergic activity and locomotion velocity. Each datapoint is one imaging site. Boxes show 25th and 75th percentile, central mark is the median, and the whiskers extend to the most extreme data points not considered outliers. (D) Average onset and offset responses for all cholinergic axons sorted by strength of locomotion onset response. (E) Activity of cholinergic axons as a function of locomotion velocity. Shown are the hierarchical bootstrap estimates of the median (red dots) and 95% confidence intervals (red shading) for each velocity bin. We found no evidence of a difference in activation between low, intermediate, and high locomotion velocities (indicated by gray shading). (F) Left: For all axons, the correlation coefficient of their calcium activity with locomotion velocity plotted against the correlation coefficient with a binarized version of the locomotion velocity. Right: Distributions of correlation coefficients between calcium activity and locomotion velocity and binarized velocity. Same data as shown on the left. Boxes show 25th and 75th percentile, central mark is the median, and the whiskers extend to the most extreme data points not considered outliers.
Figure 2—figure supplement 1
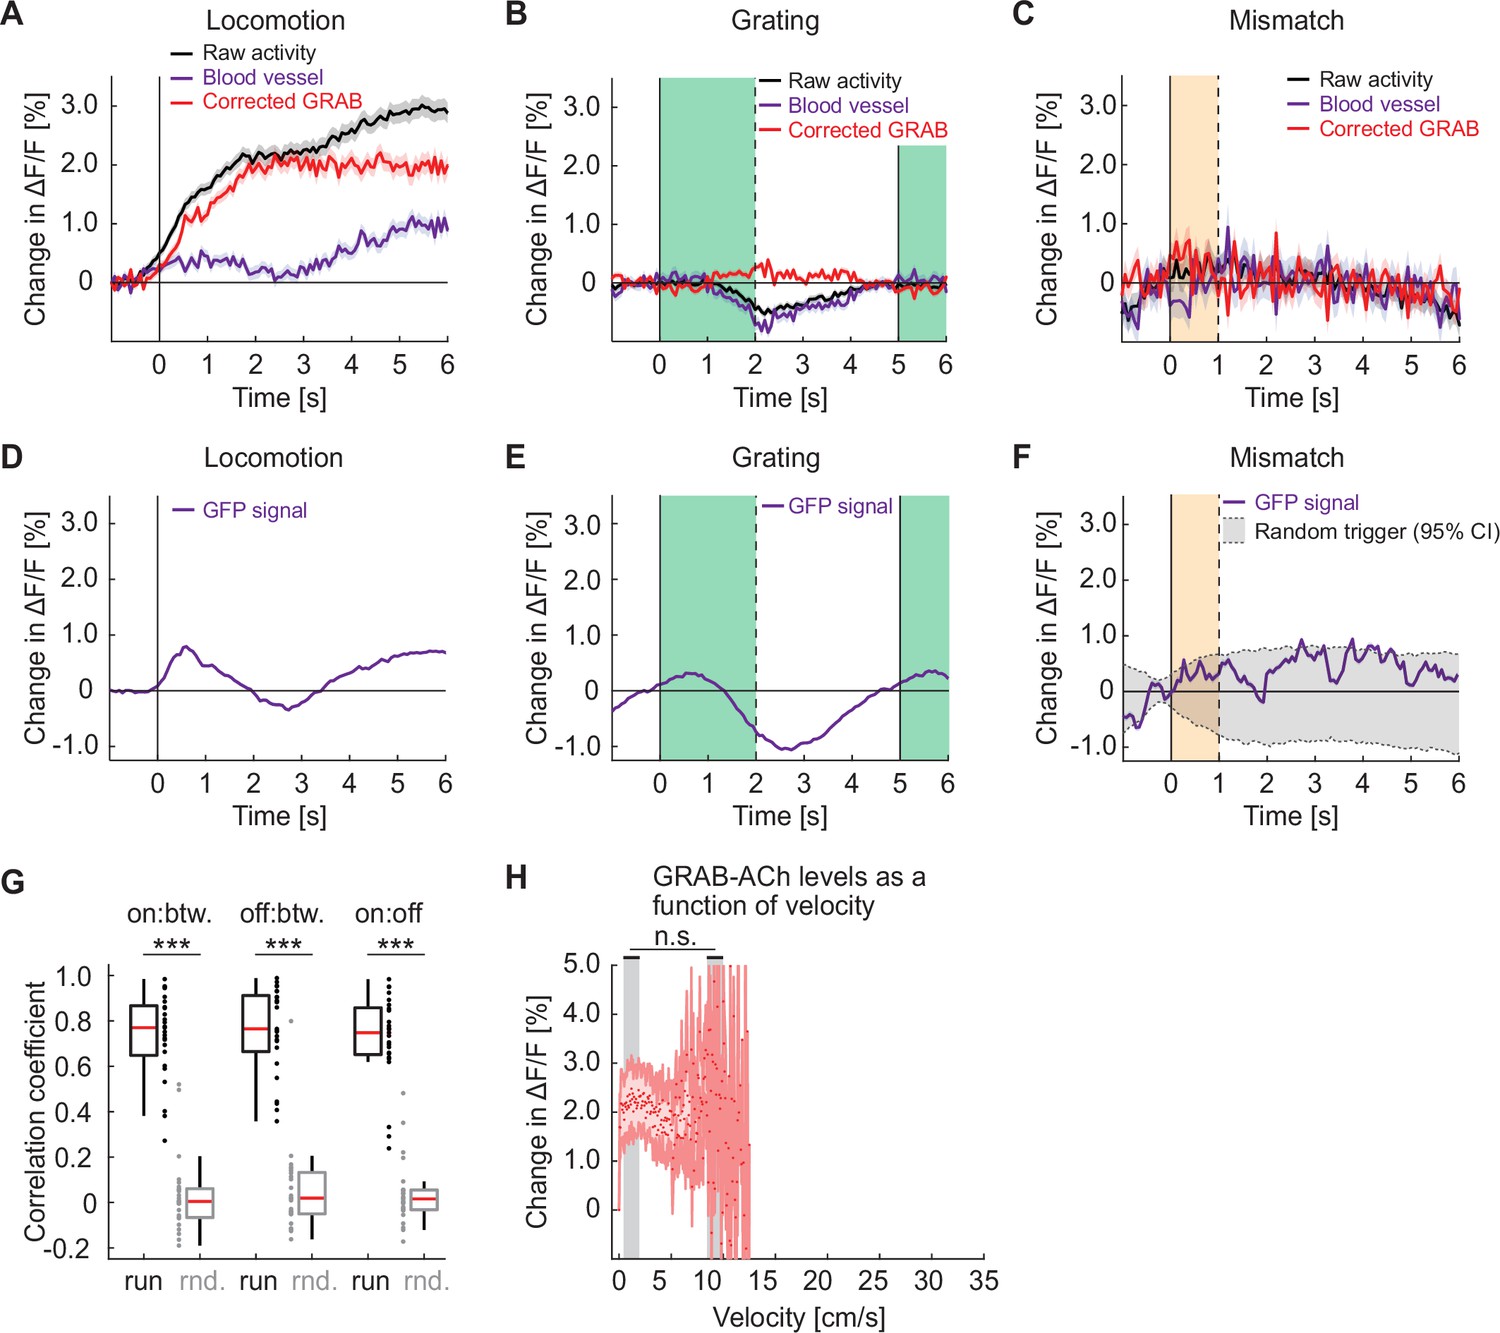
Responses of GRAB-ACh3.0 in visual cortex are similar to the calcium responses in cholinergic axons.
(A) Average change in GRAB-ACh3.0 fluorescence during locomotion onset. We used the fluorescence change measured in blood vessels (purple) to estimate hemodynamic occlusion and subtracted this from the raw activity (black) to generate a corrected response (red). Shading marks SEM. (B) As in A, but for the GRAB-ACh3.0 response to grating onsets. The green shading marks the duration of the grating stimulus. (C) As in A, but for the GRAB-ACh3.0 response to visuomotor mismatch. The orange shading marks the duration of the visuomotor mismatch. (D) To estimate hemodynamic occlusion effects while two-photon imaging, we measured fluorescence changes on locomotion onset in layer 2/3 neurons in visual cortex that express GFP. (E) As in D, but for responses to grating onsets. (F) As in D, but for responses to visuomotor mismatch. (G) The correlation coefficient between the population activity vectors during locomotion onset (on), offset (off), and during locomotion bout (btw), compared to shuffle (rnd.) controls. Here and elsewhere, n.s.: not significant; *p<0.05; **p<0.01; ***p<0.001; see Supplementary file 1 for all statistical information. (H) GRAB-ACh3.0 fluorescence as a function of locomotion velocity. Shown are the mean acetylcholine level in each bin, corrected for hemodynamics. Shading marks SEM. We found no evidence of a difference in acetylcholine level between low and high locomotion velocities (indicated by gray shading). Note, the x-axis range is matched to that in Figure 2E. Because we had overall less data in these GRAB experiments, reliable estimates of mean acetylcholine levels were not possible for locomotion velocities above approximately 13 cm/s.
Figure 2—figure supplement 2

Cholinergic axon activity correlated better with a binarized locomotion vector than with the unfiltered locomotion vector over a large range of binarization thresholds.
The correlation between activity of cholinergic axons in visual cortex and locomotion velocity was higher when we used a binarized version of the locomotion velocity trace. This difference was present over a large range of thresholds. The black bar at the top of the plot indicates threshold values for which the correlation with binarized locomotion velocity was higher than that with raw locomotion velocity.
Figure 3 with 1 supplement
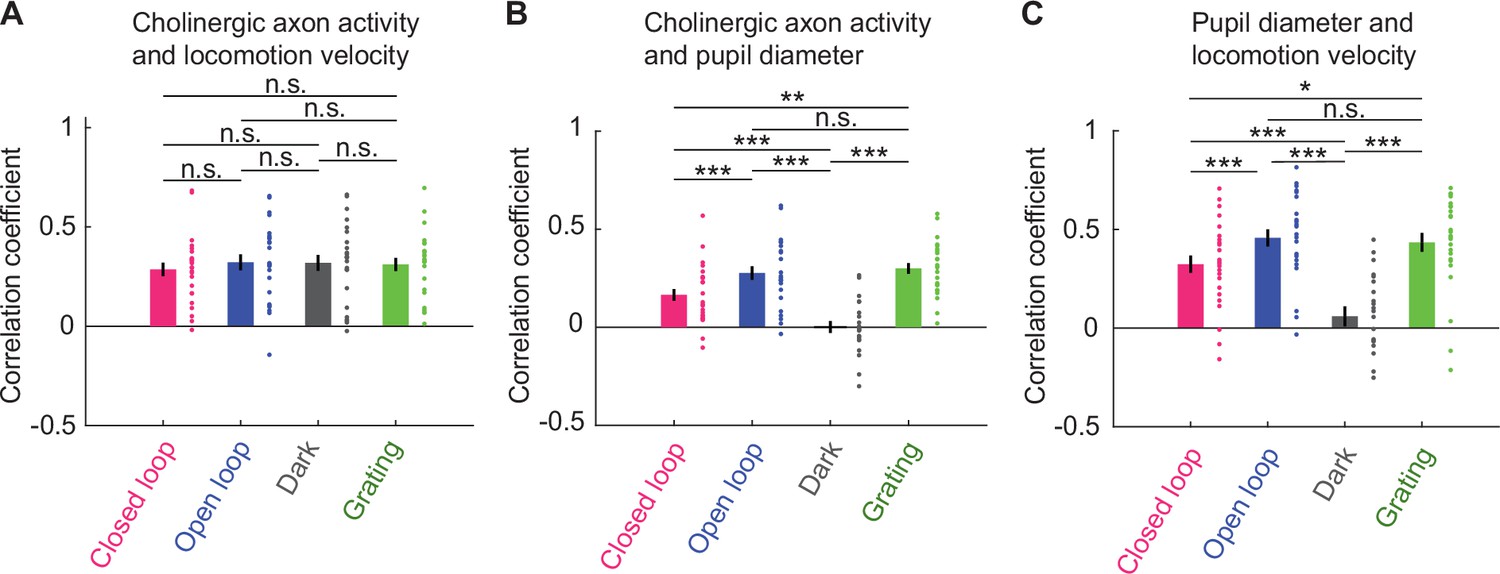
Average activity of cholinergic axons was more strongly correlated with locomotion velocity than with pupil diameter.
(A) Correlation of average activity of cholinergic axons activity with locomotion velocity in closed loop, open loop, dark, and grating conditions. Each point represents data from one imaging site, error bars indicate SEM. Here and elsewhere, n.s.: not significant; *p<0.05; **p<0.01; ***p<0.001; see Supplementary file 1 for all statistical information. (B) As in A, but for correlation between average activity of cholinergic axons and pupil diameter. (C) As in A, but for correlation between locomotion velocity and pupil diameter.
Figure 3—figure supplement 1
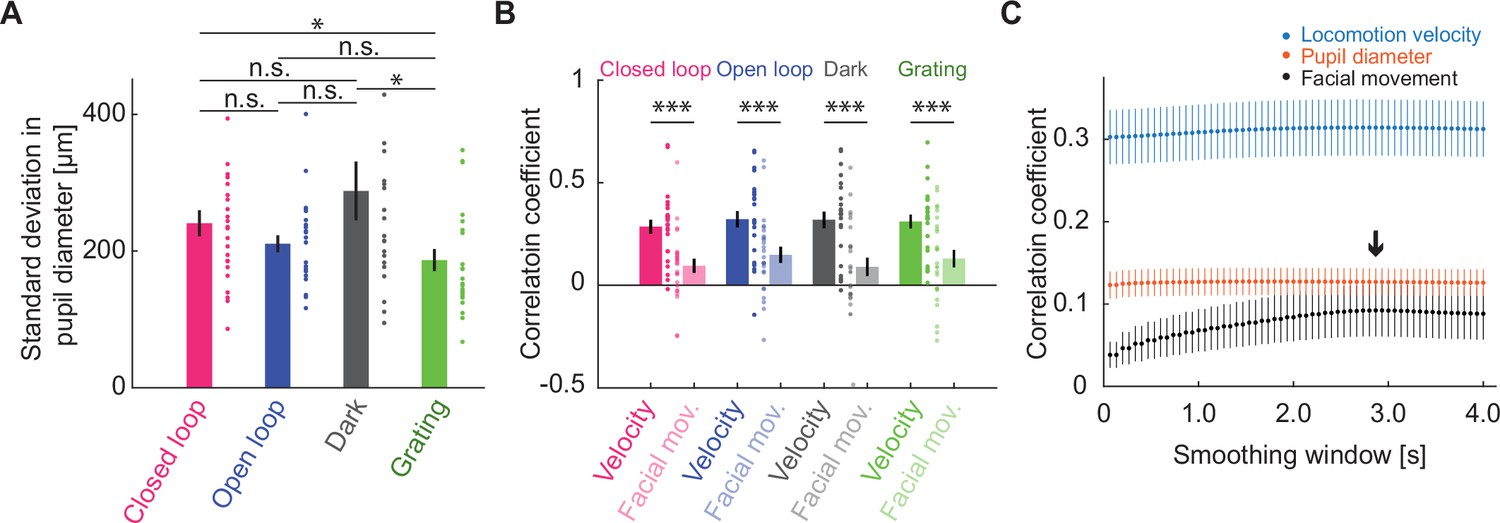
Activity of cholinergic axons correlated better with locomotion velocity than with facial movement.
(A) Standard deviation of pupil diameter as a function of visuomotor condition. Here and elsewhere, n.s.: not significant; *p<0.05; **p<0.01; ***p<0.001; see Supplementary file 1 for all statistical information. (B) Average correlation of activity of cholinergic axons in visual cortex with facial movements as a function of visuomotor condition, compared with the same activity correlation to locomotion velocity (same data as Figure 3A). Error bars indicate SEM. Individual data points are imaging sites. (C) Average correlation of activity of cholinergic axons in visual cortex and locomotion velocity (blue), pupil diameter (red), or facial movement (black) as a function of smoothing window. The black arrow marks the smoothing window used for facial movements.
Figure 4 with 5 supplements
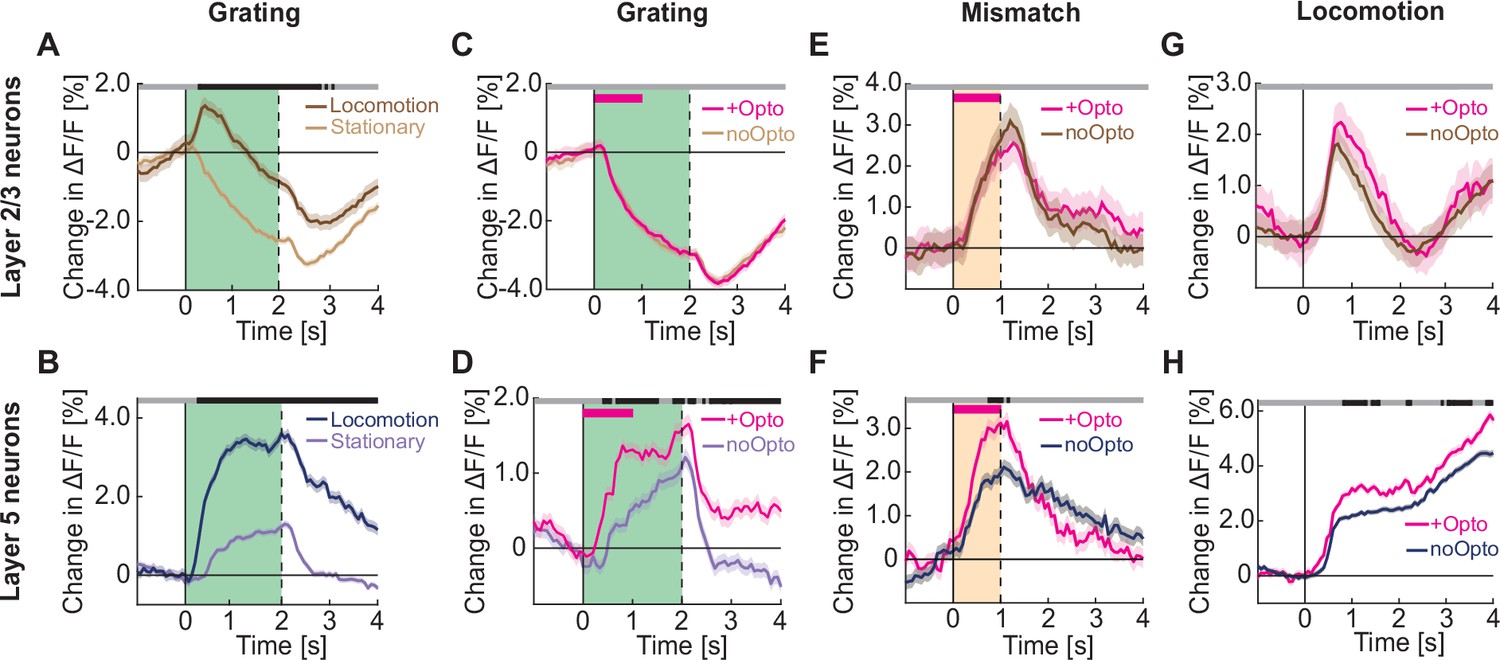
Optogenetic activation of cholinergic axons in visual cortex primarily enhances responses of layer 5, but not layer 2/3 neurons.
(A) Average calcium response of layer 2/3 neurons in visual cortex to full field drifting gratings in the absence (light brown) or presence of locomotion (brown). Green shading indicates duration of grating stimulus. The responses are compared bin-by-bin using a nested hierarchical bootstrap test. Here and in subsequent panels, bins with a significant difference (p<0.05) are indicated by a black line above the plot; those with p>0.05 are marked gray. Shading marks SEM. (B) As in A, but for layer 5 neurons in visual cortex in the absence (light blue) or presence (dark blue) of locomotion. (C) Average calcium response of layer 2/3 neurons in visual cortex to full field drifting gratings while the mice were stationary, without (light brown) or with (pink) optogenetic activation of cholinergic axons in visual cortex. Duration of optogenetic stimulation is marked by a pink bar. Green shading indicates duration of the grating stimulus. (D) As in C, but for layer 5 neurons in visual cortex. (E) Average calcium response to visuomotor mismatch in layer 2/3 neurons in visual cortex, without (brown) and with (pink) optogenetic stimulation of cholinergic axons in visual cortex. Orange shading indicates mismatch duration, and pink bar indicates optogenetic stimulation. (F) As in E, but for layer 5 neurons in visual cortex. (G) Average calcium response of layer 2/3 neurons in visual cortex to locomotion onset in closed loop, without (brown) or with (pink) optogenetic stimulation of cholinergic axons in visual cortex. (H) As in G, but for layer 5 neurons in visual cortex.
Figure 4—figure supplement 1

Optogenetic stimulation of basal forebrain cholinergic axons in visual cortex did not change the locomotion velocity of the mice.
(A) Locomotion velocity before, during, and after optogenetic stimulation of cholinergic axons. Shown are the mean (red line) and SEM (red shading) across imaging sites. Here and elsewhere, n.s.: not significant; *p<0.05; **p<0.01; ***p<0.001; see Supplementary file 1 for all statistical information. (B) Average locomotion velocity before optogenetic stimulation (–2 s to 0 s) is indistinguishable from the locomotion velocity during and immediately after stimulation (0 s to 2 s; stimulation occurs from 0 s to 1 s). Each dot is an imaging site. Boxes show 25th and 75th percentile, red line is the median, and the whiskers extend to the most extreme data points not considered outliers.
Figure 4—figure supplement 2
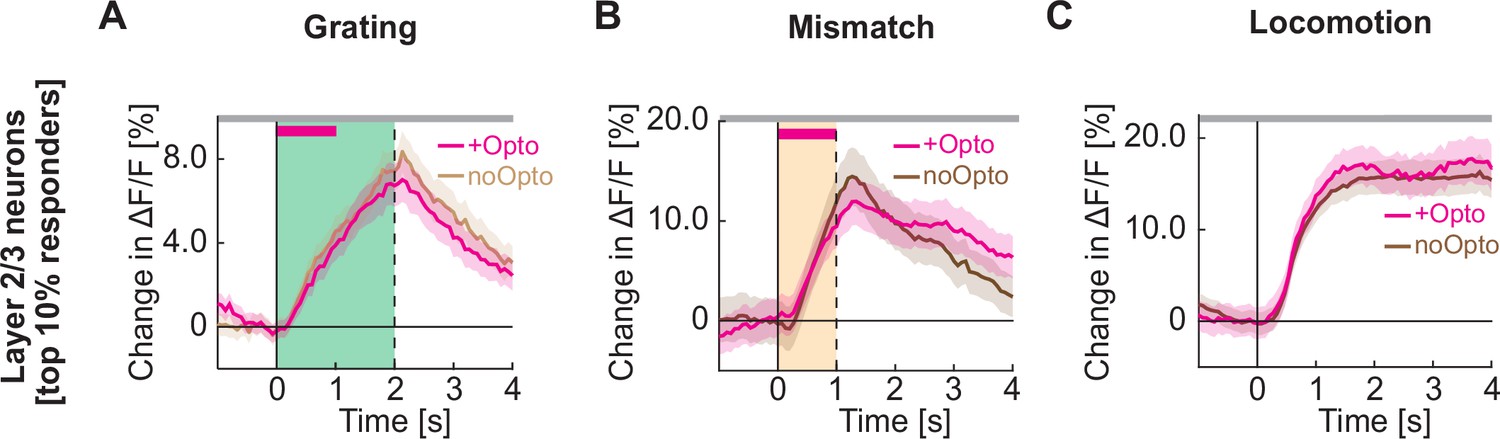
Optogenetic activation of cholinergic axons in visual cortex does not increase the responsiveness of the layer 2/3 neurons most responsive to gratings, visuomotor mismatch, or locomotion onset.
(A) Average calcium response to full field drifting gratings of the 10% of layer 2/3 neurons in visual cortex most responsive to full field drifting gratings while the mice were stationary, without (light brown) or with (pink) optogenetic activation of cholinergic axons in visual cortex. To avoid regression to the mean artifacts, neurons are selected based on half of the trials, and the responses of the other half of trials are shown here. Duration of the optogenetic stimulation is marked by a pink bar. Green shading indicates duration of the grating stimulus. The responses are compared bin-by-bin using a nested hierarchical bootstrap test. Here and in subsequent panels, bins with a significant difference (p<0.05) are indicated by a black line above the plot; those with p>0.05 are marked gray. Shading marks SEM. (B) As in A, but for the 10% of layer 2/3 neurons most responsive to visuomotor mismatch. (C) As in A, but for the 10% of layer 2/3 neurons most responsive to locomotion onset in closed loop.
Figure 4—figure supplement 3
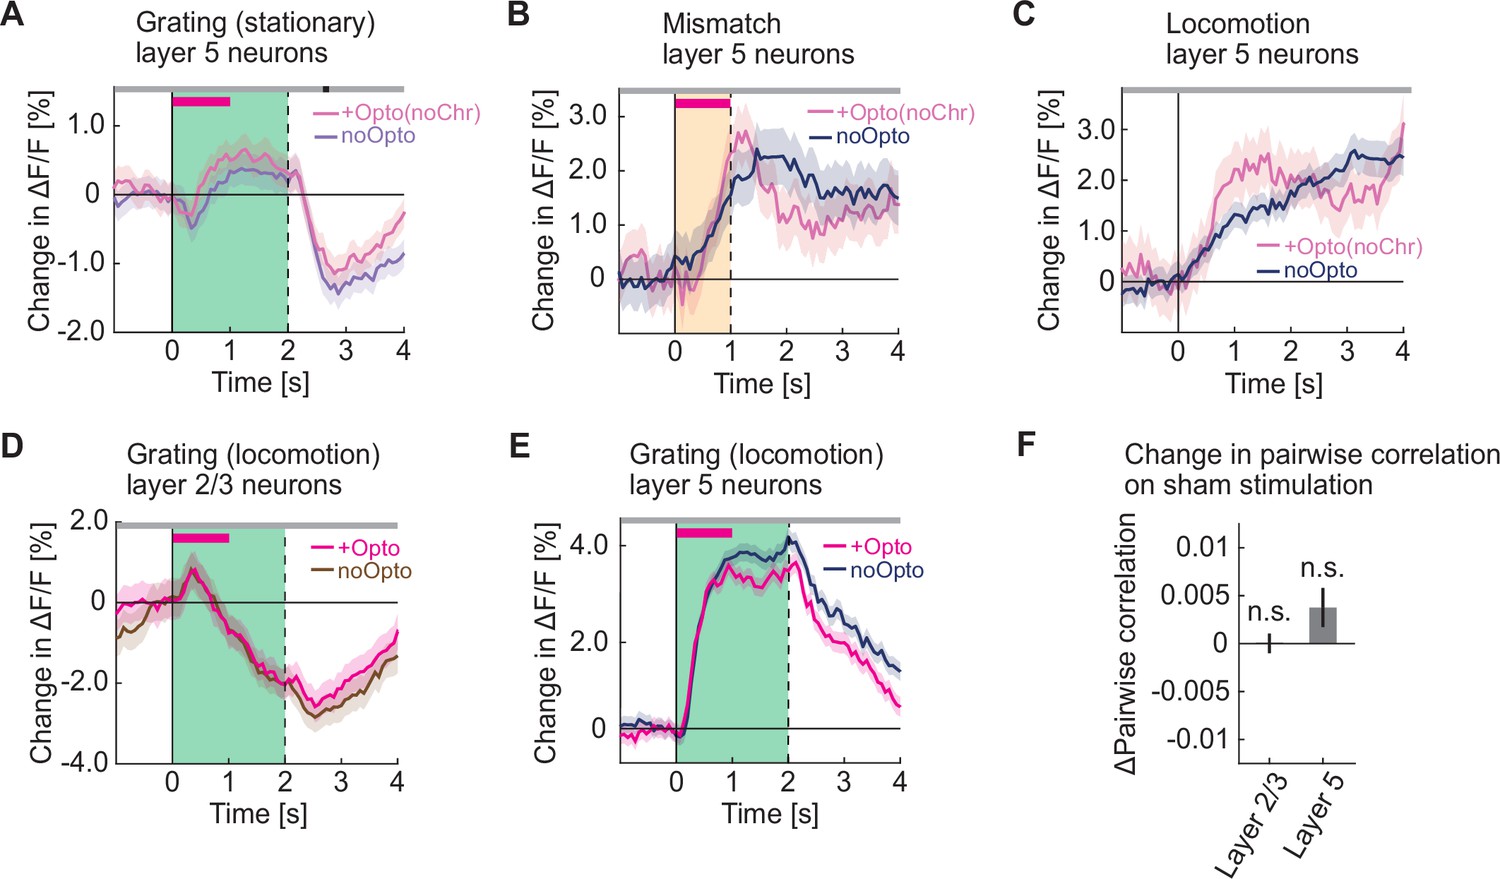
Optogenetic activation did not increase grating responses during locomotion and had no effect in opsin-negative control mice.
(A) Average calcium response of layer 5 neurons in visual cortex to full field drifting gratings (green shading) presented while the mice were stationary, without (pale blue) and with (pale pink) optogenetic stimulation in mice that did not express ChrimsonR in cholinergic axons. The duration of stimulation is marked by a pink bar. (B) Average calcium response of layer 5 neurons in visual cortex to visuomotor mismatch (orange shading) without (blue) and with (pale pink) optogenetic light stimulation in mice that do not express ChrimsonR in cholinergic axons. The duration of stimulation light is marked by a pink bar. (C) As in B, but for locomotion onset responses. Note, the locomotion onset threshold was relaxed to 0.025 cm/s to increase the number of onsets we could analyze. (D) Average calcium response of layer 2/3 neurons in visual cortex to full field drifting gratings (green shading) presented while the mice were locomoting, without (brown) and with (pink) optogenetic stimulation of cholinergic axons in visual cortex. The duration of optogenetic stimulation is marked by a pink bar. The responses are compared bin-by-bin using a nested hierarchical bootstrap test. Here and in subsequent panels, bins with a significant difference (p<0.05) are indicated by a black line above the plot; those with p>0.05 are marked gray. Shading marks SEM. (E) As in D, but for layer 5 neurons. (F) Change in pairwise correlations in layer 2/3 neurons and in layer 5 neurons in visual cortex during sham stimulation while the mice were stationary. Here and elsewhere, n.s.: not significant; *p<0.05; **p<0.01; ***p<0.001; see Supplementary file 1 for all statistical information.
Figure 4—figure supplement 4
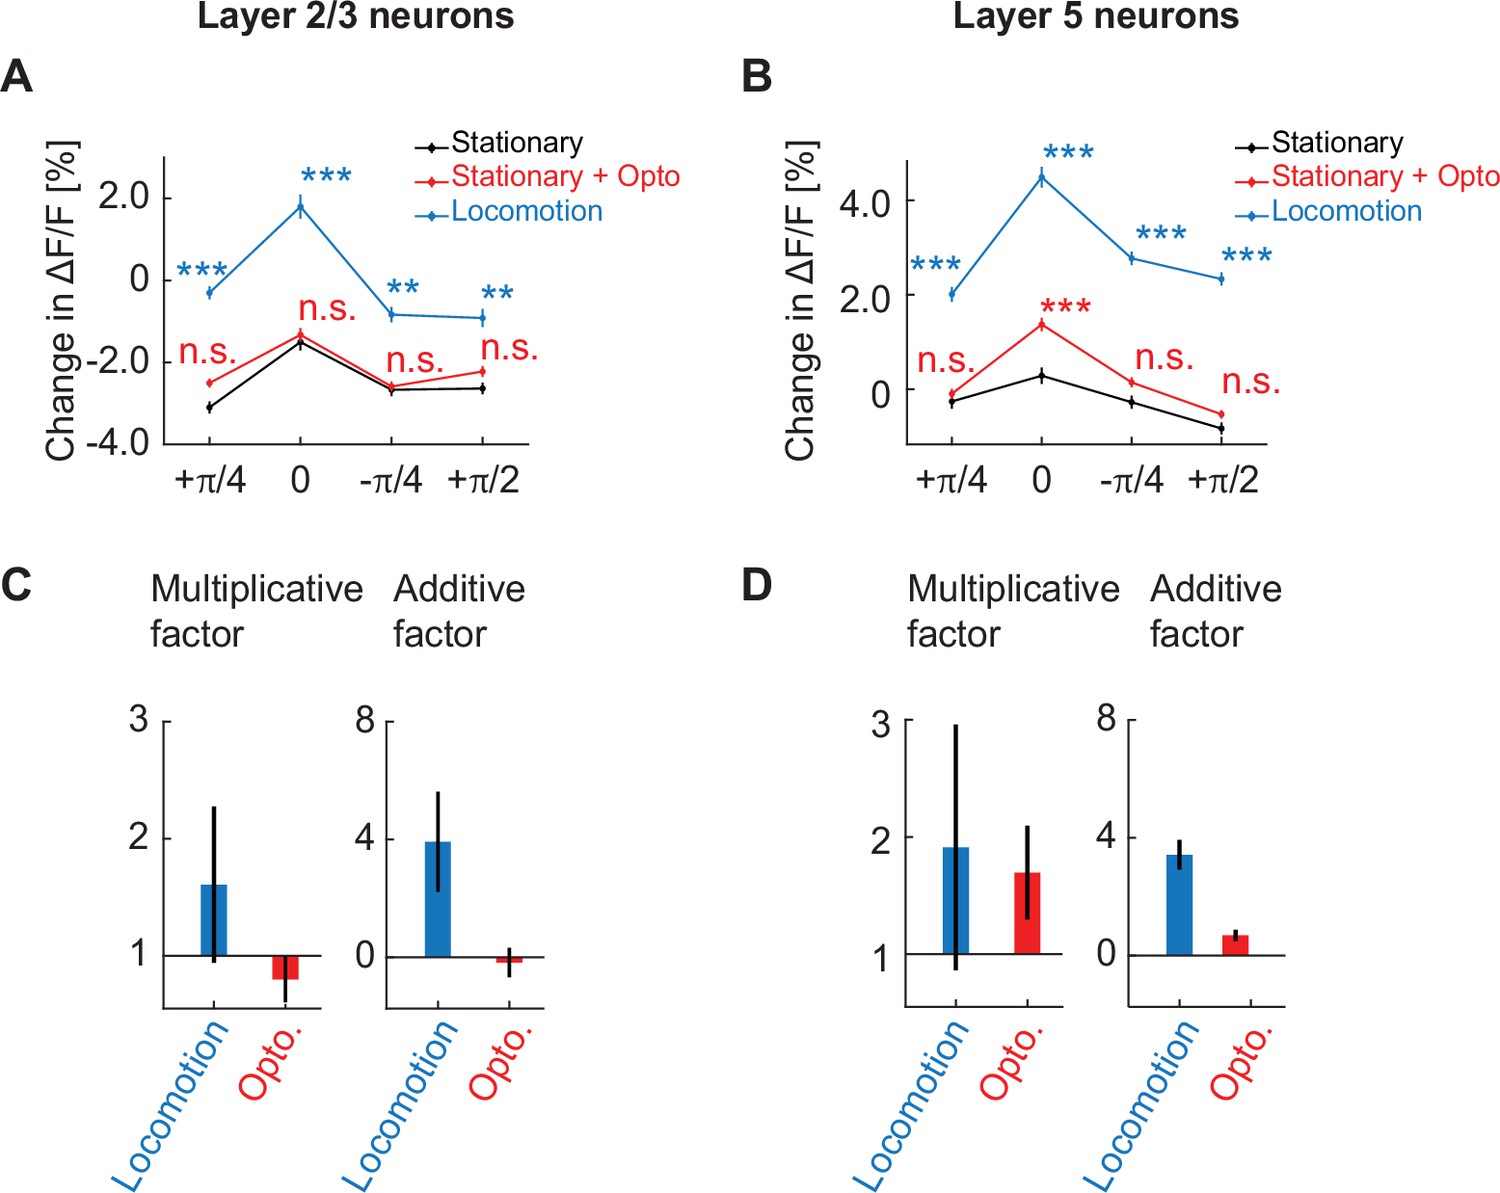
Cholinergic stimulation primarily has a multiplicative influence on the orientation tuning curve of layer 5 neurons.
(A) Average calcium response of layer 2/3 neurons in visual cortex to different orientations of full field drifting gratings while mice were stationary (black), on optogenetic stimulation of cholinergic axons while mice were stationary (red), and while mice were locomoting (blue). Here and elsewhere, n.s.: not significant; *p<0.05; **p<0.01; ***p<0.001; see Supplementary file 1 for all statistical information. (B) As in A, but for layer 5 neurons in visual cortex. (C) Multiplicative factor (a) and additive factor (b) of a linear fit of the form y = ax + b, for the scaling of the orientation tuning curve in layer 2/3 induced by locomotion and optogenetic stimulation of cholinergic axons. Error bars indicate the standard error of the coefficients. (D) Same as in C, but for layer 5 neurons in visual cortex.
Figure 4—figure supplement 5
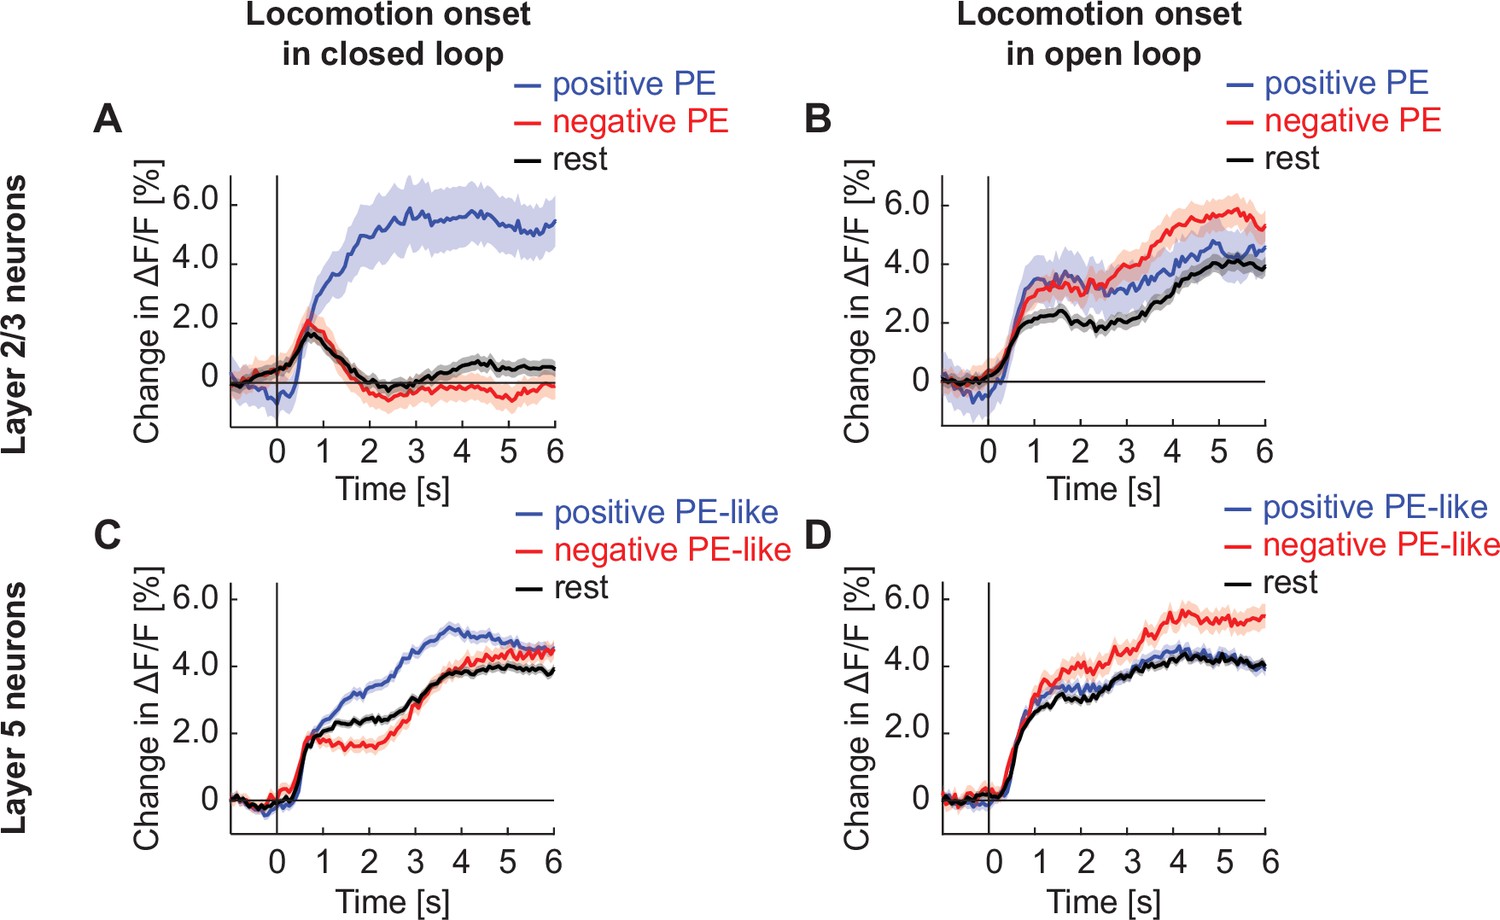
Locomotion onset responses are suppressed by closed loop visual feedback in layer 2/3, but not layer 5.
(A) Average calcium response of layer 2/3 neurons in visual cortex to locomotion onset in closed loop, with neurons split into positive prediction error (PE) neurons (blue), negative PE neurons (red), and the rest of the population (black). We defined the top 30% responders to grating stimuli as positive PE neurons, the top 30% responders to visuomotor mismatch as negative PE neurons, and the remaining 60% of the neurons along with any neurons that responded to both gratings and mismatch as rest. (B) As in A, but during open loop. (C) As in A, but for layer 5 neurons. (D) As in A, but for layer 5 neurons in open loop.
Figure 5
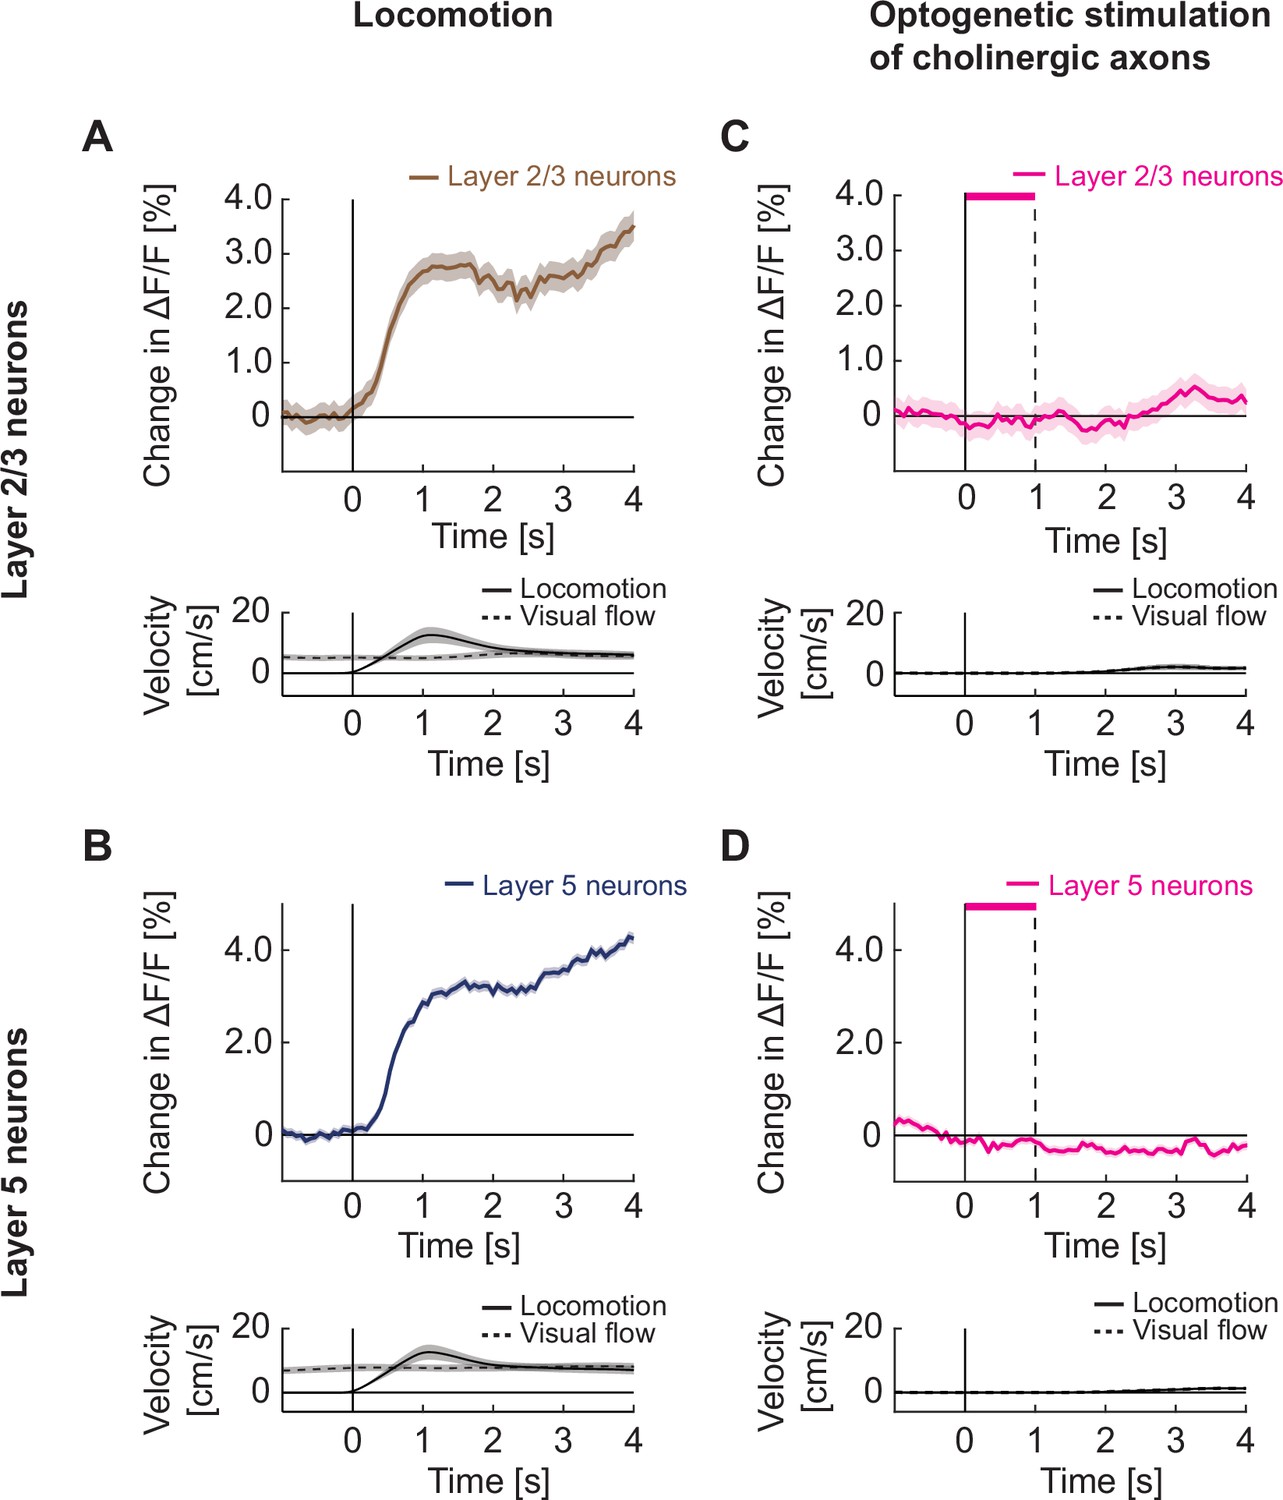
Optogenetic activation of cholinergic axons in visual cortex did not drive responses in either layer 2/3 or layer 5 neurons.
(A) Upper panel: Average calcium response of layer 2/3 neurons in visual cortex to locomotion onset in open loop. Lower panel: Average locomotion velocity and visual flow speed for the corresponding onsets. Shading indicates SEM. (B) As in A, but for layer 5 neurons in visual cortex. (C) Upper panel: Average calcium response of layer 2/3 neurons in visual cortex during local optogenetic stimulation of cholinergic axons while the mice were stationary. Pink bar marks duration of the optogenetic stimulus. Lower panel: Average locomotion velocity and visual flow speed for the corresponding onsets. Note, the two overlap by experimental design. (D) As in C, but for layer 5 neurons in visual cortex.
Figure 6 with 3 supplements
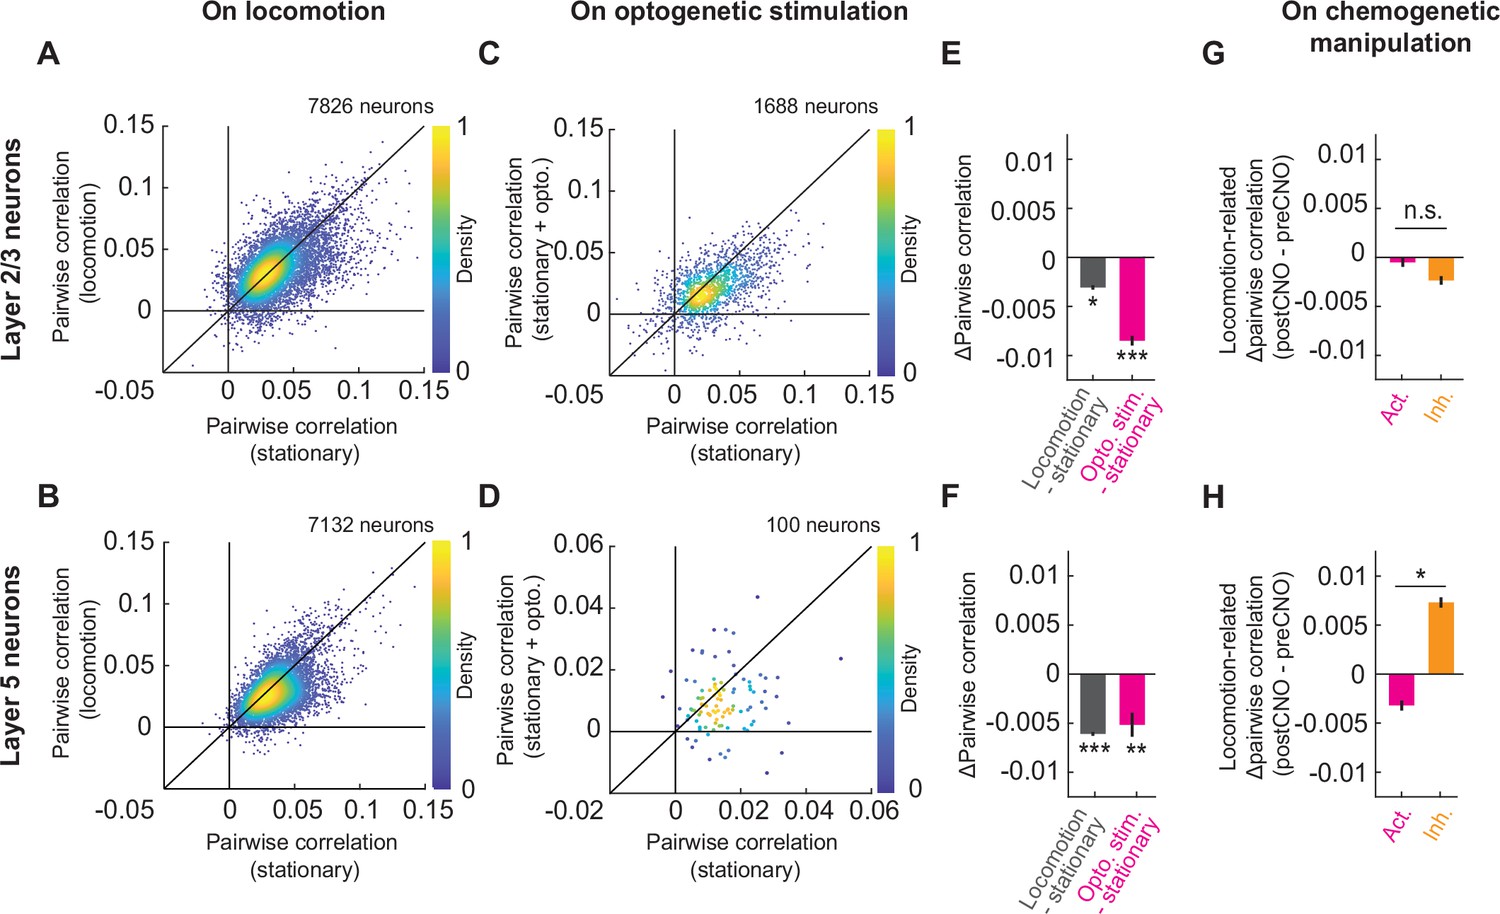
Cholinergic axon activation reduced pairwise correlations between neurons in visual cortex.
(A) Average pairwise correlation in calcium activity of layer 2/3 neurons while the mouse was stationary and while the mouse was locomoting. Each dot is the mean of the pairwise correlations for one neuron to all others in the same field of view. (B) As in A, but for layer 5 neurons. (C) As in A, but comparing the correlation while the mice were stationary, to that while cholinergic axons were stimulated optogenetically. (D) As in C, but for layer 5 neurons. Note, for this experiment the imaging plane was in L2/3 to simultaneously image layer 2/3 neurons and apical dendrites of layer 5. The latter were traced to their soma in layer 5 offline and were used to compute layer 5 activity correlations. (E) Average change in pairwise correlations of layer 2/3 neurons on locomotion (gray) or on optogenetic stimulation of cholinergic axons during stationary periods (pink), compared to the correlations during stationary (stat.) periods at baseline. Here and elsewhere, n.s.: not significant; *p<0.05; **p<0.01; ***p<0.001; see Supplementary file 1 for all statistical information. (F) As in E, but for layer 5 neurons of visual cortex. (G) Change in the average pairwise correlations of layer 2/3 neurons during locomotion, upon DREADD activation (pink) or inhibition (orange) of basal forebrain cholinergic neurons. (H) As in G, but for layer 5 neurons.
Figure 6—figure supplement 1
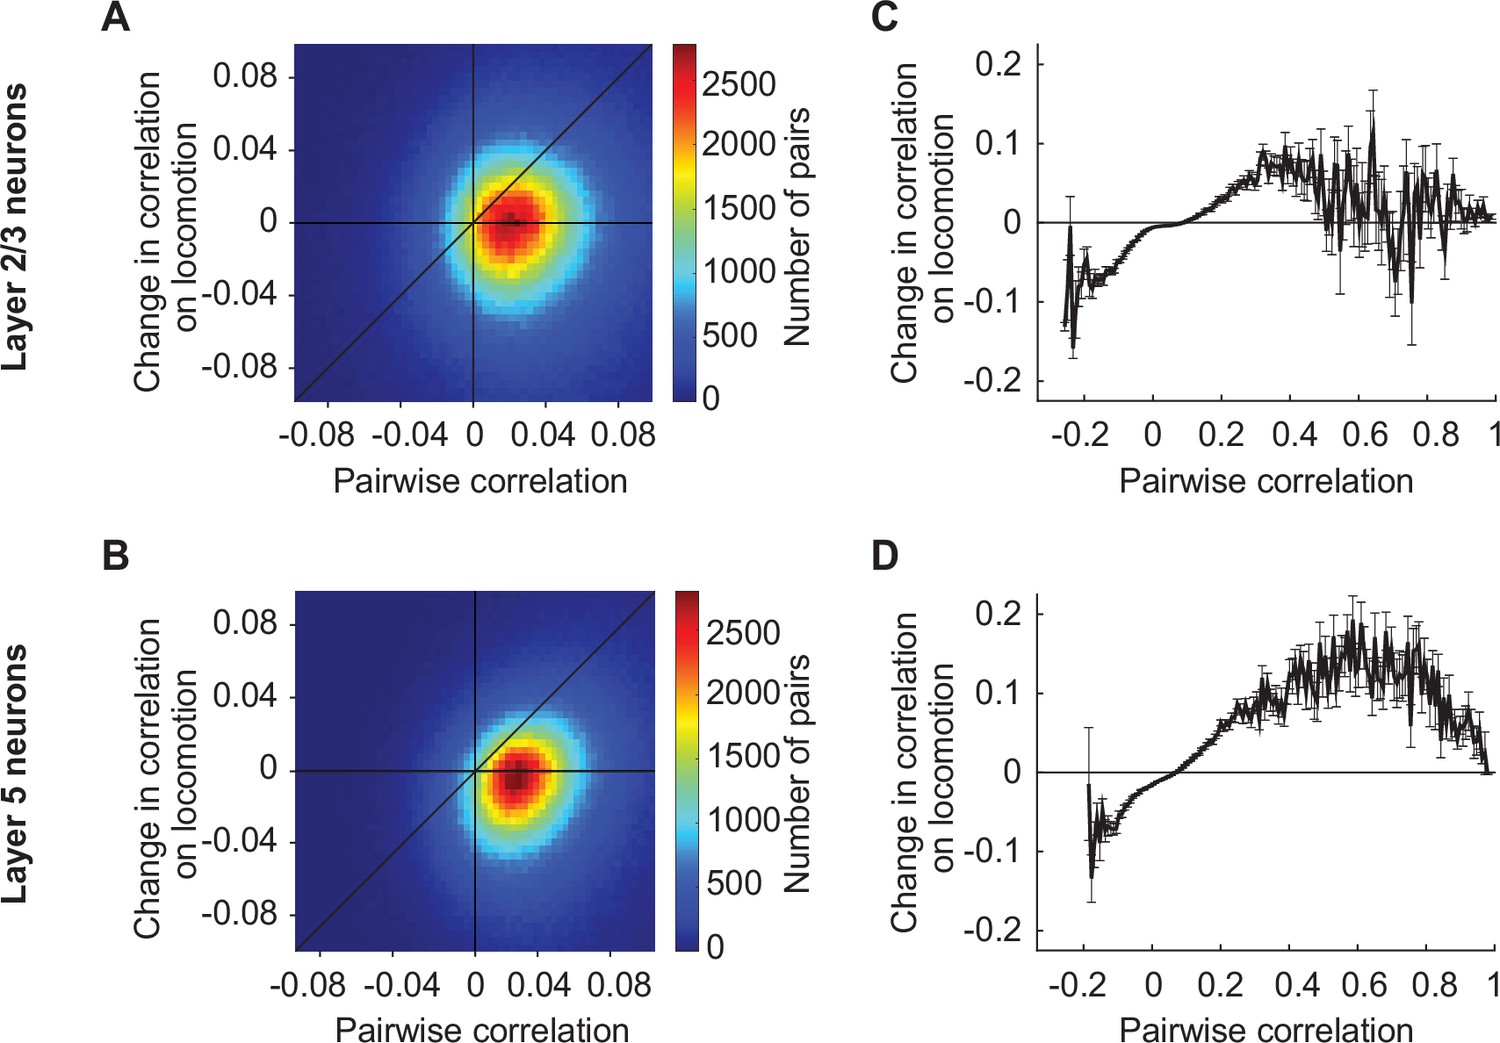
Locomotion increases the correlation between those layer 5 neurons in visual cortex that on average have a higher correlation.
(A) Change in the pairwise correlation between pairs of layer 2/3 neurons in visual cortex on locomotion and their average correlation over the entire imaging session. (B) As in A, but for layer 5 neurons in visual cortex. (C) Related to A with all neuron pairs binned by their average correlation. Bars indicate SEM. (D) As in C but for layer 5 neurons in visual cortex.
Figure 6—figure supplement 2
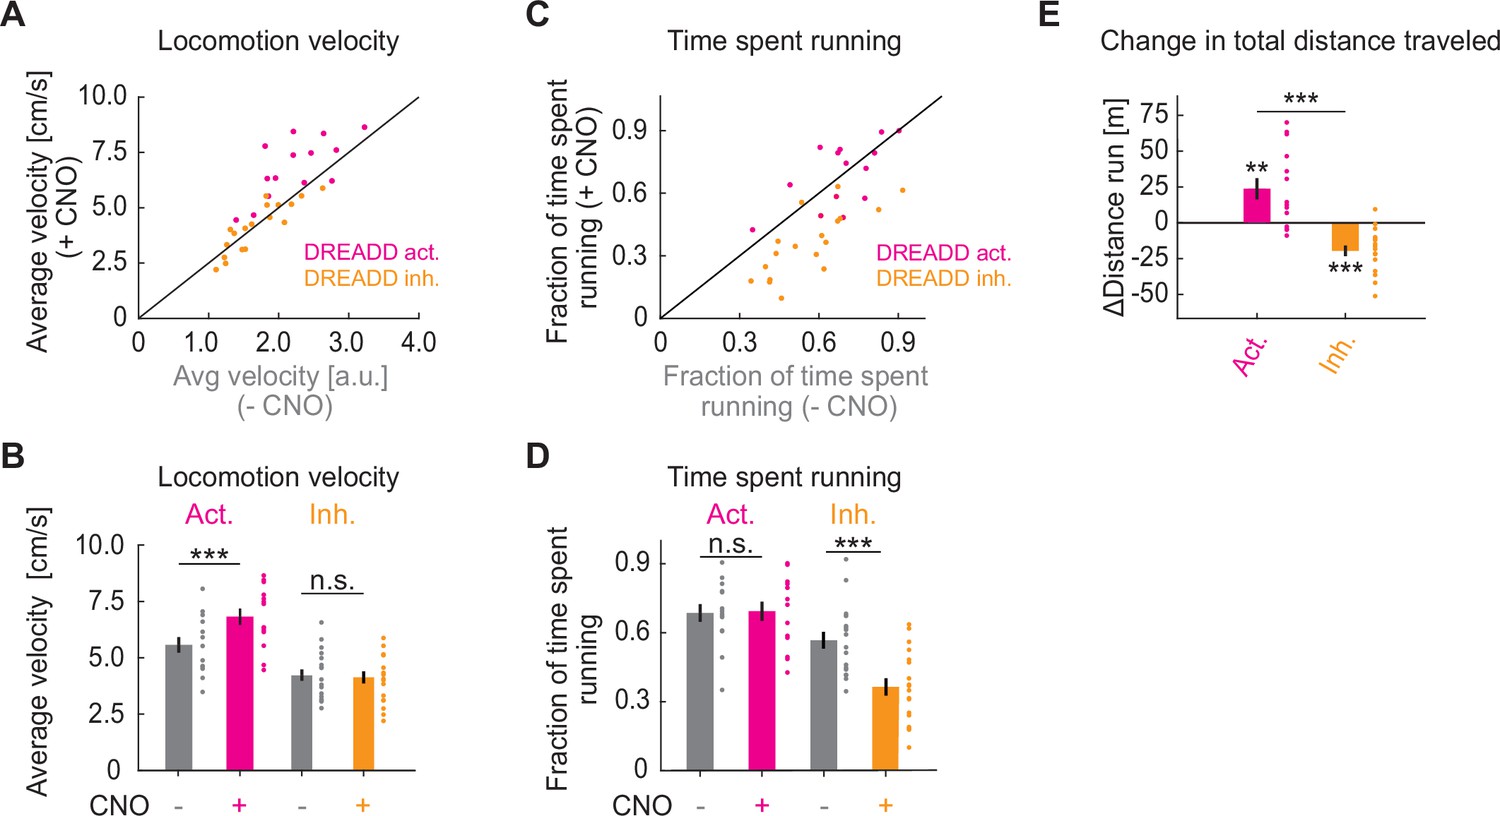
Chemogenetic manipulation of basal forebrain cholinergic neurons affects locomotion behavior of mice.
(A) Average locomotion velocity before and after administration of Clozapine N-oxide (CNO) in ChAT-Cre mice that expressed a DREADD activator (pink) or a DREADD inhibitor (orange) in basal forebrain. Each dot is an experimental session. (B) Quantification of the data shown in A. Here and elsewhere, n.s.: not significant; *p<0.05; **p<0.01; ***p<0.001; see Supplementary file 1 for all statistical information. (C) As in A, but for fraction of time spent running. (D) Quantification of the data shown in C. (E) CNO-induced change in the total distance traveled.
Figure 6—figure supplement 3

Change in locomotion-related decorrelation upon chemogenetic manipulation of basal forebrain cholinergic neurons.
Related to Figure 6. (A) Average change in pairwise correlations of layer 2/3 neurons of visual cortex during locomotion in the group of mice before (gray, left) and after (pink) DREADD activation, and in the group before (gray, right) and after (orange) DREADD inhibition of basal forebrain cholinergic neurons. Here and elsewhere, n.s.: not significant; *p<0.05; **p<0.01; ***p<0.001; see Supplementary file 1 for all statistical information. Note, the differences in pre-Clozapine-N-oxide (CNO) locomotion-driven decorrelation between the different groups of mice complicate the direct comparison of the DREADD effects. To ease this comparison, we represented the same data in Figure 6G and H as a difference to pre-CNO levels. (B) As in A, but for layer 5 neurons of visual cortex.
Figure 7 with 1 supplement

Cholinergic input reduced response latency of layer 5 neurons in visual cortex to grating stimuli.
(A) Locomotion (brown) or optogenetic stimulation of cholinergic axons (pink) induced change in the response latency of layer 2/3 neurons in visual cortex to full field drifting grating onset. Here and elsewhere, n.s.: not significant; *p<0.05; **p<0.01; ***p<0.001; see Supplementary file 1 for all statistical information. (B) As in A, but for layer 5 neurons.
Figure 7—figure supplement 1
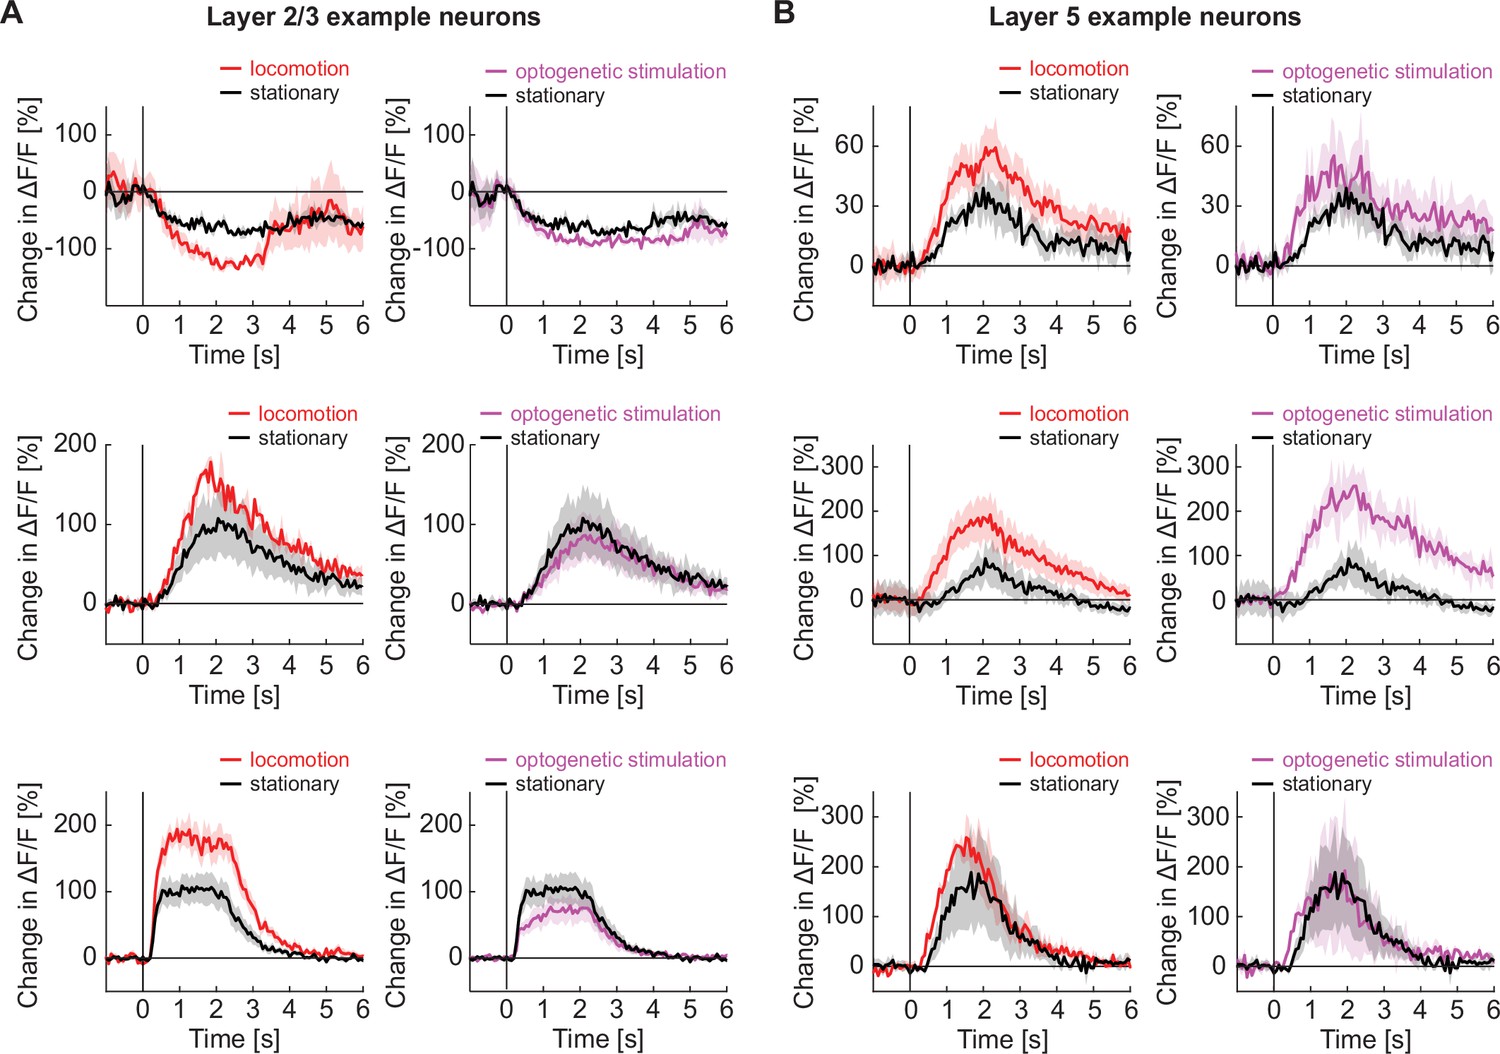
Locomotion and optogenetic stimulation of basal forebrain cholinergic axons decreased the latency of response to a visual stimulus in layer 5 neurons but not in layer 2/3 neurons.
(A) Three example layer 2/3 neurons from visual cortex with the average response to grating stimuli in responsive trials while the mouse is stationary (black), locomoting (red), or on optogenetic stimulation of cholinergic axons in visual cortex (purple). (B) As in A, but for three example layer 5 neurons.
Videos
Video 1
Mouse running speeds.
Mouse running on a spherical treadmill at different speeds to illustrate the range of running speeds covered by our data.
Tables
Key resources table
| Reagent type (species) or resource | Designation | Source or reference | Identifiers | Additional information |
|---|---|---|---|---|
| Strain, strain background (adeno-associated virus) | AAV2/5-hSyn1-FLEx-axon-GCaMP6s (1013–1015 GC/ml) | FMI vector core | vector.fmi.ch | |
| Strain, strain background (adeno-associated virus) | AAV PHP.eB-Ef1α-DIO-GCaMP6s (1011 GC/ml) | FMI vector core | vector.fmi.ch | |
| Strain, strain background (adeno-associated virus) | AAV2/1-hSyn-DIO-ChrimsonR-tdTomato (1011–1013 GC/ml) | FMI vector core | vector.fmi.ch | |
| Strain, strain background (adeno-associated virus) | AAV2/1-Ef1α-GCaMP6f-WPRE (1011–1014 GC/ml) | FMI vector core | vector.fmi.ch | |
| Strain, strain background (adeno-associated virus) | AAV2/1-Ef1α-DIO-hM3D(Gq)-mCherry (1011 GC/ml) | FMI vector core | vector.fmi.ch | |
| Strain, strain background (adeno-associated virus) | AAV2/1-Ef1α-DIO-hM4D(Gi)-mCherry (1011 GC/ml) | FMI vector core | vector.fmi.ch | |
| Strain, strain background (adeno-associated virus) | AAV2/9-hSyn-GRAB-ACh3.0 (1013 GC/ml) | FMI vector core | vector.fmi.ch | |
| Strain, strain background (adeno-associated virus) | AAV2/1-Ef1α-DIO-tdTomato-WPRE (1014 GC/ml) | FMI vector core | vector.fmi.ch | |
| Strain, strain background (adeno-associated virus) | AAV2/1-Ef1α-GFP-WPRE (1012 GC/ml) | FMI vector core | vector.fmi.ch | |
| Chemical compound, drug | Clozapine-N-oxide (CNO) | Tocris | Cat# 4936–10 mg | DREADD activator |
| Chemical compound, drug | Fentanyl citrate | Actavis | CAS 990-73-8 | Anesthetic compound |
| Chemical compound, drug | Midazolam (Dormicum) | Roche | CAS 59467-96-8 | Anesthetic compound |
| Chemical compound, drug | Medetomidine (Domitor) | Orion Pharma | CAS 86347-14-0 | Anesthetic compound |
| Chemical compound, drug | Ropivacaine | Presenius Kabi | CAS 132112-35-7 | Analgesic compound |
| Chemical compound, drug | Lidocaine | Bichsel | CAS 137-58-6 | Analgesic compound |
| Chemical compound, drug | Buprenorphine | Reckitt Benckiser Healthcare | CAS 52485-79-7 | Analgesic compound |
| Chemical compound, drug | Humigel | Virbac | - | Ophthalmic gel |
| Chemical compound, drug | Flumazenil (Anexate) | Roche | CAS 78755-81-4 | Anesthetic antagonist |
| Chemical compound, drug | Atipamezole (Antisedan) | Orion Pharma | CAS 104054-27-5 | Anesthetic antagonist |
| Chemical compound, drug | Metacam | Boehringer Ingelheim | CAS 71125-39-8 | Analgesic compound |
| Chemical compound, drug | N-Butyl-2-cyanoacrylate | Braun | CAS 6606-65-1 | Histoacryl |
| Chemical compound, drug | Dental cement (Paladur) | Heraeus Kulzer | CAS 9066-86-8 | |
| Genetic reagent Mus musculus | C57BL/6 | Charles River | - | |
| Genetic reagent Mus musculus | B6J.129S6-Chattm2(Cre)Lowl/MwarJ Alias used here: ChAT-IRES-Cre | Jackson Laboratories | RRID:IMSR_JAX:028861 | Cre expression in cholinergic neurons |
| Software, algorithm | MATLAB (2020b) | The MathWorks | RRID:SCR_001622 | Data analysis |
| Software, algorithm | LabVIEW | National Instruments | RRID:SCR_014325 | Hardware control |
| Software, algorithm | Two-photon acquisition software | Keller laboratory | https://sourceforge.net/projects/iris-scanning/ | Data acquisition |
| Software, algorithm | Image data processing software | Keller laboratory | https://sourceforge.net/p/iris-scanning/calliope/HEAD/tree/ | Data processing |
| Software, algorithm | Python | https://www.python.org/ | RRID:SCR_008394 | Virtual reality |
| Software, algorithm | Panda3D | https://www.panda3d.org/ | N/A | Virtual reality |
| Other | Virtual reality and two-photon setup | Leinweber et al., 2014; Leinweber et al., 2017 | DOI: https://doi.org/10.3791/50885, https://doi.org/10.1016/j.neuron.2017.08.036 | Hardware setup |
| Other | OBIS 673 nm LX | Coherent | Cat#1187194 | Optogenetic stimulation laser |
| Other | LED | Prizmatix | UHP-T-595 | Sham stimulation |
| Other | Titanium headplate | FMI/ETHZ workshop | N/A | Mice head-fixation |
| Other | Dental drill | Meisinger | N/A | For craniotomy |
Additional files
-
Supplementary file 1
Statistical information on all analysis.
For statistical comparisons we used paired or unpaired t-tests, or hierarchical bootstraps as indicated in the table below. The units (ROIs, sites, or mice) over which testing was done are boldfaced. For hierarchical bootstraps the two levels of units used are boldfaced.
- https://cdn.elifesciences.org/articles/89986/elife-89986-supp1-v1.docx
-
Supplementary file 2
List of mice used in the different experimental groups.
- https://cdn.elifesciences.org/articles/89986/elife-89986-supp2-v1.docx
-
MDAR checklist
- https://cdn.elifesciences.org/articles/89986/elife-89986-mdarchecklist1-v1.docx
Download links
A two-part list of links to download the article, or parts of the article, in various formats.
Downloads (link to download the article as PDF)
Open citations (links to open the citations from this article in various online reference manager services)
Cite this article (links to download the citations from this article in formats compatible with various reference manager tools)
Cholinergic input to mouse visual cortex signals a movement state and acutely enhances layer 5 responsiveness
eLife 12:RP89986.
https://doi.org/10.7554/eLife.89986.5


