Temporally specific gene expression and chromatin remodeling programs regulate a conserved Pdyn enhancer
- Department of Neurobiology, University of Alabama at Birmingham, United States
- Civitan International Research Center, University of Alabama at Birmingham, United States
Figures
Figure 1 with 1 supplement
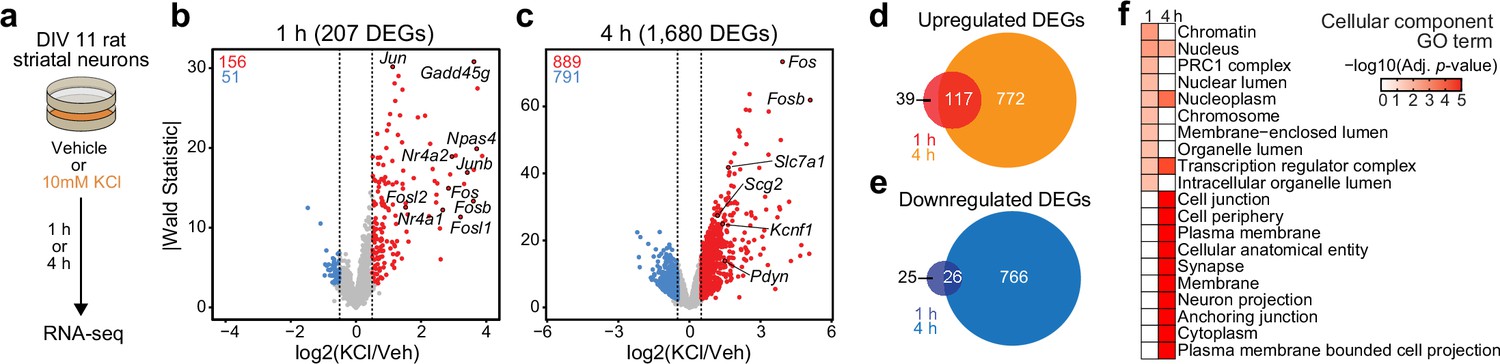
Characterization of temporally and functionally distinct activity-dependent gene expression programs in cultured striatal neurons.
(a) Experimental design. DIV11 cultures were depolarized for 1 or 4 hr with 10 mM KCl. Following treatment, RNA-seq libraries were constructed. (b, c) Volcano plots displaying gene expression changes after 1 and 4 hr of neuronal depolarization. (d, e) Venn diagrams comparing 1 and 4 hr up- and downregulated differentially expressed genes (DEGs). (f) Top 10 cellular component GO terms for 1 and 4 upregulated DEGs.
Figure 1—figure supplement 1

Striatal neuron immediate early genes (IEGs) and late response genes (LRGs) are temporally and functionally distinct and are induced by a variety of stimuli.
-
Figure 1—figure supplement 1—source data 1
RT-qPCR data.
- https://cdn.elifesciences.org/articles/89993/elife-89993-fig1-figsupp1-data1-v1.xlsx
-
Figure 1—figure supplement 1—source data 2
RT-qPCR data.
- https://cdn.elifesciences.org/articles/89993/elife-89993-fig1-figsupp1-data2-v1.xlsx
Figure 2 with 1 supplement
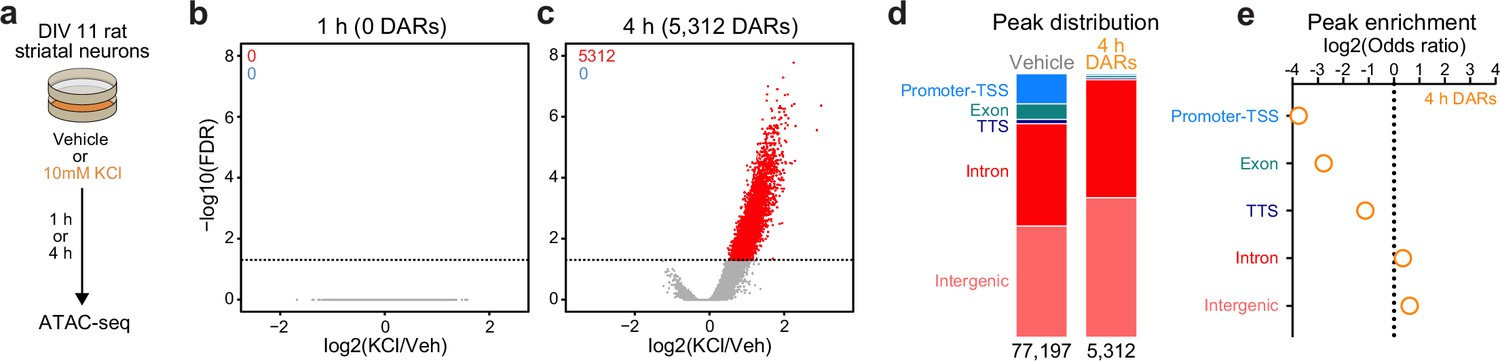
Activity-dependent chromatin remodeling in cultured primary rat striatal neurons.
(a) DIV11 primary rat striatal neurons were treated with 10 mM KCl for 1 or 4 hr. Following treatment, ATAC-seq libraries were prepared. (b, c) Volcano plots displaying differentially accessible regions (DARs) after 1 and 4 hr of neuronal depolarization. (d) Genomic location of vehicle and 4 hr DAR ATAC peaks. (e) Odds ratio for genomic annotations of 4 hr DARs.
Figure 2—figure supplement 1
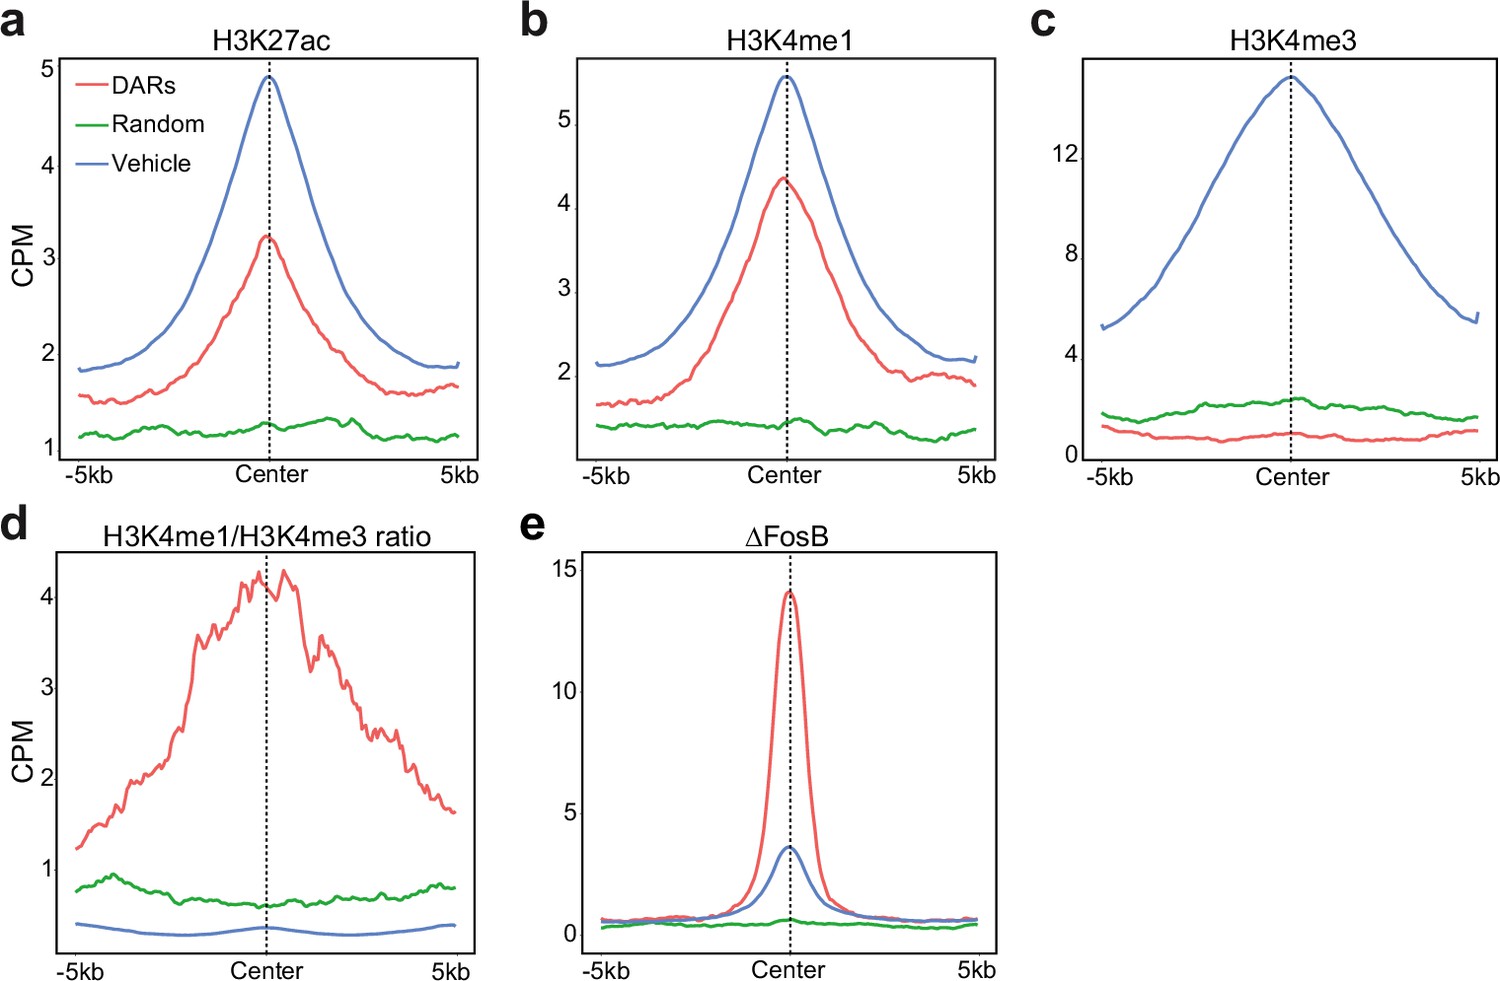
Transcription factor binding and histone modifications in 4 hr differentially accessible regions (DARs), random regions, and vehicle peaks.
Figure 3
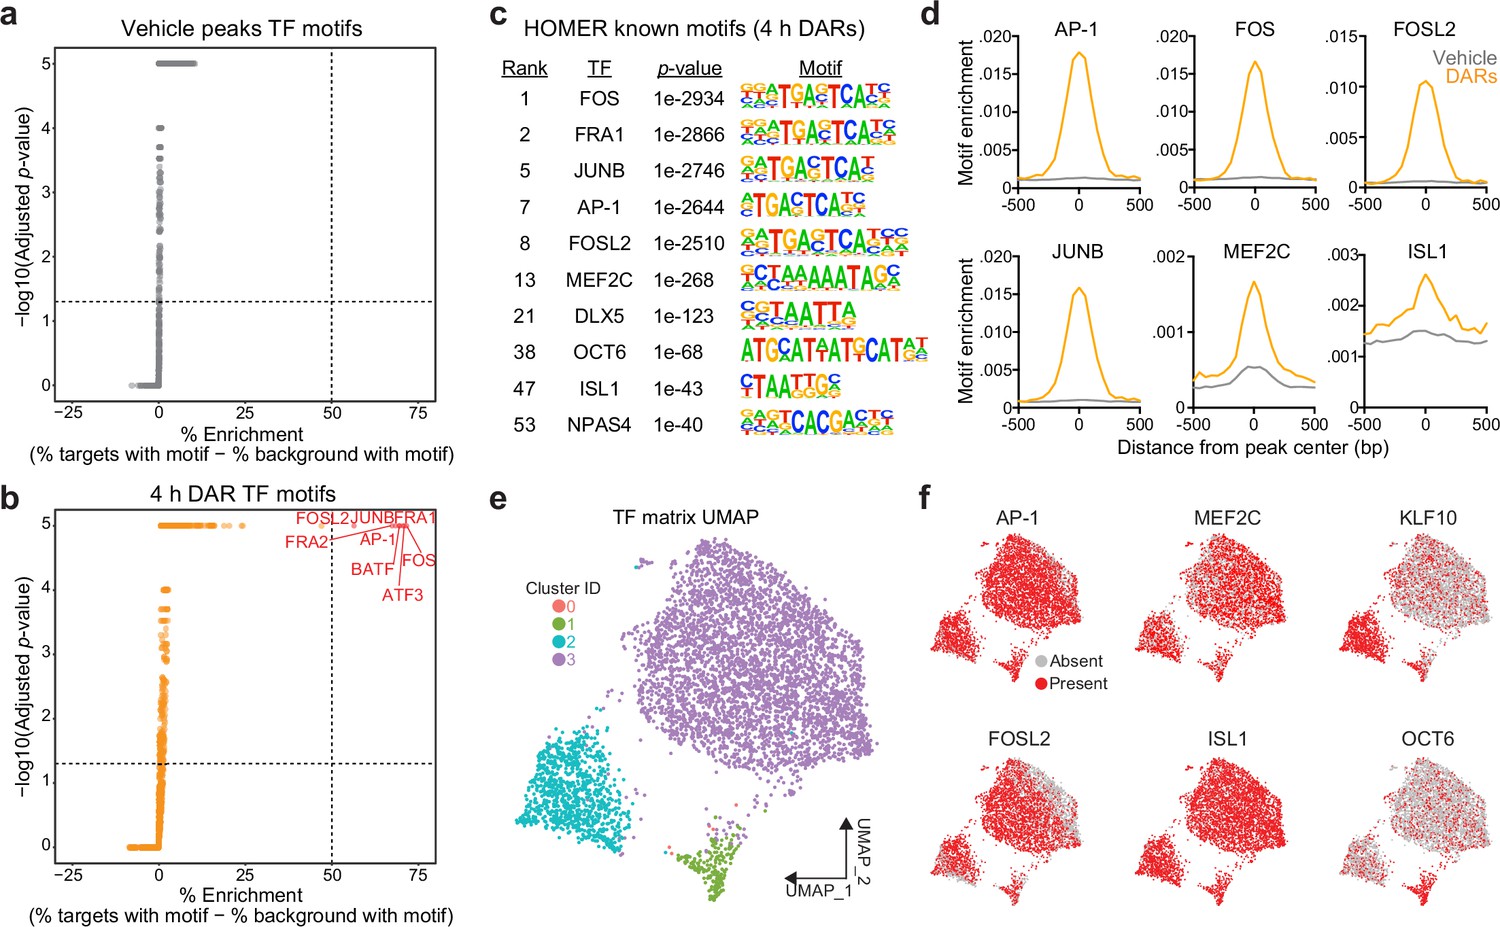
Motifs for activity-dependent transcription factors are significantly enriched in 4 hr differentially accessible regions (DARs).
(a, b) Plots showing enrichment of specific transcription factor motifs in vehicle peaks and 4 hr DARs. Motifs with significant adjusted p-values and a percent enrichment greater than 50% are shown in red and labeled with the corresponding transcription factor. (c) Representative results from HOMER known motif enrichment analysis conducted using 4 hr DAR peak set. (d) Motifs for activity-dependent transcription factors (TFs) (AP1, FOS, FOSL2, and JUNB), MEF2C, and ISL1 are enriched at the center of 4 hr DARs but not baseline (vehicle) peaks. Motif histogram distribution is represented as motifs/bp/peak. (e) Uniform manifold approximation and projection (UMAP) generated using transcription factor motif enrichment within the 4 hr DARs. (f) UMAPs colored by the presence of absence of specific transcription factor motifs. KLF10 and OCT6 specifically mark clusters 2 and 1, respectively.
Figure 4 with 1 supplement
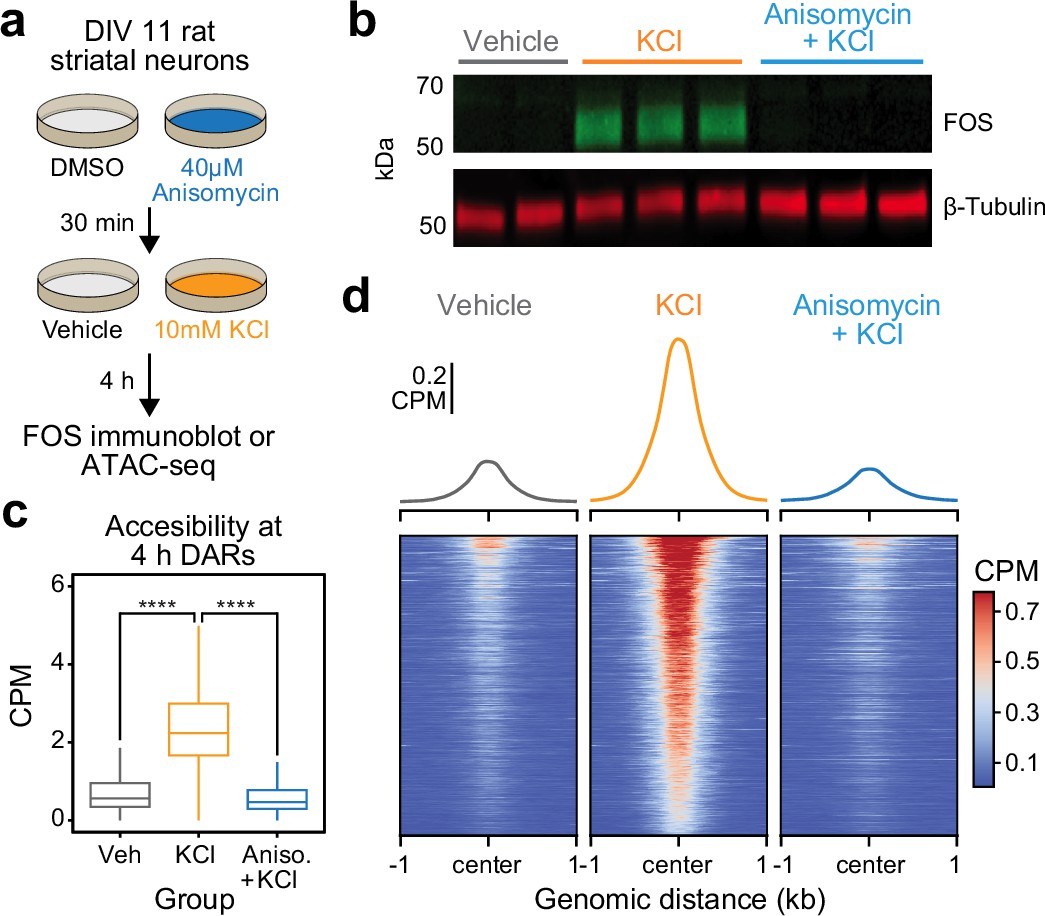
Activity-dependent chromatin remodeling requires protein translation.
(a) Experimental design. DIV11 primary rat striatal neurons were treated with Dimethyl Sulfoxide (DMSO) or anisomycin for 30 min followed by 4 hr of depolarization with 10 mM KCl. (b) Western blot for FOS and β-tubulin for cells treated with vehicle, 10 mM KCl, or 10 mM KCl + 40 μM anisomycin. (c) Boxplots demonstrating the effects of anisomycin on activity-dependent chromatin remodeling. One-way analysis of variance (ANOVA) with Tukey’s multiple comparisons test, ****p < 0.0001. (d) Heatmaps and mean accessibility plots from 4 hr differentially accessible regions (DARs). For heatmaps, each row represents a single DAR. CPM = counts per million.
Figure 4—figure supplement 1

Enhancers for Fos are open at baseline and do not undergo activity-dependent chromatin remodeling.
Figure 5 with 1 supplement
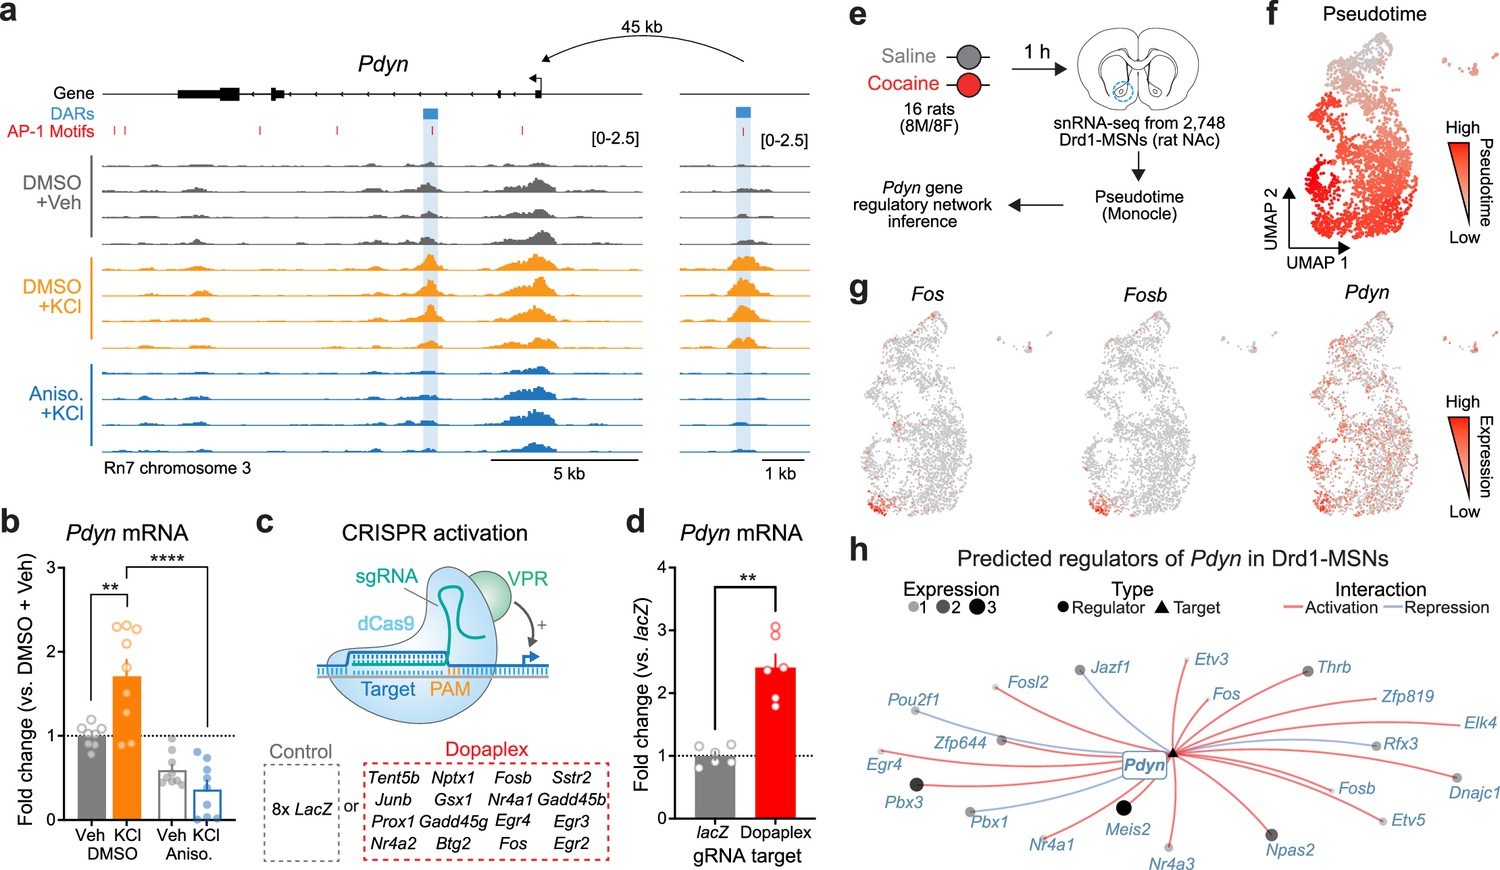
Transcriptional regulation of Pdyn mRNA.
(a) ATAC-seq tracks at the Pdyn gene locus of embryonic striatal neurons treated with DMSO + Vehicle, DMSO + KCl, or anisomycin + KCl. A differentially accessible region (DAR) 45 kb upstream of the Pdyn TSS in a non-coding region becomes accessible with depolarization only with intact protein translation. (b) RT-qPCR for Pdyn mRNA from DIV 11 rat striatal neurons treated with vehicle, KCl, anisomycin, or anisomycin + KCl. Induction of Pdyn mRNA by KCl is blocked by anisomycin pretreatment (one-way analysis of variance [ANOVA] with n=8-9 per group with Tukey’s multiple comparisons test **p < 0.01, ****p < 0.0001). Data expressed as mean + SEM. (c) Targeted activation of dopamine-regulated immediate early genes (IEGs) with CRISPR activation (data from Savell et al., 2020). dCas9-VPR was transduced with multiplexed sgRNAs targeting 16 IEGs. (d) Pdyn mRNA is upregulated following CRISPR-based activation of 16 IEGs. Mann–Whitney test with n=6 per group. **p < 0.01. Data expressed as mean + SEM. (e) Pseudotime analysis to predict regulators of Pdyn expression in Drd1-MSNs was performed with available snRNA-seq data from the rat nucleus accumbens (Savell et al., 2020). (f, g) Feature plots for Pseudotime, Fos, Fosb, and Pdyn in Drd1-MSNs. For these feature plots, a brighter red color is associated with a higher pseudotime and gene expression. (h) Gene regulatory network reconstruction from single-cell trajectories identifies predicted regulators of Pdyn in Drd1-MSNs.
Figure 5—figure supplement 1

Predicted regulators of Pdyn and Scg2 in Drd1-MSNs.
Figure 6
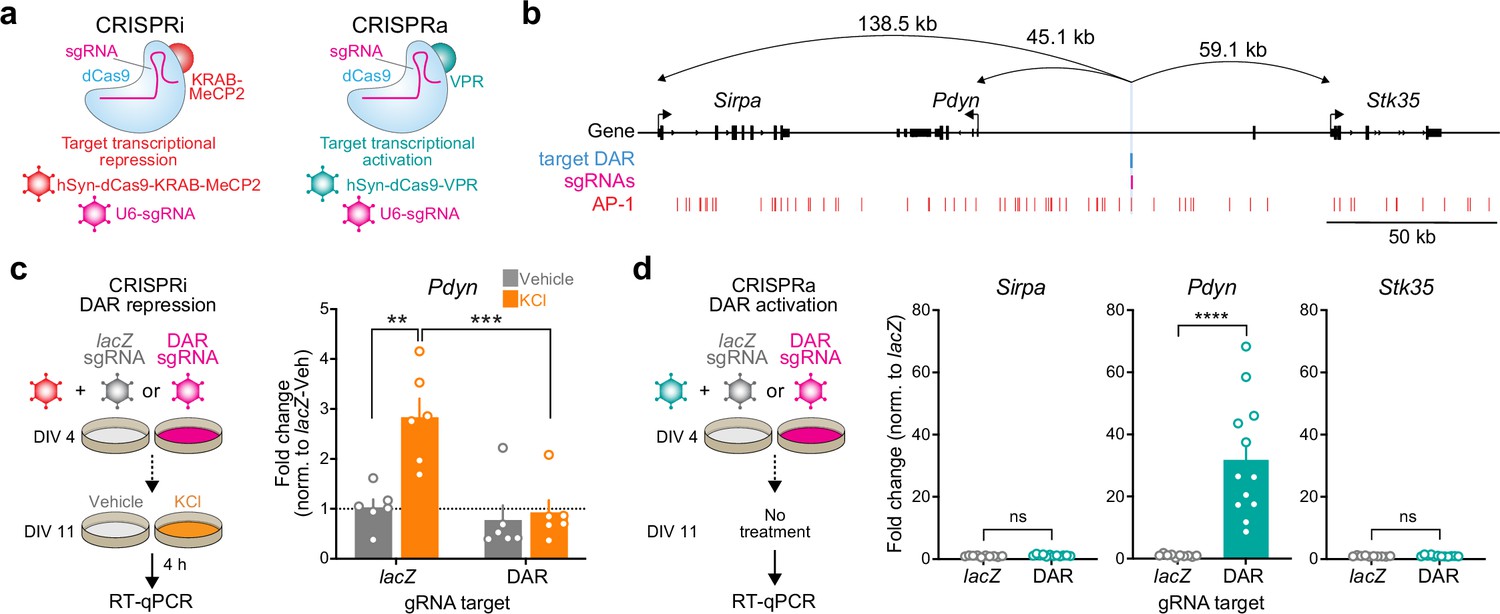
CRISPR-based functional validation of a novel Pdyn enhancer.
(a) Viral strategy for functional validation of putative enhancers using CRISPR interference with dCas9-KRAB-MeCP2 and CRISPR activation with dCas9-VPR. (b) CRISPR sgRNAs (4×) were designed to target the activity-regulated differentially accessible region (DAR) 45.1 kb upstream of Pdyn in the rat genome. (c) CRISPRi at the Pdyn DAR blocks activity-dependent induction of Pdyn mRNA. Cultured embryonic striatal neurons were transduced with dCas9-KRAB-MeCP2 and sgRNAs targeting lacZ (non-targeting control) or the Pdyn DAR. Neurons were then treated with vehicle or 10 mM KCl for 4 hr prior to RT-qPCR. One-way analysis of variance (ANOVA) with n=6 per group and Tukey’s multiple comparisons test **p < 0.01, ***p < 0.001. Data expressed as mean + SEM. (d) CRISPRa at the Pdyn DAR selectively upregulates Pdyn mRNA without altering expression of the nearest upstream and downstream genes. Striatal neurons were transduced with dCas9-VPR and sgRNAs targeting lacZ or the Pdyn DAR. Following RNA extraction at DIV 11, RT-qPCR was used to measure expression of Pdyn, Sirpa, and Stk35. Mann–Whitney test with n=12 per group ****p < 0.0001. Data expressed as mean + SEM.
Figure 7 with 1 supplement
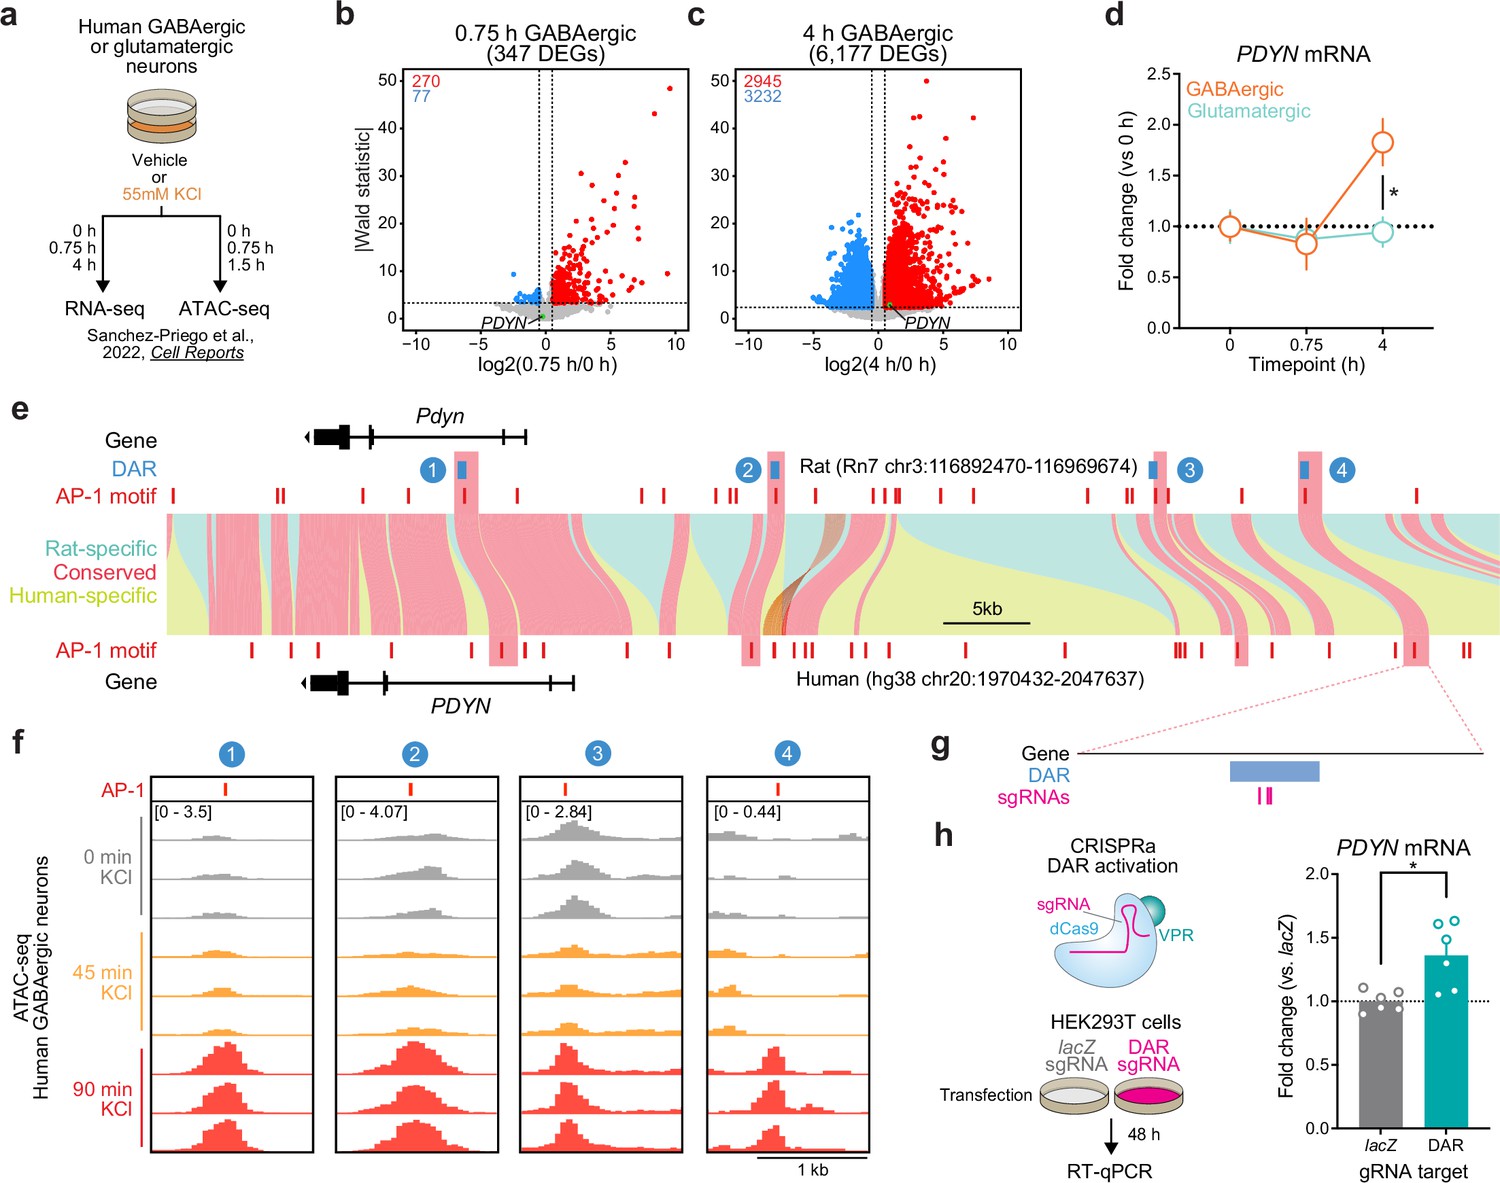
Identification and validation of a conserved PDYN enhancer in the human genome.
(a) Experimental design for published RNA- and ATAC-seq datasets from human GABAergic and glutamatergic neurons treated with 55 mM KCl. (b, c) Volcano plots for human GABAergic neurons treated with 55 mM KCl for 0.75 or 4 hr. PDYN is a significant differentially expressed gene (DEG) at 4 hr, but not 0.75 hr. (d) PDYN is significantly upregulated 4 hr after a KCl stimulus, but only in GABAergic neurons. Two-way analysis of variance (ANOVA) with Tukey’s multiple comparison’s test. *p < 0.05. (e) Linear synteny view of the rat and human Pdyn/PDYN locus reveals shared conservation of four distinct activity-dependent differentially accessible regions (DARs) identified in rat striatal neurons. (f) ATAC-seq tracks of GABAergic neurons treated with 55 mM KCl for 0, 0.75, or 1.5 hr at the human PDYN locus. Regions conserved between rats and humans undergo dynamic remodeling in human GABAergic cells at 1.5 hr after stimulation. A region homologous to the rat Pdyn enhancer characterized in Figure 6 is 63.7 kb upstream of the human PDYN gene. (g) Location of CRISPR sgRNAs in the human genome for CRISPR-based activation of the PDYN DAR in human cells. (h) CRISPRa at the human PDYN DAR is sufficient to upregulate PDYN mRNA in HEK293T cells. Mann–Whitney test. *p < 0.05.
Figure 7—figure supplement 1

Conserved activity-regulated PDYN differentially accessible region (DAR) is selective for GABAergic neurons.
Figure 8
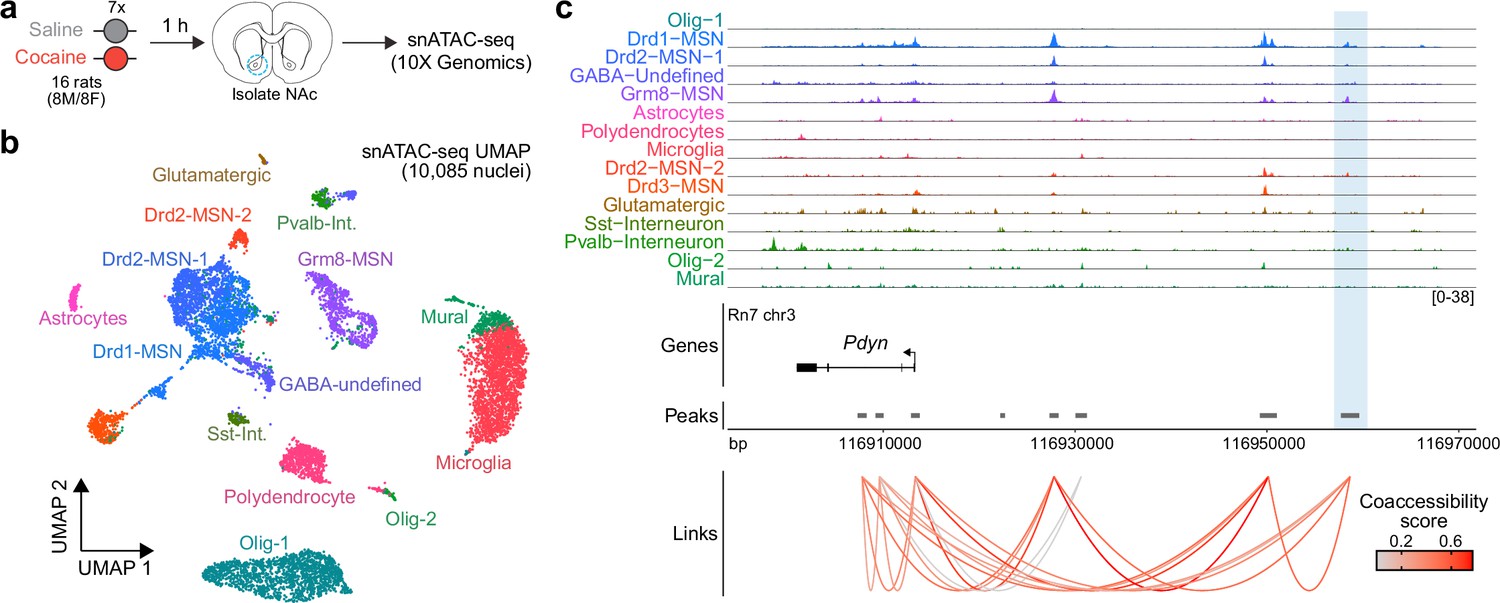
Characterization of the rat Pdyn differentially accessible region (DAR) in the adult nucleus accumbens at single-cell resolution.
(a) Experimental design. (b) Uniform manifold approximation and projection (UMAP) of 10,085 nuclei from adult rat nucleus accumbens (NAc). (c) Genome tracks displaying snATAC-seq data at the Pdyn locus. The experimentally validated Pdyn DAR (highlighted in blue) exhibits high co-accessibility with the proximal promoter for Pdyn as well as other nearby accessible regions.
Additional files
-
Supplementary file 1
Differential expression testing results for 1 and 4 hr timepoints.
- https://cdn.elifesciences.org/articles/89993/elife-89993-supp1-v1.xlsx
-
Supplementary file 2
Molecular function gene ontology (GO) terms for 1 and 4 hr specific differentially expressed genes (DEGs).
- https://cdn.elifesciences.org/articles/89993/elife-89993-supp2-v1.xlsx
-
Supplementary file 3
Differential accessibility testing results for 4 h timepoint.
- https://cdn.elifesciences.org/articles/89993/elife-89993-supp3-v1.xlsx
-
Supplementary file 4
CRISPR sgRNA and RT-qPCR primer sequences.
- https://cdn.elifesciences.org/articles/89993/elife-89993-supp4-v1.xlsx
-
MDAR checklist
- https://cdn.elifesciences.org/articles/89993/elife-89993-mdarchecklist1-v1.pdf
Download links
A two-part list of links to download the article, or parts of the article, in various formats.
Downloads (link to download the article as PDF)
Open citations (links to open the citations from this article in various online reference manager services)
Cite this article (links to download the citations from this article in formats compatible with various reference manager tools)
Temporally specific gene expression and chromatin remodeling programs regulate a conserved Pdyn enhancer
eLife 12:RP89993.
https://doi.org/10.7554/eLife.89993.3


