Coordination between ECM and cell-cell adhesion regulates the development of islet aggregation, architecture, and functional maturation
- Department of Translational Research and Cellular Therapeutics, Arthur Riggs Diabetes and Metabolism Research Institute, Beckman Research Institute, City of Hope, United States
- Department of Biomedical Engineering, College of Engineering, California State University, Long Beach, United States
- Light Microscopy Core, Beckman Research Institute, City of Hope, United States
- Department of Neurobiology, Physiology and Behavior, University of California, Davis, United States
- Department of Cellular and Physiological Sciences, Life Sciences Institute, University of British Columbia, Canada
- Department of Molecular & Cellular Endocrinology, Arthur Riggs Diabetes and Metabolism Research Institute, Beckman Research Institute, City of Hope, United States
- Department of Physiology and Membrane Biology, School of Medicine, University of California, Davis, United States
Figures
Figure 1 with 2 supplements
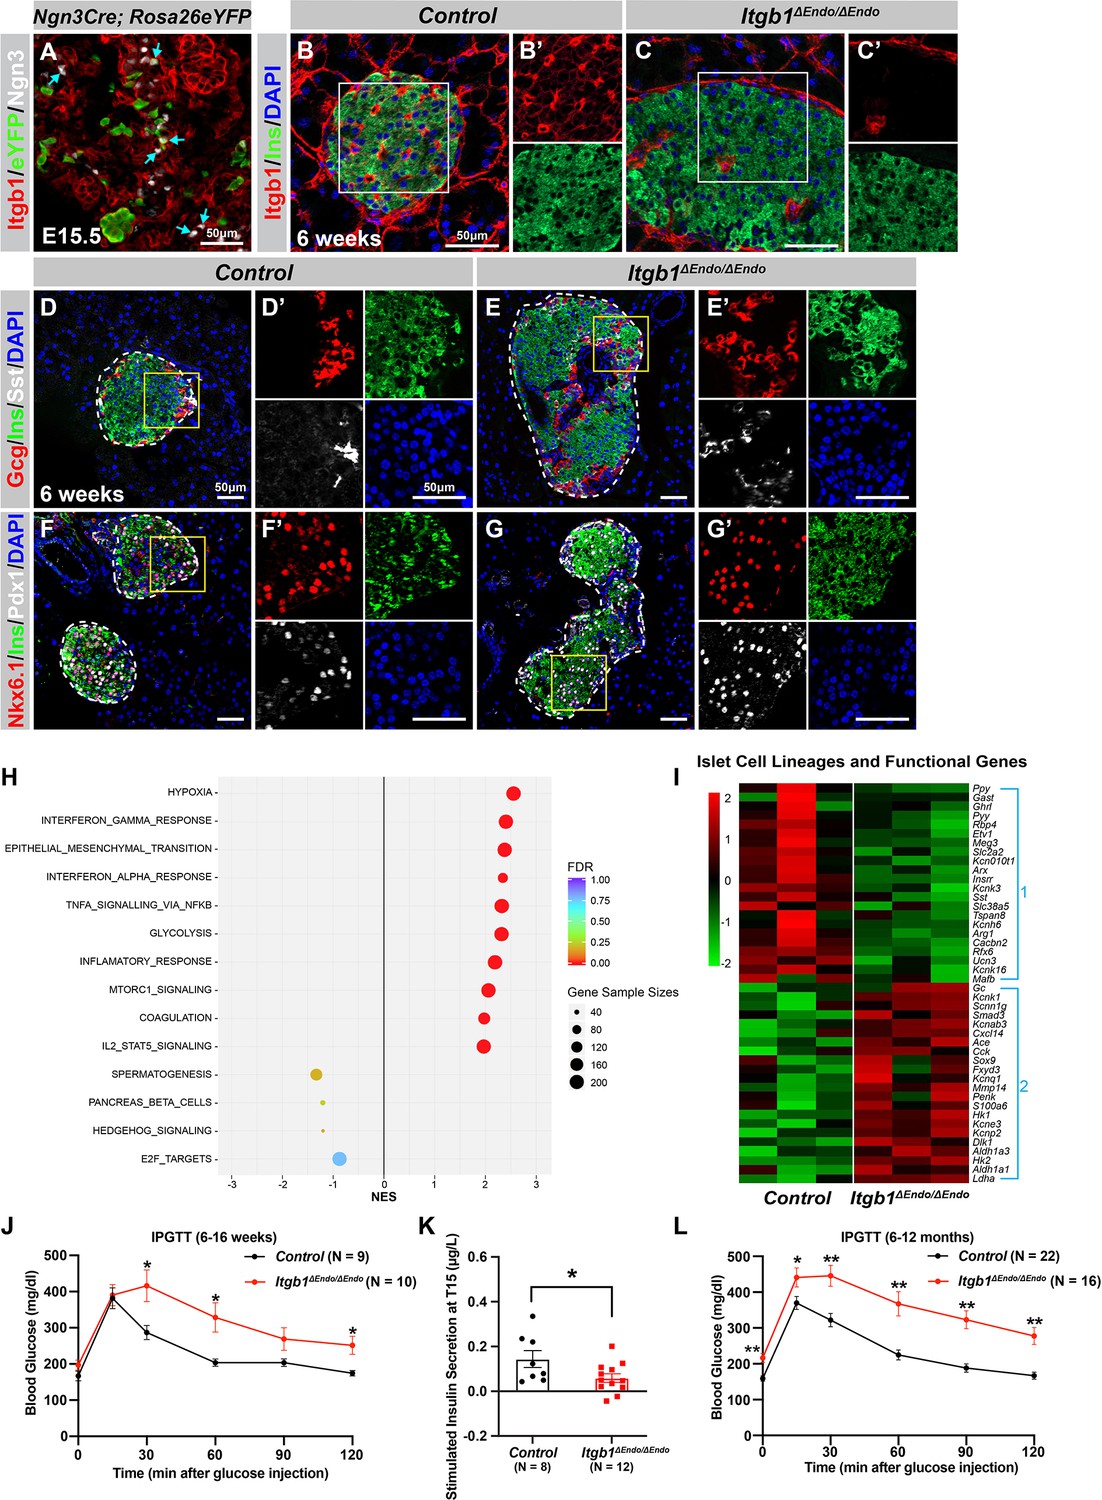
ECM-Itgb1 signaling in endocrine progenitors is required for normal islet morphology and function.
(A) Immunofluorescence staining for Itgb1 and Ngn3 in pancreas sections of Ngn3-Cre; Rosa26eYFP reporter mice at E15.5. Cyan arrows indicate Ngn3+ cells and lineage-traced endocrine cells expressing Itgb1. (B–C) Immunofluorescence staining for Itgb1, Ins, and DAPI on pancreas sections, demonstrating significant Itgb1 deletion in an Itgb1ΔEndo/ΔEndo islet at 6 weeks of age. Fields demarcated by white boxes in (B–C) are shown with individual color channels in (B’–C’) side panels. (D–G) Immunofluorescence staining for Gcg, Ins, Sst, Nkx6.1, Pdx1, and DAPI on pancreas sections of (D, F) control and (E, G) Itgb1ΔEndo/ΔEndo mice at 6 weeks of age. Individual islets are outlined by dotted lines. Fields demarcated by yellow boxes in (D–G) are shown at higher magnification in (D’–G’) side panels. (H) Gene-set enrichment analysis of the differentially expressed genes, indicating top enriched pathways for control versus Itgb1ΔEndo/ΔEndo islets at 6 weeks of age. Gene sample sizes and FDRs are indicated by the size and color of the dots. (I) Heatmap demonstrating down-regulation (Group 1) and up-regulation (Group 2) of functional maturation genes in Itgb1ΔEndo/ΔEndo islets compared to controls. (J–L) Intraperitoneal glucose tolerance test (J, L) and stimulated insulin secretion at T15 (K) on 6- to 16-week-old (J, K) and (L) 6- to 12-month-old control and Itgb1ΔEndo/ΔEndo mice. Ngn3, neurogenin 3; Gcg, glucagon; Ins, insulin; DAPI, 4’,6-diamidino-2-phenylindole; Sst, somatostatin; IPGTT, intraperitoneal glucose tolerance test; FDR, false discovery rate; E15.5, embryonic day 15.5. Data are shown as mean ± SEM. *p<0.05 and **p<0.01.
-
Figure 1—source data 1
Related to Figure 1J.
- https://cdn.elifesciences.org/articles/90006/elife-90006-fig1-data1-v2.xlsx
-
Figure 1—source data 2
Related to Figure 1K.
- https://cdn.elifesciences.org/articles/90006/elife-90006-fig1-data2-v2.xlsx
-
Figure 1—source data 3
Related to Figure 1L.
- https://cdn.elifesciences.org/articles/90006/elife-90006-fig1-data3-v2.xlsx
Figure 1—figure supplement 1
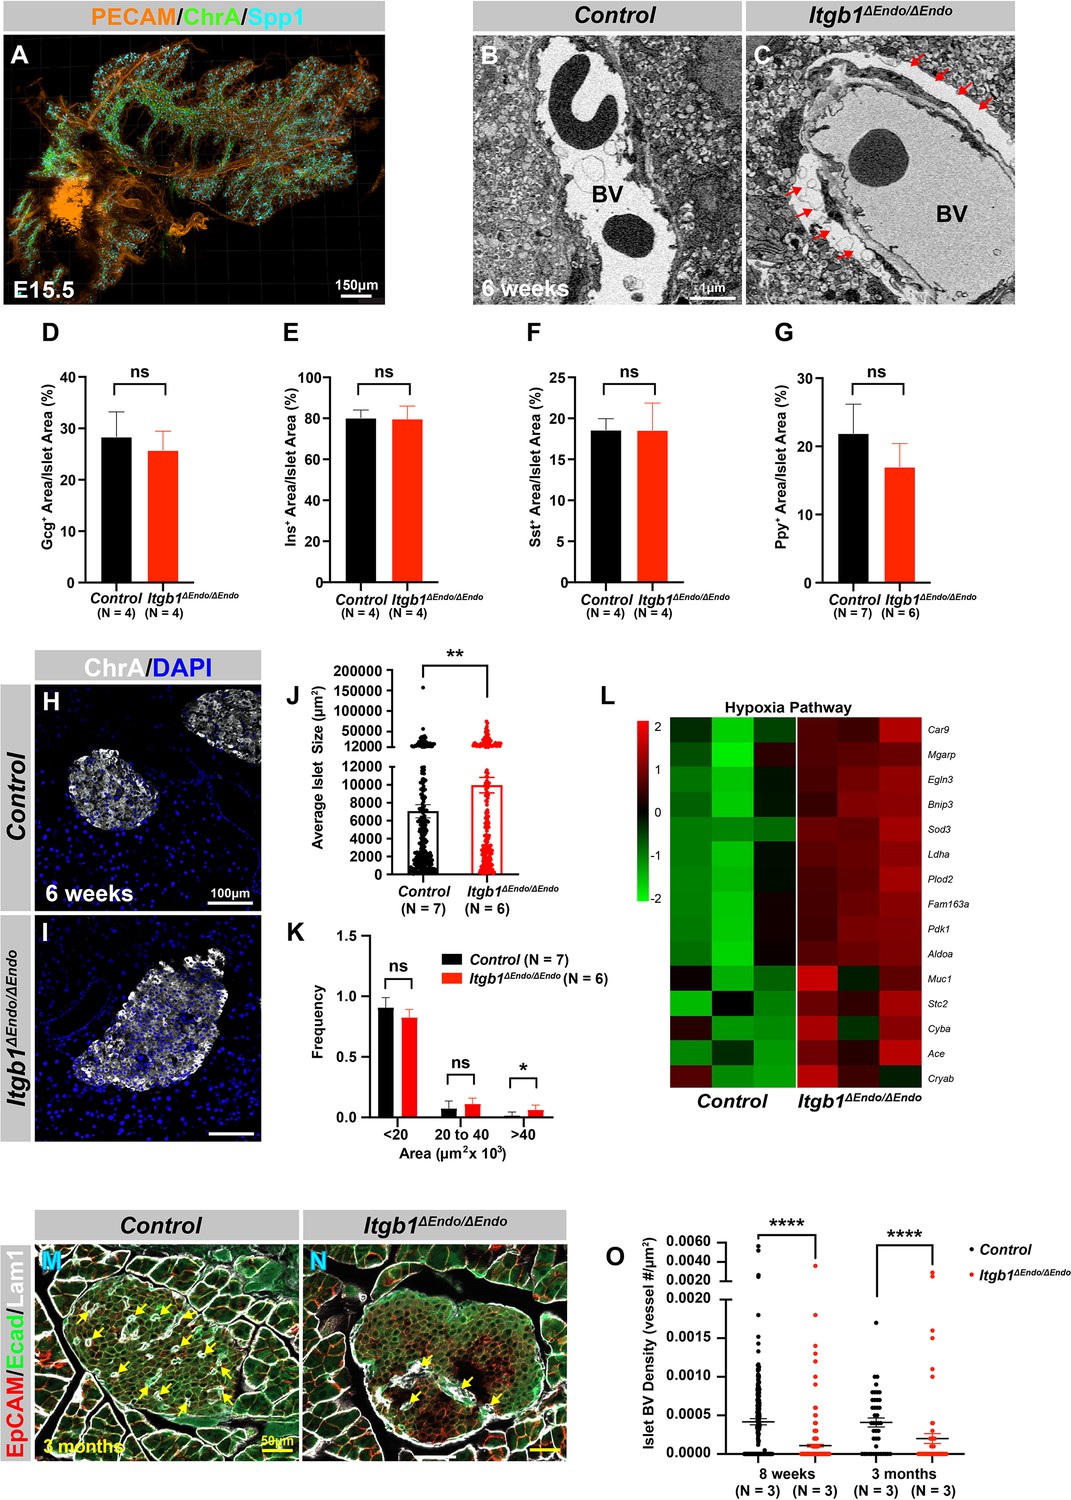
Deletion of Itgb1 in endocrine progenitors results in abnormal interactions with blood vessels and decreased expression of functional maturation markers within islets.
(A) Whole-mount immunofluorescence staining for PECAM, ChrA, and Spp1 in a wild-type pancreas at E15.5. (B–C) Transmission electron microscope images showing blood vessels in 6-week-old islets. Deletion of Itgb1 disrupts the attachment of endocrine cells to blood vessels (red arrows) in Itgb1ΔEndo/ΔEndo islets. (D–G) Quantification of the percentage of (D) Gcg+, (E) Ins+, (F) Sst+, and (G) Ppy+ cells relative to measured islet area of 6-week-old control and Itgb1ΔEndo/ΔEndo pancreas sections. (H–I) Immunofluorescence staining for ChrA and DAPI in 6-week-old (H) control and (I) Itgb1ΔEndo/ΔEndo pancreas sections. (J–K) Quantification of (J) average islet size and (K) islet size distribution based on ChrA staining of 6-week-old control and Itgb1ΔEndo/ΔEndo pancreas sections. (L) Heatmap showing hypoxia pathway genes are up-regulated in Itgb1ΔEndo/ΔEndo islets. (M–N) Immunofluorescence staining for EpCAM, Ecad, and Lam1 on 3-month-old pancreas sections showing reduced islet vasculature indicated by Lam1+ cells (yellow arrows). (O) Quantification of islet blood vessel density in control or Itgb1ΔEndo/ΔEndo islet area at 8 weeks and 3 months of age. PECAM, platelet endothelial cell adhesion molecule-1; ChrA, chromogranin A; Spp1, secreted phosphoprotein 1; Gcg, glucagon; Ins, insulin; Sst, somatostatin; Ppy, pancreatic polypeptide; Ecad, E-cadherin; epithelial cellular adhesion molecule, EpCAM; Lam1, laminin1; BV, blood vessels; E15.5, embryonic day 15.5. Data are shown as mean ± SEM. *p<0.05, **p<0.01, ****p<0.0001.
-
Figure 1—figure supplement 1—source data 1
Related to Figure 1—figure supplement 1D.
- https://cdn.elifesciences.org/articles/90006/elife-90006-fig1-figsupp1-data1-v2.xlsx
-
Figure 1—figure supplement 1—source data 2
Related to Figure 1—figure supplement 1E.
- https://cdn.elifesciences.org/articles/90006/elife-90006-fig1-figsupp1-data2-v2.xlsx
-
Figure 1—figure supplement 1—source data 3
Related to Figure 1—figure supplement 1F.
- https://cdn.elifesciences.org/articles/90006/elife-90006-fig1-figsupp1-data3-v2.xlsx
-
Figure 1—figure supplement 1—source data 4
Related to Figure 1—figure supplement 1G.
- https://cdn.elifesciences.org/articles/90006/elife-90006-fig1-figsupp1-data4-v2.xlsx
-
Figure 1—figure supplement 1—source data 5
Related to Figure 1—figure supplement 1J.
- https://cdn.elifesciences.org/articles/90006/elife-90006-fig1-figsupp1-data5-v2.xlsx
-
Figure 1—figure supplement 1—source data 6
Related to Figure 1—figure supplement 1K.
- https://cdn.elifesciences.org/articles/90006/elife-90006-fig1-figsupp1-data6-v2.xlsx
-
Figure 1—figure supplement 1—source data 7
Related to Figure 1—figure supplement 1O.
- https://cdn.elifesciences.org/articles/90006/elife-90006-fig1-figsupp1-data7-v2.xlsx
Figure 1—figure supplement 2
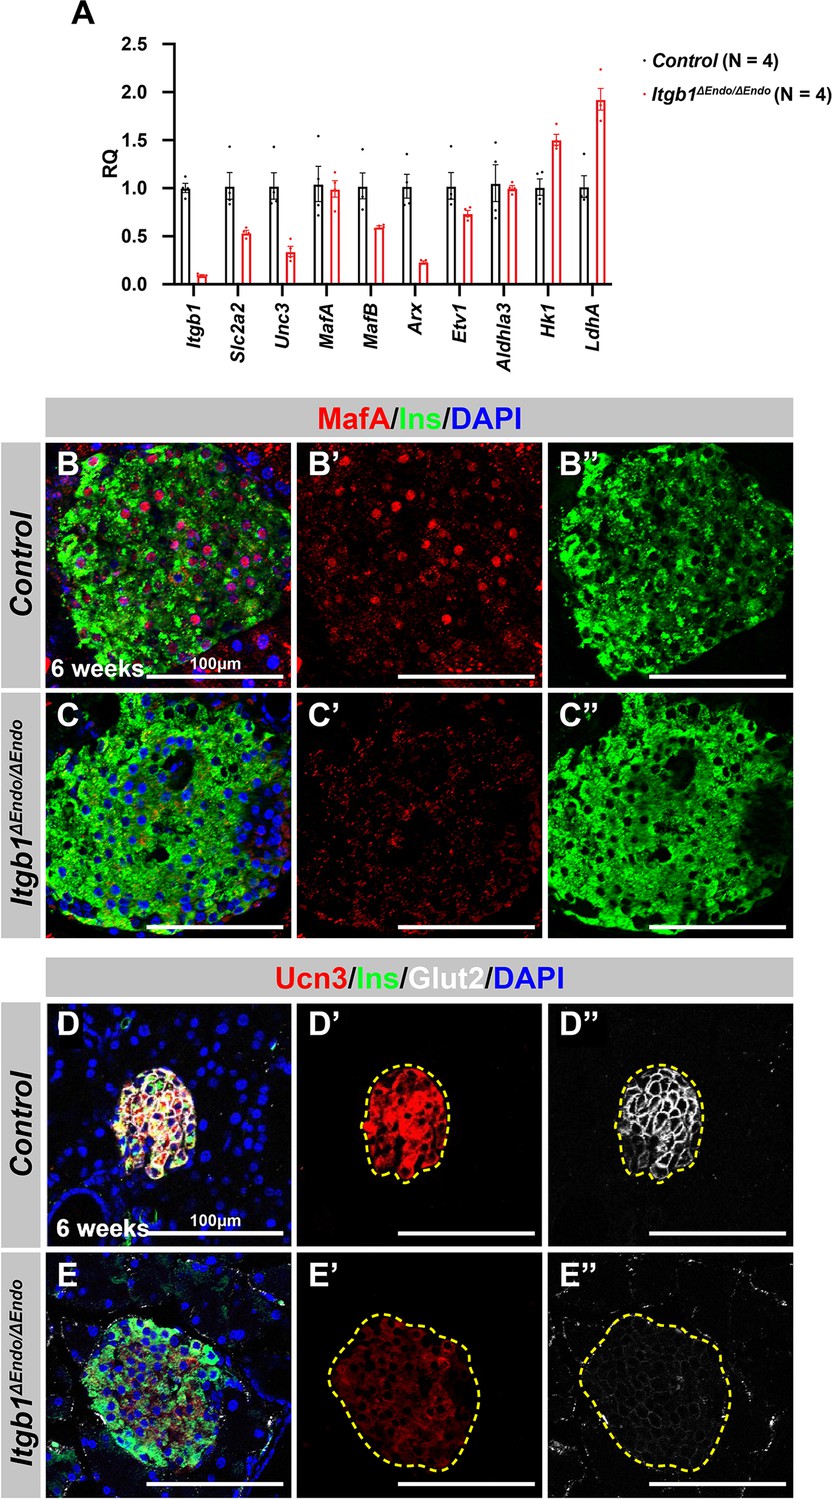
Deletion of Itgb1 in endocrine progenitors results in abnormal interactions with blood vessels and decreased expression of functional maturation markers within islets.
(A) Quantification of selected differentially expressed genes involved in islet functional maturation using real-time qPCR analysis in Itgb1ΔEndo/ΔEndo islets and compared to controls. The relative quantification of gene expression levels was determined using the 2-∆∆Ct method and is reported as an RQ value relative to the control group. The genes selected for validation were chosen based on their known roles in islet function and maturation. (B–E) Immunofluorescence staining for MafA, Ins, Ucn3, Glut2, and DAPI on 6-week-old (B, D) control and (C, E) Itgb1ΔEndo/ΔEndo pancreas sections. Individual islets are outlined by dotted yellow lines in (D’, D”, E’, E”). RQ, relative quantification; Ins, insulin; Ucn3, urocortin 3; PECAM, platelet endothelial cell adhesion molecule-1; DAPI, 4’,6-diamidino-2-phenylindole; E15.5, embryonic day 15.5. Data are shown as mean ± SEM. *p<0.05.
-
Figure 1—figure supplement 2—source data 1
Related to Figure 1—figure supplement 2A.
- https://cdn.elifesciences.org/articles/90006/elife-90006-fig1-figsupp2-data1-v2.xlsx
Figure 2 with 2 supplements
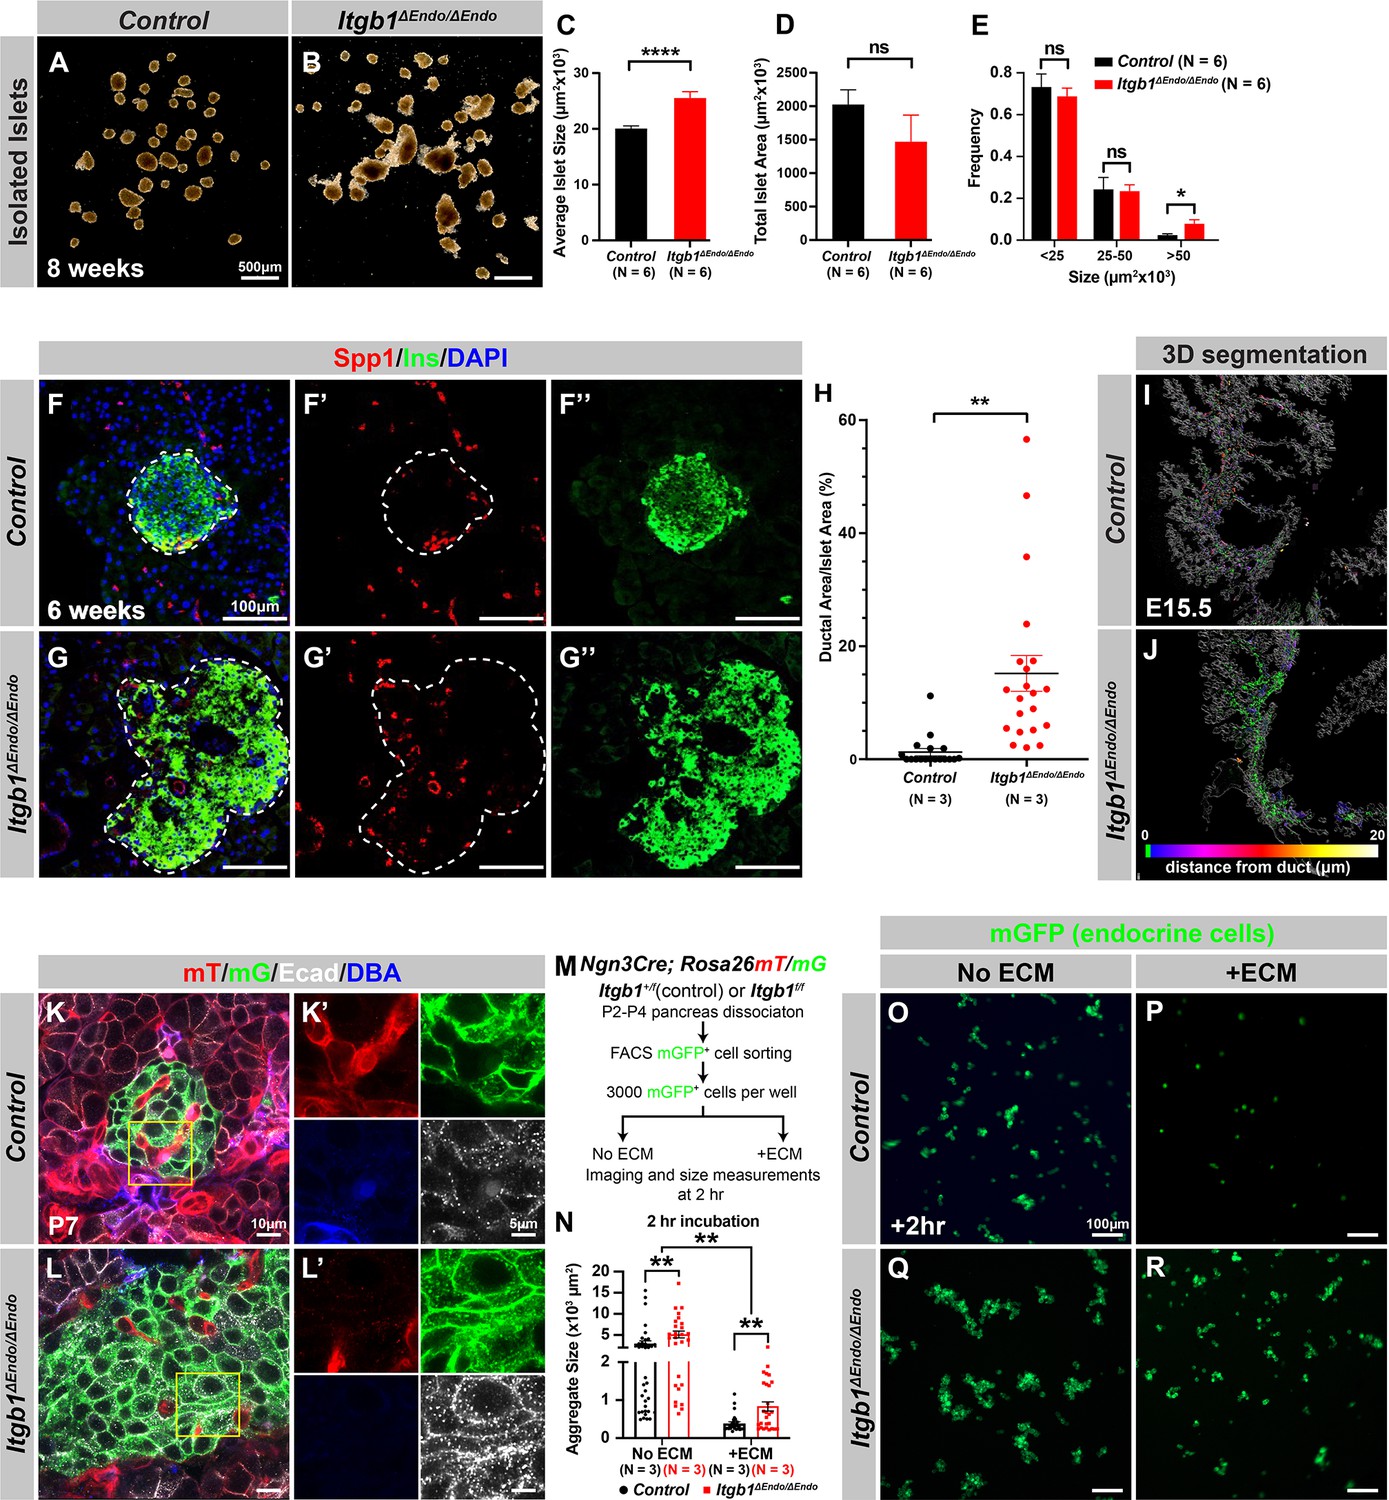
Itgb1 signaling is required for proper endocrine progenitor aggregation.
(A–B) Brightfield images of isolated islets from control and Itgb1ΔEndo/ΔEndo mice at 8 weeks of age. (C–E) Quantification of (C) average islet size, (D) total islet area, and (E) islet size distribution based on morphometric analysis of 8-week-old control and Itgb1ΔEndo/ΔEndo isolated islets. (F–G) Immunofluorescence staining for Spp1, Ins, and DAPI on 6-week-old control and Itgb1ΔEndo/ΔEndo pancreas sections. Islets are outlined by white dotted lines. (H) The ratio of ductal cell areas within the islets is quantified based on Spp1 and ChrA staining of pancreas sections from 6-week-old control and Itgb1ΔEndo/ΔEndo mice. (I–J) Three-dimensional (3D) segmentation analysis on whole-mount immunofluorescence images of E15.5 control and Itgb1ΔEndo/ΔEndo pancreata stained for ChrA and Spp1 (white colored) reveals that the endocrine cells in the Itgb1ΔEndo/ΔEndo pancreas are mostly retained within ducts, and the distance between endocrine cells and ducts is represented by a color scale. (K–L) Airyscan super-resolution images depict immunofluorescence staining for Ecad and ductal marker DBA in P7 mT/mG reporter mice showing up-regulation of Ecad in the Itgb1ΔEndo/ΔEndo pancreas. The dot-like Ecad expression pattern in super-resolution imaging represents adherens junction structures. The yellow boxes in (K–L) demarcate fields shown at higher magnification in (K’–L’) side panels. (M) The schematic depicts the experimental design for the in vitro aggregation assay. (N) Aggregate size is quantified after a 2 hr incubation with or without extracellular matrix (ECM). (O–R) Fluorescence images of mGFP+ endocrine progenitor aggregates after 2 hr of culture show that mGFP+ control endocrine progenitors clustered (O) without ECM but remained single cells (P) with ECM. Alternatively, Itgb1ΔEndo/ΔEndo endocrine progenitors clustered (Q) without ECM or (R) with ECM. Spp1, secreted phosphoprotein 1; Ins, insulin; DAPI, 4’,6-diamidino-2-phenylindole; Ecad, E-cadherin; DBA, Dolichos biflorus agglutinin; P7, postnatal day 7; E15.5, embryonic day 15.5. Data are shown as mean ± SEM. *p<0.05, **p<0.01, and ****p<0.0001.
-
Figure 2—source data 1
Related to Figure 2C.
- https://cdn.elifesciences.org/articles/90006/elife-90006-fig2-data1-v2.xlsx
-
Figure 2—source data 2
Related to Figure 2D.
- https://cdn.elifesciences.org/articles/90006/elife-90006-fig2-data2-v2.xlsx
-
Figure 2—source data 3
Related to Figure 2E.
- https://cdn.elifesciences.org/articles/90006/elife-90006-fig2-data3-v2.xlsx
-
Figure 2—source data 4
Related to Figure 2H.
- https://cdn.elifesciences.org/articles/90006/elife-90006-fig2-data4-v2.xlsx
-
Figure 2—source data 5
Related to Figure 2N.
- https://cdn.elifesciences.org/articles/90006/elife-90006-fig2-data5-v2.xlsx
Figure 2—figure supplement 1
Itgb1 is required for normal islet architecture.
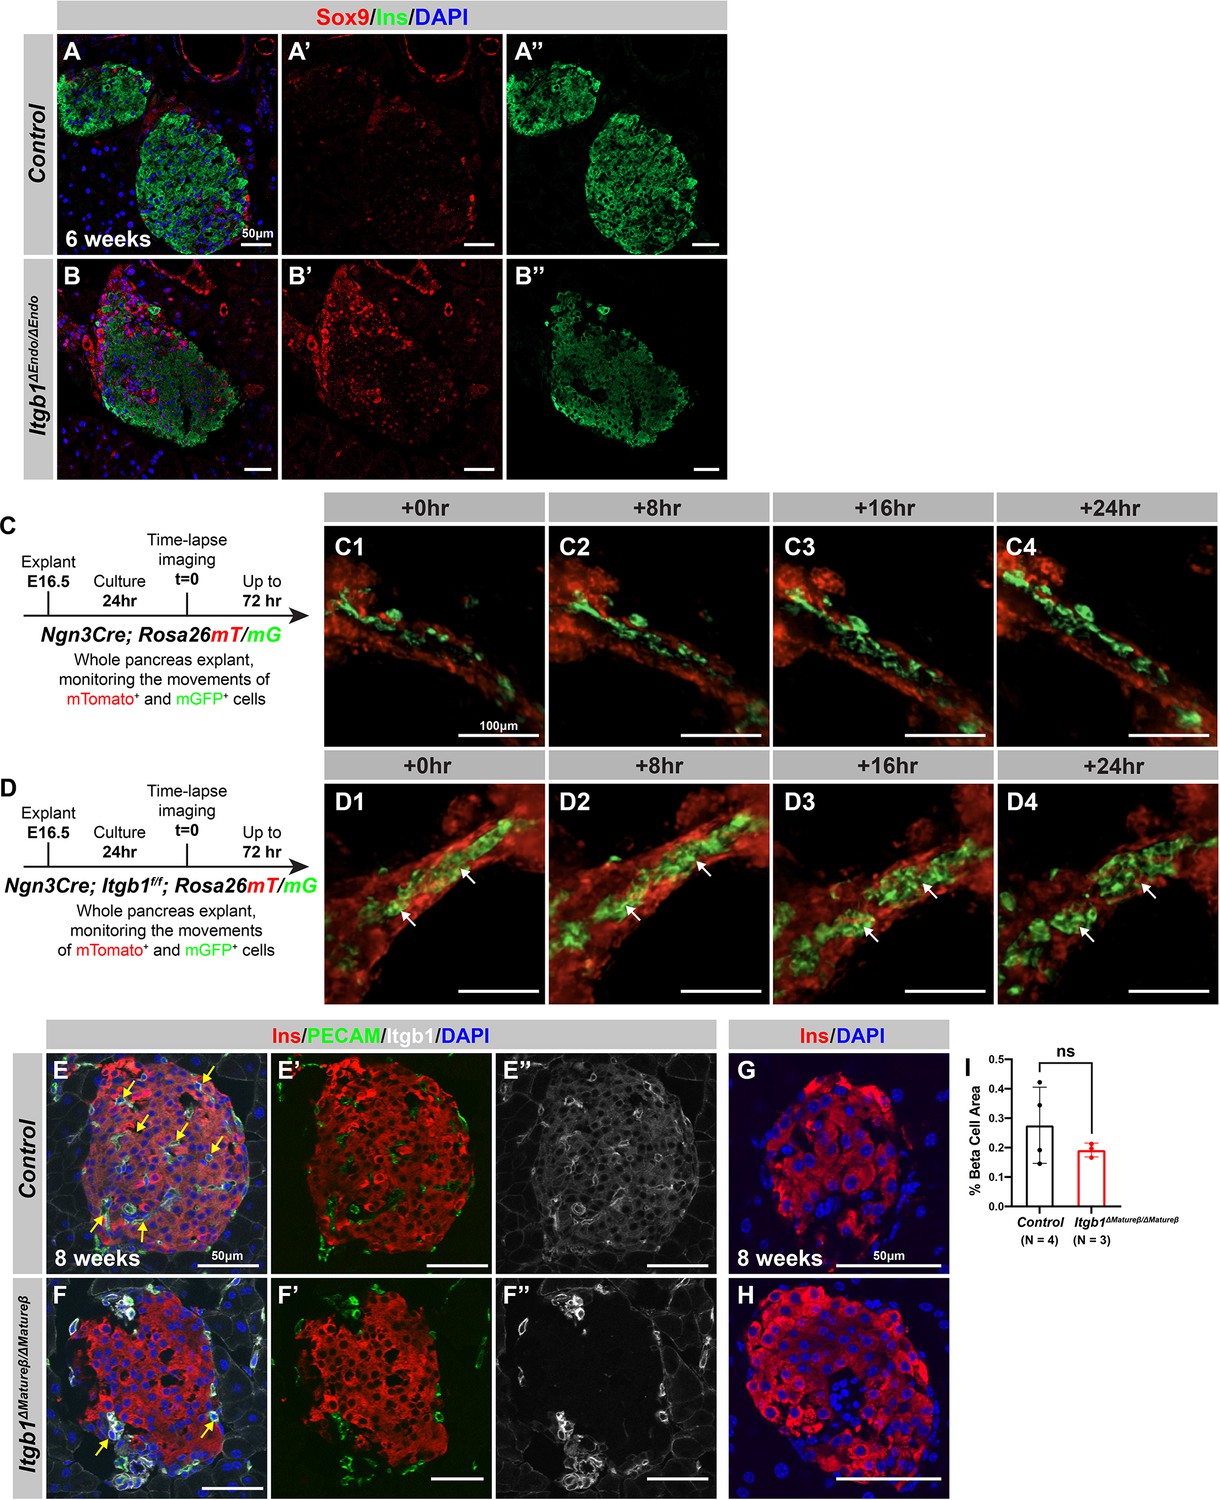
(A–B) Immunofluorescence staining for Sox9, Ins, and DAPI on 6-week-old (A) control and (B) Itgb1ΔEndo/ΔEndo pancreas sections. The individual channels for Sox9 and Ins are displayed in panels (A' and A"), and (B' and B"), respectively. In the Itgb1ΔEndo/ΔEndo islets, Sox9-positive ductal cells were observed throughout the sections (B’). (C–D) Schematic of the time-lapse confocal microscope imaging of endocrine progenitor cell behaviors in E16.5 embryonic pancreas explants. The first 24 hr were monitored to observe cell movement in (C1–C4) control and (D1–D4) Itgb1ΔEndo/ΔEndo pancreas explants. White arrows indicate prematurely clustered islets in Itgb1ΔEndo/ΔEndo explants. (E–H) Immunofluorescence staining for Ins, PECAM, Itgb1, and DAPI on 8-week-old (E, G) control and (F, H) Itgb1ΔMatureβ/ΔMatureβ pancreas sections. Individual channels are displayed as Ins/PECAM in (E’, F’), and Itgb1 in (E”, F”). In Itgb1ΔMatureβ/ΔMatureβ islets the presence of Itgb1 and vasculature in the islet is abolished. The overall size and insulin expression are not altered in the Itgb1ΔMatureβ/ΔMatureβ islets. (I) Quantification of total islet area based on morphometric analysis of 8-week-old control and Itgb1ΔMatureβ/ΔMatureβ pancreas sections. Note no significant differences in islet size were observed between the two groups. Ins, insulin; PECAM, platelet endothelial cell adhesion molecule-1; DAPI, 4’,6-diamidino-2-phenylindole; E16.5, embryonic day 16.5. Data are shown as mean ± SEM.
-
Figure 2—figure supplement 1—source data 1
Related to Figure 2—figure supplement 1I.
- https://cdn.elifesciences.org/articles/90006/elife-90006-fig2-figsupp1-data1-v2.xlsx
Figure 2—figure supplement 2

Itgb1 controls cytoskeleton regulation and organization in islets.
(A) Schematic of experimental design for in vitro aggregation assay. (B) Quantification of aggregate size after 48 hr incubation with or without extracellular matrix (ECM) in control and Itgb1ΔEndo/ΔEndo endocrine progenitors. (C–F) Fluorescence images of mGFP+ endocrine progenitor aggregates after 48 hr culture. mGFP+ control endocrine progenitors clustered (C) without ECM but remained single cells (D) with ECM after 48 hr. Alternatively, Itgb1ΔEndo/ΔEndo endocrine progenitors clustered (E) without ECM or (F) with ECM after 48 hr. (G–J) Airyscan super-resolution three-dimensional (3D) projection and cut-view images depict immunofluorescence staining for Ins and F-actin on 8-week-old control and Itgb1ΔEndo/ΔEndo pancreas sections. The 3D images (G–H) and cut-view images (I–J) also demonstrated hexagonal cell shapes and increased F-actin assembly in the Itgb1ΔEndo/ΔEndo islets. Ins, insulin; PECAM, platelet endothelial cell adhesion molecule-1. Data are shown as mean ± SEM. ***p<0.001.
-
Figure 2—figure supplement 2—source data 1
Related to Figure 2—figure supplement 2B.
- https://cdn.elifesciences.org/articles/90006/elife-90006-fig2-figsupp2-data1-v2.xlsx
Figure 3 with 1 supplement
Ctnna1-mediated cell-cell adhesion is required for normal islet morphology and endocrine cell aggregation.
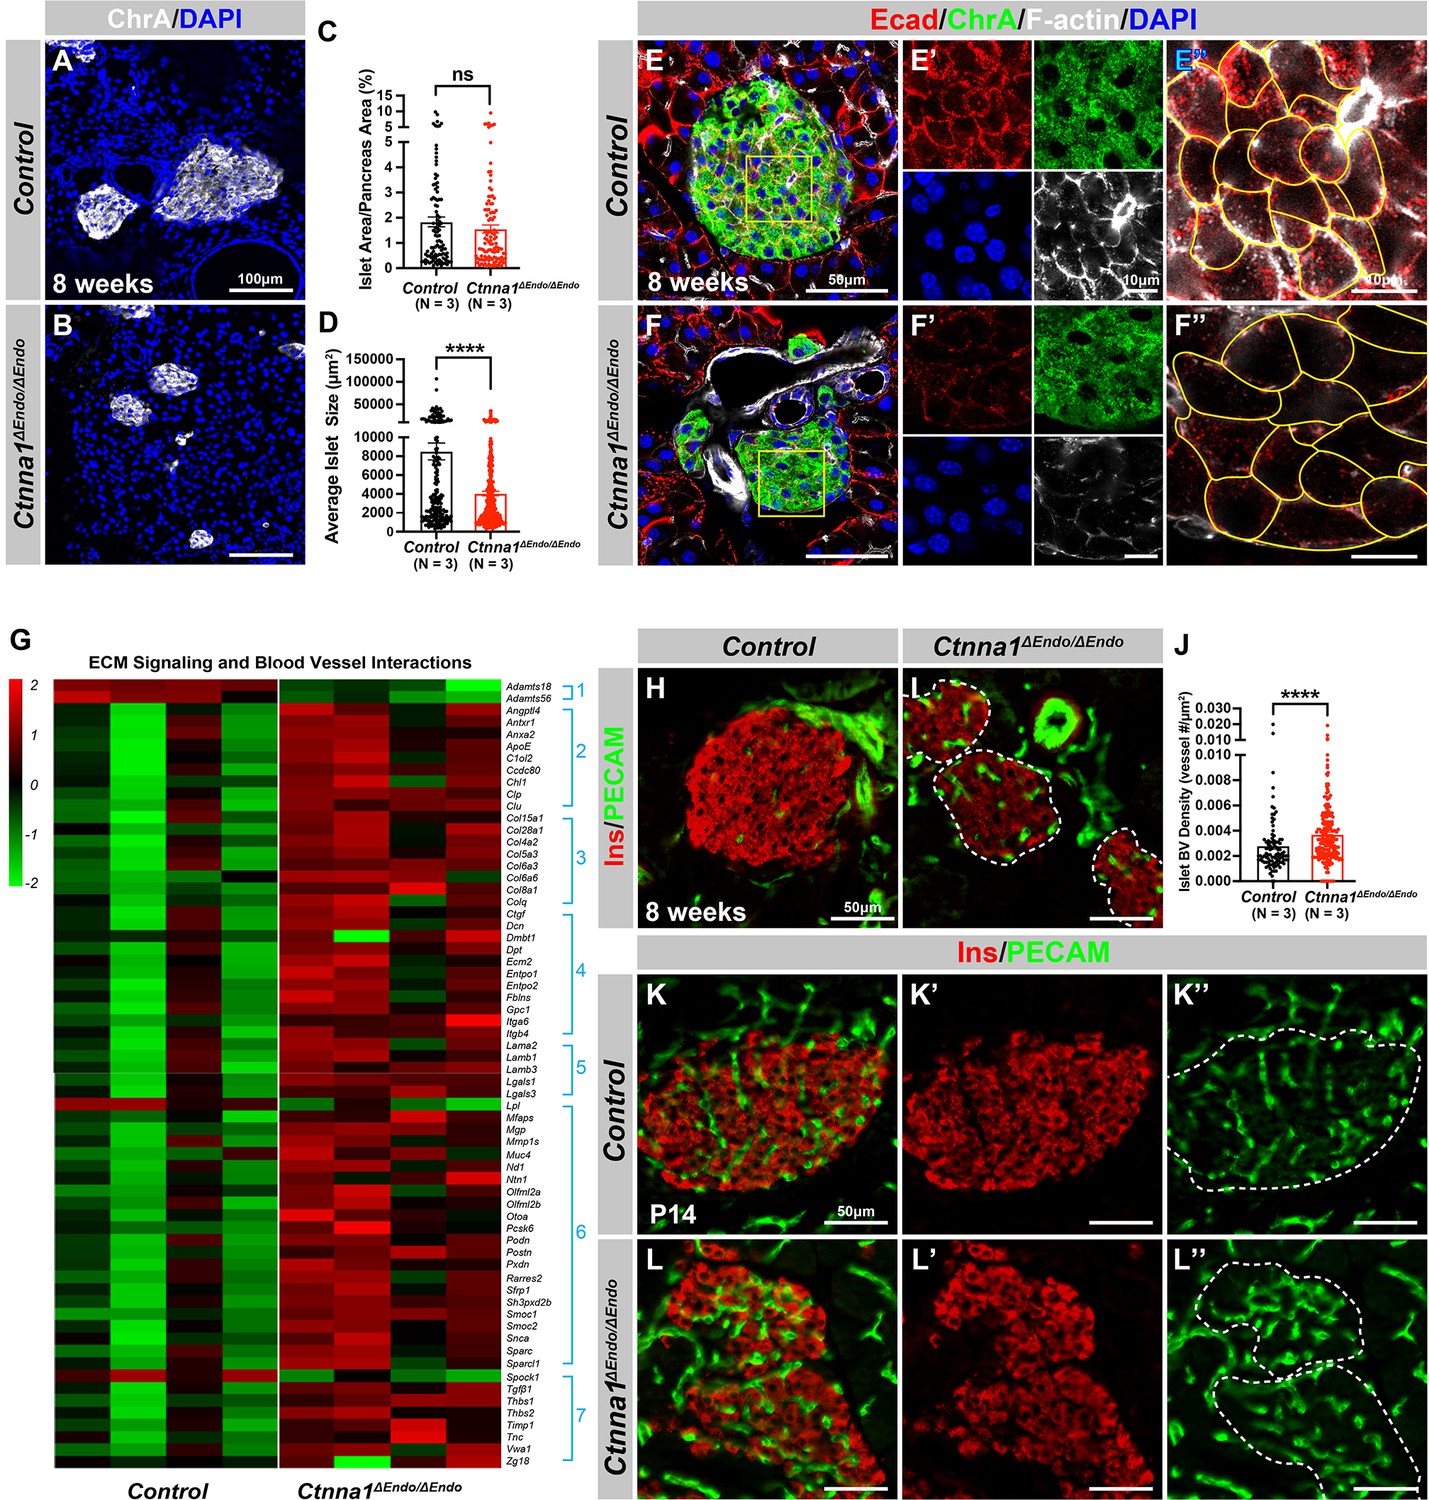
(A–B) Immunofluorescence staining for ChrA and DAPI in 8-week-old pancreas sections showing smaller islet sizes in Ctnna1ΔEndo/ΔEndo mice. (C–D) Quantification of (C) the percentage of islet area in pancreas area and (D) average islet size based on ChrA staining on 8-week-old control and Ctnna1ΔEndo/ΔEndo pancreas sections. (E–F) Airyscan images of immunofluorescence staining for Ecad, ChrA, F-actin, and DAPI for control and Ctnna1ΔEndo/ΔEndo pancreas sections. Fields demarcated by yellow boxes are shown at higher magnification with individual color channels in (E’–F’) middle panels, showing reduced expression of Ecad and F-actin in Ctnna1ΔEndo/ΔEndo islets. Individual endocrine cell shape is delineated by yellow lines in (E”–F”), demonstrating the enlarged endocrine cell sizes in the islets of Ctnna1ΔEndo/ΔEndo mice. (G) Heatmap showing genes for extracellular matrix (ECM) signaling and blood vessel interactions are up-regulated in Ctnna1ΔEndo/ΔEndo islets at 8 weeks of age. Groups 1–7 represent gene ontologies of: (1) metalloproteases, (2) vascular adhesion, (3) collagens, (4) integrins, (5) laminins, (6) glycoproteins, and (7) thrombospondins. (H–I) Immunofluorescence staining of Ins and PECAM on 8-week-old control and Ctnna1ΔEndo/ΔEndo pancreas sections. (J) Quantification of islet blood vessel density based on Ins and PECAM staining on 8-week-old control and Ctnna1ΔEndo/ΔEndo pancreas sections. (K–L) Immunofluorescence staining of Ins and PECAM on P14 control and Ctnna1ΔEndo/ΔEndo pancreas sections showing increased vasculature in Ctnna1ΔEndo/ΔEndo islets. Islet area is outlined by dotted lines. ChrA, chromogranin A; DAPI, 4’,6-diamidino-2-phenylindole; Ecad, E-cadherin; Ins, insulin; PECAM, platelet endothelial cell adhesion molecule-1; P14, postnatal day 14. Data are shown as mean ± SEM. ****p<0.0001.
-
Figure 3—source data 1
Related to Figure 3C.
- https://cdn.elifesciences.org/articles/90006/elife-90006-fig3-data1-v2.xlsx
-
Figure 3—source data 2
Related to Figure 3D.
- https://cdn.elifesciences.org/articles/90006/elife-90006-fig3-data2-v2.xlsx
-
Figure 3—source data 3
Related to Figure 3J.
- https://cdn.elifesciences.org/articles/90006/elife-90006-fig3-data3-v2.xlsx
Figure 3—figure supplement 1
Ctnna1-deleted pancreatic islet endocrine cells display cytoskeleton anomalies.
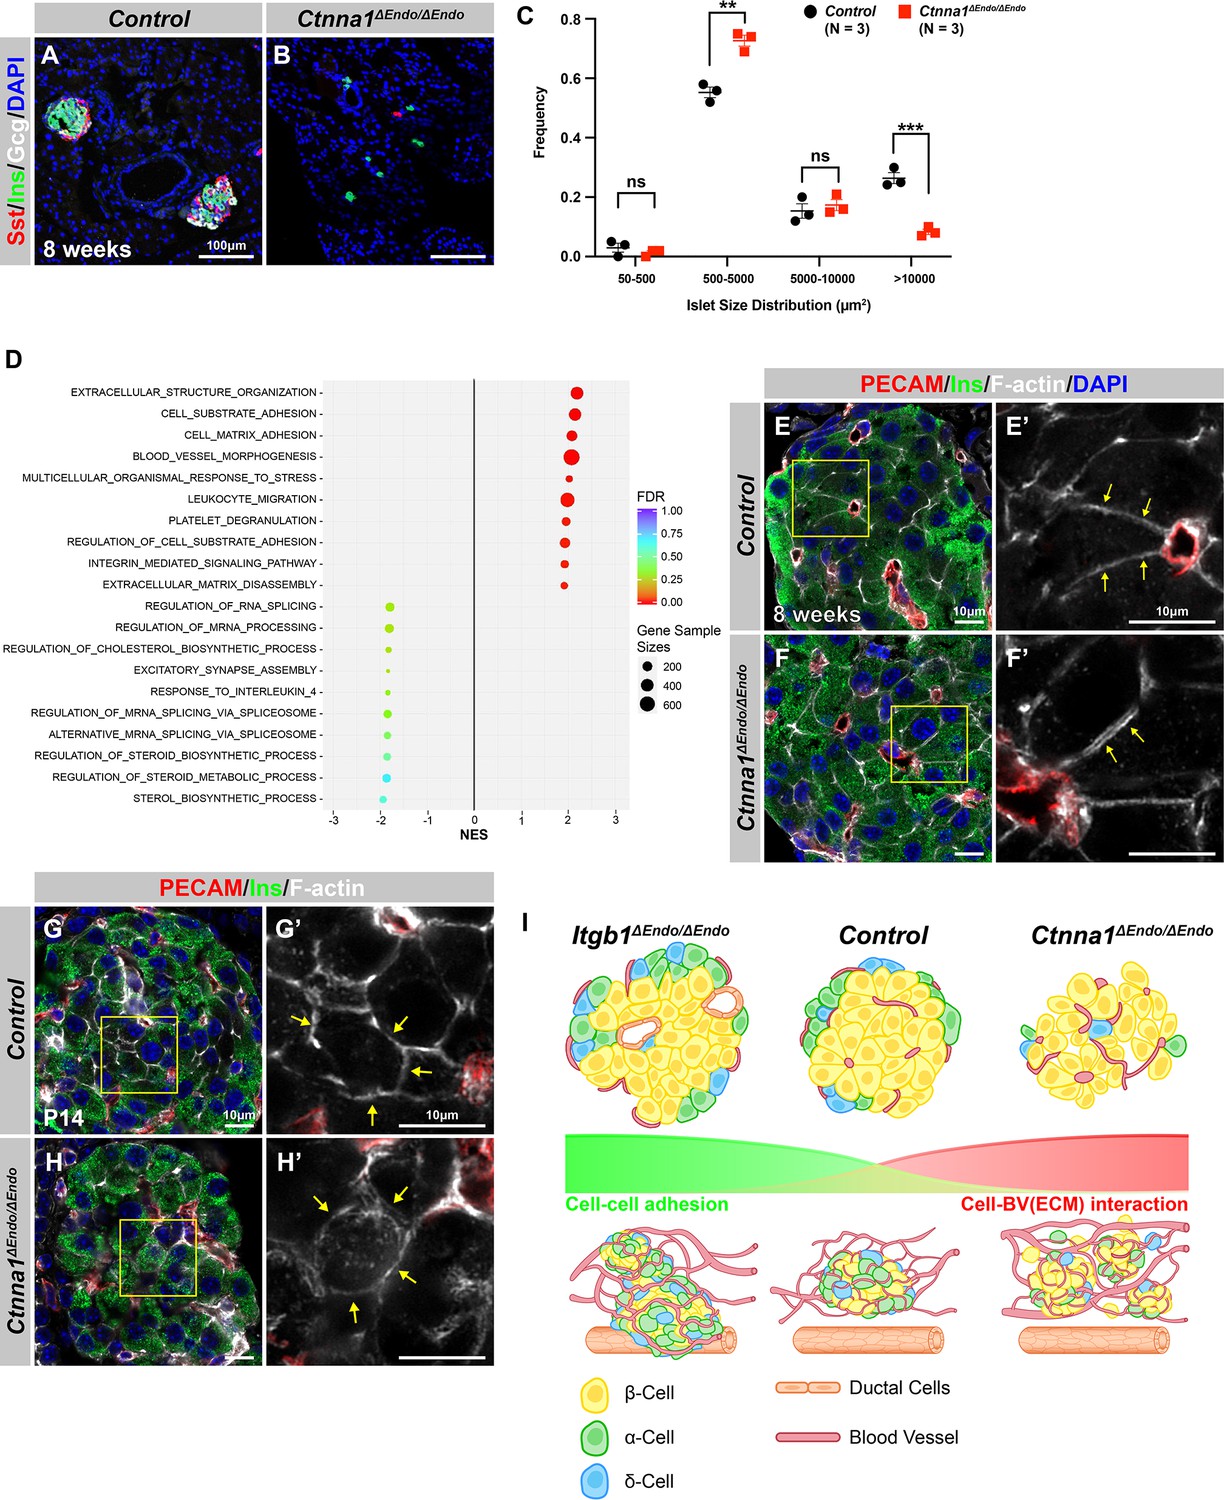
(A–B) Immunofluorescence staining for Sst, Ins, and DAPI on pancreas sections from 8-week-old mice. In Ctnna1ΔEndo/ΔEndo mice, the islet clusters appear much smaller compared to the control mice. (C) Quantification of islet size distribution based on chromogranin A (ChrA) staining for 8-week-old control and Ctnna1ΔEndo/ΔEndo pancreas sections. The islet size quantification analysis excluded endocrine cell clusters with fewer than five cells. (D) Gene-set enrichment analysis of the differentially expressed genes, indicating top enriched pathways for control versus Ctnna1ΔEndo/ΔEndo islets at 8 weeks of age. Gene sample sizes and false discovery rates (FDRs) are indicated by the size and color of the dots. (E–F) Three-dimensional (3D) Airyscan images of immunofluorescence staining for PECAM, Ins, and F-actin on 8-week-old control and Ctnna1ΔEndo/ΔEndo pancreas sections. Fields demarcated by yellow boxes in (E, F) are shown at higher magnification in (E’, F’). The images showed the separation of F-actin between Ins-expressing endocrine cells. This separation is highlighted by the yellow arrows in (F’). (G–H) Airyscan images of immunofluorescence staining for PECAM, Ins, and F-actin in P14 control and Ctnna1ΔEndo/ΔEndo pancreas sections. In control islets (G'), the F-actin assemblies appear condensed, as indicated by the yellow arrows. However, in Ctnna1ΔEndo/ΔEndo islets (H'), the same F-actin assemblies appear to be diffused within the insulin-expressing cells. (I) Graphical summary showing cell-cell adhesion and cell-blood vessel (BV) interaction differences observed in Itgb1ΔEndo/ΔEndo and Ctnna1ΔEndo/ΔEndo islets. PECAM, platelet endothelial cell adhesion molecule-1; Ins, insulin; P14, postnatal day 14; BV, blood vessels. Data are shown as mean ± SEM. **p<0.01 and ***p<0.001.
-
Figure 3—figure supplement 1—source data 1
Related to Figure 3—figure supplement 1C.
- https://cdn.elifesciences.org/articles/90006/elife-90006-fig3-figsupp1-data1-v2.xlsx
Figure 4 with 1 supplement
Ctnna1 is required for proper islet functionality and α-cell survival.
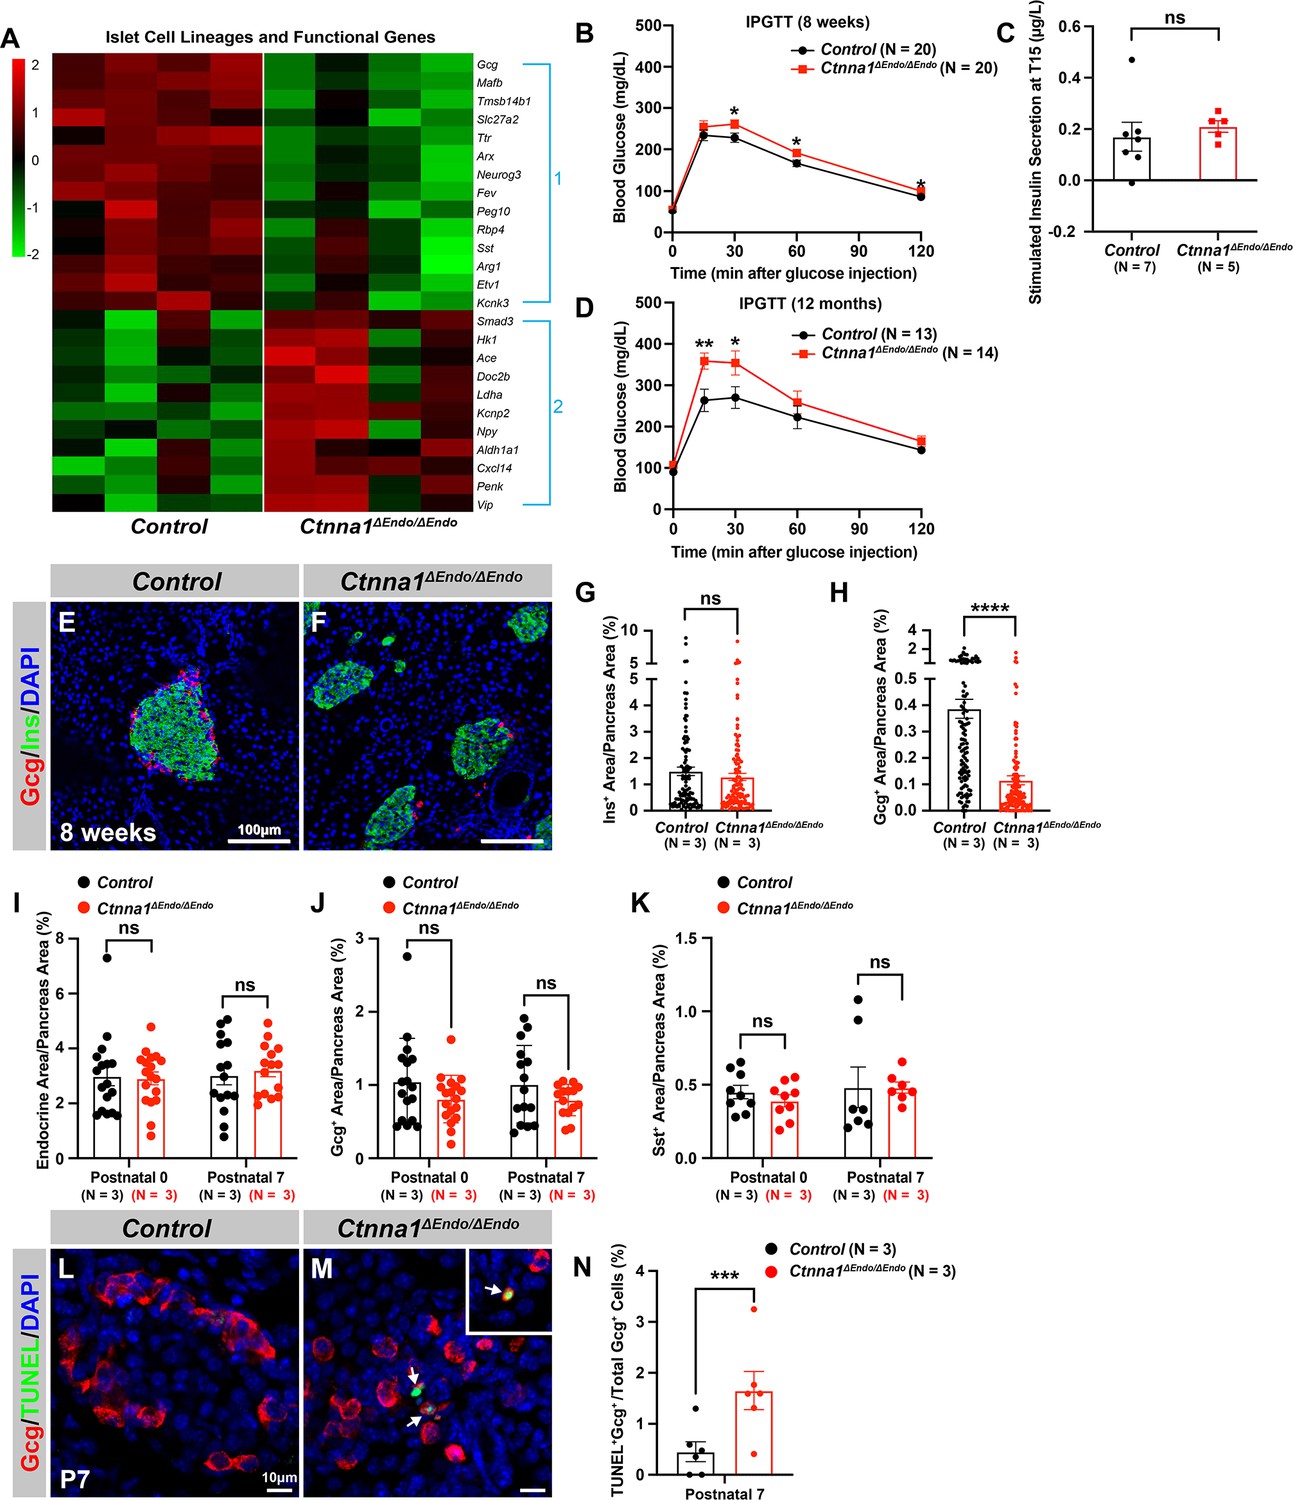
(A) Heatmap showing the top up-regulated (Group 1) and down-regulated (Group 2) endocrine cell lineage and functional genes in Ctnna1ΔEndo/ΔEndo islets from 8-week-old mice. (B–D) The figure shows the results of the intraperitoneal glucose tolerance test (B, D) and stimulated insulin secretion assay (C) performed on control and Ctnna1ΔEndo/ΔEndo mice at 8 weeks of age (B, C) and 12 months of age (D). The Ctnna1ΔEndo/ΔEndo mice exhibited glucose intolerance, but no detectable difference in insulin secretion compared to control littermates. The Ctnna1ΔEndo/ΔEndo mice are glucose intolerant with non-detectable insulin secretion defects. (E–F) Immunofluorescence staining for Gcg, Ins, and DAPI on 8-week-old (E) control and (F) Ctnna1ΔEndo/ΔEndo pancreas sections showing a reduction of α-cells. (G–H) Quantification of (G) Ins+ and (H) Gcg+ area relative to total pancreas area in 8-week-old control and Ctnna1ΔEndo/ΔEndo pancreas sections. (I–K) Quantification of endocrine cell area (I), Gcg+ (J), and Sst+ (K) relative to total pancreas area in control and Ctnna1ΔEndo/ΔEndo pancreas sections at P0 and P7. Note that there was no significant difference observed between the control and Ctnna1ΔEndo/ΔEndo pancreas sections at P0 and P7. (L–N) Immunofluorescence staining for Gcg, TUNEL, and DAPI on P7 control and Ctnna1ΔEndo/ΔEndo pancreas sections. White arrows indicate TUNEL+/Gcg+ cells. The percentage of TUNEL+/Gcg+ co-positive cells relative to total Gcg+ cell numbers in P7 control and Ctnna1ΔEndo/ΔEndo islets is shown in panel (N), and compared to controls, the Ctnna1ΔEndo/ΔEndo islets exhibited significantly more TUNEL+/Gcg+ cells at P7. Gcg, glucagon; Ins, insulin; DAPI, 4’,6-diamidino-2-phenylindole; IPGTT, intraperitoneal glucose tolerance test; TUNEL, terminal deoxynucleotidyl transferase dUTP nick end labeling; P0, postnatal day 0; P7, postnatal day 7. Data are shown as mean ± SEM. *p<0.05, **p<0.01, ***p<0.001, ****p<0.0001.
-
Figure 4—source data 1
Related to Figure 4B.
- https://cdn.elifesciences.org/articles/90006/elife-90006-fig4-data1-v2.xlsx
-
Figure 4—source data 2
Related to Figure 4C.
- https://cdn.elifesciences.org/articles/90006/elife-90006-fig4-data2-v2.xlsx
-
Figure 4—source data 3
Related to Figure 4D.
- https://cdn.elifesciences.org/articles/90006/elife-90006-fig4-data3-v2.xlsx
-
Figure 4—source data 4
Related to Figure 4G.
- https://cdn.elifesciences.org/articles/90006/elife-90006-fig4-data4-v2.xlsx
-
Figure 4—source data 5
Related to Figure 4H.
- https://cdn.elifesciences.org/articles/90006/elife-90006-fig4-data5-v2.xlsx
-
Figure 4—source data 6
Related to Figure 4I.
- https://cdn.elifesciences.org/articles/90006/elife-90006-fig4-data6-v2.xlsx
-
Figure 4—source data 7
Related to Figure 4J.
- https://cdn.elifesciences.org/articles/90006/elife-90006-fig4-data7-v2.xlsx
-
Figure 4—source data 8
Related to Figure 4K.
- https://cdn.elifesciences.org/articles/90006/elife-90006-fig4-data8-v2.xlsx
-
Figure 4—source data 9
Related to Figure 4N.
- https://cdn.elifesciences.org/articles/90006/elife-90006-fig4-data9-v2.xlsx
Figure 4—figure supplement 1
Ctnna1 is required for proper islet functionality and normal islet aggregation.
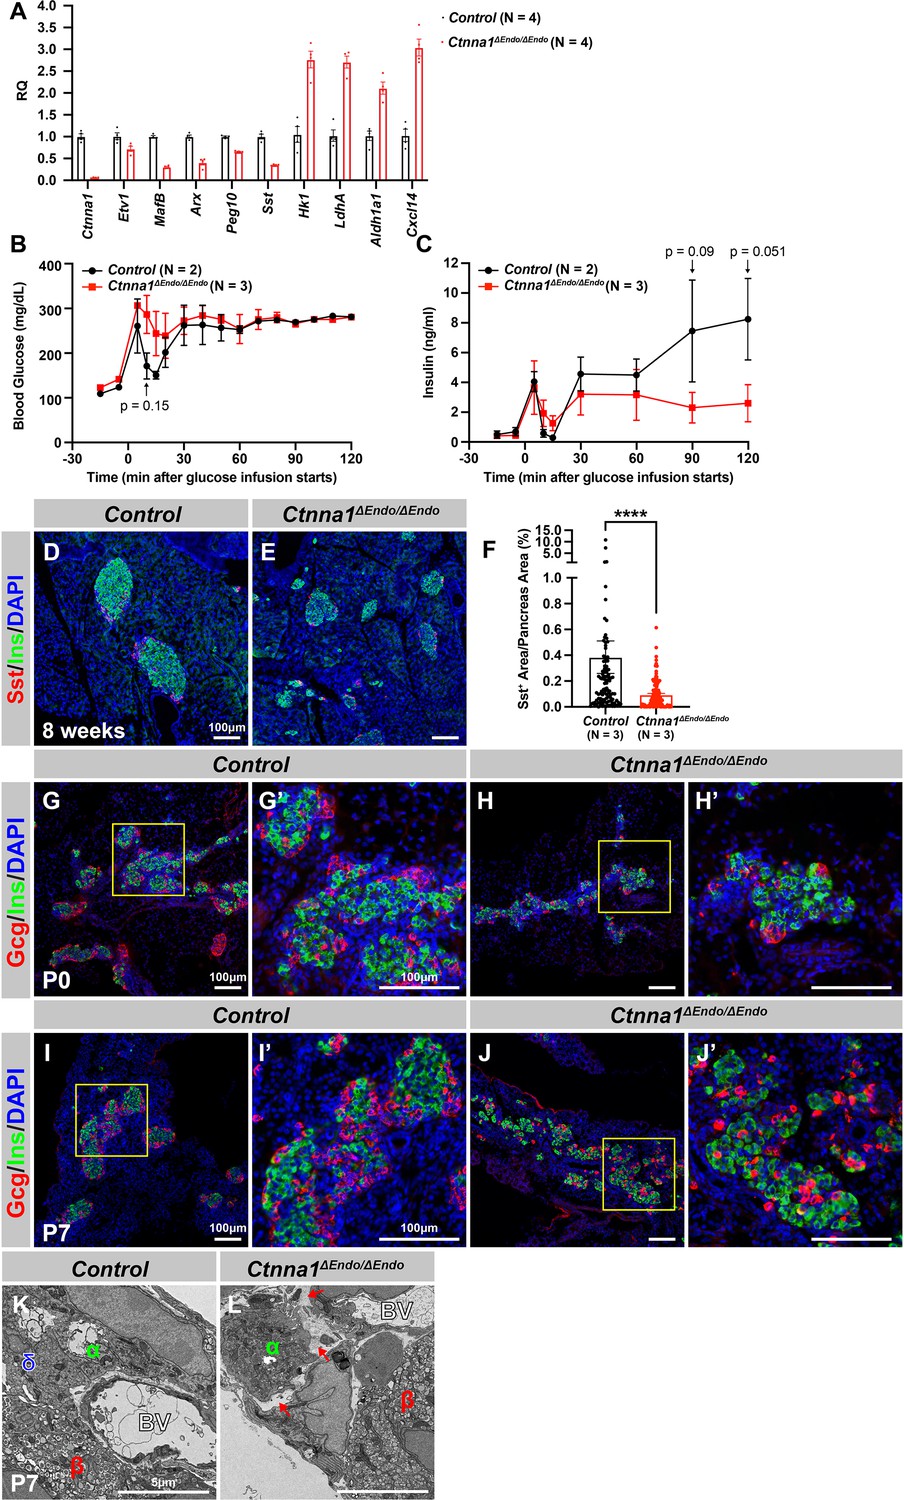
(A) Quantification of selected differentially expressed genes involved in islet functional maturation using real-time qPCR analysis in Ctnna1ΔEndo/ΔEndo islets and compared to controls. The relative quantification of gene expression levels was determined using the 2-∆∆Ct method and is reported as an RQ value relative to the control group. The genes selected for validation were chosen based on their known roles in islet function and maturation. (B–C) Whole-blood glucose (B; mg/dL) and insulin secretion (C; ng/ml) during 120 min in euglycemic clamp experiments in 5-hr-fasted, surgically catheterized control and Ctnna1ΔEndo/ΔEndo mice at 8 weeks of age. At 5–15 min after glucose infusion, Ctnna1ΔEndo/ΔEndo mice showed slightly elevated glucose levels compared to controls (p=0.15). The amount of insulin secretion in Ctnna1ΔEndo/ΔEndo mice decreased at 90 and 120 min after glucose infusion (p=0.09 and 0.051, respectively). These results suggest that Ctnna1ΔEndo/ΔEndo mice may have impaired glucose metabolism and insulin secretion. (D–E) Immunofluorescence staining for Sst (red), Ins (green), and DAPI (blue) in pancreas sections of 8-week-old control and Ctnna1ΔEndo/ΔEndo mice. (F) Quantification of the Sst+ area relative to the total pancreas area shows a decrease in the number of Sst+ cells in Ctnna1ΔEndo/ΔEndo mice compared with their control. (G–J) Immunofluorescence staining for Gcg (red), Ins (green), and DAPI (blue) in pancreas sections of P0 (G and H) and P7 (I and J) control and Ctnna1ΔEndo/ΔEndo mice. The fields demarcated by yellow boxes in (G–J) are shown at higher magnification in (G’–J’). (K–L) Transmission electron microscope images of P7 control (K) and Ctnna1ΔEndo/ΔEndo (L) endocrine areas. Red arrows indicate detachment of an α-cell from an islet aggregate. RQ, relative quantification; Sst, somatostatin; Gcg, glucagon; Ins, insulin; DAPI, 4’,6-diamidino-2-phenylindole; P0, postnatal day 0; P7, postnatal day 7; BV, blood vessels. Data are shown as mean ± SEM. *p<0.05, ****p<0.0001.
-
Figure 4—figure supplement 1—source data 1
Related to Figure 4—figure supplement 1A.
- https://cdn.elifesciences.org/articles/90006/elife-90006-fig4-figsupp1-data1-v2.xlsx
-
Figure 4—figure supplement 1—source data 2
Related to Figure 4—figure supplement 1B.
- https://cdn.elifesciences.org/articles/90006/elife-90006-fig4-figsupp1-data2-v2.xlsx
-
Figure 4—figure supplement 1—source data 3
Related to Figure 4—figure supplement 1C.
- https://cdn.elifesciences.org/articles/90006/elife-90006-fig4-figsupp1-data3-v2.xlsx
-
Figure 4—figure supplement 1—source data 4
Related to Figure 4—figure supplement 1F.
- https://cdn.elifesciences.org/articles/90006/elife-90006-fig4-figsupp1-data4-v2.xlsx
Figure 5 with 1 supplement
Loss of Ctnna1 in α- and β-cells leads to disrupted islet architecture.
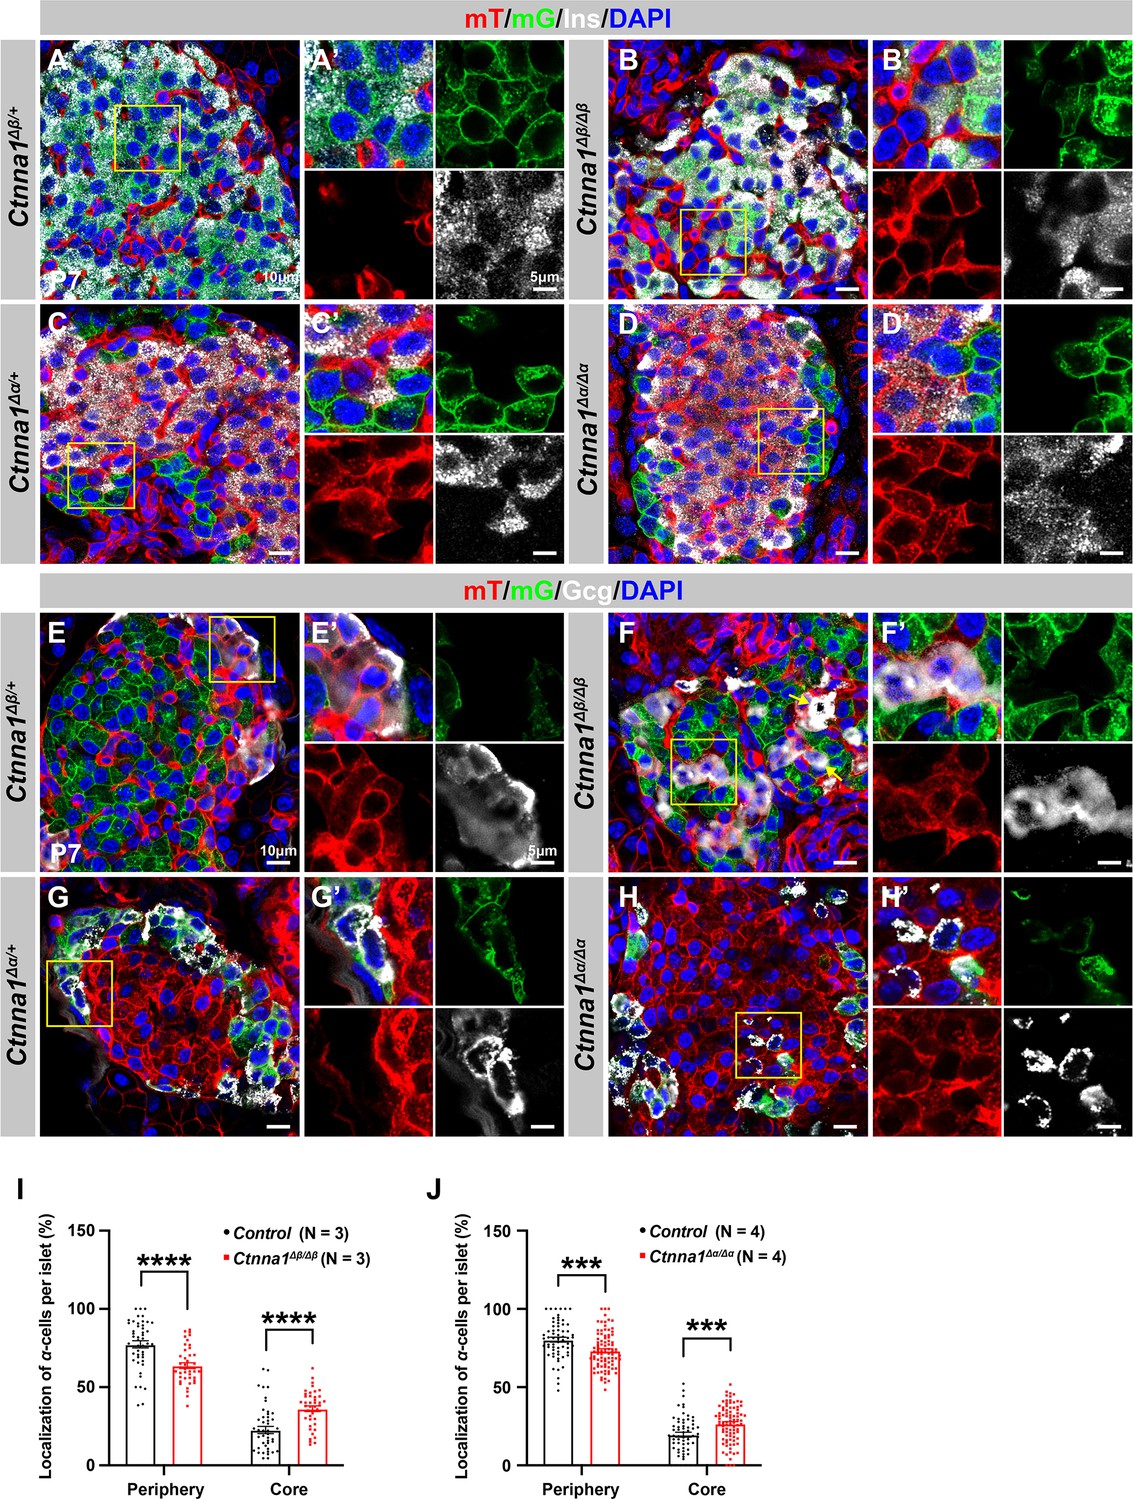
(A–H) Airyscan images of immunofluorescence staining for Ins (A–D), Gcg (E–H), and DAPI in pancreas sections of P7 mT/mG reporter mice: Heterozygous Ctnna1Δβ/+ (A, E), homozygous Ctnna1Δβ/Δβ (B, F), heterozygous Ctnna1Δα/+ (C, G), and homozygous Ctnna1Δα/Δα (D, H). The yellow arrows in (F) showing α-cells in the islet core in Ctnna1Δβ/Δβ mice. The fields demarcated by yellow boxes are shown at higher magnification with individual color channels in the side panels. (I–J) Quantification of α-cell localization in the islets of Ctnna1Δβ/Δβ (I) and Ctnna1Δα/Δα (J) mice. Compared to controls, Ctnna1Δβ/Δβ and Ctnna1Δα/Δα mice exhibit a reduction in peripherally located α-cells and an increase in core-located α-cells. These results suggest that the loss of Ctnna1 in α- and β-cells affects the organization and localization of α-cells within the islet. Gcg, glucagon; DAPI, 4’,6-diamidino-2-phenylindole; Ins, insulin; P7, postnatal day 7. Data are shown as mean ± SEM. ***p<0.001, ****p<0.0001.
-
Figure 5—source data 1
Related to Figure 5I.
- https://cdn.elifesciences.org/articles/90006/elife-90006-fig5-data1-v2.xlsx
-
Figure 5—source data 2
Related to Figure 5J.
- https://cdn.elifesciences.org/articles/90006/elife-90006-fig5-data2-v2.xlsx
Figure 5—figure supplement 1
Differential cell-cell adhesion in endocrine cells.
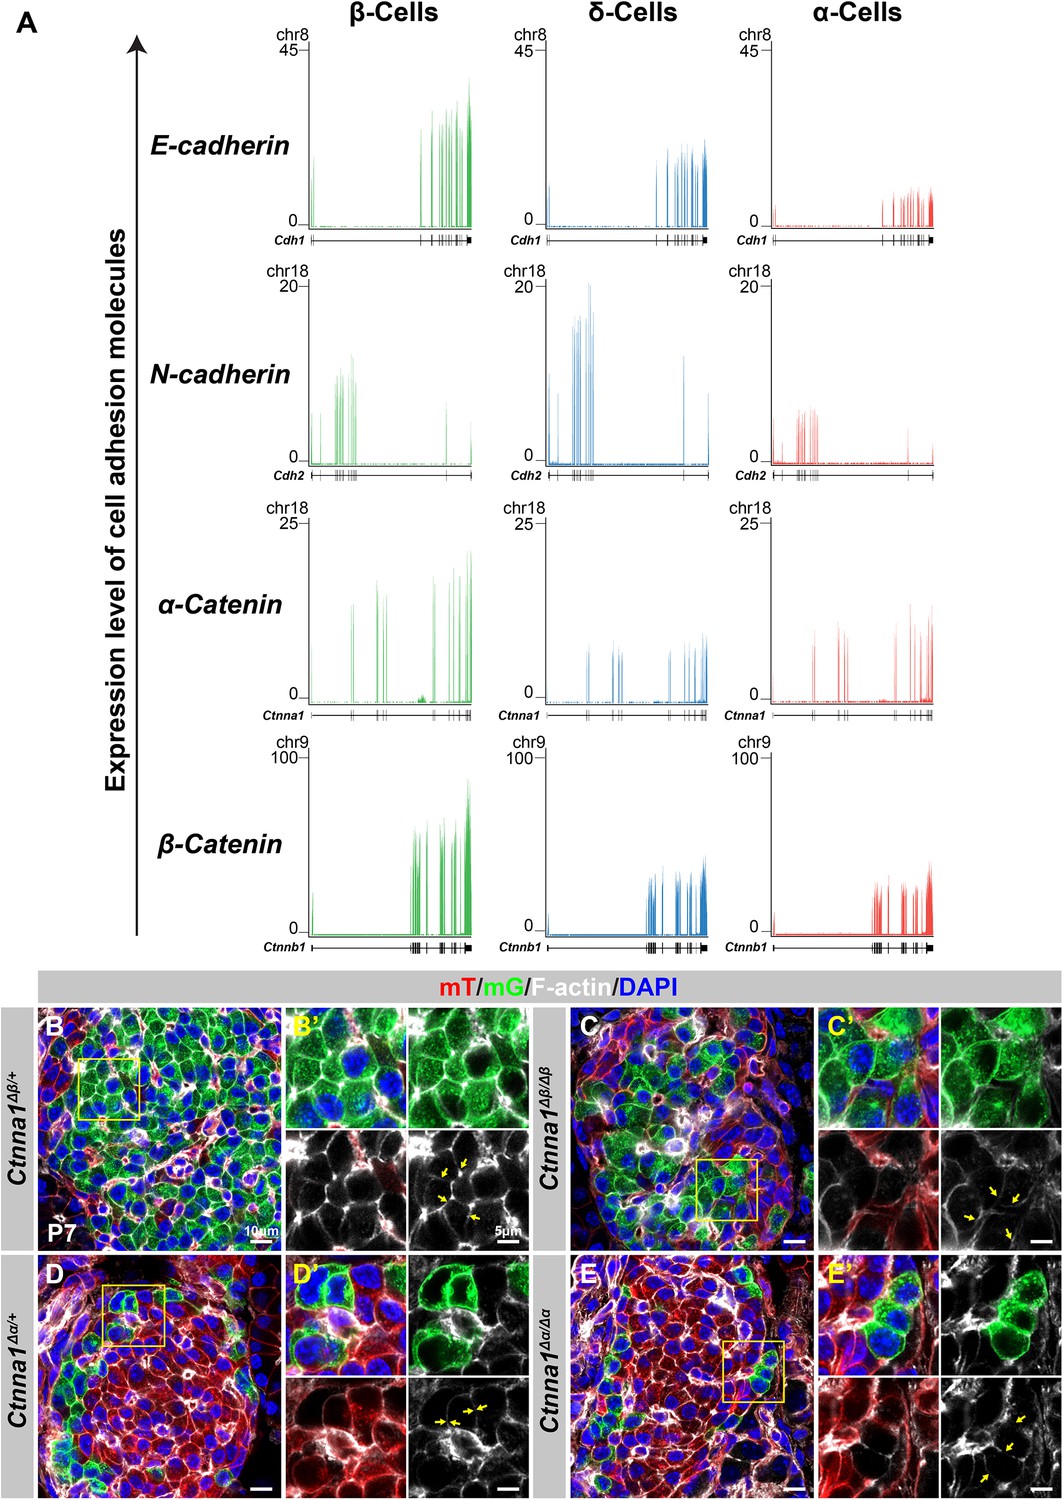
(A) Genome viewer plots comparing expression levels of adhesion molecules in α-, β-, and δ- cell transcriptomes (DiGruccio et al., 2016). (B–E) Airyscan images of immunofluorescence staining of P7 mT/mG reporter mice stained for F-actin and DAPI in (B) heterozygous Ctnna1Δβ/+, (C) homozygous Ctnna1Δβ/Δβ, (D) heterozygous Ctnna1Δα/+, and (E) homozygous Ctnna1Δα/Δα mice. Fields demarcated by yellow boxes in (B–E) are shown at higher magnification with individual color channels in (B’–E’) side panels. Yellow arrows indicate expression of F-actin in (B, C) β- (D, E) and α-cells. DAPI, 4’,6-diamidino-2-phenylindole; P7, postnatal day 7.
Figure 6 with 1 supplement
Disruption of cell-extracellular matrix (ECM) and/or cell-cell adhesion results in abnormal islet vascular architecture, endocrine cell aggregation, and decreased expression of β-cell maturation markers at postnatal day 7.
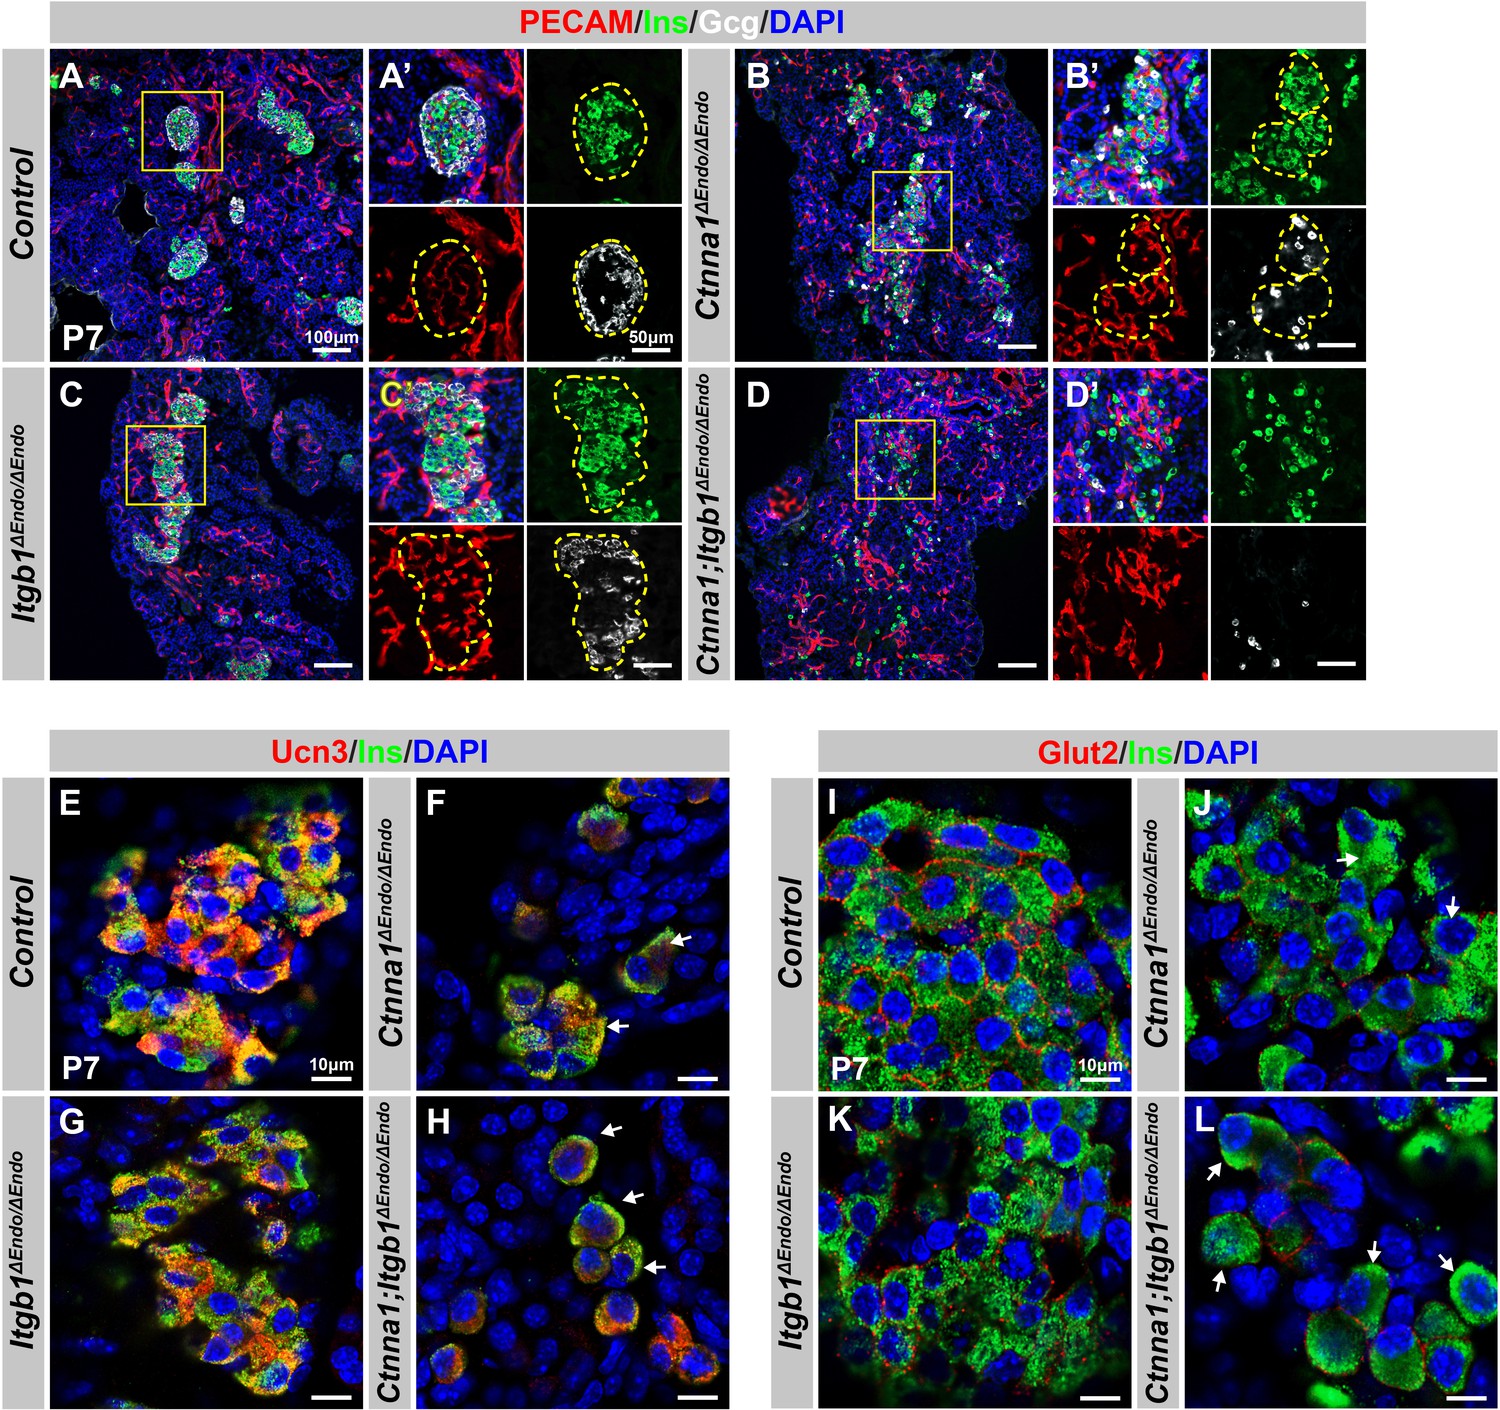
(A–D) Immunofluorescence staining of PECAM, Ins, Gcg, and DAPI in P7 (A) control, (B) Ctnna1ΔEndo/ΔEndo, (C) Itgb1ΔEndo/ΔEndo, and (D) Ctnna1; Itgb1ΔEndo/ΔEndo mice. Fields demarcated by yellow boxes in (A–D) are shown at higher magnification in (A’–D’) side panels. Individual islet shape is outlined by dashed yellow lines in (A’–C’). Endocrine cells are suspended and scattered throughout the pancreas of Ctnna1; Itgb1ΔEndo/ΔEndo mice. (E–L) Airyscan images of immunofluorescence staining for Ucn3, Glut2, Ins, and DAPI in P7 (E, I) control, (F, J) Ctnna1ΔEndo/ΔEndo, (G, K) Itgb1ΔEndo/ΔEndo, and (H, L) Ctnna1; Itgb1ΔEndo/ΔEndo mice. Arrows indicate reduced expression of Ucn3 or Glut2 in β-cells of the mutant mice. PECAM, platelet endothelial cell adhesion molecule-1; Ins, insulin; Gcg, glucagon; DAPI, 4’,6-diamidino-2-phenylindole; Ucn3, urocortin 3; Glut2, Slc2a2; P7, postnatal day 7.
Figure 6—figure supplement 1
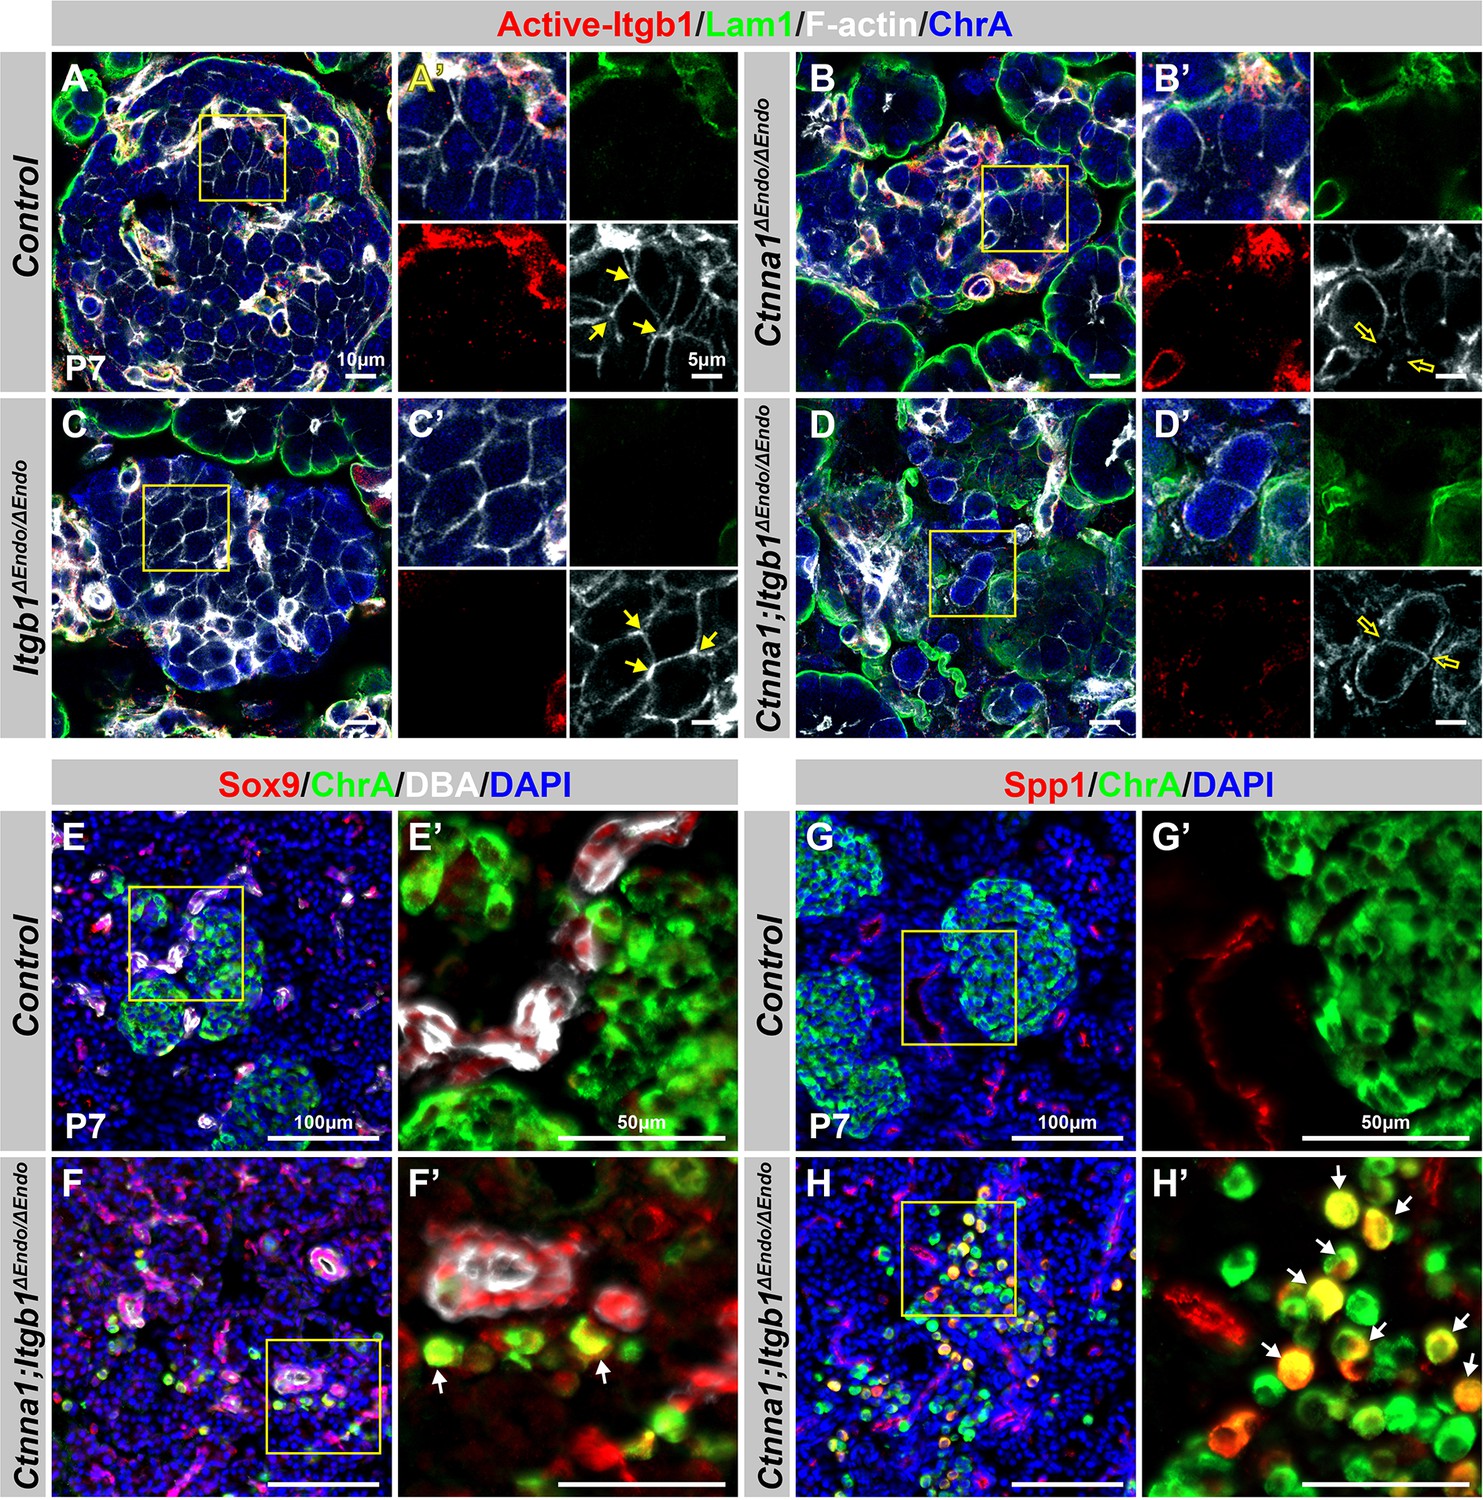
Aberrant endocrine cell clustering and up-regulation of islet progenitor markers upon disruption of cell adhesion.
Related to Figure 6. (A–D) Airyscan images showing immunofluorescence staining for active-Itgb1, Lam1, F-actin, and ChrA in pancreas sections from (A) control, (B) Ctnna1ΔEndo/ΔEndo, (C) Itgb1ΔEndo/ΔEndo, and (D) Ctnna1; Itgb1ΔEndo/ΔEndo mice at P7. The yellow boxes in (A–D) indicate the fields shown at higher magnification in (A’–D’) side panels. The yellow arrows point to F-actin expression in endocrine cells. The Ctnna1ΔEndo/ΔEndo (B’) and Ctnna1; Itgb1ΔEndo/ΔEndo (D’) islet cells exhibit a round cell shape and reduced F-actin-enriched junctional structures. (E–H) Immunofluorescence staining for endocrine cell marker ChrA (green), ductal marker DBA (white in E, F), and progenitor markers Sox9 (red in E, F) and Spp1 (red in G, H) on pancreas sections from control (E, G) and Ctnna1; Itgb1ΔEndo/ΔEndo (F, H) mice at P7. The yellow boxes in (E–H) indicate the fields shown at higher magnification in (E’–H’) side panels. Compared to controls, in which ChrA+ endocrine cells do not express progenitor markers Sox9 and Spp1 (E’ and G’), a subpopulation of ChrA+ endocrine cells in the islets of Ctnna1; Itgb1ΔEndo/ΔEndo mice exhibit up-regulated expression of Sox9 and Spp1 (yellow cells indicated by arrows in F' and H'). Lam1, laminin1; ChrA; chromogranin A; P7, postnatal day 7; DBA, Dolichos biflorus agglutinin.
Figure 7
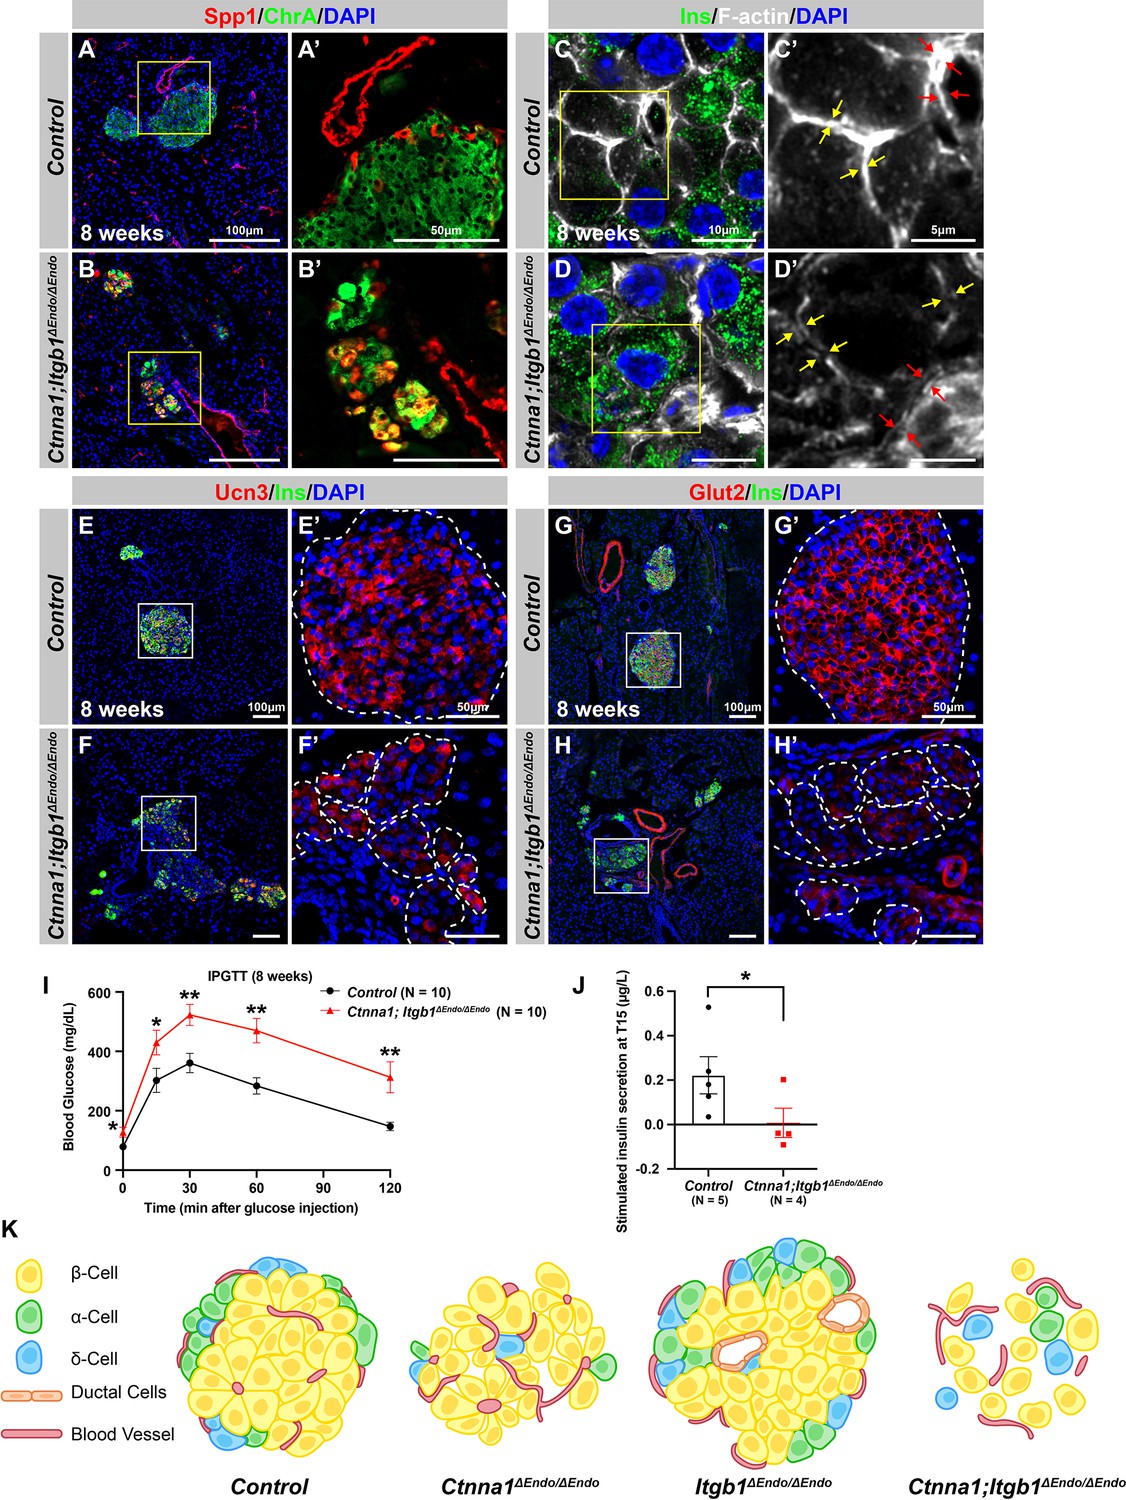
Abnormal islet aggregation, mis-regulation of β-cell maturation markers, and insulin secretion defects persist in Ctnna1; Itgb1ΔEndo/ΔEndo mice into adulthood.
(A–B) Immunofluorescence staining for endocrine cell marker ChrA and progenitor marker Spp1 on pancreas sections from control (A) and Ctnna1; Itgb1ΔEndo/ΔEndo (B) mice at 8 weeks of age. The yellow boxes in (A, B) indicate the fields shown at higher magnification in (A’, B’) side panels. In the islets of Ctnna1; Itgb1ΔEndo/ΔEndo mice, a subpopulation of ChrA+ endocrine cells expresses progenitor markers Spp1 (yellow cells in B and B’). (C–D) Airyscan images of immunofluorescence staining for Ins, F-actin, and DAPI in pancreatic sections from 8-week-old control and Ctnna1; Itgb1ΔEndo/ΔEndo mice are shown. In control islets (C, C'), the F-actin assemblies appear aligned with cell membranes and condensed in cellular junctions, as indicated by the yellow and red arrows, respectively. In contrast, diffused distribution of F-actin (red arrows in D’) and separation of F-actin assemblies (yellow arrows in D’) between Ins+ β-cells are observed in the Ctnna1; Itgb1ΔEndo/ΔEndo mice. (E–F) Immunofluorescence staining of Ucn3, Ins, and DAPI in pancreatic sections of 8-week-old (E) control and (F) Ctnna1; Itgb1ΔEndo/ΔEndo mice. Fields demarcated by white boxes in (E and F) are shown at higher magnification in (E’ and F’), and individual islet shape is outlined by dashed white lines. The reduction of Ucn3 expression persists in adult Ctnna1; Itgb1ΔEndo/ΔEndo mice. (G–H) Immunofluorescence staining of Glut2, Ins, and DAPI in 8-week-old (G) control and (H) Ctnna1; Itgb1ΔEndo/ΔEndo mouse pancreas. Fields demarcated by white boxes in (G and H) are shown at higher magnification in (G’ and H’), and individual islet shape is outlined by dashed white lines. The reduction of Glut2 expression persists in adult Ctnna1; Itgb1ΔEndo/ΔEndo mice. (I–J) Intraperitoneal glucose tolerance test was performed on 8-week-old mice (I), and glucose-stimulated insulin secretion was measured at T15 in 20- to 38-week-old mice (J) from control and Ctnna1; Itgb1ΔEndo/ΔEndo groups. Ctnna1; Itgb1ΔEndo/ΔEndo mice exhibited severe glucose intolerance and defects in insulin secretion. (K) Graphical summary of the islet phenotypes observed after disruption of cell-cell and cell-extracellular matrix (ECM) adhesion. Ins, insulin; ChrA, chromogranin A; Spp1, secreted phosphoprotein 1; Ucn3, urocortin 3; IPGTT, intraperitoneal glucose tolerance test. Data are shown as mean ± SEM. *p<0.05 and **p<0.01.
-
Figure 7—source data 1
Related to Figure 7I.
- https://cdn.elifesciences.org/articles/90006/elife-90006-fig7-data1-v2.xlsx
-
Figure 7—source data 2
Related to Figure 7J.
- https://cdn.elifesciences.org/articles/90006/elife-90006-fig7-data2-v2.xlsx
Videos
Video 1
Three-dimensional (3D) segmentation analysis on whole-mount immunofluorescence images of embryonic day 15.5 (E15.5) control and Itgb1ΔEndo/ΔEndo pancreata.
This file presents a 3D segmentation analysis based on the chromogranin A (ChrA) and secreted phosphoprotein 1 (Spp1) staining, revealing islet clusters and pancreatic ducts. It includes movie clips showcasing the 3D segmentation from various viewing angles. A color scale illustrates the distance between endocrine cells and ducts, with cooler colors indicating shorter distances.
Video 2
Time-lapse confocal microscope imaging of endocrine progenitor cell behaviors in embryonic day 15.5 (E16.5) control (Ngn3Cre; Rosa26mT/mG) embryonic pancreas explants.
This file contains a time-lapse video showcasing the dynamic behaviors of endocrine progenitor cells. The green cell clusters visible in the footage represent Ngn3Cre-expressing progenies, which are the islet endocrine cells. The 8 s video clip encapsulates the changes observed over a 24 hr period.
Video 3
Time-lapse confocal microscope imaging of endocrine progenitor cell behaviors in embryonic day 15.5 (E16.5) Itgb1ΔEndo/ΔEndo (Ngn3Cre; Itgb1f/f; Rosa26mT/mG) embryonic pancreas explants.
This file includes a time-lapse video illustrating the behavior dynamics of Itgb1-deleted endocrine progenitor cells. The green cell clusters depicted in the footage represent Ngn3Cre-expressing progenies deficient in Itgb1. Changes observed over a 24 hr period are captured in an 8 s video clip. Notably, the Itgb1-deleted endocrine progenitor cells prematurely cluster into larger aggregates and maintain a close association with ductal epithelial cords.
Tables
Appendix 1—key resources table
| Reagent type (species) or resource | Designation | Source or reference | Identifiers | Additional information |
|---|---|---|---|---|
| Antibody | Goat polyclonal anti- Pancreatic Polypeptide/PP | Novus Biologicals | Cat# NB100-1793 RRID: AB_2268669 | IHC (1:1000) |
| Antibody | Mouse monoclonal anti-Glucagon | Sigma-Aldrich | Cat# G2654 RRID: AB_259852 | IHC (1:500) |
| Antibody | Goat anti-Glucagon Antibody (N-17) | Santa Cruz Biotechnology | Cat# sc-7780 RRID: AB_641025 | IHC (1:500) |
| Antibody | Guinea Pig polyclonal anti-Insulin | Dakocytomation | Cat# A0564 RRID: AB_10013624 | IHC (1:2000) |
| Antibody | Rabbit monoclonal anti-Insulin | Cell Signaling Technology | Cat# 3014 S RRID: AB_2126503 | IHC & WMIHC (1:1000) |
| Antibody | Rabbit polyclonal anti-Chromogranin A | Novus Biologicals | Cat# NB120-15160 RRID: AB_789299 | IHC & WMIHC (1:500) |
| Antibody | Goat polyclonal anti-Chromogranin A | Santa Cruz Biotechnology | Cat# sc-1488 RRID: AB_2276319 | IHC & WMIHC (1:500) |
| Antibody | Goat polyclonal anti-Somatostatin | Santa Cruz Biotechnology | Cat# sc-7819 RRID: AB_2302603 | IHC (1:100) |
| Antibody | Rat monoclonal anti-Mouse CD31 | BD Biosciences | Cat# 550274 RRID: AB_393571 | IHC & WMIHC (1:200) |
| Antibody | Goat polyclonal anti-PECAM-1 | R&D Systems | Cat# AF3628 RRID: AB_2161028 | IHC (1:500) |
| Antibody | Goat polyclonal anti- Osteopontin/OPN (Spp1) | R&D Systems | Cat# AF808 RRID: AB_2194992 | IHC & WMIHC (1:1000) |
| Antibody | Guinea Pig polyclonal anti-Neurogenin3 | A generous gift of Maike Sander (Henseleit et al., 2005) | IHC (1:1000) | |
| Antibody | Mouse monoclonal anti-Nkx6.1 | DSHB | Cat# F55A10 RRID: AB_532378 | IHC (1:500) |
| Antibody | Rabbit polyclonal anti-Pdx1 | Abcam | Cat# ab47267 RRID: AB_777179 | IHC (1:500) |
| Antibody | Rabbit polyclonal anti-Laminin (Lam1) | Sigma-Aldrich | Cat# L9393 RRID: AB_477163 | IHC (1:1000) |
| Antibody | Rat monoclonal anti-EPCAM | DSHB | Cat# G8.8 RRID: AB_2098655 | IHC (1:100) |
| Antibody | Goat polyclonal anti-E-cadherin | R&D Systems | Cat# AF748 RRID: AB_355568 | IHC (1:500) |
| Antibody | Rabbit polyclonal anti-MafA | Abcam | Cat# ab26405 RRID: AB_776146 | IHC (1:200) |
| Antibody | Rabbit polyclonal anti-Urocortin3 (Ucn3) | A generous gift of Mark Huising (van der Meulen et al., 2015) | IHC (1:1000) | |
| Antibody | Goat polyclonal anti-Glut2 | Santa Cruz Biotechnology | Cat# sc-7580 RRID: AB_641066 | IHC (1:500) |
| Antibody | Rat monoclonal anti-CD29 (Itgβ1) | BD Biosciences | Cat# 550531 RRID: AB_393729 | IHC (1:500) |
| Antibody | Rabbit monoclonal anti-Ki67 | Cell Signaling | Cat# 12202 S (D3B5) RRID: AB_2620142 | IHC (1:500) |
| Antibody | Rabbit anti-Sox9 antibody | EMD Millipore | Cat# AB5535 RRID: AB_2239761 | IHC (1:500) |
| Antibody | Rabbit polyclonal anti-ERO1b antiserum | A generous gift of David Ron (Zito et al., 2010) | IHC (1:300) | |
| Antibody | Cy3 AffiniPure Donkey Anti-Goat IgG (H+L) (donkey polyclonal) | Jackson ImmunoResearch | Cat# 705-165-147 RRID: AB_2307351 | IHC (1:2000) |
| Antibody | Alexa Fluor 488 AffiniPure Donkey Anti-Goat IgG (H+L) (donkey polyclonal) | Jackson ImmunoResearch | Cat# 705-545-147 RRID: AB_2336933 | IHC (1:1000) |
| Antibody | Alexa Fluor 647 AffiniPure Donkey Anti-Goat IgG (H+L) (donkey polyclonal) | Jackson ImmunoResearch | Cat# 705-605-147 RRID: AB_2340437 | IHC (1:200–500) |
| Antibody | Cy3 AffiniPure Donkey Anti-Guinea Pig IgG (H+L) (donkey polyclonal) | Jackson ImmunoResearch | Cat# 706-165-148 RRID: AB_2340460 | IHC (1:2000) |
| Antibody | Alexa Fluor 488 AffiniPure Donkey Anti- Guinea Pig IgG (H+L) (donkey polyclonal) | Jackson ImmunoResearch | Cat# 706-545-148 RRID: AB_2340472 | IHC (1:1000) |
| Antibody | Alexa Fluor 647 AffiniPure Donkey Anti-Guinea Pig IgG (H+L) (donkey polyclonal) | Jackson ImmunoResearch | Cat# 706-605-148 RRID: AB_2340476 | IHC (1:200–500) |
| Antibody | Cy3 AffiniPure Donkey Anti-Rabbit IgG (H+L) (donkey polyclonal) | Jackson ImmunoResearch | Cat# 711-165-152 RRID: AB_2307443 | IHC (1:2000) |
| Antibody | Alexa Fluor 488 AffiniPure Donkey Anti-Rabbit IgG (H+L) (donkey polyclonal) | Jackson ImmunoResearch | Cat# 711-545-152 RRID: AB_2313584 | IHC (1:1000) |
| Antibody | Alexa Fluor 647 AffiniPure Donkey Anti-Rabbit IgG (H+L) (donkey polyclonal) | Jackson ImmunoResearch | Cat# 711-605-152 RRID: AB_2492288 | IHC (1:200–500) |
| Antibody | Cy3 AffiniPure Donkey Anti-Rat IgG (H+L) (donkey polyclonal) | Jackson ImmunoResearch | Cat# 712-165-153 RRID: AB_2340667 | IHC (1:2000) |
| Antibody | Alexa Fluor 488 AffiniPure Donkey Anti-Rat IgG (H+L) (donkey polyclonal) | Jackson ImmunoResearch | Cat# 712-545-153 RRID: AB_2340684 | IHC (1:1000) |
| Antibody | Alexa Fluor 647 AffiniPure Donkey Anti-Rat IgG (H+L) (donkey polyclonal) | Jackson ImmunoResearch | Cat# 712-605-153 RRID: AB_2340694 | IHC (1:200–500) |
| Commercial assay, kit | Dolichos Biflorus Agglutinin (DBA), Biotinylated | Vector Laboratories | Cat# B1035 RRID: AB_2314288 | IHC (1:500) |
| Commercial assay, kit | Dolichos Biflorus Agglutinin (DBA), Rhodamine | Vector Laboratories | Cat# RL-1032–2 RRID: AB_2336396 | IHC (1:500) |
| Commercial assay, kit | DAPI (4',6-Diamidino-2-Phenylindole, Dihydrochloride) | ThermoFisher Scientific | Cat# D1306 | IHC (1:2000) |
| Commercial assay, kit | Phalloidin-iFluor 647 Reagent | Abcam | Cat# ab176759 | IHC (1:1000) |
| Commercial assay, kit | Alexa Fluor 647 Streptavidin | Jackson ImmunoResearch | Cat# 016-600-084 | IHC (1:500) |
| Commercial assay, kit | Cy3 Streptavidin (for IHC 1:500) | Jackson ImmunoResearch | Cat# 016-160-084 RRID: AB_2337244 | IHC (1:500) |
| Chemical compound, drug | Tween 20, Fisher BioReagents | Fisher Scientific | BP337-500 | |
| Chemical compound, drug | Triton X-100 | Sigma | X100-1L | |
| Chemical compound, drug | VectaShield Mounting Medium for Fluorescence | Vector Laboratories | H-1000 | |
| Chemical compound, drug | Paraformaldehyde | Sigma-Aldrich | P6148-500G | |
| Chemical compound, drug | Methanol | VWR Chemical | BDH1135-4LP | |
| Chemical compound, drug | DMSO | ATCC | 4 X-5 | |
| Chemical compound, drug | Hydrogen Peroxide, ACS, 30%, Stabilized | VWR Chemical | BDH7690-1 | |
| Chemical compound, drug | Benzyl Benzoate (ACROS organics) | Fisher Scientific | AC105862500 | |
| Chemical compound, drug | Benzyl Alcohol | Fisher Scientific | 100-51-6 | |
| Chemical compound, drug | D-Glucose | Mallinckrodt | 4192 | |
| Chemical compound, drug | Bovine Albumin Fraction V (7.5% Solution) | Thermo Fisher | 15260037 | |
| Chemical compound, drug | TrypLE Express, with phenol red, Gibco | Fisher Scientific | 12605–010 | |
| Chemical compound, drug | EDTA, 0.5 M, pH 8.0 | Corning | 46–034 CI | |
| Chemical compound, drug | Fetal Bovine Serum | Biofluid Technologies | BT-101–500-D | |
| Chemical compound, drug | Heparin sodium salt from porcine intestinal mucosa | Sigma-Aldrich | H3149-100KU | |
| Chemical compound, drug | CMRL 1066, Supplemented CIT Modification | Mediatech | 98–304-CV | |
| Chemical compound, drug | RNase-Free DNase Set | Qiagen | 79254 | |
| Chemical compound, drug | Penicillin-Streptomycin | Gibco | 15070–063 | |
| Chemical compound, drug | DMEM/F12, HEPES, no phenol red | Gibco | 11-039-21 | |
| Chemical compound, drug | Roche Blocking | Roche | 17091700 | |
| Chemical compound, drug | Donor Donkey Serum | Gemini Bio | 100-151-500 | |
| Chemical compound, drug | Cacodylic Acid, Sodium Salt, trihydrate | TedPella Inc | 18851 | |
| Chemical compound, drug | Glutaraldehyde, 25% EM grade | TedPella Inc | 18426 | |
| Chemical compound, drug | Thiocarbohydrazide ≥98.0% | VWR International | TCT1136-25G | |
| Chemical compound, drug | Buffer RLT Plus Lysis Buffer | Qiagen | 1053393 | |
| Chemical compound, drug | 2-Mercaptoethanol | Sigma-Aldrich | M3148-25ML | |
| Chemical compound, drug | Ethanol, Absolute 200 proof | Fisher BioReagents | BP2818100 | |
| Peptide, recombinant protein | Fibronectin Human Protein, Plasma | Gibco | 33016–015 | |
| Commercial assay, kit | AlphaTrak2 Blood Glucose Test Strips | Zoetis | 71681–01 | |
| Commercial assay, kit | AlphaTrak2 Meter | Zoetis | 71676–01 | |
| Commercial assay, kit | Streptavidin/Biotin Blocking Kit | Vector Laboratories | SP-2002 | |
| Commercial assay, kit | Rneasy Micro Kit | Qiagen | 74304 | |
| Commercial assay, kit | Rnase Zap | Invitrogen | AM9780 | |
| Commercial assay, kit | KAPA RNA HyperPrep Kit with RiboErase (HMR) | Roche | KK8560 | |
| Commercial assay, kit | AxyPrep Mag PCR Clean-up kit | Axigen | MAG-PCR-CL-1 | |
| Commercial assay, kit | NovaSeq 6000 Reagent Kit | Illumina | ||
| Commercial assay, kit | DeadEnd Fluorometric TUNEL System | Promega | G3250 | |
| Commercial assay, kit | M.O.M. (Mouse on Mouse) Immunodetection Kit, Basic | Vector Laboratories | BMK-2202 | |
| Commercial assay, kit | PowerUp SYBR Green Master mix | Applied Biosystems | A25742 | |
| Commercial assay, kit | SuperScript First-Strand Synthesis SuperMix for qRT-PCR | Invitrogen | 11752–050 | |
| Commercial assay, kit | Ultrasensitive Mouse Insulin ELISA | Mercodia | 10-1249-01 | |
| Other | RNA sequencing data of Itgb1 KO murine pancreatic islets. | https://www.ncbi.nlm.nih.gov/geo/ | GSE153187 | |
| Other | RNA sequencing data of Ctnna1 KO murine pancreatic islets. | https://www.ncbi.nlm.nih.gov/geo/ | GSE190788 | |
| Strain, strain background (M. musculus) | Mouse: B6.FVB(Cg)-Tg(Neurog3-cre)C1Able/J | Jackson Laboratory, Bar Harbor, ME | RRID:IMSR_JAX:006333 | |
| Strain, strain background (M. musculus) | Mouse: B6;129-Itgb1tm1Efu/J | Jackson Laboratory, Bar Harbor, ME | RRID:IMSR_JAX:004605 | |
| Strain, strain background (M. musculus) | Mouse: B6;129-Ctnna1tm1Efu/J | Jackson Laboratory, Bar Harbor, ME | RRID:IMSR_JAX:004604 | |
| Strain, strain background (M. musculus) | Mouse: B6;129S-Gcgtm1.1(icre)Gkg/J | Jackson Laboratory, Bar Harbor, ME | RRID:IMSR_JAX:030663 | |
| Strain, strain background (M. musculus) | Mouse: B6(Cg)-Ins1tm1.1(cre)Thor/J | Jackson Laboratory, Bar Harbor, ME | RRID:IMSR_JAX:026801 | |
| Strain, strain background (M. musculus) | Mouse: B6.129(Cg)-Gt(ROSA)26Sortm4(ACTB-tdTomato,-EGFP)Luo/J | Jackson Laboratory, Bar Harbor, ME | RRID:IMSR_JAX:007676 | |
| Strain, strain background (M. musculus) | Mouse: B6.129X1-Gt(ROSA)26Sortm1(EYFP)Cos/J | Jackson Laboratory, Bar Harbor, ME | RRID:IMSR_JAX:006148 | |
| Strain, strain background (M. musculus) | B6.FVB(Cg)-Tg(Ucn3-cre) KF43Gsat/Mmucd | Mutant Mouse Resource & Research Centers, Novi, MI | RRID:MMRRC_037417-UCD | |
| Sequence-based reagent | Generic Cre | The Jackson Laboratory | PCR Primer oIMR1084 | GCG GTC TGG CAG TAA AAA CTA TC |
| Sequence-based reagent | Generic Cre | The Jackson Laboratory | PCR Primer oIMR1085 | GTG AAA CAG CAT TGC TGT CAC TT |
| Sequence-based reagent | Generic Cre | The Jackson Laboratory | PCR Primer oIMR7338 | CTA GGC CAC AGA ATT GAA AGA TCT |
| Sequence-based reagent | Generic Cre | The Jackson Laboratory | PCR Primer oIMR7339 | GTA GGT GGA AAT TCT AGC ATC ATC C |
| Sequence-based reagent | β1 integrin floxed | The Jackson Laboratory | PCR Primer oIMR1906 | CGG CTC AAA GCA GAG TGT CAG TC |
| Sequence-based reagent | β1 integrin floxed | The Jackson Laboratory | PCR Primer oIMR1907 | CCA CAA CTT TCC CAG TTA GCT CTC |
| Sequence-based reagent | α-catenin floxed | The Jackson Laboratory | PCR Primer oIMR1902 | CAT TTC TGT CAC CCC CAA AGA CAC |
| Sequence-based reagent | α-catenin floxed | The Jackson Laboratory | PCR Primer oIMR1903 | GCA AAA TGA TCC AGC GTC CTG GG |
| Sequence-based reagent | GcgiCre | The Jackson Laboratory | PCR Primer oIMR7338 | CTA GGC CAC AGA ATT GAA AGA TCT |
| Sequence-based reagent | GcgiCre | The Jackson Laboratory | PCR Primer oIMR7339 | GTA GGT GGA AAT TCT AGC ATC ATC C |
| Sequence-based reagent | GcgiCre | The Jackson Laboratory | PCR Primer oIMR9266 | AGA TGC CAG GAC ATC AGG AAC CTG |
| Sequence-based reagent | GcgiCre | The Jackson Laboratory | PCR Primer oIMR9267 | ATC AGC CAC ACC AGA CAC AGA GAT C |
| Sequence-based reagent | RosamT/mG | The Jackson Laboratory | PCR Primer 9655 | CCA GGC GGG CCA TTT ACC GTA AG |
| Sequence-based reagent | RosamT/mG | The Jackson Laboratory | PCR Primer oIMR8545 | AAA GTC GCT CTG AGT TGT TAT |
| Sequence-based reagent | RosamT/mG | The Jackson Laboratory | PCR Primer oIMR8546 | GGA GCG GGA GAA ATG GAT ATG |
| Sequence-based reagent | R26R-EYFP | The Jackson Laboratory | PCR Primer 21306 | CTG GCT TCT GAG GAC CG |
| Sequence-based reagent | R26R-EYFP | The Jackson Laboratory | PCR Primer 24500 | CAG GAC AAC GCC CAC ACA |
| Sequence-based reagent | R26R-EYFP | The Jackson Laboratory | PCR Primer 24951 | AGG GCG AGG AGC TGT TCA |
| Sequence-based reagent | R26R-EYFP | The Jackson Laboratory | PCR Primer 24952 | TGA AGT CGA TGC CCT TCA G |
| Sequence-based reagent | mItgb1-F | PrimerBank | qPCR primer Primer Bank ID: 52,722 a1 | ATGCCAAATCTTGCGGAGAAT |
| Sequence-based reagent | mItgb1-R | PrimerBank | qPCR primer Primer Bank ID: 52,722 a1 | TTTGCTGCGATTGGTGACATT |
| Sequence-based reagent | mSlc2a2-F | PrimerBank | qPCR primer Primer Bank ID: 13654262 a1 | TCAGAAGACAAGATCACCGGA |
| Sequence-based reagent | mSlc2a2-R | PrimerBank | qPCR primer Primer Bank ID: 13654262 a1t | GCTGGTGTGACTGTAAGTGGG |
| Sequence-based reagent | mUcn3-F | PrimerBank | qPCR primer Primer Bank ID: 21492632 a1 | AAGCCTCTCCCACAAGTTCTA |
| Sequence-based reagent | mUcn3-R | PrimerBank | qPCR primer Primer Bank ID: 21492632 a1 | GAGGTGCGTTTGGTTGTCATC |
| Sequence-based reagent | mMafA-F | PrimerBank | qPCR primer Primer Bank ID: 23503735 a1 | AGGAGGAGGTCATCCGACTG |
| Sequence-based reagent | mMafA-R | PrimerBank | qPCR primer Primer Bank ID: 23503735 a1 | CTTCTCGCTCTCCAGAATGTG |
| Sequence-based reagent | mMafB-F | PrimerBank | qPCR primer Primer Bank ID: 23308601 a1 | TTCGACCTTCTCAAGTTCGACG |
| Sequence-based reagent | mMafB-R | PrimerBank | qPCR primer Primer Bank ID: 23308601 a1 | TCGAGATGGGTCTTCGGTTCA |
| Sequence-based reagent | mArx-F | PrimerBank | qPCR primer Primer Bank ID: 26024213 a1 | GGCCGGAGTGCAAGAGTAAAT |
| Sequence-based reagent | mArx-R | PrimerBank | qPCR primer Primer Bank ID: 26024213 a1 | TGCATGGCTTTTTCCTGGTCA |
| Sequence-based reagent | mEtv1-F | PrimerBank | qPCR primer Primer Bank ID: 26328055 a1 | TTAAGTGCAGGCGTCTTCTTC |
| Sequence-based reagent | mEtv1-R | PrimerBank | qPCR primer Primer Bank ID: 26328055 a1 | GGAGGCCATGAAAAGCCAAA |
| Sequence-based reagent | mAldh1a3-F | PrimerBank | qPCR primer Primer Bank ID: 31542123 a1 | GGGTCACACTGGAGCTAGGA |
| Sequence-based reagent | mAldh1a3-R | PrimerBank | qPCR primer Primer Bank ID: 31542123 a1 | CTGGCCTCTTCTTGGCGAA |
| Sequence-based reagent | mHk1-F | PrimerBank | qPCR primer Primer Bank ID: 309289 a1 | CGGAATGGGGAGCCTTTGG |
| Sequence-based reagent | mHk1-R | PrimerBank | qPCR primer Primer Bank ID: 309289 a1 | GCCTTCCTTATCCGTTTCAATGG |
| Sequence-based reagent | mLdhA-F | PrimerBank | qPCR primer Primer Bank ID: 6754524 a1 | TGTCTCCAGCAAAGACTACTGT |
| Sequence-based reagent | mLdhA-R | PrimerBank | qPCR primer Primer Bank ID: 6754524 a1 | GACTGTACTTGACAATGTTGGGA |
| Sequence-based reagent | mCtnna1-F | PrimerBank | qPCR primer Primer Bank ID: 6753294 a1 | AAGTCTGGAGATTAGGACTCTGG |
| Sequence-based reagent | mCtnna1-R | PrimerBank | qPCR primer Primer Bank ID: 6753294 a1 | ACGGCCTCTCTTTTTATTAGACG |
| Sequence-based reagent | mSlc27a2-F | PrimerBank | qPCR primer Primer Bank ID: 6755548 a1 | TCCTCCAAGATGTGCGGTACT |
| Sequence-based reagent | mSlc27a2-R | PrimerBank | qPCR primer Primer Bank ID: 6755548 a1 | TAGGTGAGCGTCTCGTCTCG |
| Sequence-based reagent | mPeg10-F | PrimerBank | qPCR primer Primer Bank ID: 31376257 a1 | TGCTTGCACAGAGCTACAGTC |
| Sequence-based reagent | mPeg10-R | PrimerBank | qPCR primer Primer Bank ID: 31376257 a1 | AGTTTGGGATAGGGGCTGCT |
| Sequence-based reagent | mSst-F | PrimerBank | qPCR primer Primer Bank ID: 6678035 a1 | ACCGGGAAACAGGAACTGG |
| Sequence-based reagent | mSst-R | PrimerBank | qPCR primer Primer Bank ID: 6678035 a1 | TTGCTGGGTTCGAGTTGGC |
| Sequence-based reagent | mAldh1a1-F | PrimerBank | qPCR primer Primer Bank ID: 7304881 a1 | ATACTTGTCGGATTTAGGAGGCT |
| Sequence-based reagent | mAldh1a1-R | PrimerBank | qPCR primer Primer Bank ID: 7304881 a1 | GGGCCTATCTTCCAAATGAACA |
| Sequence-based reagent | mCxcl14-F | PrimerBank | qPCR primer Primer Bank ID: 9625004 a1 | GAAGATGGTTATCGTCACCACC |
| Sequence-based reagent | mCxcl14-R | PrimerBank | qPCR primer Primer Bank ID: 9625004 a1 | CGTTCCAGGCATTGTACCACT |
| Sequence-based reagent | mPPIA-Fw | PrimerBank | qPCR primer Primer Bank ID: 6679438 c1 | GAGCTGTTTGCAGACAAAGTTC |
| Sequence-based reagent | mPPIA-Rv | PrimerBank | qPCR primer Primer Bank ID: 6679438 c1 | CCCTGGCACATGAATCCTGG |
| Software, algorithms | Image-Pro Premier v.9.2 | https://www.bioimager.com/product/image-pro-premier-software/ | RRID:SCR_016497 | |
| Software, algorithms | Imaris Microscopy Image Analysis Software | https://imaris.oxinst.com/ | RRID:SCR_007370 | |
| Software, algorithms | QuPath Quantitative Pathology & Bioimage Analysis | https://qupath.github.io/ | RRID:SCR_018257 | |
| Software, algorithms | ZEISS ZEN Microscope Software | http://www.zeiss.com/microscopy/en_us/products/microscope-software/zen.html#introduction | RRID:SCR_013672 | |
| Software, algorithms | Star software (v.020201) | http://code.google.com/p/rna-star/ | RRID:SCR_004463 | |
| Software, algorithms | DAVID software (v.6.8) | http://david.abcc.ncifcrf.gov/ | RRID:SCR_001881 | |
| Software, algorithms | Featurecount software | http://bioinf.wehi.edu.au/featureCounts/ | RRID:SCR_012919 | |
| Software, algorithms | R-Project for Statistical Computing | http://www.r-project.org/ | RRID:SCR_001905 | |
| Software, algorithms | GraphPad Prism Statistical Analysis Software | http://www.graphpad.com/ | RRID:SCR_002798 | |
| Software, algorithms | Applied Biosystems QuantStudio 6 Real Time PCR System - QuantStudio Real-Time PCR Software v1.3 | https://www.thermofisher.com/us/en/home/global/forms/life-science/quantstudio-6-7-flex-software.html | RRID: SCR_020239 |
Additional files
-
Supplementary file 1
List of Itgb1-regulated genes in 6-week-old islets.
This table provides a comprehensive catalogue of gene expression differences observed between islets isolated from control mice and those from Itgb1ΔEndo/Δendo mice.
- https://cdn.elifesciences.org/articles/90006/elife-90006-supp1-v2.zip
-
Supplementary file 2
List of Ctnna1-regulated genes in 8-week-old islets.
This table provides a comprehensive catalogue of gene expression differences observed between islets isolated from control mice and those from Ctnna1ΔEndo/ΔEndo mice.
- https://cdn.elifesciences.org/articles/90006/elife-90006-supp2-v2.zip
-
Supplementary file 3
List of replicates and statistical analysis.
This table provides detailed information about the replicates, including the number of replicates and sample sizes. It also includes the types of statistical analyses performed.
- https://cdn.elifesciences.org/articles/90006/elife-90006-supp3-v2.xlsx
-
MDAR checklist
- https://cdn.elifesciences.org/articles/90006/elife-90006-mdarchecklist1-v2.pdf
Download links
A two-part list of links to download the article, or parts of the article, in various formats.
Downloads (link to download the article as PDF)
Open citations (links to open the citations from this article in various online reference manager services)
Cite this article (links to download the citations from this article in formats compatible with various reference manager tools)
Coordination between ECM and cell-cell adhesion regulates the development of islet aggregation, architecture, and functional maturation
eLife 12:e90006.
https://doi.org/10.7554/eLife.90006


