Three-dimensional single-cell transcriptome imaging of thick tissues
- Howard Hughes Medical Institute, Department of Chemistry and Chemical Biology, Department of Physics, Center for Brain Science, Harvard University, United States
- Howard Hughes Medical Institute, Department of Molecular and Cellular Biology, Center for Brain Science, Harvard University, United States
Figures
Figure 1 with 2 supplements

Deep learning (DL) enhances performance of confocal MERFISH imaging.
(a) A single-bit high-pass-filtered MERFISH confocal image of 242 genes in a brain tissue section taken with an exposure time of 0.1 s (left) and a magnified view of a single cell marked by the white box in the left image (right). (b) The correlation between the copy number of individual genes detected per field of view (FOV) using 0.1 s exposure time and those obtained using 1 s exposure time. The median ratio of the copy number and the Pearson correlation coefficient r are shown. The copy number per gene detected using 0.1 s exposure time is 24% of that detected using 1 s exposure time. (c) The same image as in (a) but after enhancement of signal-to-noise ratio (SNR) by a DL algorithm. (d) The same as (b) but after DL was used to enhance the SNR of the 0.1 s images. The copy number per gene detected with 0.1 s exposure time after DL-based enhancement is 89% of that detected using 1 s exposure time.
-
Figure 1—source data 1
This source data file contains source data for Figure 1b and d.
- https://cdn.elifesciences.org/articles/90029/elife-90029-fig1-data1-v1.xlsx
Figure 1—figure supplement 1
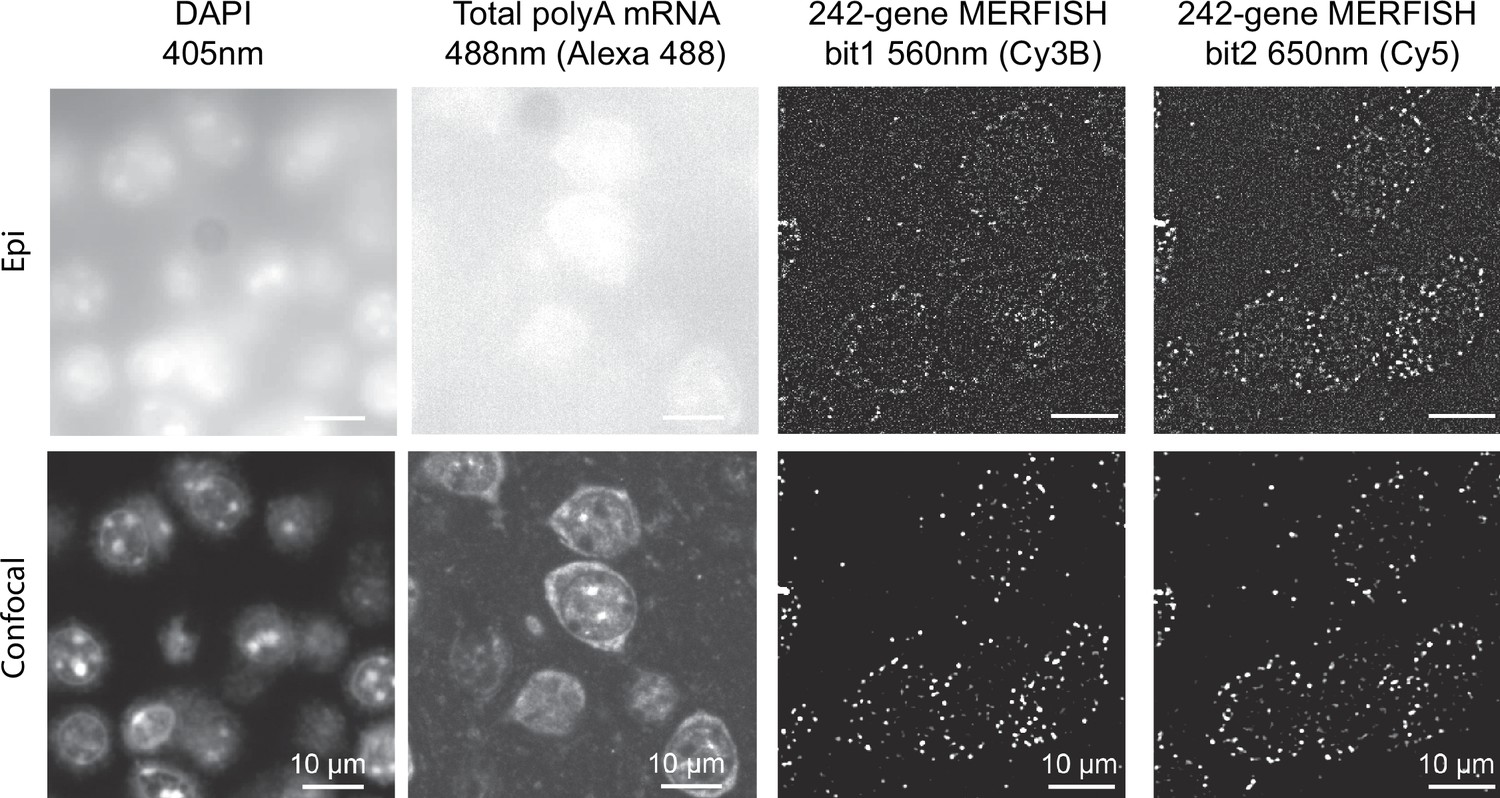
Comparison of epifluorescence and confocal MERFISH images in thick-tissue samples.
Images of nuclei (DAPI), total polyA mRNA, and two MERFISH bits were obtained using epifluorescence (Epi) and spinning-disk confocal microscopy respectively. Both epifluorescence and confocal images were taken with 1 s exposure time. The MERFISH bit-1 and bit-2 images were high-pass filtered to remove cellular background.
Figure 1—figure supplement 2
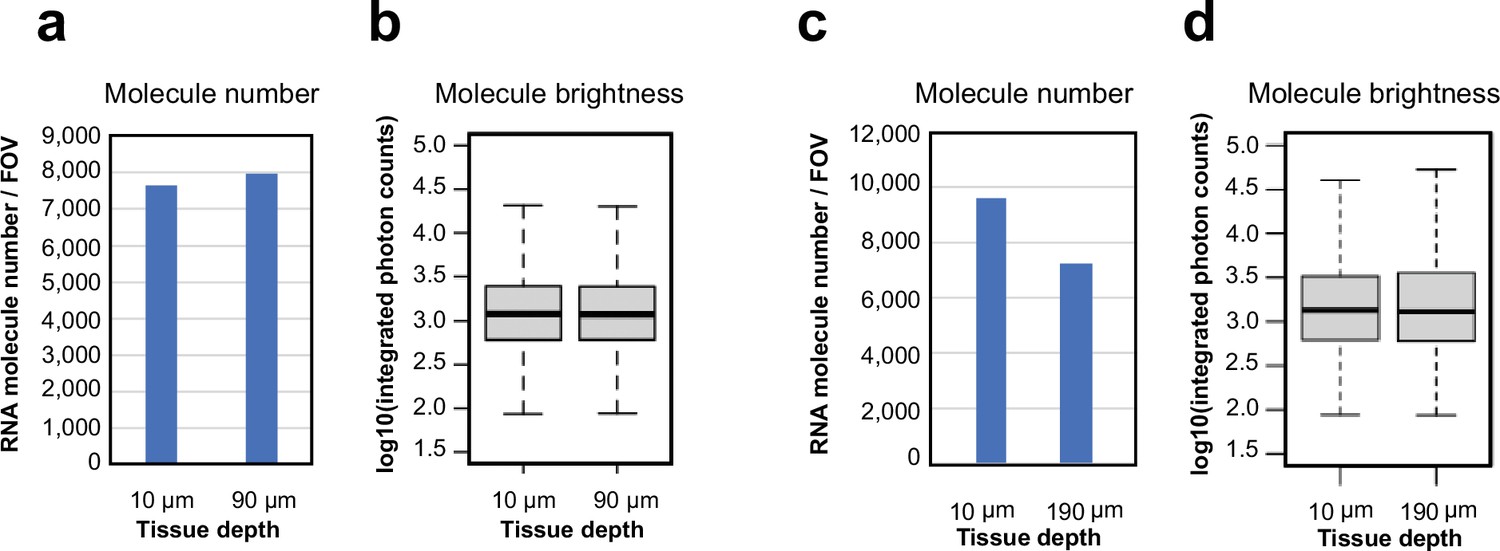
Characterization of MERFISH images of RNA molecules at different tissue depths in 100-µm- and 200-µm-thick brain tissue sections.
(a) Number of RNA molecules detected per field of view (FOV) at a single z-plane at the tissue depths of 10 µm and 90 µm in the first bit of the 242-gene MERFISH measurements in a 100-µm-thick section of the mouse cortex. (b) Logarithmic distribution of integrated photon counts of individual RNA molecules at the tissue depths of 10 µm and 90 µm identified in (a). In each boxplot, the midline represents the median value, the box represents the interquartile range (IQR), the lower whisker represents the smaller of the minimum data point or 1.5× IQR below the 25th percentile, and the upper whisker represents the greater of the maximum data point or 1.5× IQR above the 75th percentile. Molecule number (n, from left to right): 7565, 7914. (c) Number of RNA molecules detected per FOV at a single z-plane at tissue depths of 10 µm and 190 µm of in the first bit of the 156-gene MERFISH measurements in a 200-µm-thick section of the mouse hypothalamus. (d) Logarithmic distribution of integrated photon counts of individual RNA molecules at the tissue depths of 10 µm and 190 µm identified in (c). In each boxplot, the midline represents the median value, the box represents the IQR, the lower whisker represents the smaller of the minimum data point or 1.5× IQR below the 25th percentile, and the upper whisker represents the greater of the maximum data point or 1.5× IQR above the 75th percentile. Molecule number (n, from left to right): 9611, 7238.
-
Figure 1—figure supplement 2—source data 1
This source data file contains source data for Figure 1—figure supplement 2a-d.
- https://cdn.elifesciences.org/articles/90029/elife-90029-fig1-figsupp2-data1-v1.xlsx
Figure 2 with 4 supplements
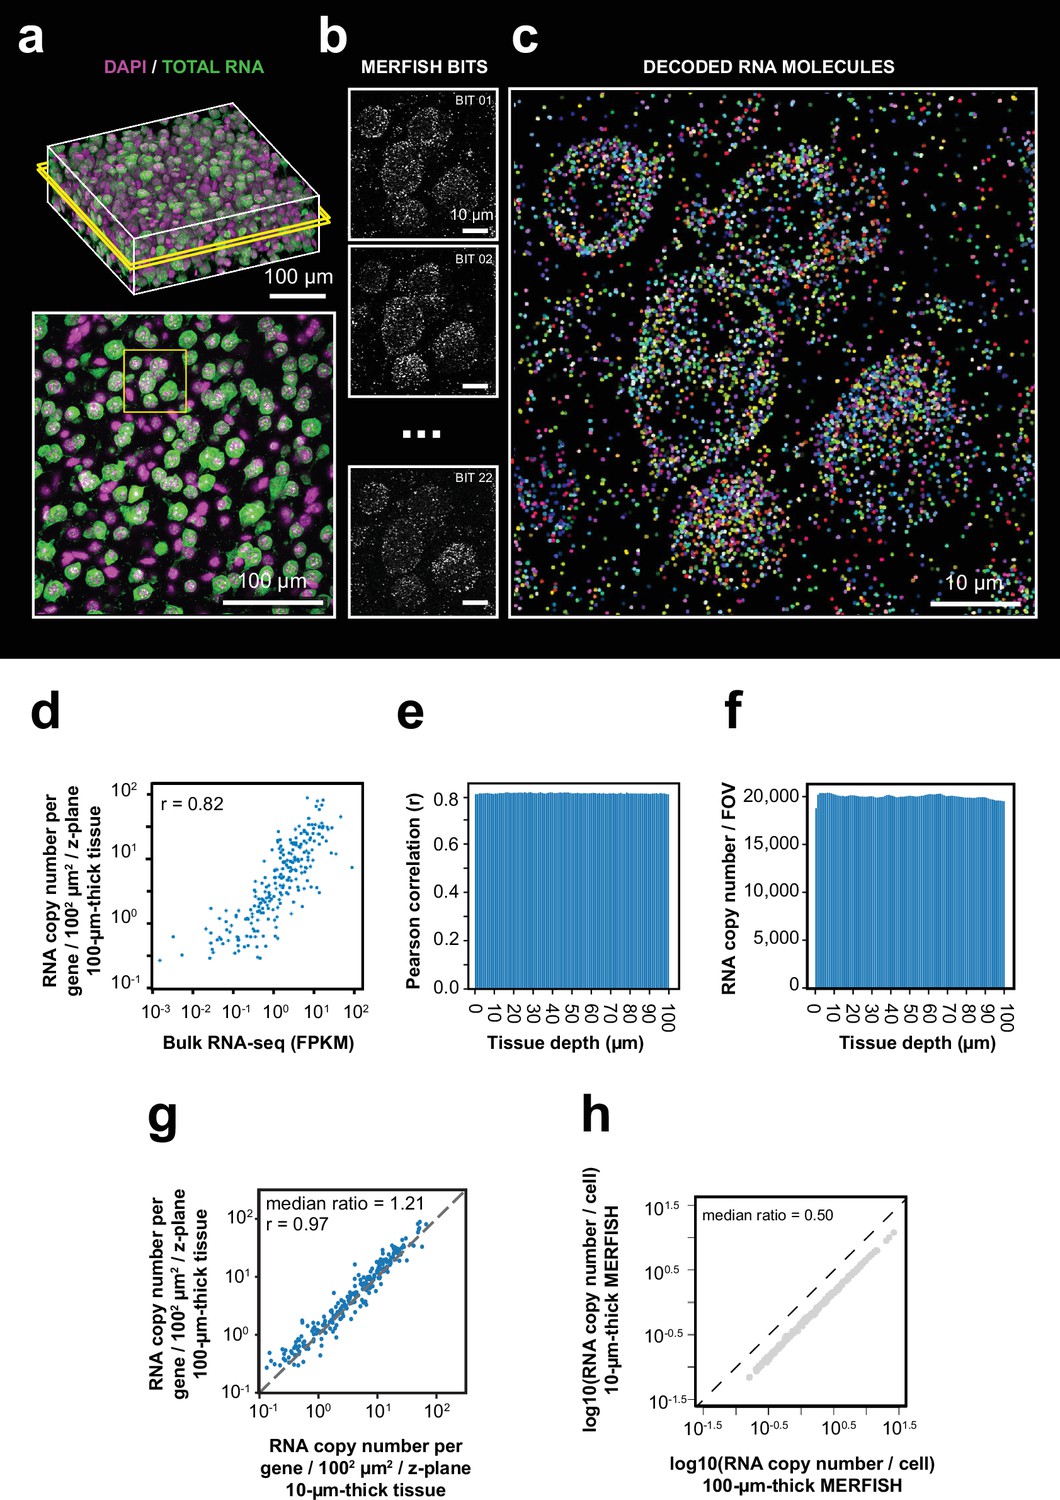
3D-MERFISH imaging of thick brain tissue sections.
(a) 3D images of DAPI and total polyA mRNA from a single field of view (FOV) in a 100-µm-thick mouse brain tissue slice (top), alongside a single z-plane at tissue depth of 50 µm marked by the yellow box in the top image (bottom). (b) Maximum-projection images of 10 consecutive 1 µm z-planes of individual MERFISH bits of the region marked in yellow box in the bottom panel of (a). (c) RNA molecules identified in the same region as in (b) with RNA molecules color coded by their genetic identities. (d) The RNA copy number for individual genes per unit area (1002 µm2) per z-plane detected in the 100 µm MERFISH measurements of mouse cortex versus the FPKM from bulk RNA-seq. The Pearson correlation coefficient r is shown. (e) The Pearson correlation between RNA copy number for individual genes per z-plane at different tissue depths detected by MERFISH and the FPKM values of individual genes from bulk RNA-seq. (f) Number of detected RNA molecules per FOV at different tissue depths. (g) The RNA copy number for individual genes per unit area (1002 µm2) per z-plane detected in the 100 µm MERFISH measurements of mouse brain sections in this work versus that detected by 10-µm-thick-tissue MERFISH measurements using an epifluorescence setup (Zhang et al., 2021). The Pearson correlation coefficient r is shown. (h) The RNA copy number of individual genes per cell detected in the 100-µm-thick-tissue section versus that in individual 10-µm-thick z-ranges of the same sample. The 100-µm-thick section was evenly divided into ten 10 µm z-ranges to determine the latter. Data in this figure were generated from a 100-μm-thick section of the cortical region collected from an adult mouse.
-
Figure 2—source data 1
This source data file contains source data for Figure 2d-h.
- https://cdn.elifesciences.org/articles/90029/elife-90029-fig2-data1-v1.xlsx
Figure 2—figure supplement 1
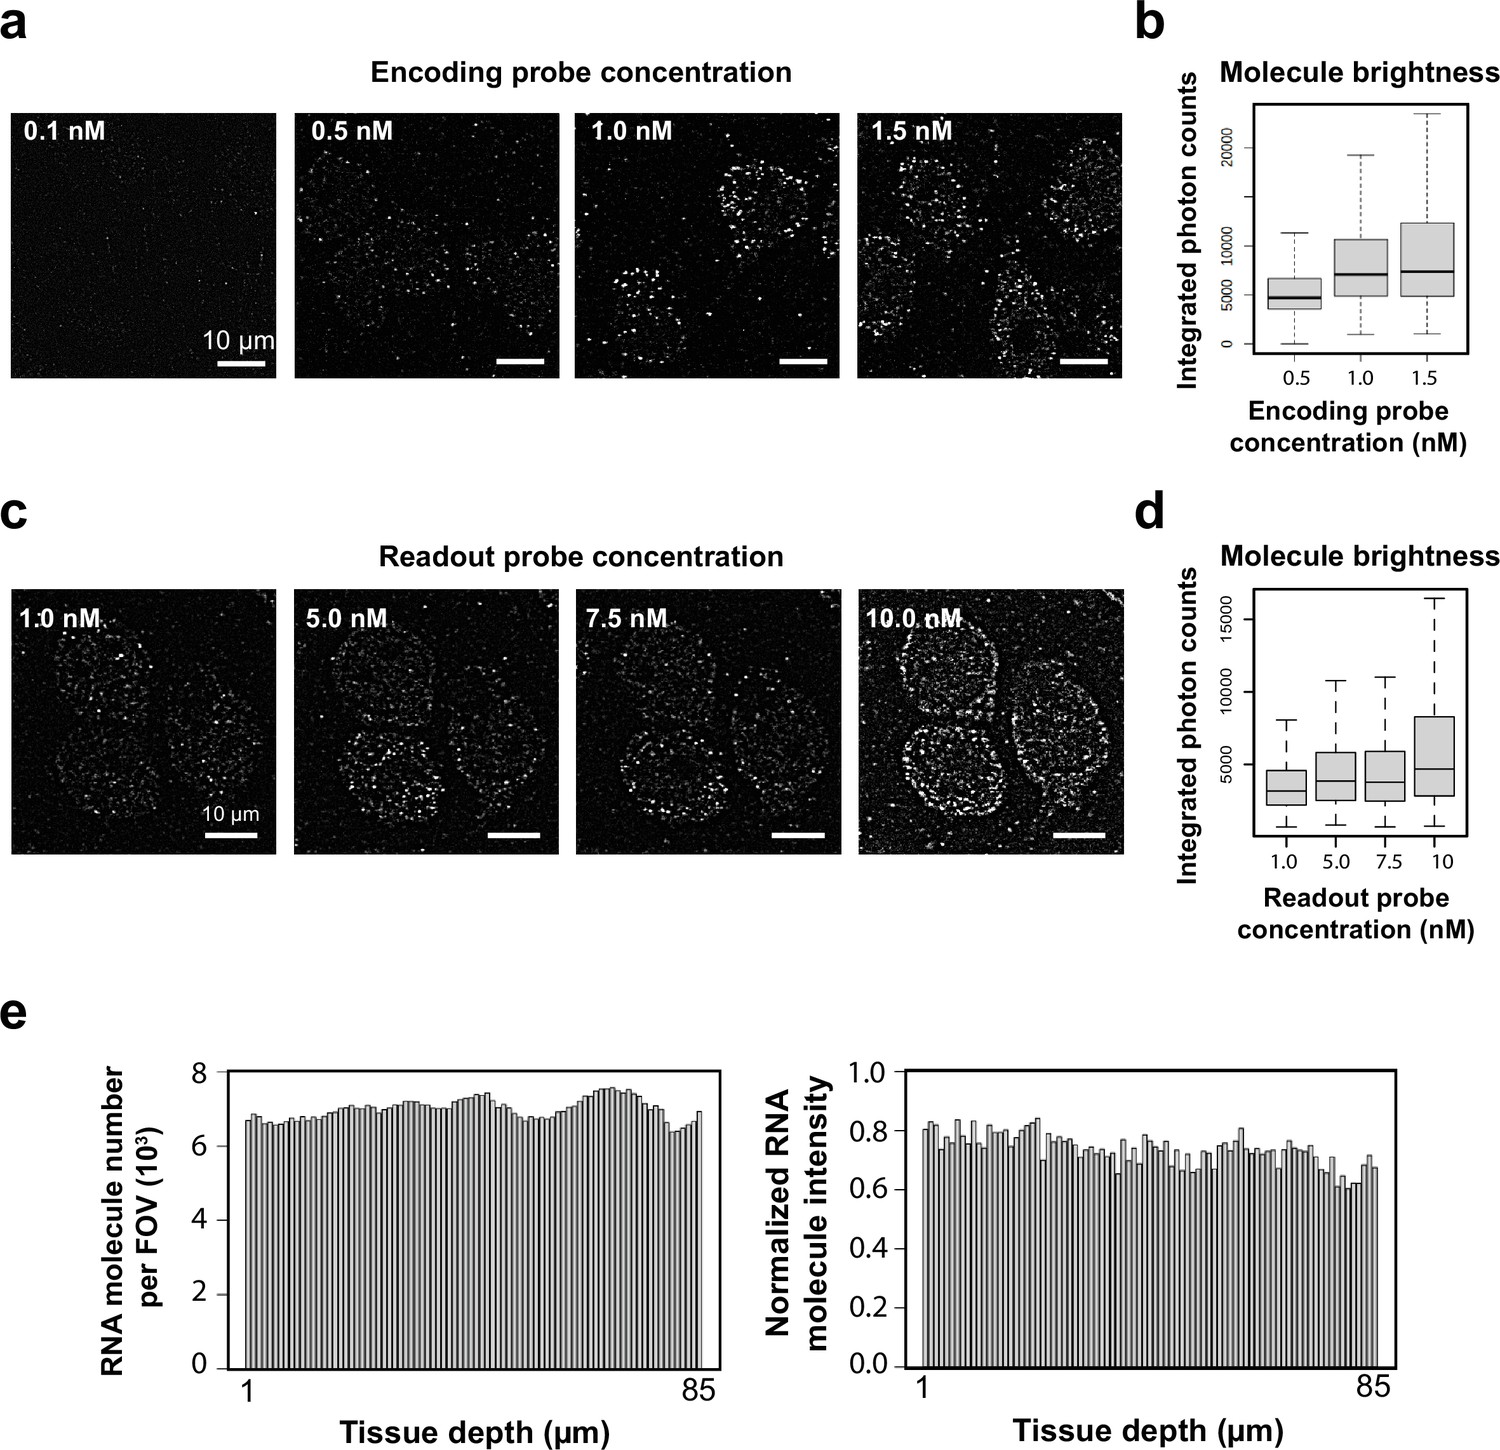
Optimization of MERFISH encoding and readout probe labeling conditions.
(a) Example high-pass-filtered bit-1 images of a 242-gene MERFISH measurement in a 100-µm-thick section of mouse cortex stained with different concentrations of encoding probes. The concentration values refer to the concentration of each individual encoding probe. (b) Distribution of integrated photon counts of individual RNA molecules identified at different encoding probe concentrations. In each boxplot, the midline represents the median value, the box represents the interquartile range (IQR), the lower whisker represents the smaller of the minimum data point or 1.5× IQR below the 25th percentile, and the upper whisker represents the greater of the maximum data point or 1.5× IQR above the 75th percentile. Molecule number (n, from left to right): 31606, 29190, 83644. The signals from individual RNA molecules increased with the encoding probe concentration and reached saturation at ~1.0 nM per probe. We thus used 1 nM encoding probe concentrations for staining thick-tissue samples. (c) A 100-µm-thick mouse brain slice was stained with the 242-gene MERFISH encoding probes, followed by sequential hybridization with readout probes corresponding to the first, second, third, and fourth bit of the barcodes, each bit using a different readout probe concentration. High-pass-filtered bit-1, bit-2, bit-3, and bit-4 MERFISH images (each with a different concentration of readout probes) are shown. (d) Distribution of integrated photon counts of individual RNA molecules identified at different readout probe concentrations. In each boxplot, the midline represents the median value, the box represents the IQR, the lower whisker represents the smaller of the minimum data point or 1.5× IQR below the 25th percentile, and the upper whisker represents the greater of the maximum data point or 1.5× IQR above the 75th percentile. Molecule number (n, from left to right): 1939, 3815, 3869, 5248. The signal increased with readout probe concentration, but the background also increased when the probe concentration reached beyond 5 nM. We thus used 5 nM readout probe concentration for thick-tissue imaging. In addition to the probe concentrations, we also optimized readout probe incubation time. (e) The number of RNA molecules per field of view per z-plane and the normalized intensity of individual molecules at different tissue depths. The encoding probe concentration was 1 nM per encoding probe, the readout probe concentration was 5 nM, and the readout probe incubation time was 25 min for these measurements.
-
Figure 2—figure supplement 1—source data 1
This source data file contains source data for Figure 2—figure supplement 1b, d, and e.
- https://cdn.elifesciences.org/articles/90029/elife-90029-fig2-figsupp1-data1-v1.xlsx
Figure 2—figure supplement 2

Displacement of RNA molecules between different imaging rounds reduces detection accuracy and efficiency.
(a) Total copy number of decoded RNAs detected per field of view (FOV) per z-plane at different tissue depths in a 242-gene MERFISH measurement of the 100-µm-thick section. (b) Pearson correlation coefficients of RNA copy number of individual genes per FOV per z-plane detected at different tissue depths by MERFISH with the FPKM values measured by bulk RNA-seq. (c) Correlation of RNA copy number of individual genes per FOV per z-plane detected in the entire 100-µm-thick section by MERFISH with the FPKM values obtained by bulk RNA-seq. The Pearson correlation coefficient r is shown. (d) Example images of gel-embedded beads acquired in two rounds of imaging. Buffer exchanges were performed between imaging rounds, mimicking the MERFISH protocol. Because the gel expanded to a different extent in different rounds, the positions of beads changed from round to round in x, y, and z directions. Circles mark beads identified in both imaging rounds. Because the gel size changed, the x and y positions of the beads changed, and the brightness of these beads also changed due to the shift in their z positions. Arrows highlight beads detected in one of the imaging rounds, but not the other, due to the gel-size change, which move these beads out of focus.
-
Figure 2—figure supplement 2—source data 1
This source data file contains source data for Figure 2—figure supplement 2a-c.
- https://cdn.elifesciences.org/articles/90029/elife-90029-fig2-figsupp2-data1-v1.xlsx
Figure 2—figure supplement 3

Quantification of gel expansion effect by MERFISH buffers.
(a) Quantification of gel expansion factor in various buffers used in the MERFISH protocol. The initial gel size was the same as the coverslip, and the expansion factor after buffer exchange was determined as the ratio between the gel size after buffer exchange and the coverslip size. (b) In each round of MERFISH imaging, the sample is incubated with the readout probes in a wash buffer (containing either 10% ethylene carbonate [EC] or 10% formamide) for a duration of 15 min. Subsequently, the sample was rinsed with the wash buffer (without readout probes) to remove any excessive readout probes, followed by a treatment with imaging buffer containing glucose-oxidase-based or protocatechuate 3,4-dioxygenase rPCO-based oxygen scavenger system to reduce photobleaching. After the imaging process, the sample is treated with tris(2-carboxyethyl) phosphine buffer to cleave off the fluorescent dye linked to the readout probe through a disulfide bond, and finally washed with a solution of 2× saline-sodium citrate (SSC). All buffers, including wash, imaging, and cleavage buffers, contained 2× SSC. Gel-expansion factor in these buffers used in the MERFISH protocol was quantified and shown here. Reagents marked by * were selected for final use in the 3D thick-tissue MERFISH experiment. The dashed line highlights the expansion factor in the 2× SSC buffer alone. (c) XZ projection images of fiducial beads embedded in a gel undergoing buffer exchange for the indicated time period. Wash buffer containing 15% EC in 2× SSC causes noticeable gel distortion, which was recovered after 15 min in 2× SSC buffer without EC.
-
Figure 2—figure supplement 3—source data 1
This source data file contains source data for Figure 2—figure supplement 3b.
- https://cdn.elifesciences.org/articles/90029/elife-90029-fig2-figsupp3-data1-v1.xlsx
Figure 2—figure supplement 4
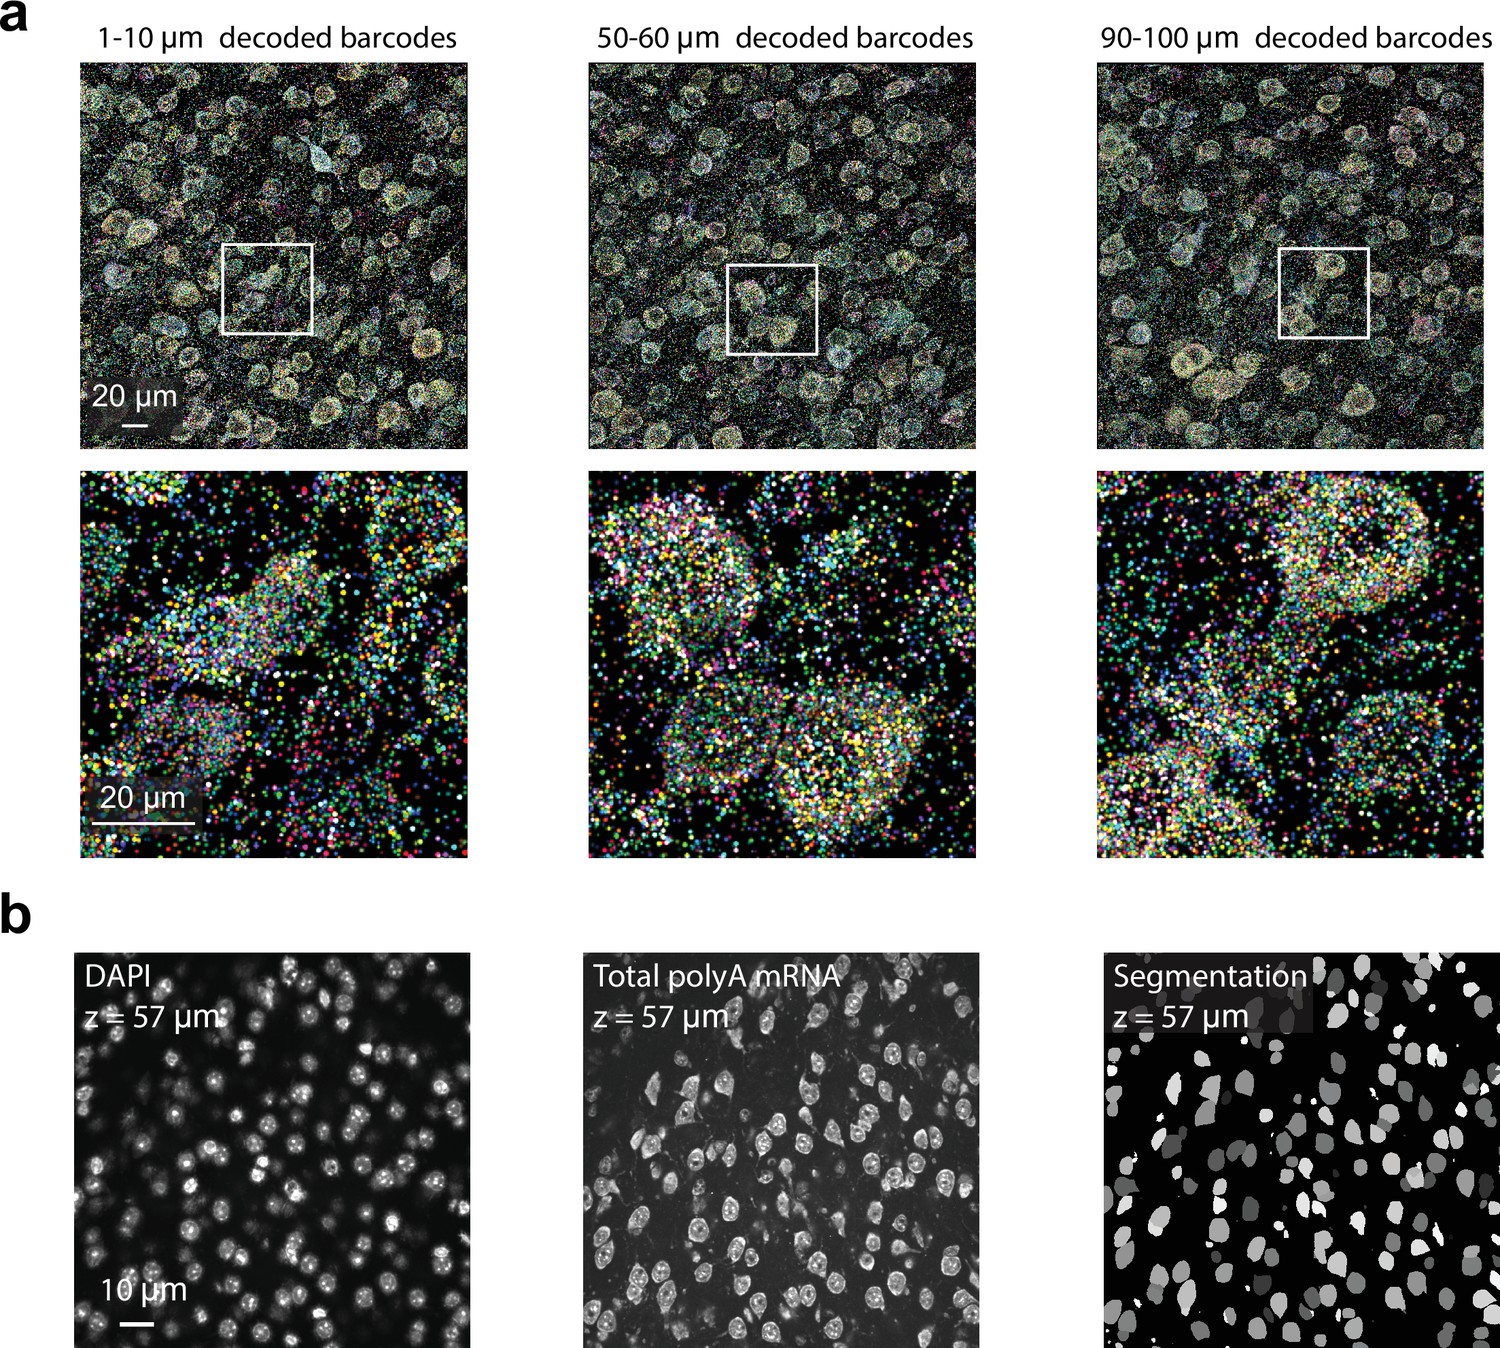
3D MERFISH imaging of 242 genes in a 100-µm-thick section of the mouse cortex.
(a) Example images of decoded RNA molecules at different tissue depths. Each image shows decoded barcodes in a 10-µm-thick z-range, as indicated. Bottom panels show the zoom-in of the region marked by white boxes in the top panels. RNA molecules are color coded by their genetic identities. (b) DAPI (left) and polyA mRNA (middle) images of an example field of view, which were used for cell segmentation. Cell boundary segmentation determined using a deep learning-based segmentation algorithm (Cellpose 2.0) is shown in the right panel.
Figure 3 with 4 supplements
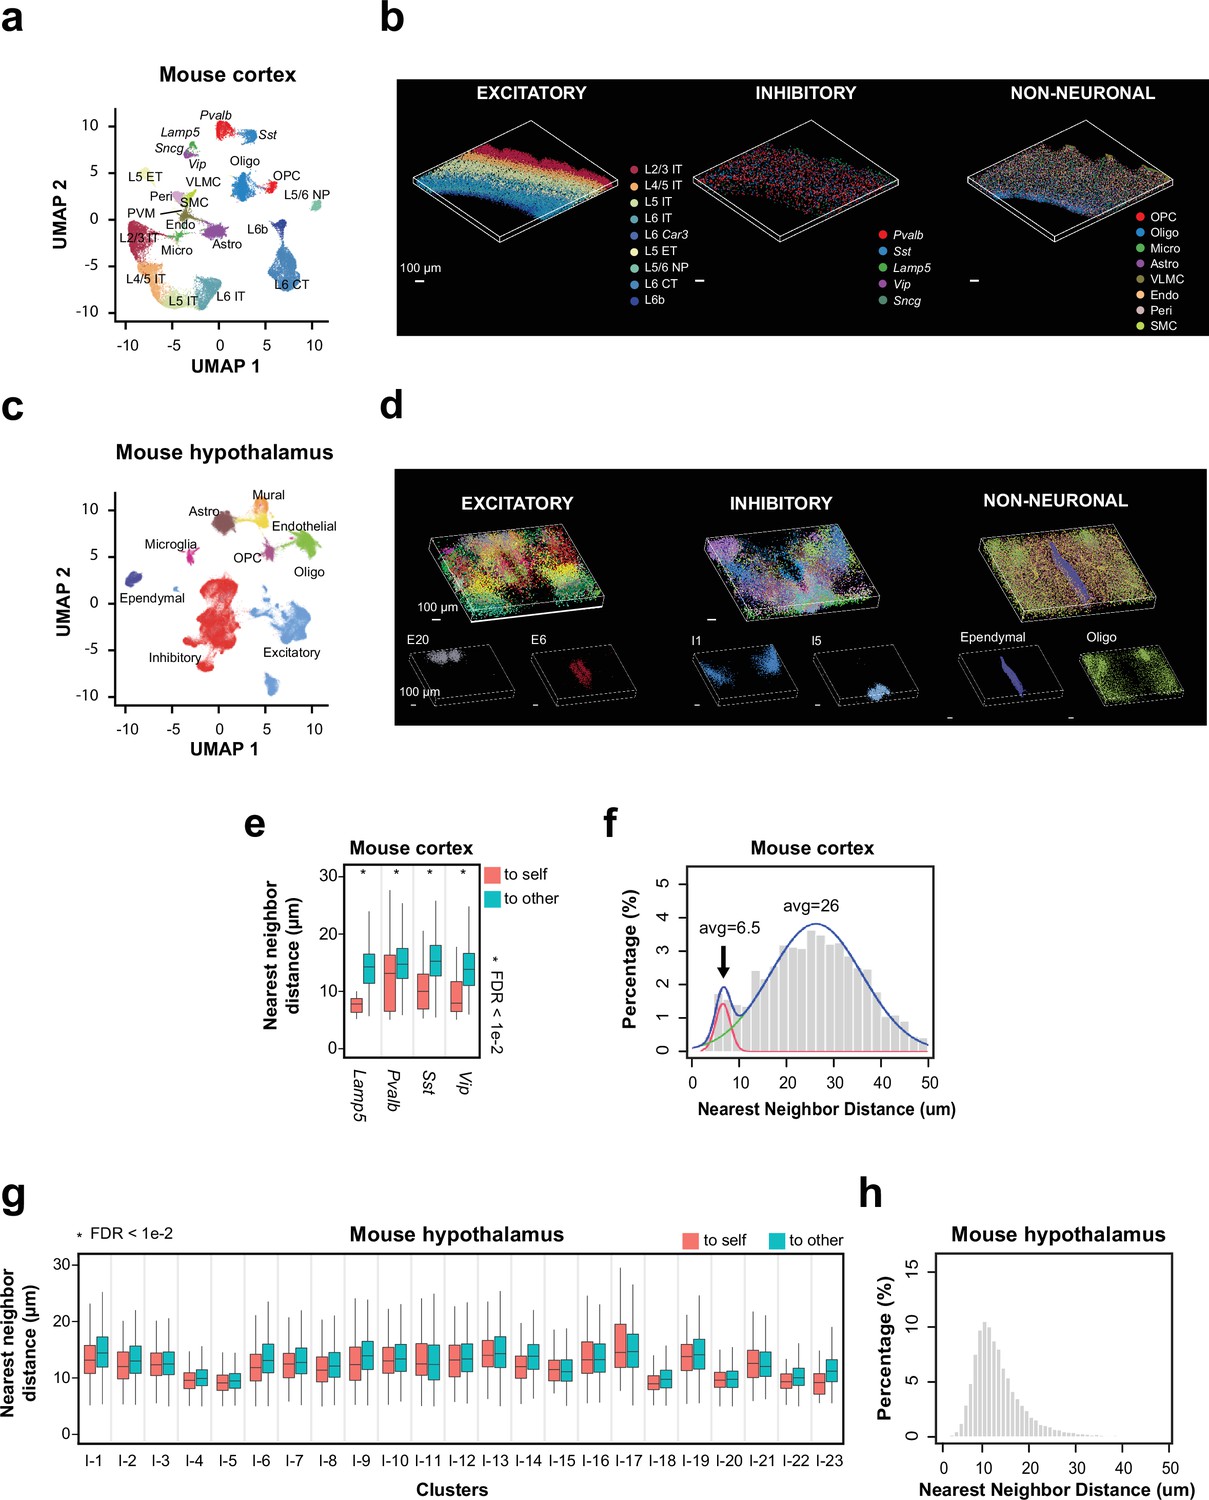
Spatial organization of cell types in the mouse cortex and hypothalamus by 3D thick-tissue MERFISH.
(a) UMAP visualization of subclasses of cells identified in a 100-μm-thick section of the mouse cortex. Cells are color coded by subclass identities. IT: intratelencephalic projection neurons; ET: extratelencephalic projection neurons; CT: cortical-thalamic projection neurons; NP: near projection neurons; OPC: oligodendrocyte progenitor cells; Oligo: oligodendrocytes; Micro: microglia; Astro: astrocytes; VLMC: vascular leptomeningeal cells; Endo: endothelial cells; Peri: pericytes; SMC: smooth muscle cells; PVM: perivascular macrophages. (b) 3D spatial maps of the identified subclasses of excitatory neurons (left), inhibitory neurons (middle), and non-neuronal cells (right) within the 100 μm mouse cortex section. (c) UMAP visualization of major cell types identified in a 200-μm-thick section of the mouse anterior hypothalamus. Cells are color coded by cell type identities. (d) 3D spatial maps of the excitatory neuronal (left), inhibitory neuronal (middle), and non-neuronal (right) cell clusters identified in the 200-μm-thick mouse hypothalamus section. Cells are color coded by cell cluster identities in the top panels and two example excitatory neuronal (left), inhibitory neuronal (middle), and non-neuronal (right) cell clusters are shown in the bottom panels. (e) Boxplots showing the distributions of the nearest-neighbor distances from cells in individual inhibitory neuronal subclasses to cells in the same subclass (‘to self’) or other subclasses (‘to other’) in the mouse cortex obtained from the thick-tissue 3D MERFISH data. Cell numbers (n, from left to right): 44, 274, 125, 1161, 136, 797, 26, 330. *FDR <0.01 was determined with the Wilcoxon rank-sum one-sided test and adjusted to FDR by the Benjamini and Hochberg procedure. Only inhibitory neuronal clusters with at least 20 ‘self-self’ interacting pairs were examined and plotted. In each boxplot, the midline represents the median value, the box represents the interquartile range (IQR), the lower whisker represents the smaller of the minimum data point or 1.5× IQR below the 25th percentile, and the upper whisker represents the greater of the maximum data point or 1.5× IQR above the 75th percentile. (f) Distributions of the nearest-neighbor distances among all interneurons derived from the thick-tissue 3D MERFISH data of the mouse cortex. The distribution is fitted with a bimodal distribution (blue curve) with the two individual Gaussian peaks shown in red and green. (g, h) Same as (e, f) but for inhibitory neurons in the mouse anterior hypothalamus obtained from the thick-tissue 3D MERFISH data. Cell numbers in g (n, from left to right): 1404, 1222, 198, 567, 845, 1315, 866, 1263, 1149, 873, 455, 1517, 387, 1490, 409, 1321, 277, 1151, 773, 1871, 379, 830, 174, 1013, 598, 449, 811, 158, 194, 728, 103, 771, 119, 667, 217, 580, 98, 704, 1095, 1339, 186, 362, 82, 438, 41, 302. Data in this figure were generated from a 200-μm-thick section of the hypothalamic region collected from an adult mouse.
-
Figure 3—source data 1
This source data file contains source data for Figure 3e-h.
- https://cdn.elifesciences.org/articles/90029/elife-90029-fig3-data1-v1.xlsx
Figure 3—figure supplement 1
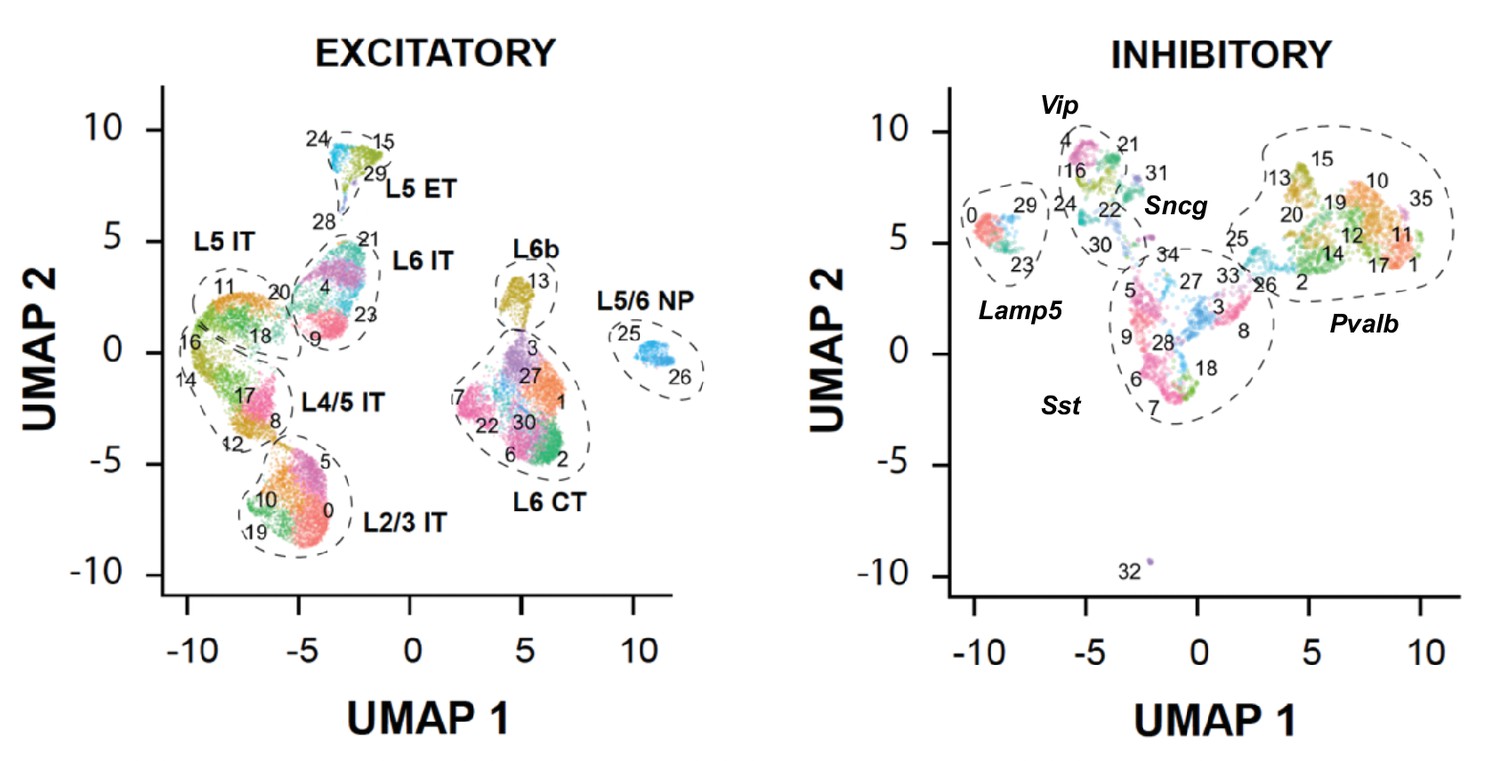
Neuronal clusters identified in the 100-µm-thick section of the mouse cortex.
UMAP visualization of excitatory (left) and inhibitory (right) neuronal clusters is shown with each cell colored by their cluster identities.
Figure 3—figure supplement 2
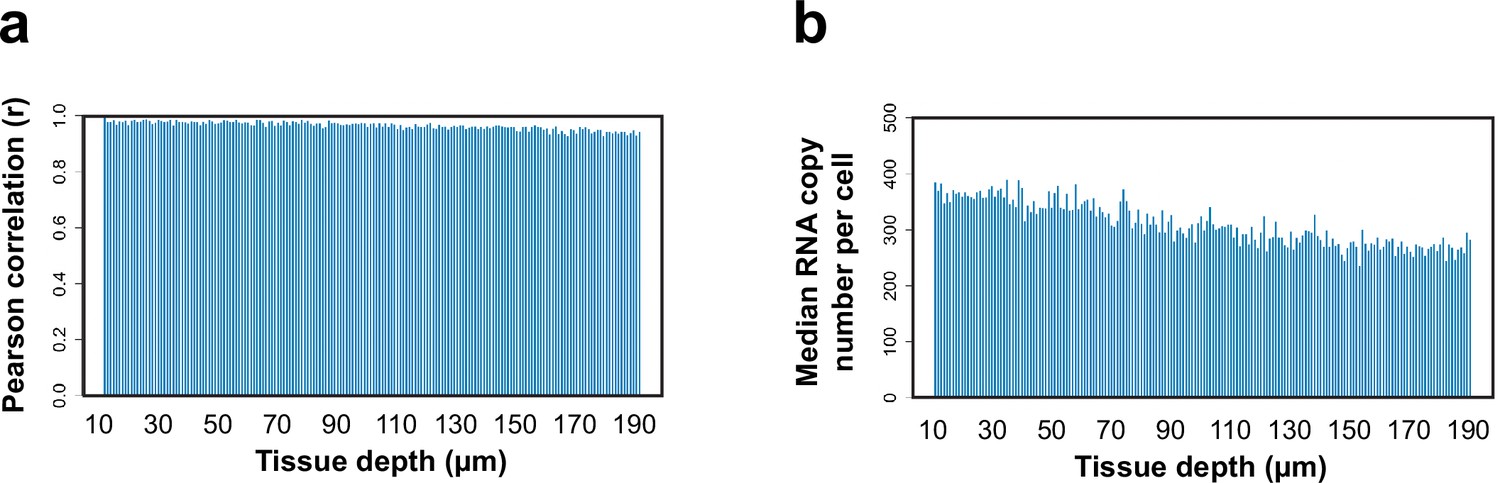
3D MERFISH imaging of 156 genes in a 200-µm-thick section of the mouse hypothalamus.
(a) The Pearson correlation coefficient of the RNA copy number for individual genes at different tissue depths versus those in the initial 1 µm range of the 200-µm-thick section of the mouse hypothalamus. (b) The median RNA copy numbers per cell at different tissue depths of the 200-µm-thick section. The first and last 10 µm were excluded from the analysis because some of the cells captured in these z-ranged were incompletely captured.
-
Figure 3—figure supplement 2—source data 1
This source data file contains source data for Figure 3—figure supplement 2a and b.
- https://cdn.elifesciences.org/articles/90029/elife-90029-fig3-figsupp2-data1-v1.xlsx
Figure 3—figure supplement 3
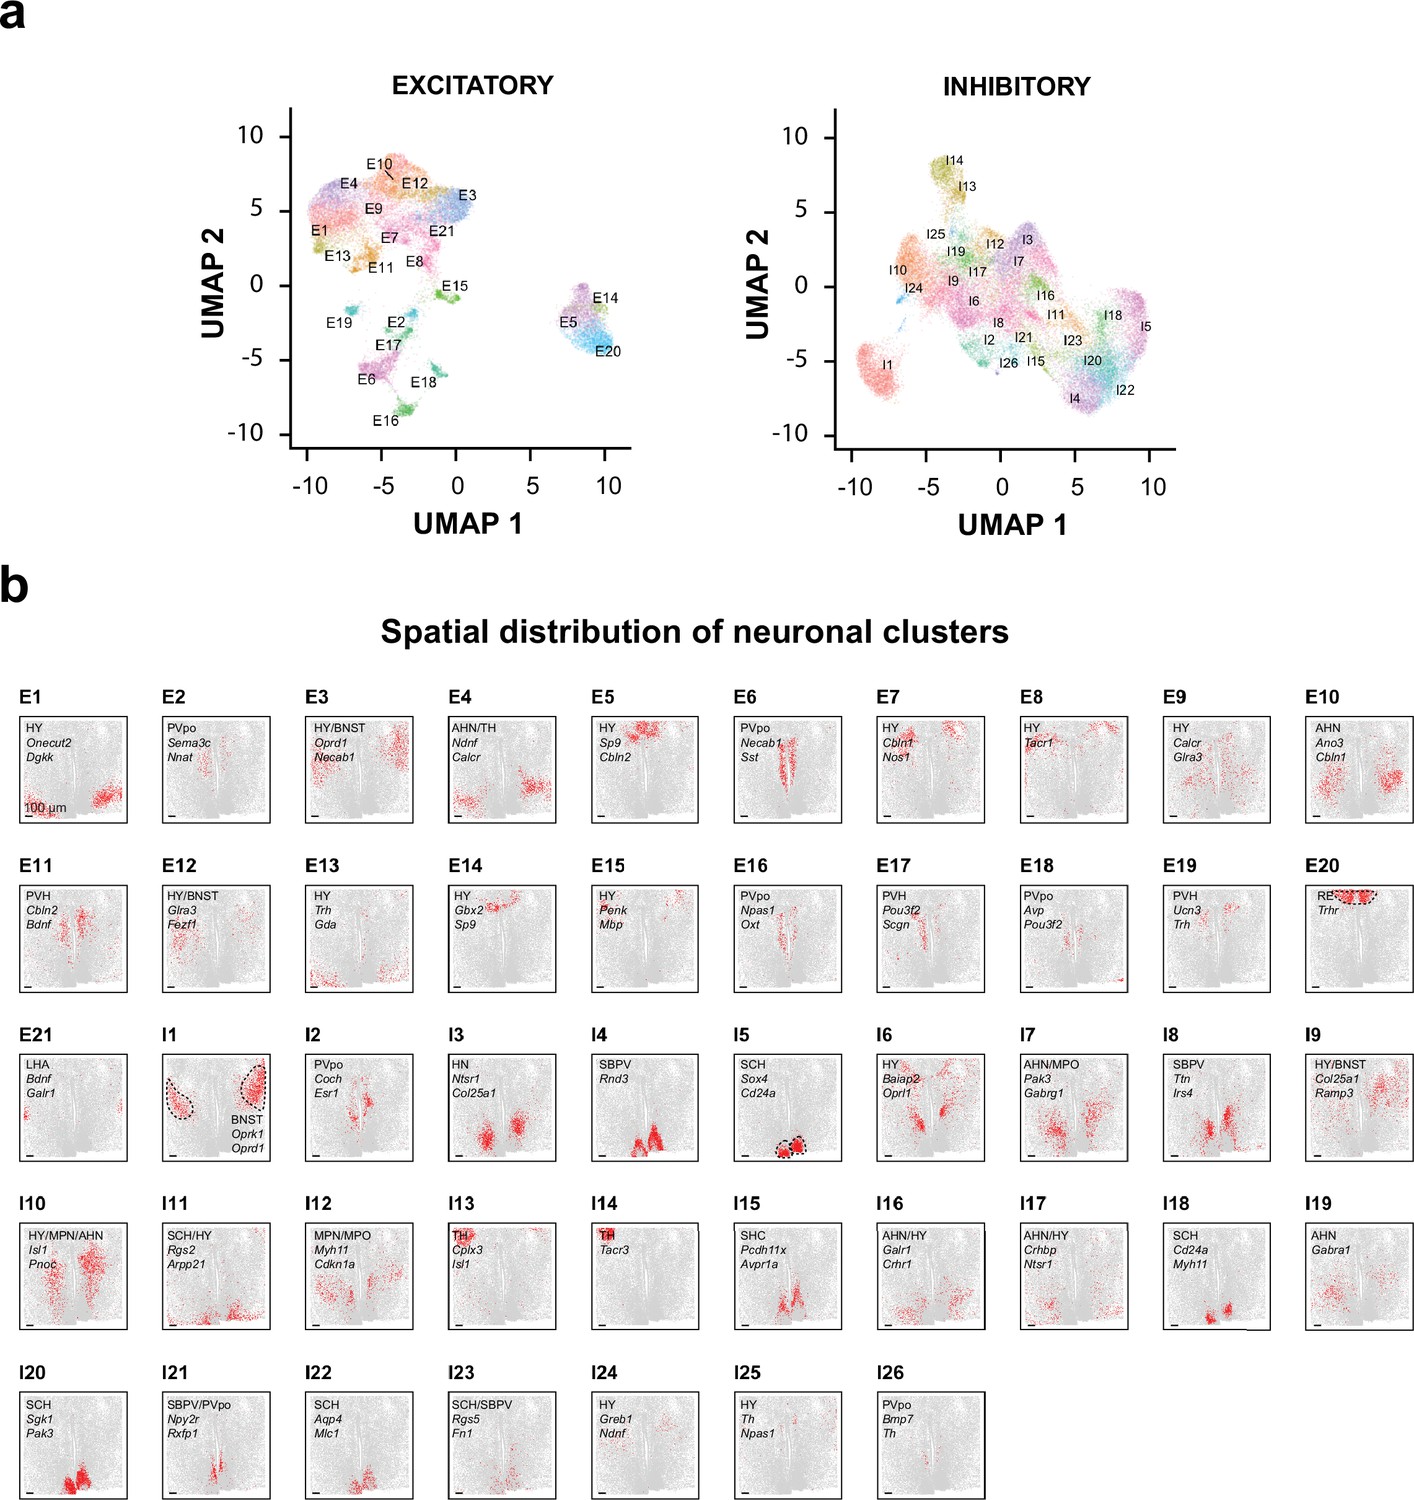
Transcriptionally distinct cell clusters identified in a 200-µm-thick section of the mouse hypothalamus.
(a) UMAP visualization of excitatory and inhibitory neuronal clusters identified in the 200-µm-thick section, with each cell colored by their cluster identities. (b) 2D spatial maps of individual excitatory and inhibitory neuronal clusters. The hypothalamus nuclei in which each cluster is primarily localized, and one or two notable genes of each cluster are listed for individual clusters. For three example clusters, E20, I1, and I5, the hypothalamus nucleus containing the indicated cluster is marked by dashed lines.
Figure 3—figure supplement 4

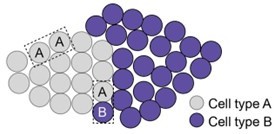
Examples of tightly juxtaposed interneuron pairs and distribution of cell diameters across different cell types.
(a) Two examples of tightly juxtaposed interneuron pairs in the mouse cortex, marked by the dashed box (left). Different colors indicate distinct interneuron subclasses. A zoomed-in view of the interacting interneurons is shown, visualized by polyT staining (middle) and DAPI staining (right). (b) Distribution of cell diameter size across various cell types identified in a 100-µm-thick section of the mouse cortex. In each boxplot, the midline represents the median value, the box represents the interquartile range (IQR), the lower whisker represents the smaller of the minimum data point or 1.5× IQR below the 25th percentile, and the upper whisker represents the greater of the maximum data point or 1.5× IQR above the 75th percentile. Cell number (n, from left to right): 2994, 17727, 8124. (c) One example of tightly juxtaposed interneuron pairs in the mouse hypothalamus, marked by the dashed box (left). Interneurons are marked in red and the other cell types are marked in gray. A zoomed-in view of the interacting interneurons is shown, visualized by polyT staining (middle) and DAPI staining (right).
-
Figure 3—figure supplement 4—source data 1
This source data file contains source data for Figure 3—figure supplement 4b.
- https://cdn.elifesciences.org/articles/90029/elife-90029-fig3-figsupp4-data1-v1.xlsx
Author response image 1
Tables
Key resources table
| Reagent type (species) or resource | Designation | Source or reference | Identifiers | Additional information |
|---|---|---|---|---|
| Biological sample (Mus musculus) | C57BL/6J | The Jackson Laboratory | JAX: 000664 (RRID:IMSR_JAX:000664) | Brain tissue collection |
| Software, algorithm | MERlin | https://github.com/rx3fang/MERlin/releases/tag/v3.0.0-elife | https://doi.org/10.5281/zenodo.13356943 | 3D MERFISH decoding pipeline |
| Software, algorithm | storm-control | https://github.com/ZhuangLab/storm-control, copy archived at ZhuangLab, 2023 | https://doi.org/10.5281/zenodo.3264857 | MERFISH microscope control |
| Software, algorithm | Seurat V3 | Stuart et al., 2019 | https://doi.org/10.1016/j.cell.2019.05.031 | |
| Software, algorithm | BigStitcher | Hörl et al., 2019 | https://doi.org/10.1038/s41592-019-0501-0 | |
| Software, algorithm | CSBdeep | Weigert et al., 2018 | https://doi.org/10.1038/s41592-018-0216-7 | |
| Software, algorithm | Cellpose 2.0 | Pachitariu and Stringer, 2022 | https://doi.org/10.1038/s41592-022-01663-4 | |
| Chemical compound, drug | Tris (2-carboxyethyl) phosphine Hydrochloride | Gold Bio | 51805-45-9 | |
| Chemical compound, drug | Ethylene carbonate | Sigma | E26258 | |
| Chemical compound, drug | 40% Acrylamide/Bis Solution, 19:1 | Bio-Rad | 1610144 | |
| Chemical compound, drug | 3,4-Dihydroxybenzoic acid | Sigma | P5630 | |
| Chemical compound, drug | 6-Hydroxy-2,5,7,8-tetramethylchroman-2-carboxylic acid (trolox) | Sigma | 238813-1G | |
| Chemical compound, drug | Gel Slick Solution | Lonza | 50640 | |
| Chemical compound, drug | Dextran sulfate | Sigma | D8906 | |
| Chemical compound, drug | Low Melting Point Agarose | Thermo Fisher | 16520050 | |
| Chemical compound, drug | Paraformaldehyde | Electron Microscopy Sciences | 15714 | |
| Peptide, recombinant protein | Proteinase K | New England Biolabs | P8107S | |
| Peptide, recombinant protein | Protocatechuate 3,4-dioxygenase (rPCO) | OYC Americas | 46852904 | |
| Peptide, recombinant protein | RNase Inhibitor, Murine | New England Biolabs | M0314L | |
| Other | Yeast tRNA | Life Technologies | 15401-011 | Blocking agent used during RNA labeling |
| Other | FluoSpheres YG 0.1 um | Thermo Fisher | F8803 | Used as fiduciary markers |
| Other | DAPI | Thermo Fisher | D1306 | Used to label the cell nucleus |
| Sequence-based reagent | MERFISH encoding probes for cortex | Zhang et al., 2021 | https://doi.org/10.35077/g.21 | Supplementary file 2 |
| Sequence-based reagent | MERFISH encoding probes for hypothalamus | Moffitt et al., 2018; modified in this work | Supplementary file 5 | |
| Sequence-based reagent | polyA anchor probe | IDT | /5Acryd/TTGAGTGGATGGAGTGTAATT+TT +TT+TT+TT+TT+TT+TT+TT+TT+T | |
| Sequence-based reagent | Dye-labeled readout probes | Bio-Synthesis | Supplementary file 3 |
Additional files
-
Supplementary file 1
MERFISH codebook for 242-gene measurement.
The first column is the gene name, the second column is the Ensembl transcript ID, and the following columns indicate the binary values for each of the 22 bits indicated by name of the corresponding readout sequence. Barcodes that were used as blank controls are denoted by a gene name that begins with ‘Blank-.’
- https://cdn.elifesciences.org/articles/90029/elife-90029-supp1-v1.xlsx
-
Supplementary file 2
MERFISH encoding probe information for 242-gene measurement.
For each encoding probe, the encoding probe sequence, and the gene name and Ensembl ID of the targeted transcript are provided.
- https://cdn.elifesciences.org/articles/90029/elife-90029-supp2-v1.xlsx
-
Supplementary file 3
Readout probe information.
For each of the bits, the bit number, the readout probe sequence name, the readout probe sequence, the dye label and the detected color channel are indicated.
- https://cdn.elifesciences.org/articles/90029/elife-90029-supp3-v1.xlsx
-
Supplementary file 4
MERFISH codebook for 156-gene measurement.
The first column is the gene name, the second column is the Ensembl transcript ID, and the following columns indicate the binary values for each of the 20 bits indicated by name of the corresponding readout sequence. Barcodes that were used as blank controls are denoted by a gene name that begins with ‘Blank-.’
- https://cdn.elifesciences.org/articles/90029/elife-90029-supp4-v1.xlsx
-
Supplementary file 5
MERFISH encoding probe information for 156-gene measurement.
For each encoding probe, the encoding probe sequence, and the gene name and Ensembl ID of the targeted transcript are provided.
- https://cdn.elifesciences.org/articles/90029/elife-90029-supp5-v1.xlsx
-
Supplementary file 6
Imaging platforms used for specific data acquisition.
The first column is the data used in specific figures, the second column is the setup ID used for taking this dataset, the third column is the specific spinning disk confocal model used for taking this dataset, and the fourth column is the objective used for taking this dataset.
- https://cdn.elifesciences.org/articles/90029/elife-90029-supp6-v1.xlsx
-
MDAR checklist
- https://cdn.elifesciences.org/articles/90029/elife-90029-mdarchecklist1-v1.docx
Download links
A two-part list of links to download the article, or parts of the article, in various formats.
Downloads (link to download the article as PDF)
Open citations (links to open the citations from this article in various online reference manager services)
Cite this article (links to download the citations from this article in formats compatible with various reference manager tools)
Three-dimensional single-cell transcriptome imaging of thick tissues
eLife 12:RP90029.
https://doi.org/10.7554/eLife.90029.3


