Explicit ion modeling predicts physicochemical interactions for chromatin organization
- Department of Chemistry, Massachusetts Institute of Technology, United States
Figures
Figure 1
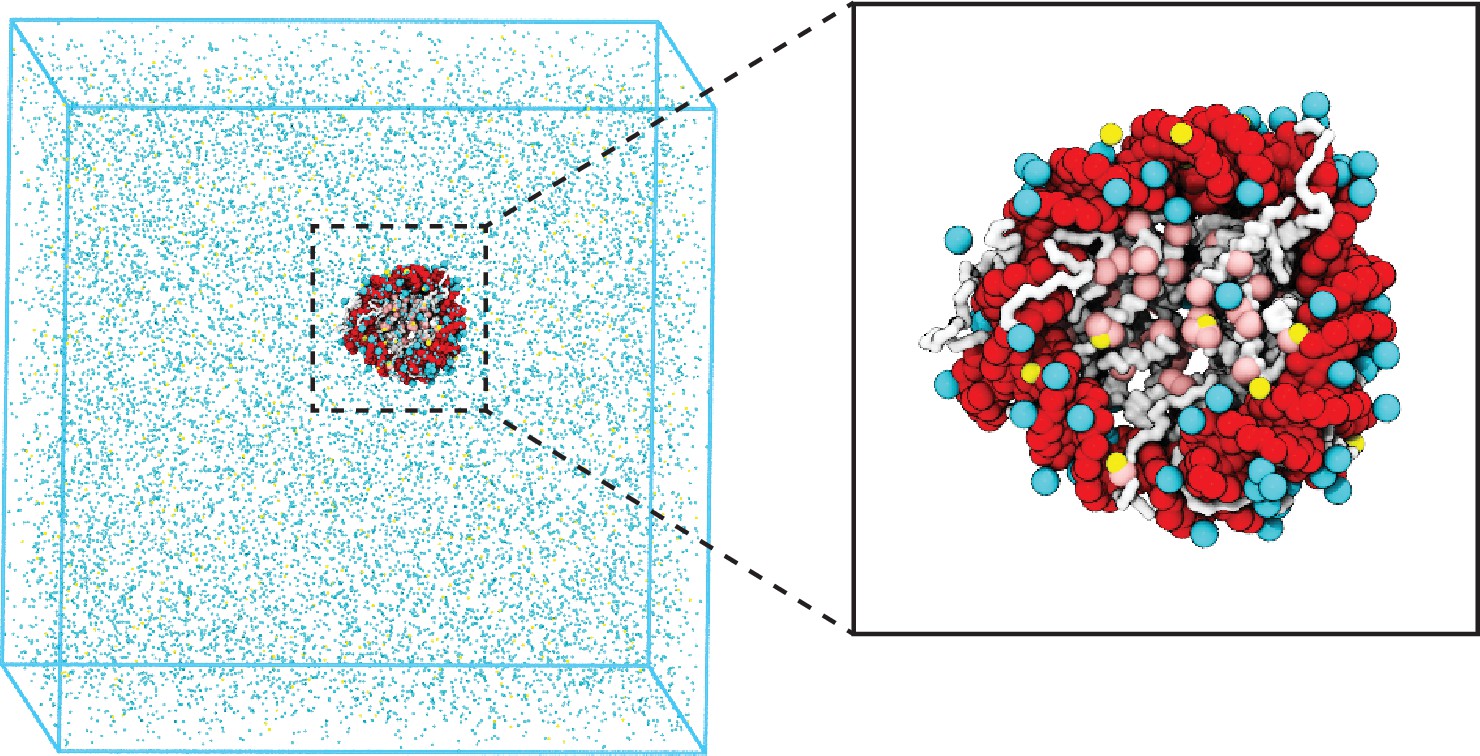
Illustration of the residue-level coarse-grained explicit ion model for chromatin simulations.
The left panel presents a snapshot for the simulation box of a 147 bp nucleosome in a solution of 100 mM NaCl and 0.5 mM MgCl2. The nucleosomal DNA and histone proteins are colored in red and white, respectively. The zoom-in on the right highlights the condensation of ions around the nucleosome, with Na+ in cyan and Mg2+ in yellow. Negative residues of the histone proteins are colored in pink.
Figure 2 with 1 supplement
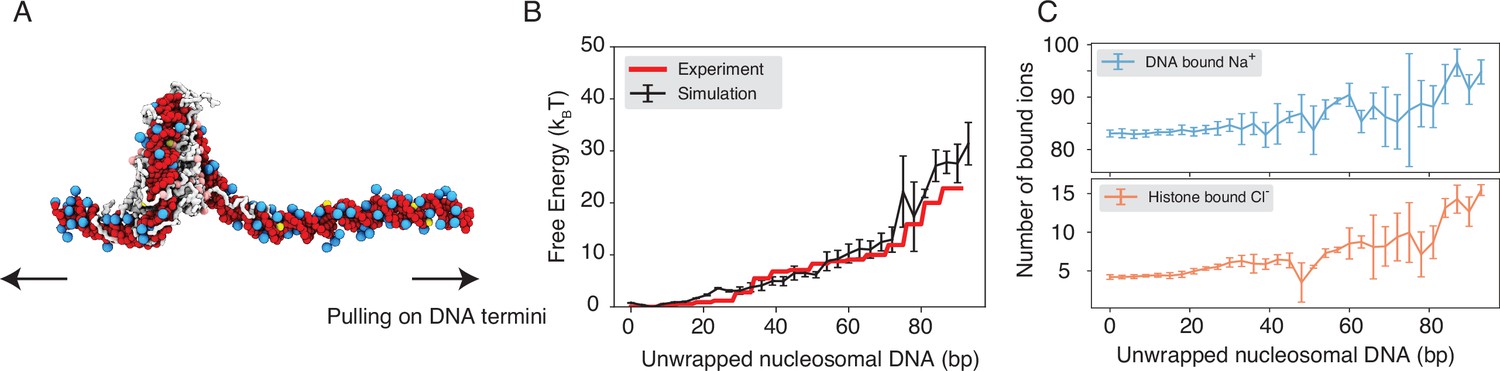
Explicit ion modeling reproduces the energetics of nucleosomal DNA unwrapping.
(A) Illustration of the umbrella simulation setup using the end-to-end distance between two DNA termini as the collective variable. The same color scheme as in Figure 1 is adopted. Only ions close to the nucleosomes are shown for clarity. (B) Comparison between simulated (black) and experimental (red) free energy profile as a function of the unwrapped DNA base pairs. Error bars were computed as the standard deviation of three independent estimates. (C) The average number of Na+ ions within 10 Å of the nucleosomal DNA (top) and Cl−ions within 10 Å of histone proteins (bottom) are shown as a function of the unwrapped DNA base pairs. Error bars were computed as the standard deviation of three independent estimates.
Figure 2—figure supplement 1

The explicit ion model predicts the binding affinities of protein-DNA complexes well, related to Figure 1 of the main text.
Experimental and simulated binding free energies are compared for nine protein-DNA complexes (Privalov et al., 2011), with a Pearson correlation coefficient of 0.6. The PDB ID for each complex is indicated in red, and the diagonal line is drawn in blue. The significant correlation between simulated and experimental values supports the accuracy of the model. To further enhance the agreement between the two, it will be necessary to implement specific non-bonded interactions that can resolve differences among amino acids and nucleotides beyond simple electrostatics. Such modifications will be interesting avenues for future research. See text section ‘Binding free energy of protein-DNA complexes’ for simulation details.
Figure 3 with 1 supplement
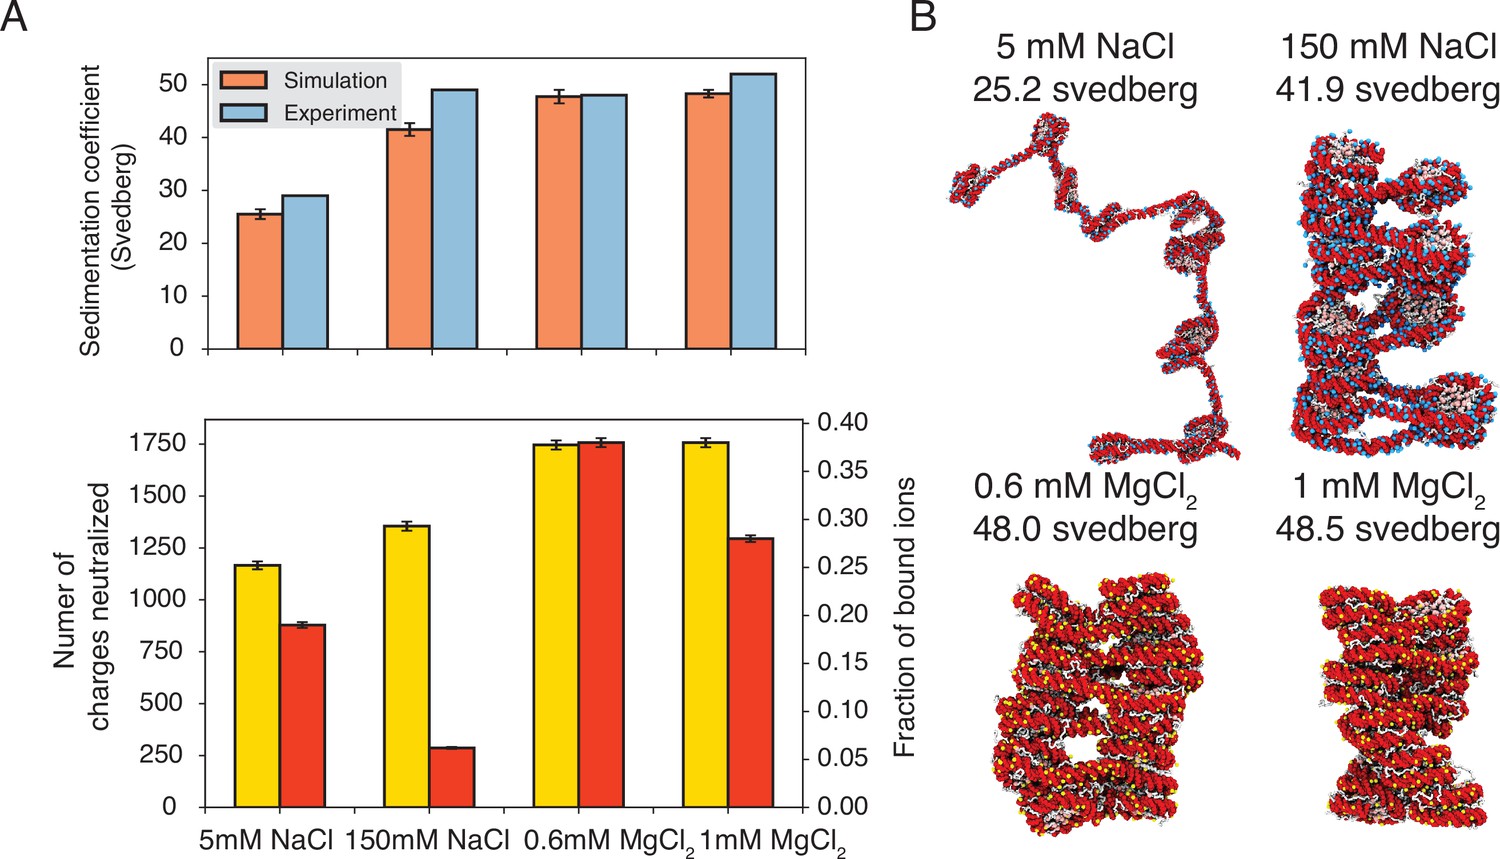
Explicit ion modeling predicts salt-dependent conformations of a 12-mer nucleosome array.
(A) Top: Comparison of simulated and experimental (Correll et al., 2012) sedimentation coefficients of chromatin at different salt concentrations. Bottom: Number of DNA charges neutralized by bound cations (yellow, left y-axis label) and the fraction of ions bound to DNA (red, right y-axis label) at different salt concentrations. The error bars were estimated from the standard deviation of simulated probability distributions (Figure 3—figure supplement 1). (B) Representative chromatin structures with sedimentation coefficients around the mean values at different salt concentrations.
Figure 3—figure supplement 1
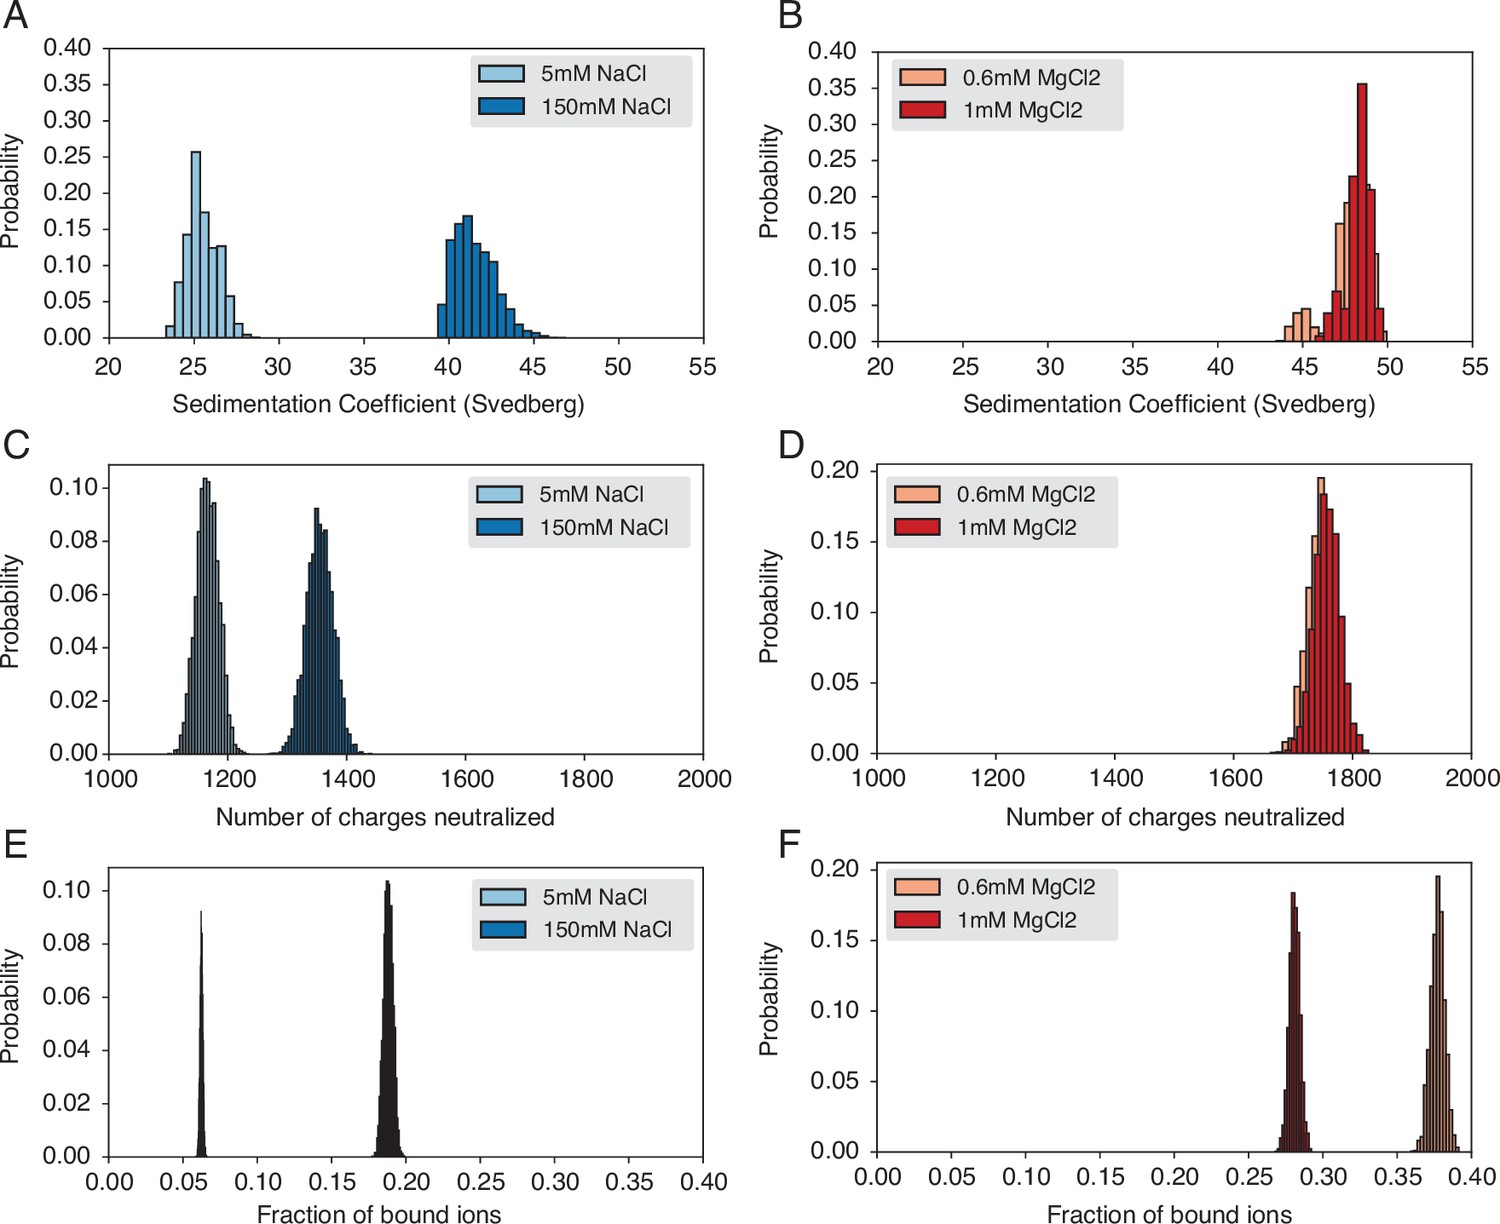
Probability distributions used to compute means and standard deviations of the quantities presented in Figure 3 of the main text.
(A) Probability distribution of sedimentation coefficients calculated from the simulation with Na+ ions. (B) Probability distribution of sedimentation coefficients calculated from the simulation with Mg2+ ions. (C) Probability distribution of neutralized charges calculated from the simulation with Na+ ions. (D) Probability distribution of neutralized charges calculated from the simulation with Mg2+ ions. (E) Probability distribution of the fraction of bound ions calculated from the simulation with Na+ ions. (F) Probability distribution of the fraction of bound ions calculated from the simulation with Mg2+ ions.
Figure 4 with 4 supplements
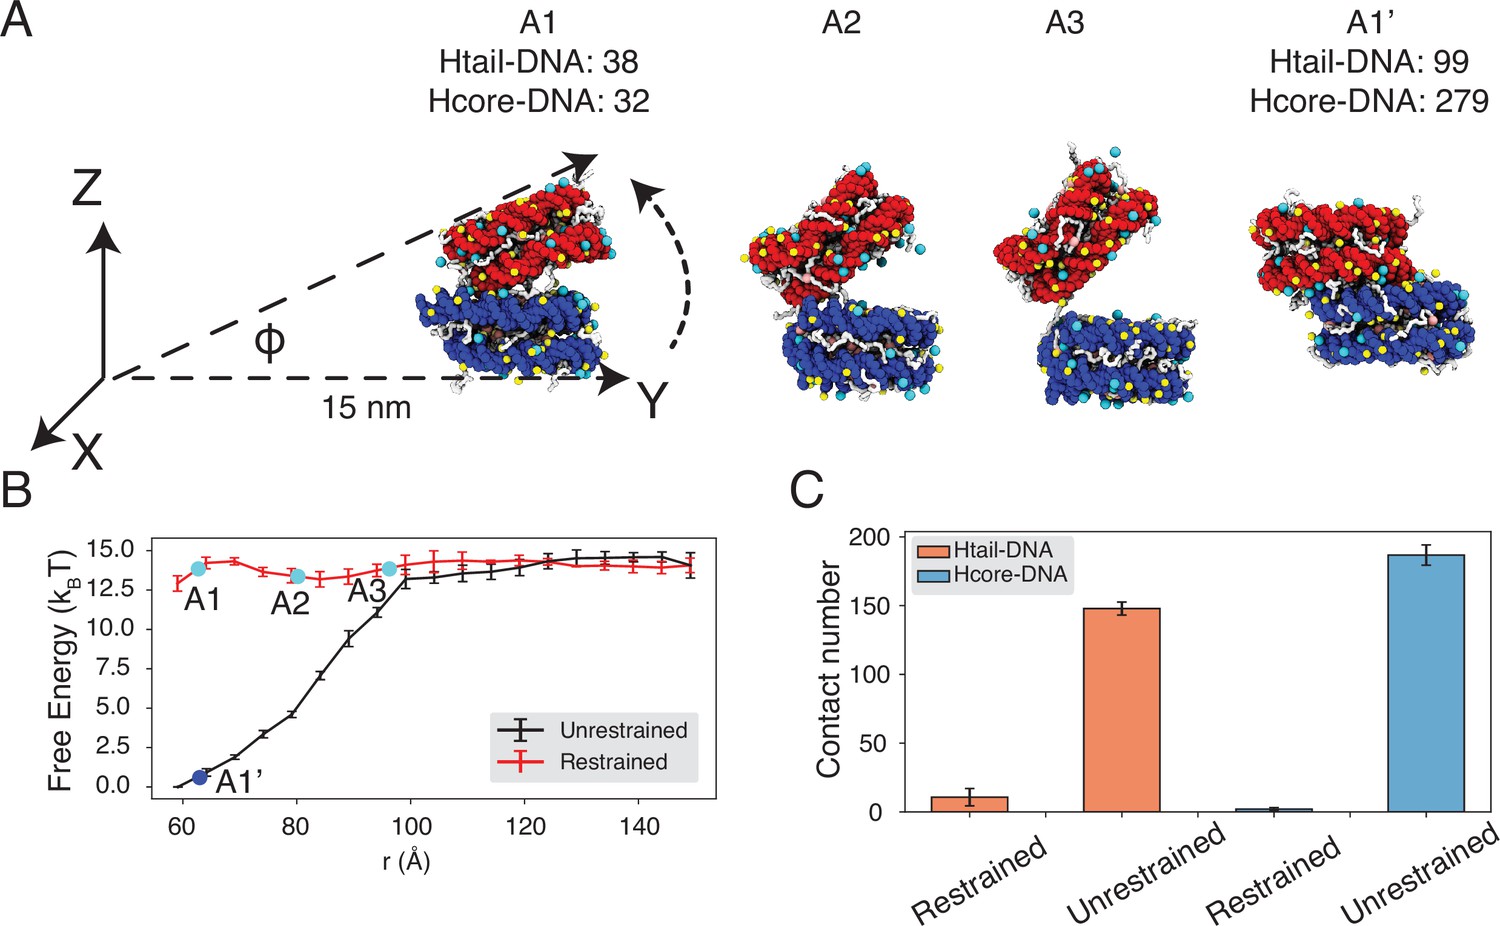
Close contacts give rise to strong inter-nucleosomal interactions.
(A) Illustration of the simulation protocol employed to mimic the nucleosome unbinding pathway dictated by the DNA-origami device (Funke et al., 2016). The three configurations, A1, A2, and A3, corresponding to the three cyan dots in part B at distances 62.7, 80.2, and 96.3 Å. For comparison, a tightly bound configuration uncovered in simulations without any restraints of nucleosome movement is shown as A1’. The number of contacts formed by histone tails and DNA (Htail-DNA) and by histone core and DNA (Hcore-DNA) from different nucleosomes is shown for A1 and A1’. (B) Free energy profile as a function of the distance between the geometric centers of the two nucleosomes, computed from unrestrained (black) and DNA-origami-restrained simulations (red). Error bars were computed as the standard deviation of three independent estimates. (C) Average inter-nucleosomal contacts between DNA and histone tail (orange) and core (blue) residues, computed from unrestrained and DNA-origami-restrained simulations. Error bars were computed as the standard deviation of three independent estimates.
Figure 4—figure supplement 1
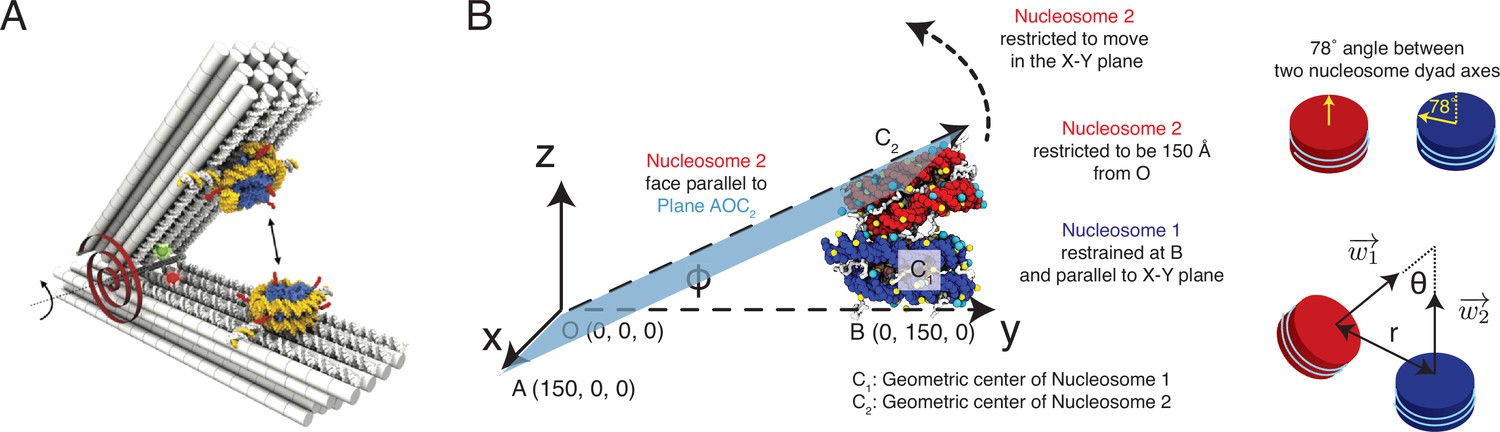
Illustration of the restrained two nucleosome simulations setup, related to Figure 4 of the main text.
(A) Schematics of the DNA-origami-based force spectrometer, reproduced from Figure 1 of Funke et al., 2016. (B) Schematics for the spatial restraints imposed on nucleosomes in our simulations to mimic the DNA-origami setup. The vertex angle between two arms of the DNA-origami system is denoted by . The two cartoons on the side illustrate the angle between two nucleosome dyad axes and the angle between two nucleosome planes. To define the coordinate system and other notations, please refer to section ‘Simulations at high salt concentrations’ and the accompanying text.
Figure 4—figure supplement 2
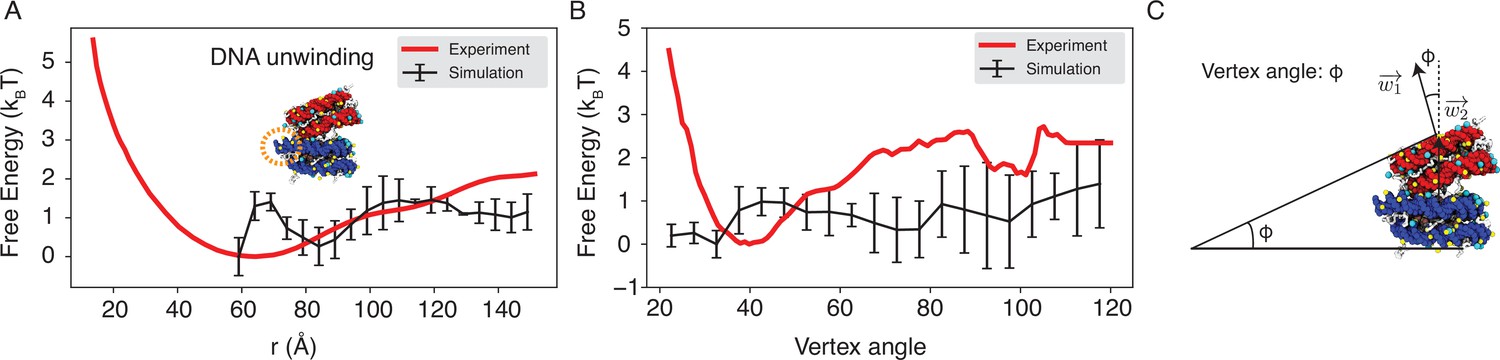
Explicit ion modeling reproduces the experimental free energy profiles of nucleosome binding.
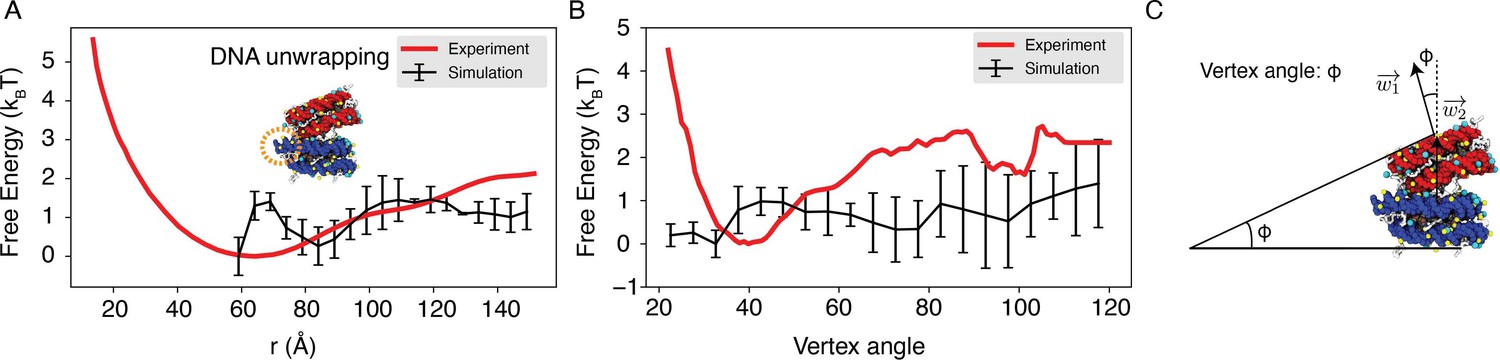
(A) Comparison between the simulated (black) and experimental (red) free energy profile as a function of the inter-nucleosome distance. Error bars were computed as the standard deviation of three independent estimates. The barrier observed between 60 Å and 80 Å arises from the unwinding of nucleosomal DNA when the two nucleosomes are in close proximity, as highlighted in the orange circle. (B) Comparison between the simulated (black) and experimental (red) free energy profile as a function of the vertex angle. Error bars were computed as the standard deviation of three independent estimates. (C) Illustration of the vertex angle used in panel (B).
Figure 4—figure supplement 3
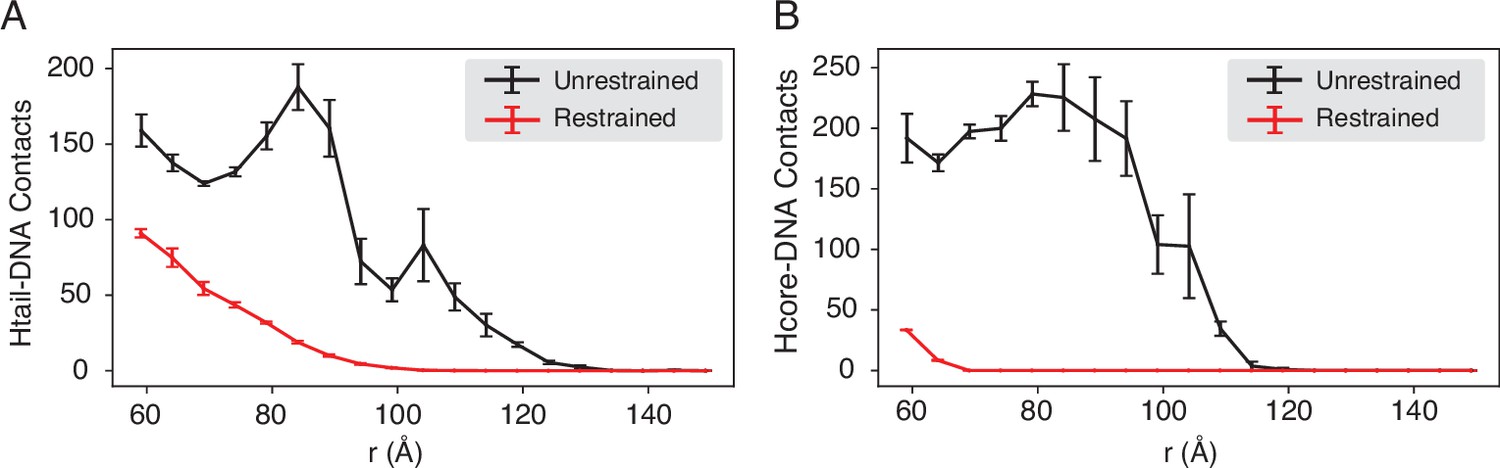
Compared with DNA-origami-restrained simulations, the unrestrained simulations produce more histone-DNA contacts across nucleosomes, related to Figure 4 of the main text.
The average number of inter-nucleosome contacts between DNA and histone tails (A) or histone cores (B) is plotted as a function of the distance . The error bars were estimated as the standard deviation of three equal partitions of the simulations.
Figure 4—figure supplement 4

The unrestricted simulations favor a smaller angle between two nucleosomal planes compared to the DNA-origami-restrained simulations, related to Figure 4 of the main text.
(A) Illustration of the collective variables used in the umbrella-sampling simulation. is the angle between two nucleosomal planes, and is the distance between the geometric centers of two nucleosomes. and represent the vectors perpendicular to the nucleosome planes. See text section ‘Simulations at high salt concentrations’ for further definitions of the collective variables. (B) 2D free energy landscape for nucleosome interactions under 35 mM NaCl and 11 mM MgCl2 salt, plotted as a function of and . (C) The average value of as a function of the distance for the unrestricted (red) and the DNA-origami-restrained (black) simulations. The error bars were estimated as the standard deviation of three equal partitions of the simulations.
Figure 5 with 3 supplements

Simulations predict significant inter-nucleosome interactions at physiological conditions.
(A) Illustration of the collective variable, , defined as the angle between two nucleosomal planes, and defined as the distance between the nucleosome geometric centers. and represent the axes perpendicular to the nucleosomal planes. (B) The 2D binding free energy profile as a function of and at the physiological salt condition (150 mM NaCl and 2 mM MgCl2) for nucleosomes with the 601 sequence. (C) Dependence of nucleosome binding free energy on nucleosome repeat length (NRL) and linker histone H1.0. Error bars were computed as the standard deviation of three independent estimates. (D) Representative structure showing linker histones (red and blue) mediating inter-nucleosomal contacts.
Figure 5—figure supplement 1
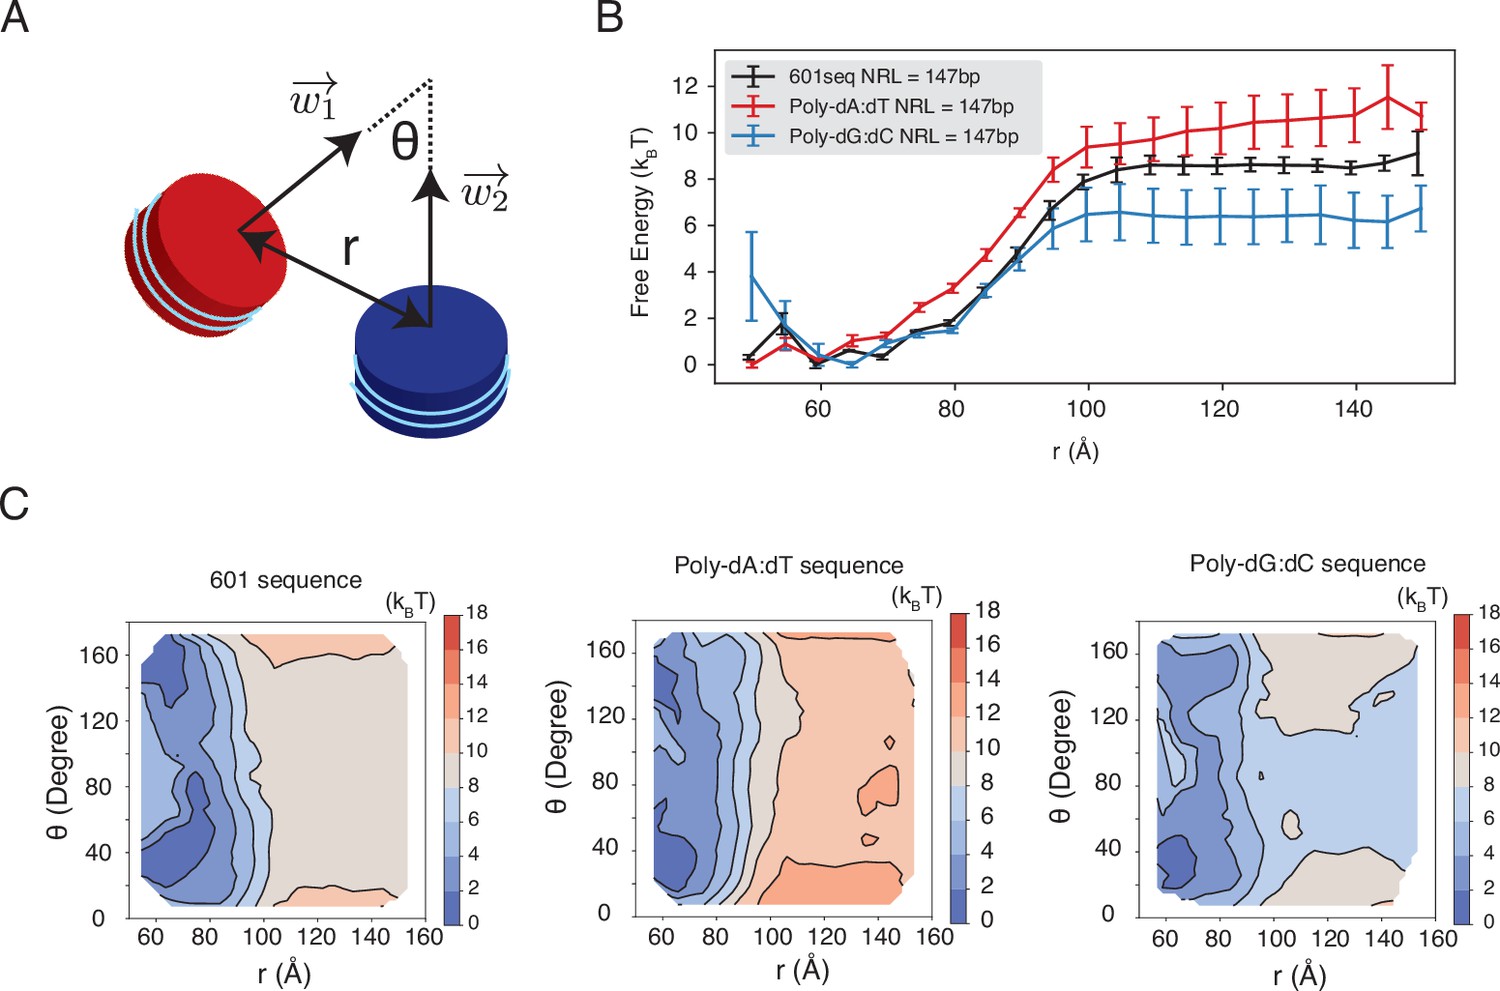
Dependence of inter-nucleosome interactions on the DNA sequence, related to Figure 5 of the main text.
See text section ‘Simulations at the physiological salt concentration’ for further discussions on simulation details. (A) Illustration of the collective variables used in umbrella-sampling simulations. is the angle between two nucleosomal planes, and is the distance between the geometric centers of two nucleosomes. and represent the vectors perpendicular to the nucleosome planes. (B) The free energy profile as a function of the distance between the geometric centers of two nucleosomes with 601, poly-dA:dT, and poly-dG:dC sequences. Error bars were computed as the standard deviation of three independent estimates. (C) The 2D free energy profiles as a function of and . The simulations used nucleosomes with 601, poly-dA:dT, and poly-dG:dC sequences.
Figure 5—figure supplement 2

The poly-dA:dT sequence produces a higher number of cross-nucleosome histone-DNA contacts compared to the poly-dG:dC sequence, related to Figure 5 of the main text.
(A) The average number of inter-nucleosome contacts between histone proteins and nucleosomal DNA is plotted as a function of the distance between the geometric centers of two nucleosomes. The error bars were estimated as the standard deviation of three equal partitions of the simulations. (B) Representative structures from simulations with poly-dA:dT (left) and poly-dG:dC (right) nucleosomes. Noticeable DNA unwrapping can be seen in poly-dA:dT nucleosomes, contributing to the increased cross-nucleosome contacts.
Figure 5—figure supplement 3
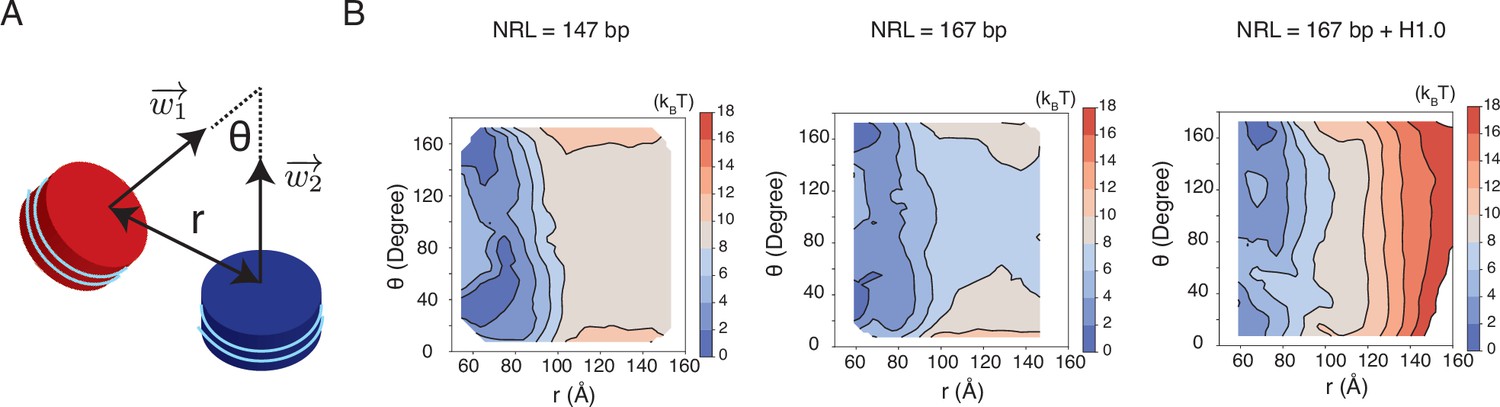
Free energy profiles for the interactions between a pair of nucleosomes at different nucleosome repeat lengths (NRL) and in the presence of the linker histone H1.0, related to Figure 5 of the main text.
See text section ‘Simulations at the physiological salt concentration’ for further discussions on simulation details. (A) Illustration of the collective variables used in the umbrella-sampling simulations. is the angle between two nucleosome planes, and is the distance between the geometric centers of two nucleosomes. and represent the vectors perpendicular to the nucleosome planes. (B) 2D free energy profiles as a function of and for the three systems indicated in the titles.
Appendix 1—figure 1
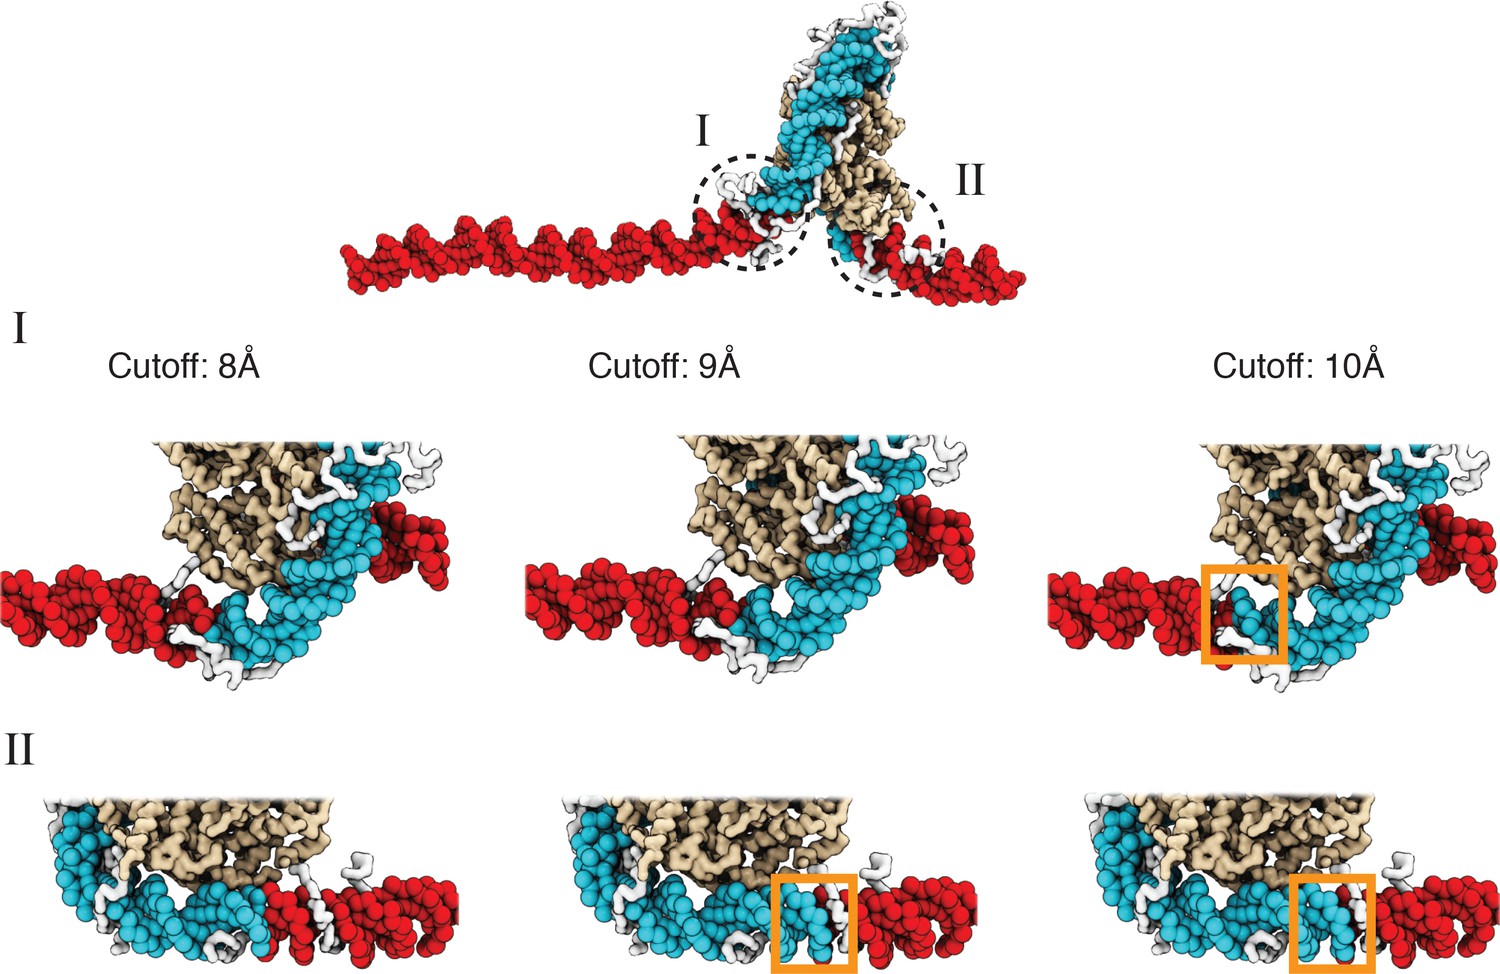
A cutoff value of 8.0 Å produces more accurate values for the number of unwrapped DNA base pairs as determined from visual inspection of representative configurations, related to Figure 2 of the main text.
See text section ‘Number of unwrapped DNA base pairs’ for additional discussions. A typical nucleosome structure with most of the outer layer DNA unwrapped was used to examine the impact of different cutoff values. The histone core is colored in gold, with histone tails in white, the wrapped DNA in blue, and the unwrapped DNA in red. The discrepancy among various cutoff values is evident in the highlight regions enclosed by dotted circles. As shown in the zoom-ins in the middle panel, a cutoff of 10 Å results in three additional base pairs of DNA detected as wrapped in I (highlighted in orange square). However, these extra base pairs not detected with a cutoff of 8 Å are visibly detached from histone proteins. Similarly, 9 Å and 10 Å cutoff values result in five extra base pairs of DNA detected as wrapped in II (highlighted in orange squares in the bottom panel).
Author response image 1
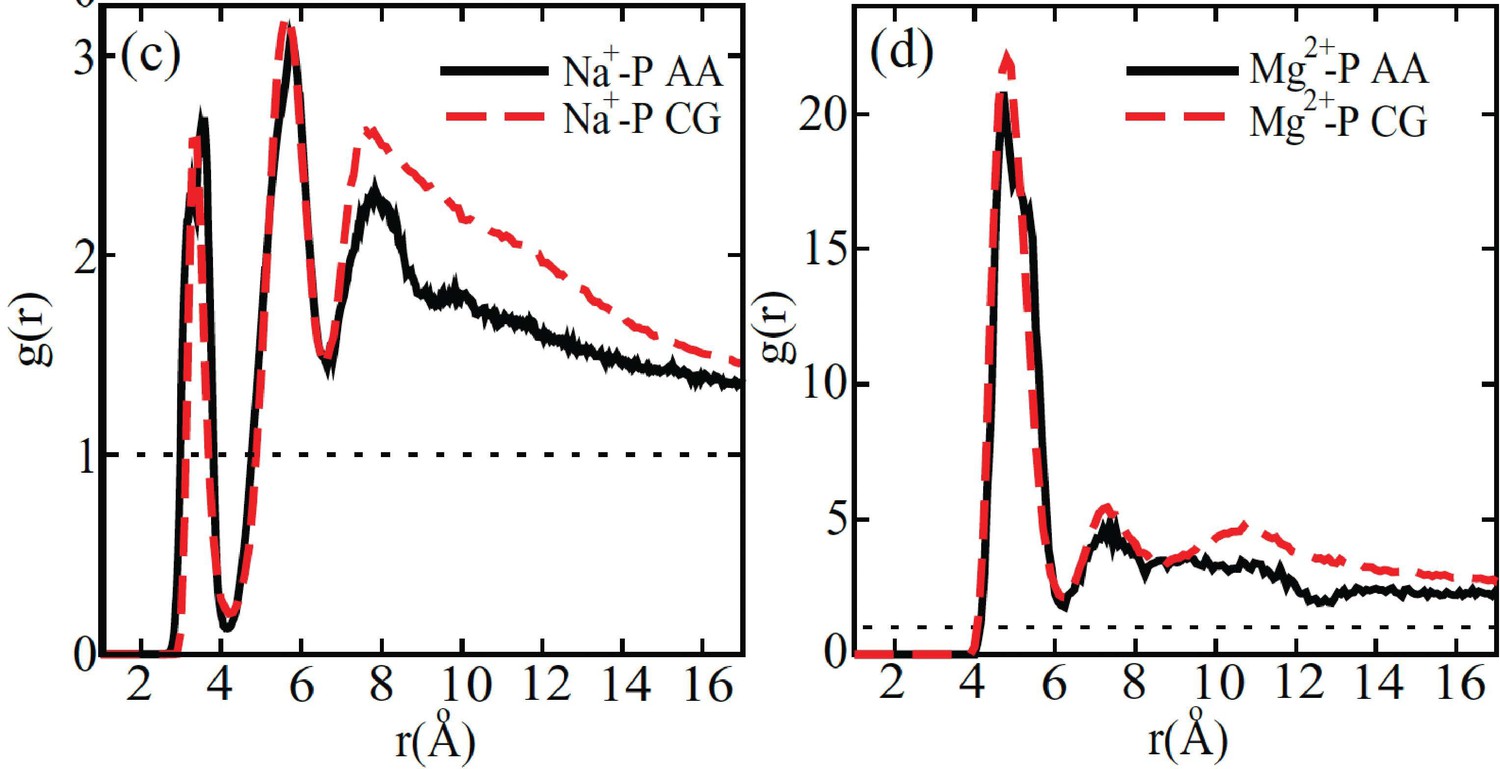
Comparison between the radial distribution functions of Na+ (left) and Mg2+ (right) ions around the DNA phosphate groups computed from all-atom (black) and coarse-grained (red) simulations.
Figure reproduced from Figure 4 of [1]. The coarse-grained explicit ion model used in producing the red curves is identical to the one presented in the current manuscript.
© 2011, AIP Publishing. This figure is reproduced with permission from Figure 4 in Freeman GS, Hinckley DM, de Pablo JJ (2011) A coarse-grain three-site-pernucleotide model for DNA with explicit ions. The Journal of Chemical Physics 135:165104. It is not covered by the CC-BY 4.0 license and further reproduction of this figure would need permission from the copyright holder.
Author response image 2

Three-dimensional distribution of sodium ions around the nucleosome determined from all-atom explicit solvent simulations.
Darker blue colors indicate higher sodium density and high density of sodium ions around the DNA is clearly visible. The crystallographically identified acidic patch has been highlighted as spheres on the surface of the histone core and a high level of sodium condensation is observed around these residues. Figure reproduced from [2].
© 2009, American Chemical Society. This figure is reproduced with permission from Figure 7 in Materese CK, Savelyev A, Papoian GA (2009) Counterion Atmosphere and Hydration Patterns near a Nucleosome Core Particle. J. Am. Chem. Soc. 131:15005–15013.. It is not covered by the CC-BY 4.0 license and further reproduction of this figure would need permission from the copyright holder.
Author response image 3
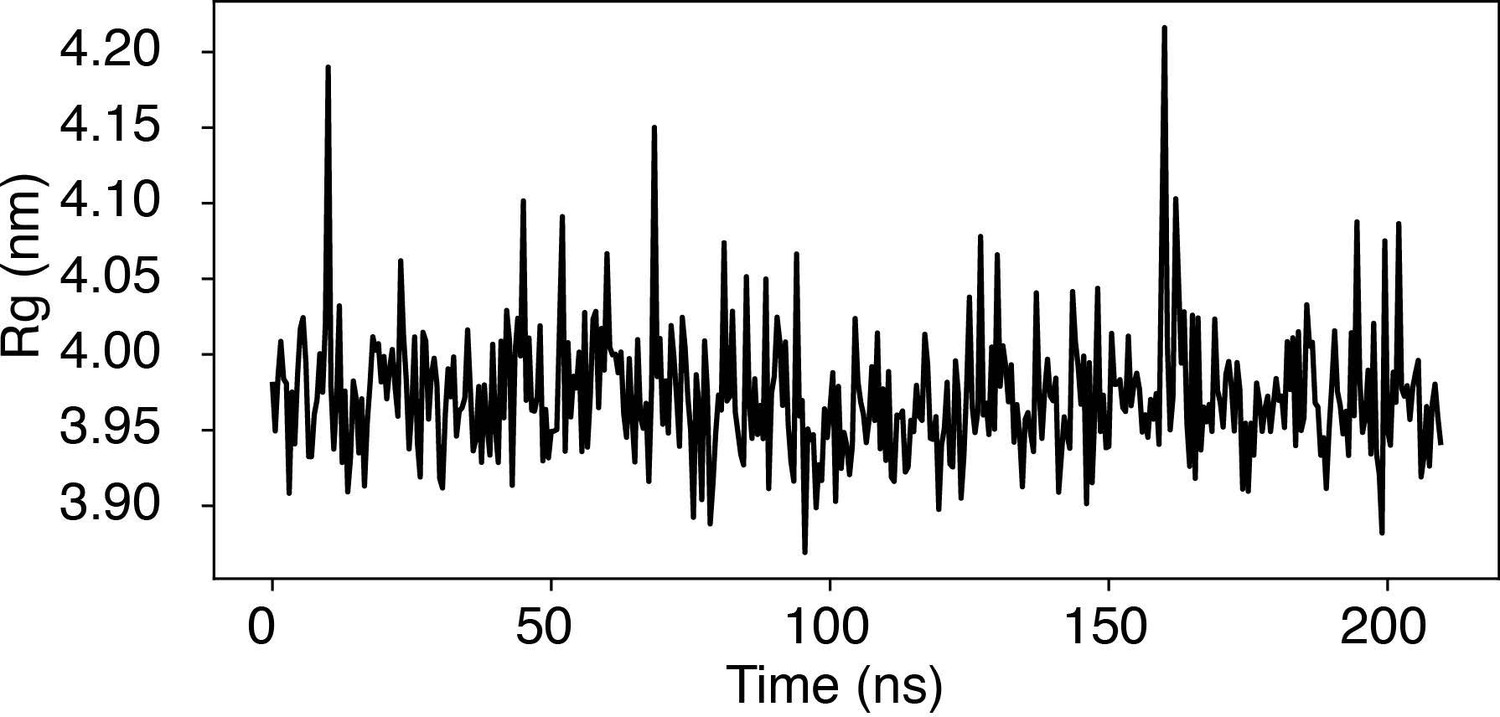
Time trace of the radius of gyration (Rg) of a nucleosome with the 601-sequence along an unbiased, equilibrium trajectory.
It is evident the Rg fluctuates around the value found in the PDB structure (3.95 nm), supporting the stability of the nucleosome in our simulation.
Author response image 4

The explicit-ion model predicts the binding affinities of protein-DNA complexes well, related to Fig.
1 of the main text. Experimental and simulated binding free energies are compared for nine protein-DNA complexes [cite], with a Pearson Correlation coefficient of 0.6. The PDB ID for each complex is indicated in red, and the diagonal line is drawn in blue. The significant correlation between simulated and experimental values supports the accuracy of the model. To further enhance the agreement between the two, it will be necessary to implement specific non-bonded interactions that can resolve differences among amino acids and nucleotides beyond simple electrostatics. Such modifications will be interesting avenues for future research. See text Section: Binding free energy of protein-DNA complexes for simulation details.
Author response image 5

Revised main text Figure 5, with Figure 5D modified for improved visual clarity.
Author response image 6
Explicit ion modeling reproduces the experimental free energy profiles of nucleosome binding.
(A) Comparison between the simulated (black) and experimental (red) free energy profile as a function of the inter-nucleosome distance. Error bars were computed as the standard deviation of three independent estimates. The barrier observed between 60Å and 80Å arises from the unwinding of nucleosomal DNA when the two nucleosomes are in close proximity, as highlighted in the orange circle. (B) Comparison between the simulated (black) and experimental (red) free energy profile as a function of the vertex angle. Error bars were computed as the standard deviation of three independent estimates. (C) Illustration of the vertex angle Φ used in panel (B).
Tables
Table 1
Summary of parameters used to describe interactions between ions and charged particles.
See text section ‘Coarse-grained explicit ion model’ for definitions of various parameters.
| Coarse-grained pair | (kcal/mol) | (Å) | (Å) | (Å) | (kcal/mol) | (Å) | (Å) | (kcal/mol) | (Å) | (Å) |
|---|---|---|---|---|---|---|---|---|---|---|
| P-P | 0.18379 | 6.86 | 6.86 | 0.5 | – | – | – | – | – | – |
| Na+-P | 0.02510 | 4.14 | 3.44 | 1.25 | 3.15488 | 4.1 | 0.57 | 0.47801 | 6.5 | 0.4 |
| Na+-AA+* | 0.239 | 4.065 | 3.44 | 1.25 | 3.15488 | 4.1 | 0.57 | – | – | – |
| Na+-AA−† | 0.239 | 4.065 | 3.44 | 1.25 | 3.15488 | 4.1 | 0.57 | 0.47801 | 6.5 | 0.4 |
| Mg2+-P | 0.1195 | 4.87 | 3.75 | 1.0 | 1.29063 | 6.1 | 0.5 | 0.97992 | 8.3 | 1.2 |
| Mg2+-AA+ | 0.239 | 3.556 | 3.75 | 1.0 | 1.29063 | 6.1 | 0.5 | – | – | – |
| Mg2+-AA− | 0.239 | 3.556 | 3.75 | 1.0 | 1.29063 | 6.1 | 0.5 | 0.97992 | 8.3 | 1.2 |
| Cl−-P | 0.08121 | 5.5425 | 4.2 | 0.5 | 0.83652 | 6.7 | 1.5 | – | – | – |
| Cl−-AA+ | 0.239 | 4.8725 | 4.2 | 0.5 | 0.83652 | 6.7 | 1.5 | 0.47801 | 5.6 | 0.4 |
| Cl−-AA− | 0.239 | 4.8725 | 4.2 | 0.5 | 0.83652 | 6.7 | 1.5 | – | – | – |
| Na+-Na+ | 0.01121 | 2.43 | 2.7 | 0.57 | 0.17925 | 5.8 | 0.57 | – | – | – |
| Na+-Mg2+ | 0.04971 | 2.37 | 2.37 | 0.5 | – | – | – | – | – | – |
| Na+-Cl− | 0.08387 | 3.1352 | 3.9 | 2.06 | 5.49713 | 3.3 | 0.57 | 0.47801 | 5.6 | 0.4 |
| Mg2+-Mg2+ | 0.89460 | 1.412 | 1.412 | 0.5 | – | – | – | – | – | – |
| Mg2+-Cl− | 0.49737 | 4.74 | 4.48 | 0.57 | 1.09943 | 5.48 | 0.44 | 0.05975 | 8.16 | 0.35 |
| Cl−-Cl− | 0.03585 | 4.045 | 4.2 | 0.56 | 0.23901 | 6.2 | 0.5 | – | – | – |
-
*
Positive amino acids.
-
†
Negative amino acids.
Table 2
Summary of parameters used to describe the WCA interactions between ions and neutral particles.
See text section ‘Coarse-grained explicit ion model’ for definitions of various parameters.
| Coarse-grained pair | (kcal/mol) | (Å) |
|---|---|---|
| Na+-S* | 0.239 | 4.315 |
| Na+-A† | 0.239 | 3.915 |
| Na+-T‡ | 0.239 | 4.765 |
| Na+-G§ | 0.239 | 3.665 |
| Na+-C¶ | 0.239 | 4.415 |
| Na+-AA** | 0.239 | 4.065 |
| Mg2+-S | 0.239 | 3.806 |
| Mg2+-A | 0.239 | 3.406 |
| Mg2+-T | 0.239 | 4.256 |
| Mg2+-G | 0.239 | 3.156 |
| Mg2+-C | 0.239 | 3.906 |
| Mg2+-AA** | 0.239 | 3.556 |
| Cl−-S | 0.239 | 5.1225 |
| Cl−-A | 0.239 | 4.7225 |
| Cl−-T | 0.239 | 5.5725 |
| Cl−-G | 0.239 | 4.4725 |
| Cl−-C | 0.239 | 5.2225 |
| Cl−-AA** | 0.239 | 4.8725 |
-
*
Sugar.
-
†
Adenine base.
-
‡
Thymine base.
-
§
Guanine base.
-
¶
Cytosine base.
-
**
Non-charged amino acids.
Table 3
Summary of simulation setups used in this study.
Additional simulation details can be found in text section ‘Molecular dynamics simulation details’.
| Studies | Box size (nm3) | Number of Na+ | Number of Mg2+ | Number of Cl− |
|---|---|---|---|---|
| Single nucleosome 100 mM NaCl+0.5 mM MgCl2 | 216,000 | 13,017 | 65 | 13,003 |
| Twelve nucleosomes 5 mM NaCl | 1,331,000 | 6196 | 0 | 4006 |
| Twelve nucleosomes 150 mM NaCl | 216,000 | 21,695 | 0 | 19,505 |
| Twelve nucleosomes 0.6 mM MgCl2 | 3,375,000 | 0 | 2314 | 2438 |
| Twelve nucleosomes 1 mM MgCl2 | 3,375,000 | 0 | 3127 | 4064 |
| Two 147 bp 601-seq nucleosomes 35 mM NaCl+11 mM MgCl2 | 125,000 | 2922 | 828 | 4290 |
| Two 147 bp 601-seq nucleosomes 150 mM NaCl+2 mM MgCl2 | 216,000 | 19,505 | 260 | 19,737 |
| Two 147 bp poly-dA:dT nucleosomes 150 mM NaCl+2 mM MgCl2 | 216,000 | 19,505 | 260 | 19,737 |
| Two 147 bp poly-dG:dC nucleosomes 150 mM NaCl+2 mM MgCl2 | 216,000 | 19,505 | 260 | 19,737 |
| Two 167 bp 601-seq nucleosomes 150 mM NaCl+2 mM MgCl2 | 216,000 | 19,505 | 260 | 19,657 |
| Two 167 bp 601-seq nucleosomes with H1.0 150 mM NaCl+2 mM MgCl2 | 216,000 | 19,505 | 260 | 19,763 |
Additional files
Download links
A two-part list of links to download the article, or parts of the article, in various formats.
Downloads (link to download the article as PDF)
Open citations (links to open the citations from this article in various online reference manager services)
Cite this article (links to download the citations from this article in formats compatible with various reference manager tools)
Explicit ion modeling predicts physicochemical interactions for chromatin organization
eLife 12:RP90073.
https://doi.org/10.7554/eLife.90073.3


