Aberrant cortical activity, functional connectivity, and neural assembly architecture after photothrombotic stroke in mice
- Neuroscience and Mental Health Institute, University of Alberta, Canada
- Neurochemical Research Unit, University of Alberta, Canada
- Department of Psychiatry, University of Alberta, Canada
Figures
Figure 1

Experimental timeline and methods.
(A) Timeline of experimental procedures, imaging times, and behavioral tests. (B) Glass cranial windows and headplates were implanted 2 weeks prior to beginning habituation protocols in Thy1-GCaMP6S mice. (C) Mice were habituated on the floating homecage, string pull and tapered beam for a period of 2 weeks prior to baseline measurements for behavior. Widefield Ca2 +response maps were used to determine locations for the imaging site located between the cFL and cHL sensory maps at baseline (‘peri-infarct’ imaging region) and imaging site lateral to the cHL at baseline (‘distal’ imaging region). For each Ca2+ imaging session, both imaging regions were imaged for a period of 15 min while simultaneously tracking animal movement within the mobile homecage. After baseline Ca2+ imaging, the somatosensory cFL map was targeted with photothrombosis. Behavioral testing on the string pull task and tapered beam task were performed weekly 1 day prior to the Ca2+ imaging session. After the final cellular Ca2+ imaging session at the 8-week time, stimulus-evoked widefield Ca2+ imaging was once again performed to determine the cFL and cHL somatosensory maps. (D) Representative widefield and two photon calcium imaging at each weekly time. The area of decreased light absorption due to stroke damage is apparent, with its surface area decreasing over time. (E) Neuron Ca2+ traces (ΔF/Fo) for 100 neurons from one example animal pre-stroke (left panel) and 1 week post-stroke (right panel) in the peri-infarct somatosensory imaging region. Lower line graphs demonstrate the tracked movement (mm/s) within the floating homecage corresponding to the Ca2+ traces above.
Figure 2

Photothrombotic stroke results in forelimb representation shift onto adjacent areas of cortex and altered sensory-evoked widefield Ca2+ response properties at 8 weeks post-stroke.
(A) Pseudocolored (ΔF/Fo) montages of representative cFL and cHL responses in S1 of an anesthetized animal pre-stroke and 8-week post-stroke resulting from oscillatory stimulation (1 s, 100 Hz) of the cFL and cHL, respectively. At the 8-week post-stroke time, the cFL map has shifted posterior to its pre-stroke location into the area lateral to the cHL. (B) Mean peak forelimb Ca2+ transient response intensity (ΔF/Fo) measured from the thresholded cortical map area of the cFL. A significant interaction between group and time was found, with post-hoc tests showing a significant decrease in the peak cFL response at 8-week post-stroke compared to pre-stroke (p=0.0055) and compared to 8-week sham (p=0.0277). Mixed Effects Model, Time F(1, 12)=4.151, p=0.0643; Group F(1, 12)=1.909, p=0.1922; Interaction F (1, 12)=6.010, p=0.0305. (C) Thresholded cFL response area (mm2). No main effects or interaction was observed. (D) The stroke group was found to have significantly greater total distance shifted for the forelimb map at the 8-week time compared to sham (p=0.0080). (E) Mean peak forelimb Ca2+ transient response intensity (ΔF/Fo) measured from the distal region ROI lateral to the hindlimb response map. Post-hoc tests show a decrease in distal region peak response intensity at 8 weeks in the stroke group (p=0.0442). Mixed Effects Model, Time F(1, 12)=2.054, p=0.1773; Group F(1, 12)=0.4256, p=0.5264; Interaction F (1, 12)=2.889, p=0.1150. Stroke N=9, Sham N=5. *p<0.05; **p<0.01; ***p<0.001.
Figure 3 with 1 supplement
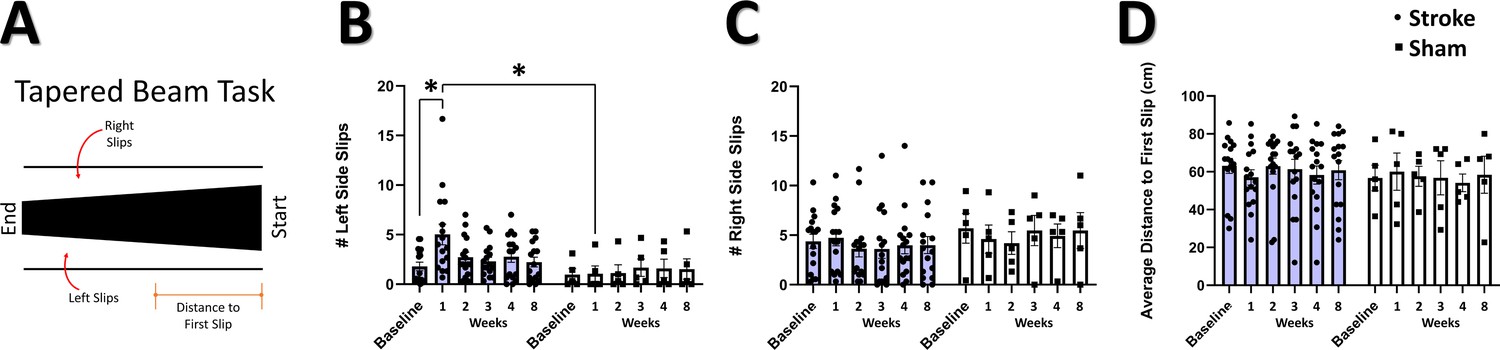
Impaired performance on tapered beam task after stroke.
(A) Illustration of the tapered beam test with the three elements measured; left (contralesional) side slips, right side slips, and distance to first slip. (B) Mean number of left side slips. A significant interaction between time and group was observed, with post-hoc tests showing a greater number of left side slips at 1 week in the stroke group relative to the sham group (=0.0435), and in the stroke group at 1 week relative to baseline (p=0.0125). Mixed Effects Model, Time F (2.007, 38.13)=2.178, p=0.1270; Group F (1, 19)=2.260; p=0.1492; Interaction F(5, 95)=2.914, p=0.0172. (C) Mean number of right-side slips. No main effects or interactions were observed. (D) Distance to first slip. No main effects or interactions were observed. Stroke N=16, Sham N=5. *p<0.05; **p<0.01; ***p<0.001.
Figure 3—figure supplement 1
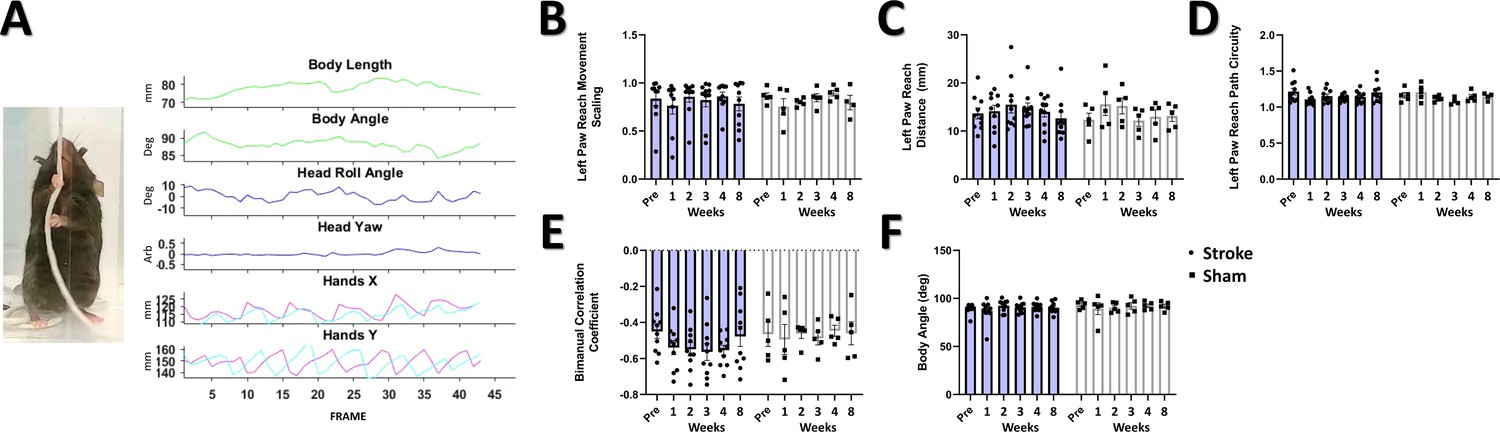
String pull task does not detect a behavioral deficit after stroke.
(A) Left: Image of example animal performing the string pull task at the pre-stroke time. Right: Data for the animal’s body length, body angle, head angle and yaw, and position of the hands is tracked to determine alterations in motor movement across times. No significant main effect or interaction are seen in the left (affected) paw reach movement scaling (B), reach distance, (C), reach path circuity (D), bimanual correlation coefficient (E), or in the animal body angle (F). Stroke N=10, Sham N=5. *p<0.05; **p<0.01; ***p<0.001.
Figure 4 with 1 supplement

Firing rate of neurons in the peri-infarct cortex correlates with performance on the tapered beam task.
(A) Example Ca2+ traces for 40 example neurons at each time point from the peri-infarct imaging region for one example animal in the stroke group. Significant Ca2+ transients are highlighted by red segments. A decrease in the number of Ca2+ transients is visually apparent at 1 week post-stroke. (B) In the peri-infarct imaging region, no main effects or interaction was seen in the average firing rate during animal movement, however post-hoc analysis indicates significantly decreased average firing rate at 1 week in the stroke group relative to pre-stroke (p=0.0124). Mixed Effects Model, Time F (3.217, 39.89)=1.629, p=0.1953; Group F (1, 13)=1.106, p=0.3121; Interaction F (5, 62)=1.079, p=0.3810. A significant main effect of group was seen in the average firing rate at rest (C), with post hoc tests showing a significant decrease a 1 week post-stroke compared to pre-stroke (p=0.0325), a significant decrease at 8 weeks post-sham compared with pre-sham (p=0.0280), and significantly lower at 8 weeks post-sham compared with 8 weeks post-stroke (p=0.0439). Mixed Effects Model, Time F (2.297, 28.48)=1.360, p=0.2742; Group F (1, 13)=6.058, p=0.0286; Interaction F (5, 62)=1.169, p=0.3346. Average firing rate 1 week post-stroke was negatively correlated with the number of left slips in the tapered beam at the same 1 week time during both movement (R2=0.4866, p=0.0038) (D) and rest (R2=0.2965, p=0.0358) (E). In the distal imaging region, no main effects or interaction were found in the average firing rate for movement (F) or at rest (G). No correlation was observed between the moving firing rate at 1 week in the distal region and the number of left slips on the tapered beam (R2=0.0151, p=0.6387) (H). No correlation was observed between the resting firing rate at 1 week in the distal region and the number of left slips on the tapered beam (R2=0.0322, p=0.4910) (I). Peri-infarct region Stroke N=11, Sham N=4. Distal region Stroke N=13, Sham N=4. *p<0.05; **p<0.01; ***p<0.001.
Figure 4—figure supplement 1
Average neuron correlation with animal movement is not detectably altered by stroke.
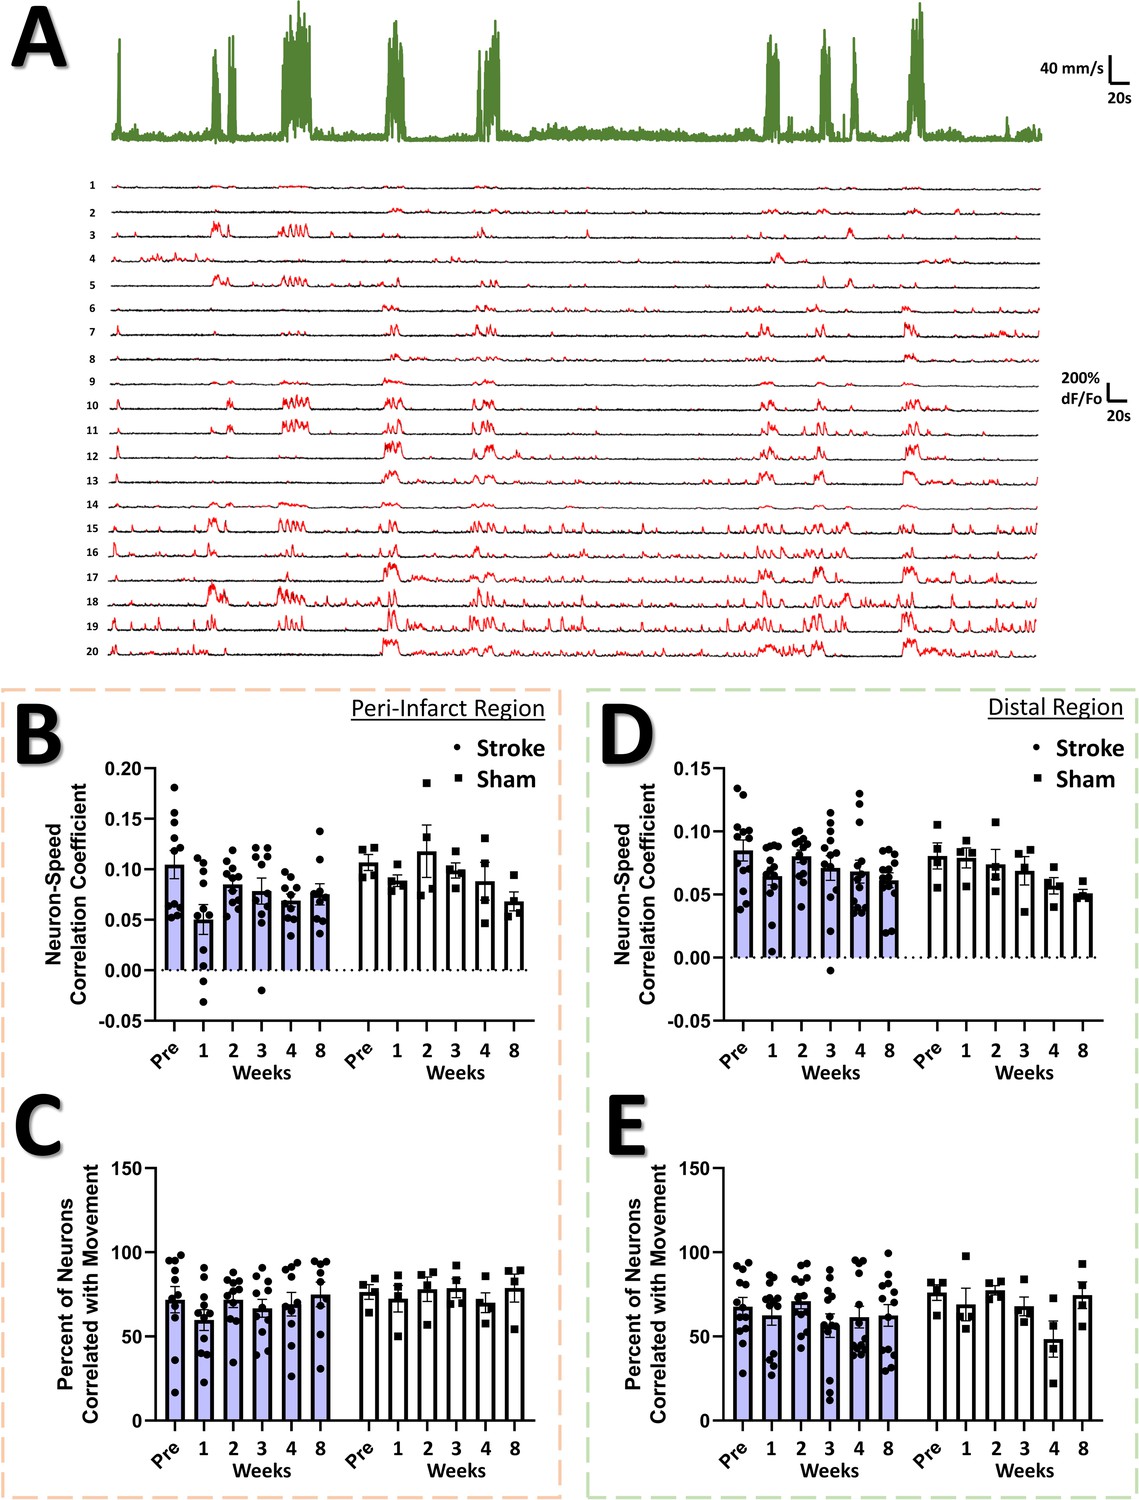
(A) Example time series of animal speed (green) and Ca2+ traces from the 20 most active neurons of the population co-recorded with the animal movement speed. Significant Ca2+ transients are highlighted by red segments. For the peri-infarct imaging region, a significant main effect of time was observed in the average correlation coefficient between neuron Ca2+ traces and speed (B), however post hoc tests did not show a significant difference between any of the times within the stroke and sham groups, respectively. Mixed Effects Model, Time F (3.116, 38.64)=2.861, p=0.0474; Stroke Group F (1, 13)=2.296, p=0.1536; Interaction F (5, 62)=0.7734, p=0.5726. No main effects or interaction were found in the percent of neurons correlated with movement for the peri-infarct imaging region (C). In the distal imaging region, no significant main effects or interactions were seen in the average correlation coefficient between neuron Ca2+ traces and speed (D) or in the percent of neurons correlated with movement (E). Peri-infarct region Stroke N=11, Sham N=4. Distal region Stroke N=13, Sham N=4. *p<0.05; **p<0.01; ***p<0.001.
Figure 5

Example cellular GCaMP6S Ca2+ fluorescence images and population functional connectivity plots.
(A–D) Ca2+ fluorescence images and functional connectivity plots from the peri-infarct imaging region and the distal imaging region for one example stroke group animal. Population functional connectivity plots demonstrate neurons as red dots, and the functional connection strength as lines with color and line width determined by the strength of the correlation between neurons. Notable cortical damage is visible in the upper portion of the 1 week post-stroke Ca2+ fluorescence image in the peri-infarct imaging region (A), which notably improves over the 2–4 week times. A notable loss of functional connections and loss in the number of connections with strong correlation (>0.3) is visible in the functional connectivity plots at 1 week post-stroke in the peri-infarct imaging region (B). In the distal imaging region post-stroke, little structural change is visible in the cellular Ca2+ fluorescence images (C), and less change to functional connectivity of the population over time (D). (E–H) Ca2+ fluorescence images and functional connectivity plots from the peri-infarct imaging region and the distal imaging region for one example sham group animal. Little structural changes within the cellular Ca2+ fluorescence images and in the functional connectivity plots are visually apparent relative to the example stroke animal.
Figure 6

Altered functional connectivity in the peri-infarct somatosensory cortex.
In the peri-infarct imaging region, a trend of a main effect of time was found in the average number of significant connections per neuron (A), with post hoc tests showing a significant decrease at 1 week post-stroke relative to pre-stroke (p=0.0373) and relative to 1 week post-sham (=0.0178). Mixed Effects Model, Time F (3.559, 40.58)=2.213, p=0.0914; Group F (1, 12)=1.716, p=0.2147; Interaction F (5, 57)=1.820, p=0.1233. A significant main effect of time was found in the average number of significant connections per neurons with correlation greater than 0.3 (B), with post hoc tests indicating a significant decrease at 1 week post-stroke compared to pre-stroke (p=0.0398). Mixed Effects Model, Time F (3.463, 41.55)=2.735, p=0.0484; Group F (1, 13)=0.0964, p=0.7610; Interaction F (5, 60)=0.8633, p=0.5111. No significant main effects or interaction is seen in the connection density for the peri-infarct imaging region (C). In the distal imaging region, no significant main effects or interaction is seen in the average number of significant connections per neuron (D), however post hoc tests indicate significantly lower connections per neuron at 4 weeks in the sham group relative to 4 weeks post-stroke (p=0.0360). Mixed Effects Model, Time F (2.991, 44.87)=1.314, p=0.2815; Group F (1, 15)=1.138, p=0.3030; Interaction F (5, 75)=0. 8022, p=0.5516. A significant main effect of time was observed for the average number of significant connections with correlation greater than 0.3 in the distal region (E), with post hoc tests indicating a significant decrease at 8 weeks post-stroke relative to pre-stroke (p=0.0189) Mixed Effects Model, Time F (2.909, 43.06)=4.451, p=0.0088; Group F (1, 15)=0.1272, p=0.7263; Interaction F (5, 74)=0.8692, p=0.3676. No significant main effects or interaction is seen in the connection density (F). Peri-infarct region Stroke N=11, Sham N=4. Distal region Stroke N=13, Sham N=4. *p<0.05; **p<0.01; ***p<0.001.
Figure 7
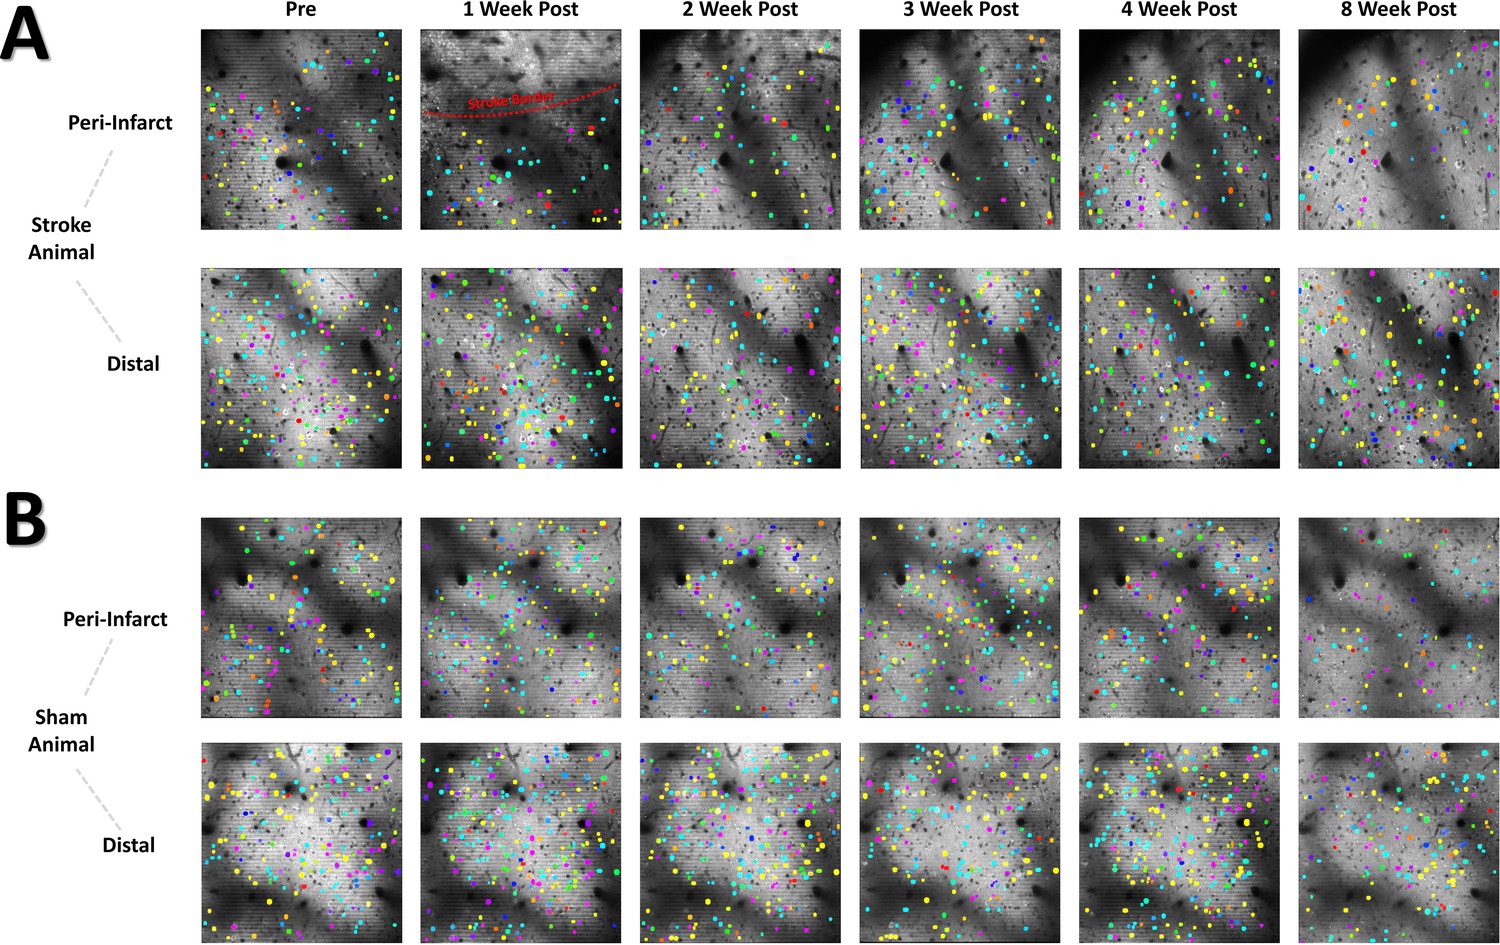
Color coded neural assembly plots depict altered neural assembly architecture after stroke in the peri-infarct region.
(A) Representative cellular Ca2+ fluorescence images with neural assemblies color coded and overlaid for each timepoint. Neurons belonging to the same assembly have been pseudocolored with identical color. A loss in the number of neural assemblies after stroke in the peri-infarct region is visually apparent, along with a concurrent increase in the number of neurons for each remaining assembly. (B) Representative sham animal displays no visible change in the number of assemblies or number of neurons per assembly.
Figure 8
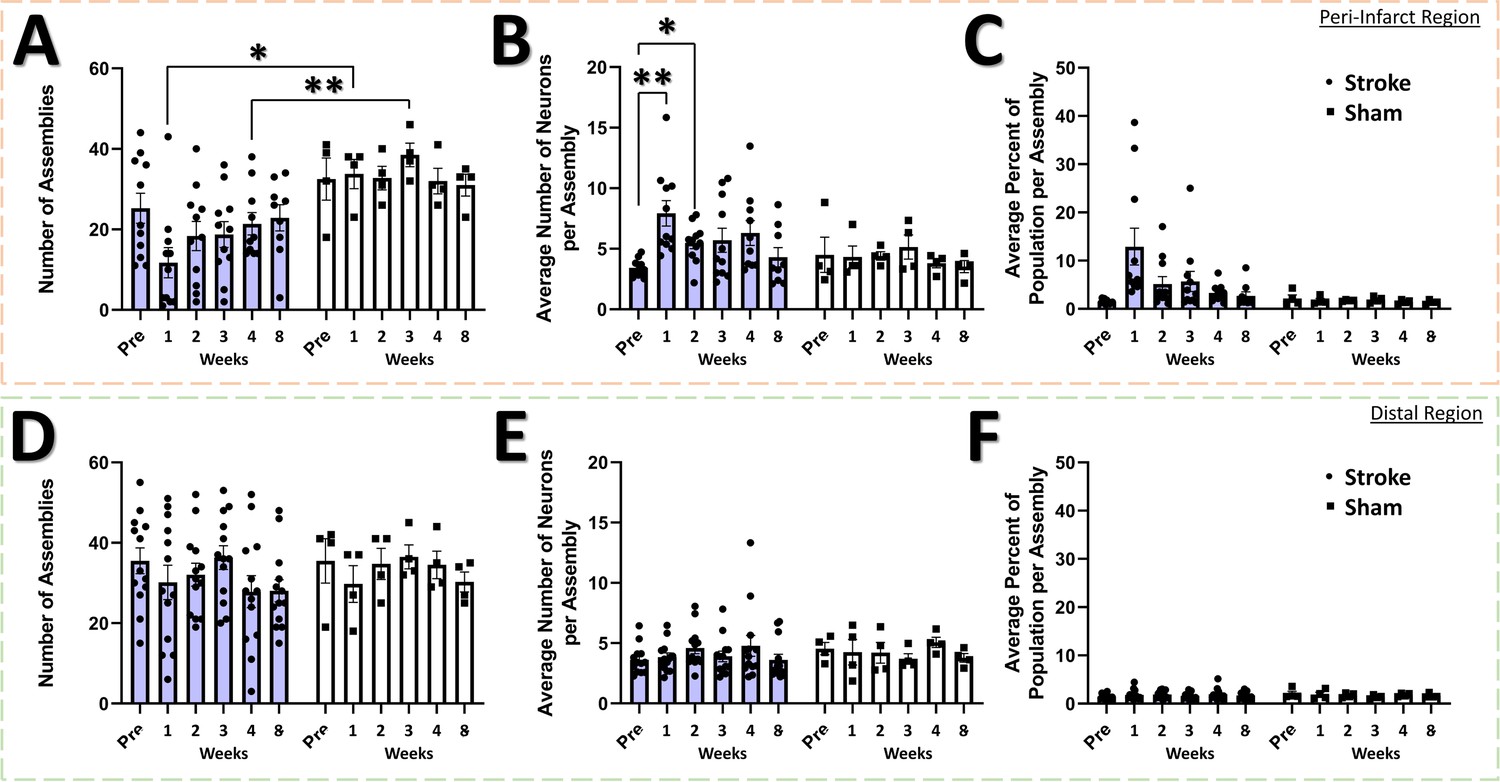
Neural assembly structure is disrupted in the peri-infarct region after stroke.
In the peri-infarct imaging region, a significant main effect of group was found for the number of assemblies (A), with post-hoc tests showing a significant decrease in the number of assemblies at the 1 week and 3 week times for the stroke group compared to sham (p=0.0114 and 0.0058, respectively). Mixed Effects Model, Time F (2.883, 35.75)=0.8231, p=0.4857; Group F (1, 13)=11.90, p=0.0043; Interaction F (5, 62)=1.496, p=0.2040. No main effects or interaction was observed in the average number of neurons per assembly (B), however post hoc tests indicated significantly higher number of neurons at 1- and 2 weeks post-stroke compared to pre-stroke (p=0.0099 and 0.0190, respectively). Mixed Effects Model, Time F (3.405, 42.22)=1.865, p=0.1435; Group F (1, 13)=2.018, p=0.1790; Interaction F (5, 62)=1.728, p=0.1415. A trend of a main effect of group was found in the average percent of the population per assembly (C), with post hoc tests showing a trend at 1 week post-stroke compared to pre-stroke (p=0.0683) and compared to 1 week post-sham (p=0.0863). Mixed Effects Model, Time F (1.711, 21.22)=1.738, p=0.2023; Group F (1, 13)=3.807, p=0.0729; Interaction F (5, 62)=1.765, p=0.1333. No main effects or interaction was observed in the distal imaging region for number of assemblies (D), average number of neurons per assembly (E), or average percent of the population per assembly (F). Peri-infarct region Stroke N=11, Sham N=4. Distal region Stroke N=13, Sham N=4. *p<0.05; **p<0.01; ***p<0.001.
Figure 9 with 1 supplement

Correlation among neural assemblies is increased in the peri-infarct imaging region after stroke.
(A) Illustration of three example color coded neural assemblies from a neural population and their corresponding time series activations that were correlated. In the peri-infarct imaging region, a significant main effect of group was found in the correlation coefficient for significantly correlated assembly-assembly pairs (B), with post-hoc tests indicating a significantly higher correlation at 2 week (p=0.029) and 4 weeks (p=0.0253) in the stroke group relative to sham, and at 1 week (p=0.0084) and 4 week (p=0.0261) in the stroke group compared to pre-stroke. Mixed Effects Model, Time F (3.718, 42.39)=2.014, p=0.1141; Stroke Group F (1, 13)=9.155, p=0.0097; Interaction F (5, 57)=2.348, p=0.0524. In the distal imaging region, no significant main effects or interaction was found for the correlation coefficient for significantly correlated assembly-assembly pairs (C). Peri-infarct region Stroke N=11, Sham N=4. Distal region Stroke N=13, Sham N=4. *p<0.05; **p<0.01; ***p<0.001.
Figure 9—figure supplement 1
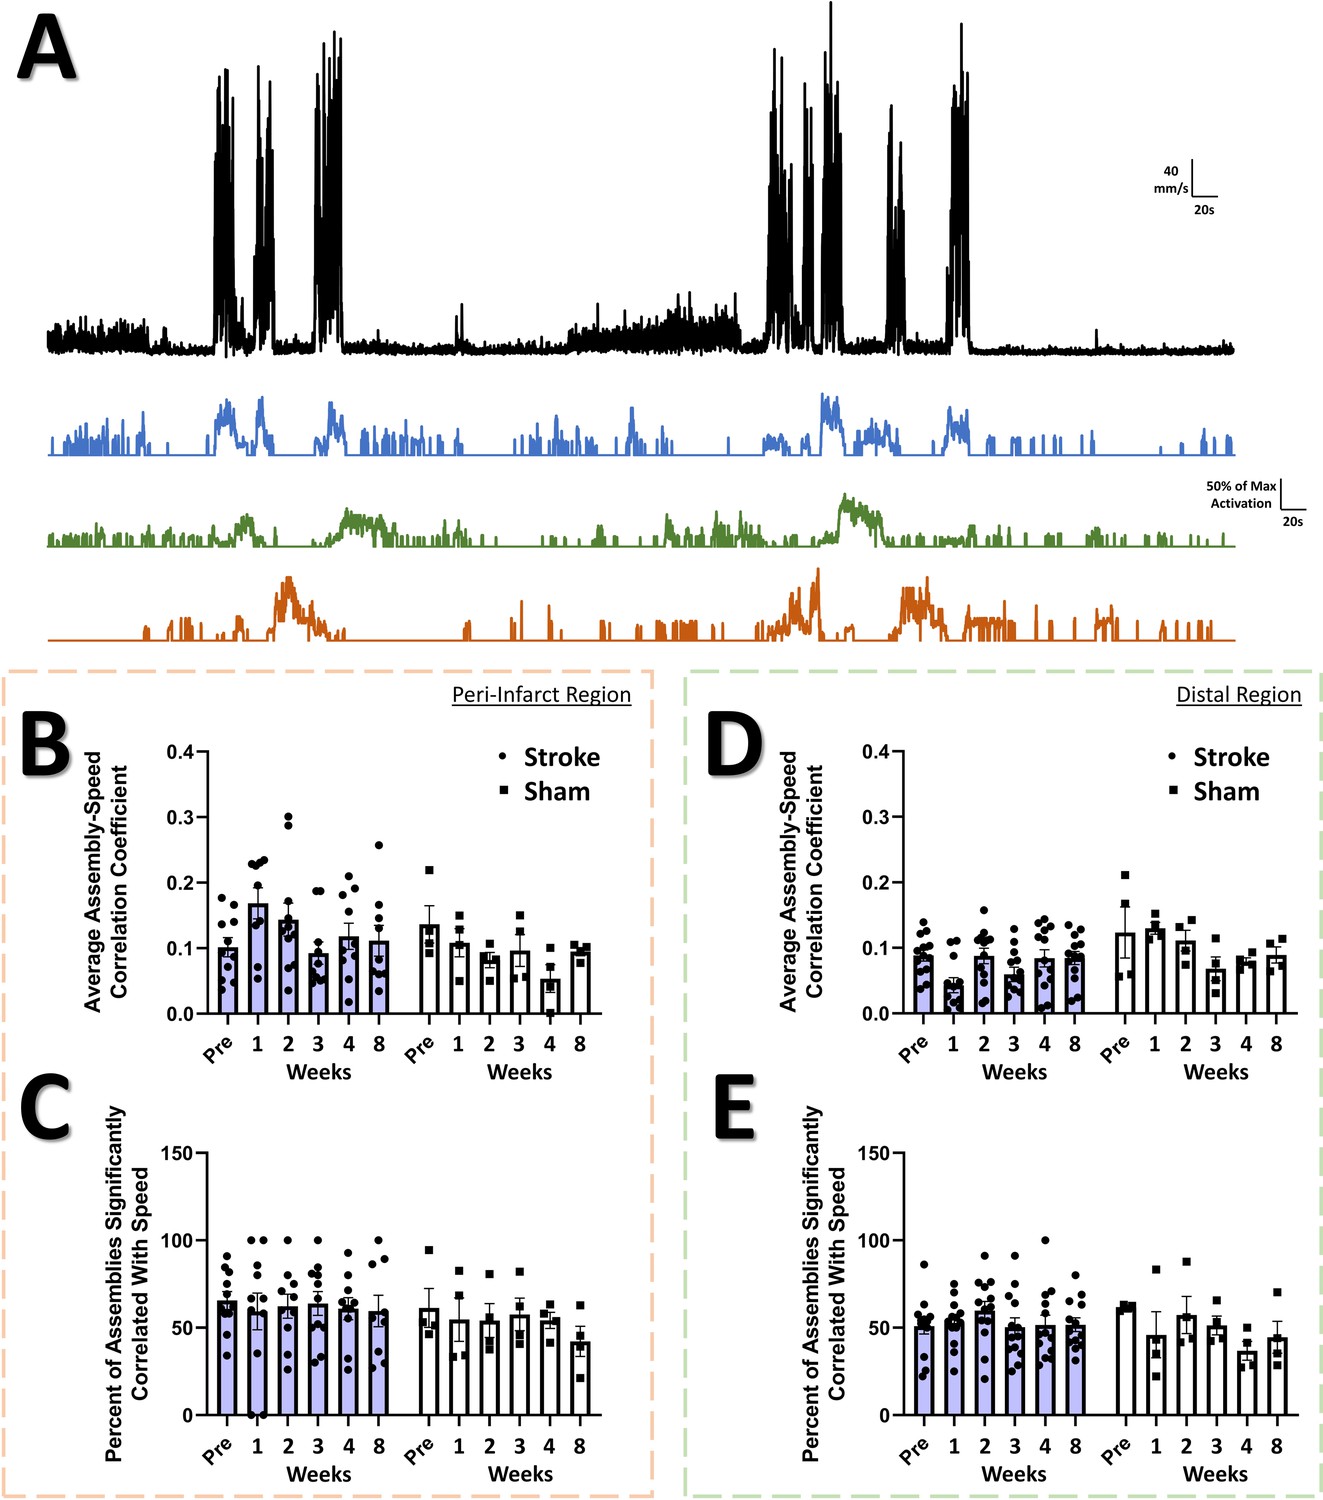
Correlation between assembly activations and movement is not detectably affected by stroke.
(A) Representative time series of animal movement speed (black) and the assembly activation level for three representative assemblies (blue, green, orange) from the neuron population corresponding to the animal movement speed above. In the peri-infarct imaging region, no main effects or interactions are seen in the average assembly-speed correlation coefficient (B), or in the percent of assemblies significantly correlated with speed (C). In the distal imaging region, no main effects or interactions are seen in the average assembly-speed correlation coefficient (D), or in the percent of assemblies significantly correlated with speed (E). Peri-infarct region Stroke N=11, Sham N=4. Distal region Stroke N=13, Sham N=4. *p<0.05; **p<0.01; ***p<0.001.
Additional files
Download links
A two-part list of links to download the article, or parts of the article, in various formats.
Downloads (link to download the article as PDF)
Open citations (links to open the citations from this article in various online reference manager services)
Cite this article (links to download the citations from this article in formats compatible with various reference manager tools)
Aberrant cortical activity, functional connectivity, and neural assembly architecture after photothrombotic stroke in mice
eLife 12:RP90080.
https://doi.org/10.7554/eLife.90080.3


