Variation in the basal immune state and implications for disease
- Department of Immunology, St. Jude Children's Research Hospital, United States
Figures
Figure 1
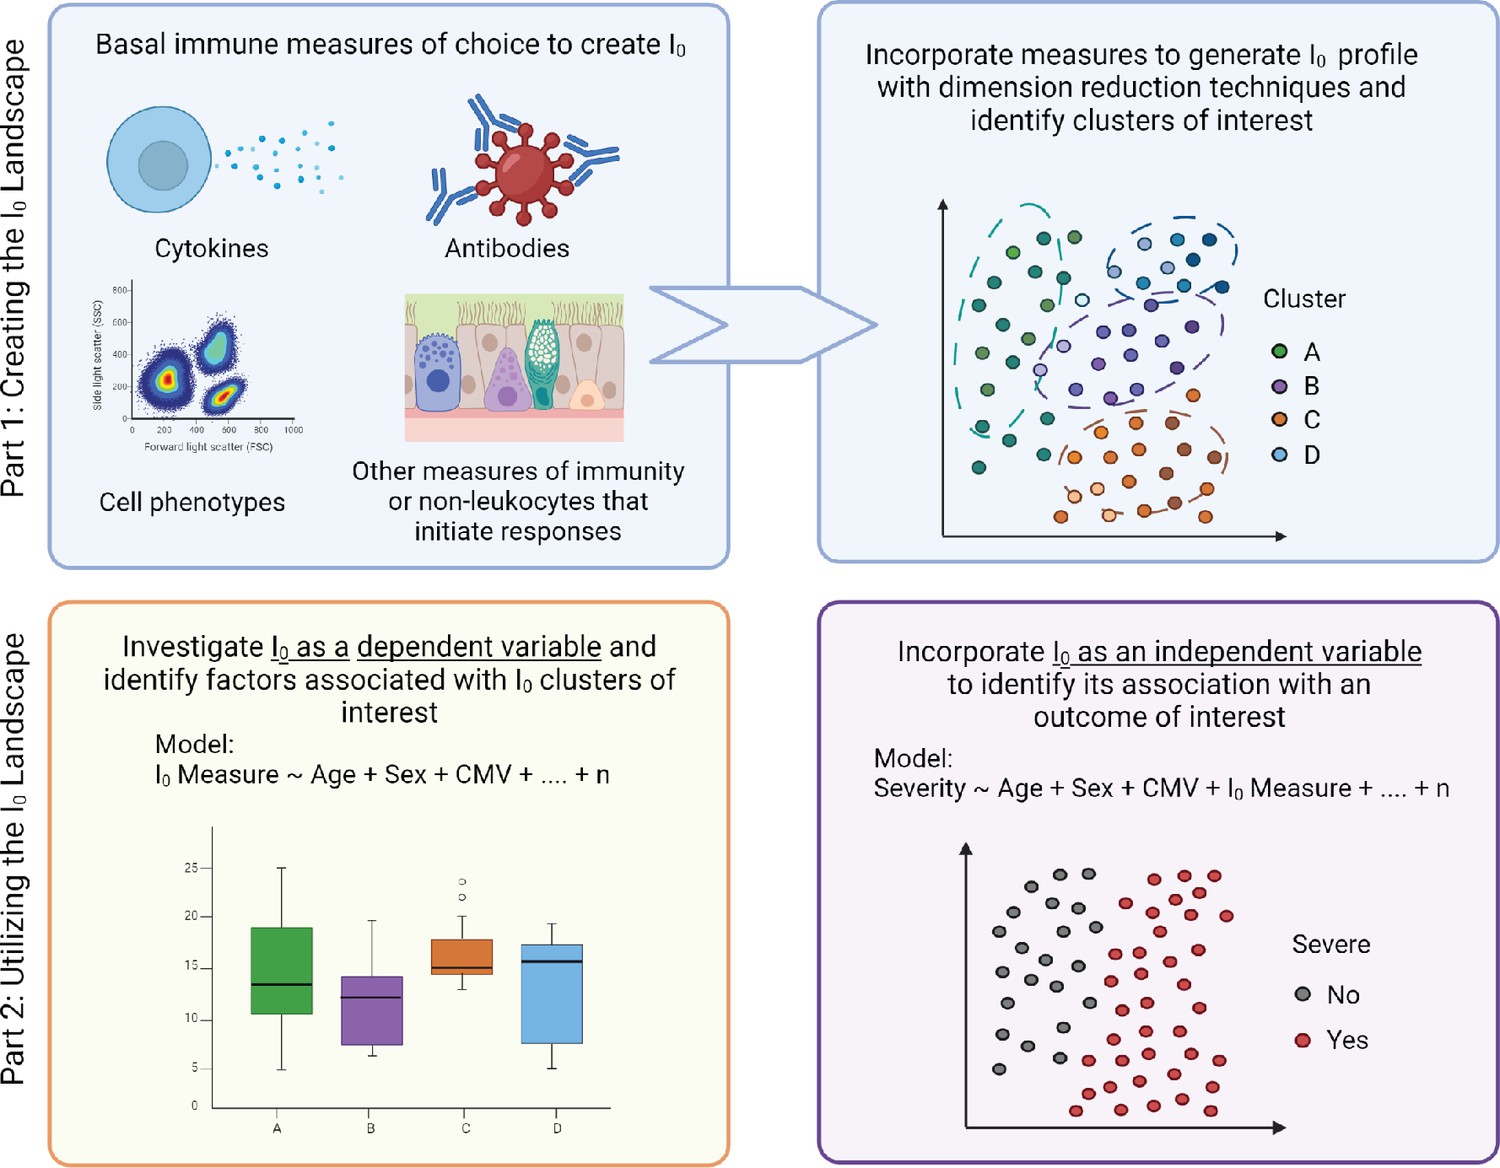
Modeling immunity.
Overview of the experimental, conceptual, and mathematical framework of I0 (detailed in the ‘Implementing I0’ section).
Figure 2
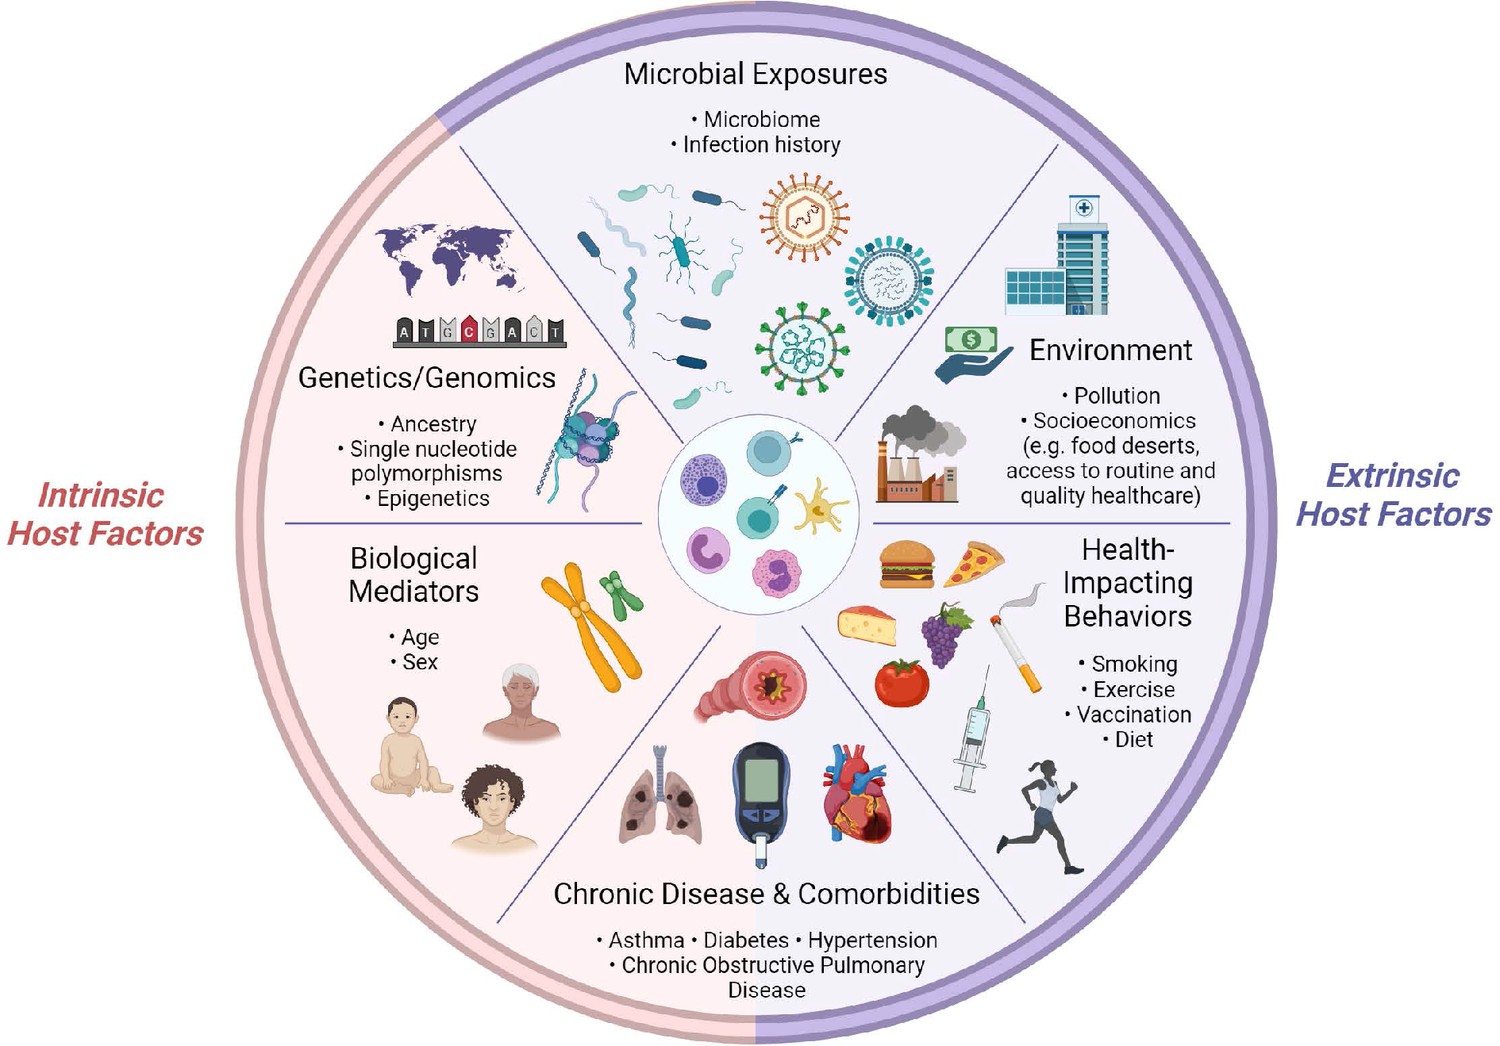
Determinants of immunity.
Summary of intrinsic and extrinsic host factors which contribute to immune heterogeneity. Bullet points highlight examples of each determinant.
Figure 3
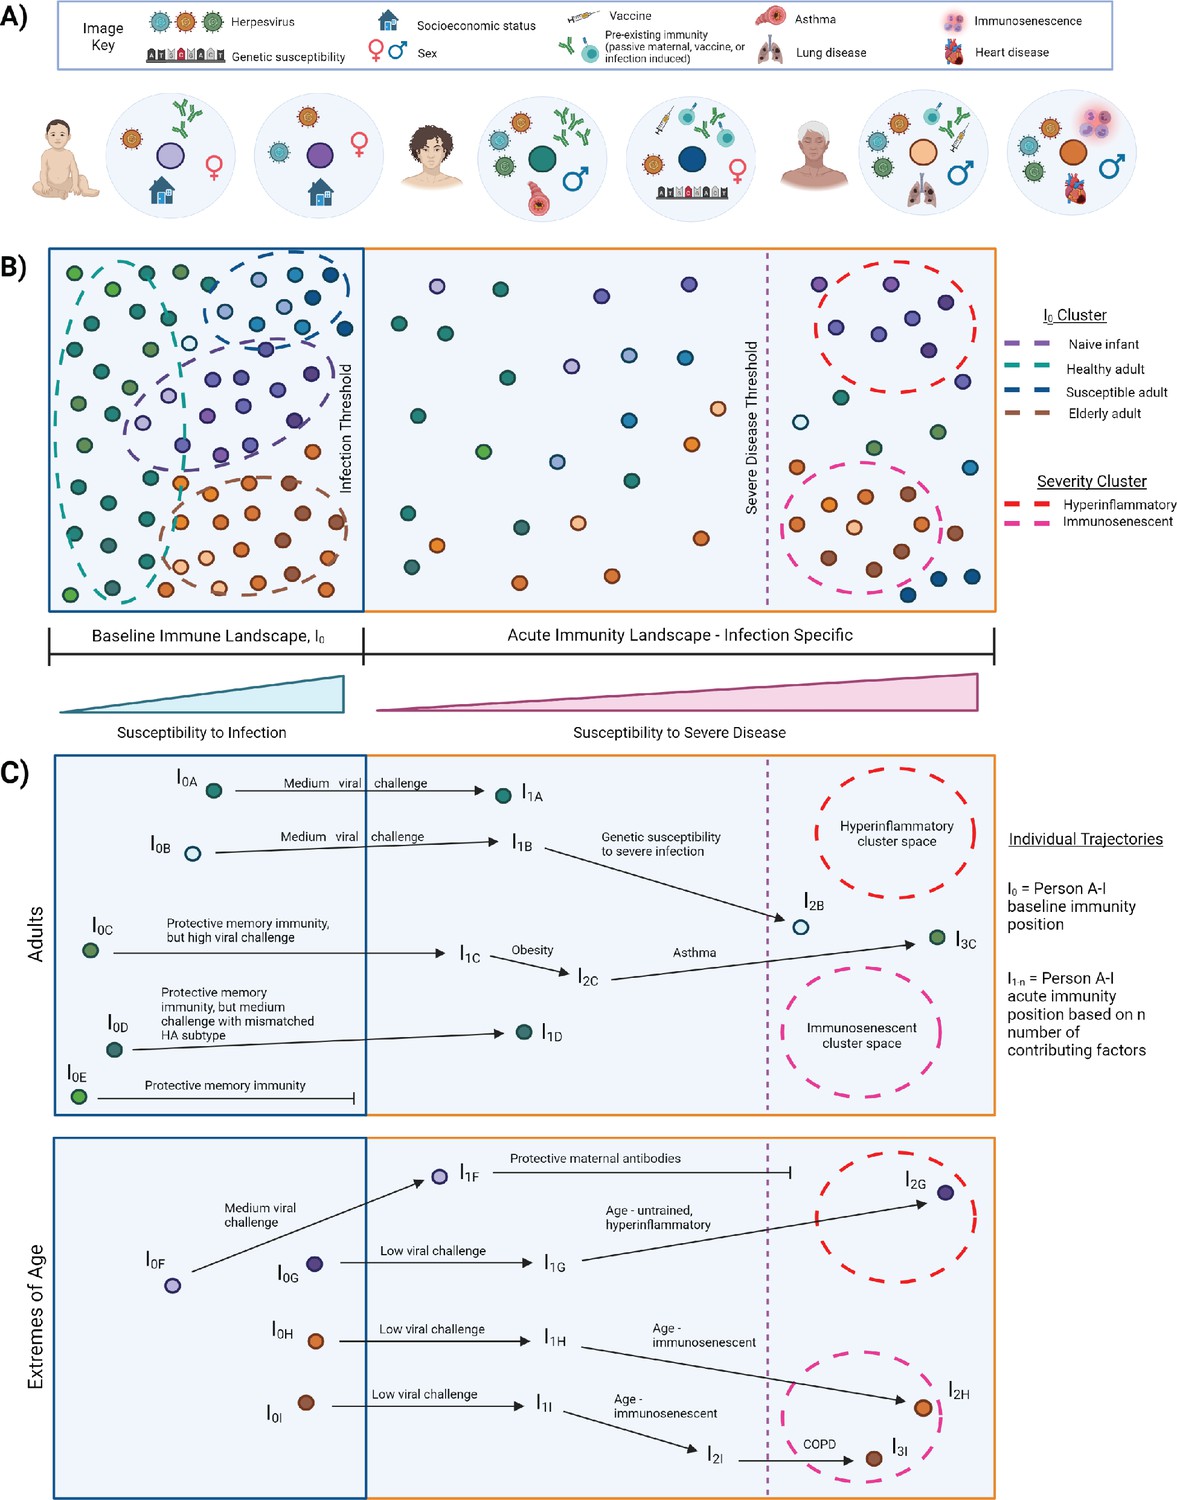
I0 and acute influenza infection immune landscape.
(A) Examples of I0 determinant profiles for two infants (purple dots), two adults (blue/green dots), and two elderly subjects, highlighting the vast variation of factors that lead to different positions within the immune landscape. (B) Immune landscape during baseline and acute immune states. (C) Example trajectories (from panel B) of ‘Adult’ and ‘Extremes of Age’ subjects with varying degrees of influenza disease severity. Arrows correspond to major contributing factors driving a subject’s location within the landscape, and the length of the arrow is associated with the magnitude of the effect of that factor.
Figure 4

Models of immunity.
Examples of statistical models that can be utilized to assess immunity determinants and/or contributions to illness outcome. Models are written in an R programming language format, with the dependent variable to the left of the ‘~’ and all independent variables to the right.
Figure 5
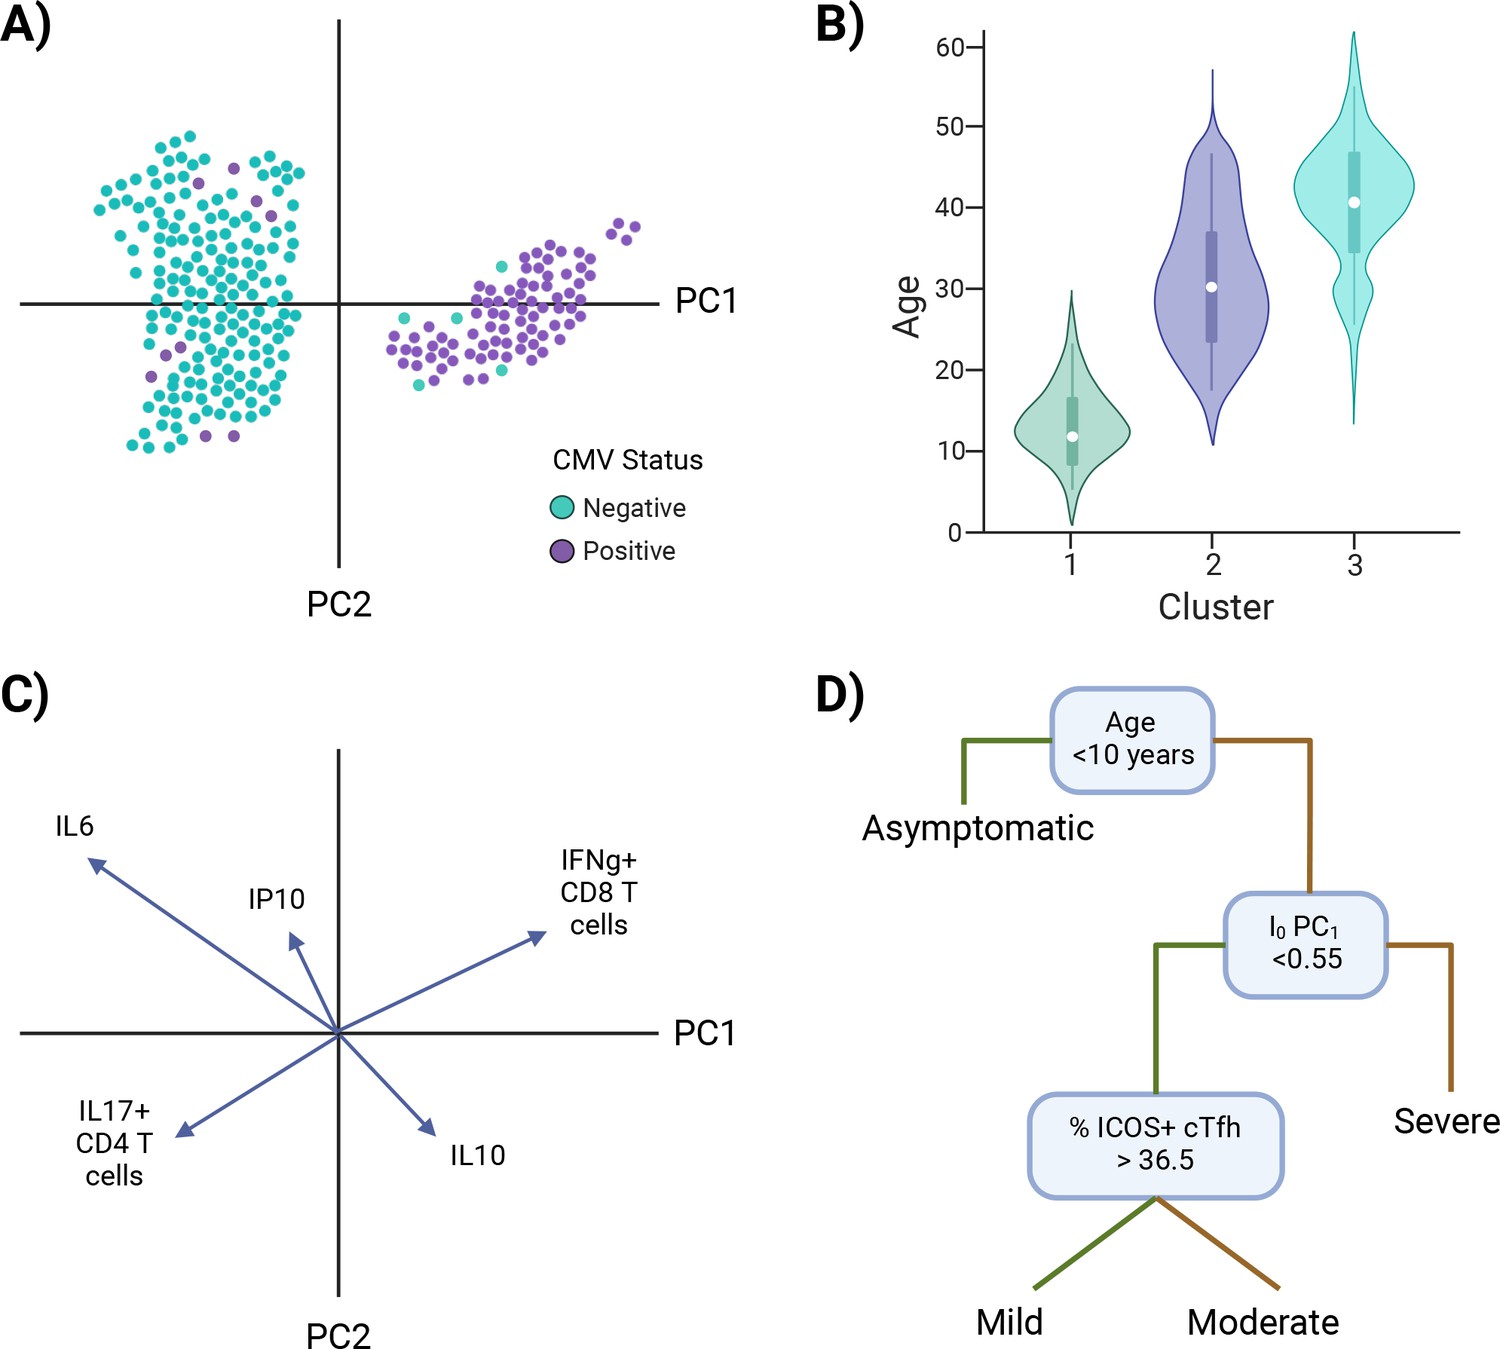
Investigating I0.
Examples of approaches to identify characteristic features of I0 clusters (A–C) and infer I0 associations with susceptibility to infection or disease severity (D). (A) Example of overlaying the value of a putative independent variable, cytomegalovirus (CMV) status, on a principal component analysis (PCA) graph. (B) Example of subsetting the data by cluster identity and comparing values of a potential defining variable, age. (C) Example of a PCA loading plot. (D) Example of a decision tree analysis, in which an I0 value, PC1, is associated with susceptibility to severe disease. Green lines = true, yellow lines = false. *Note: Examples are not related to each other.
Figure 6
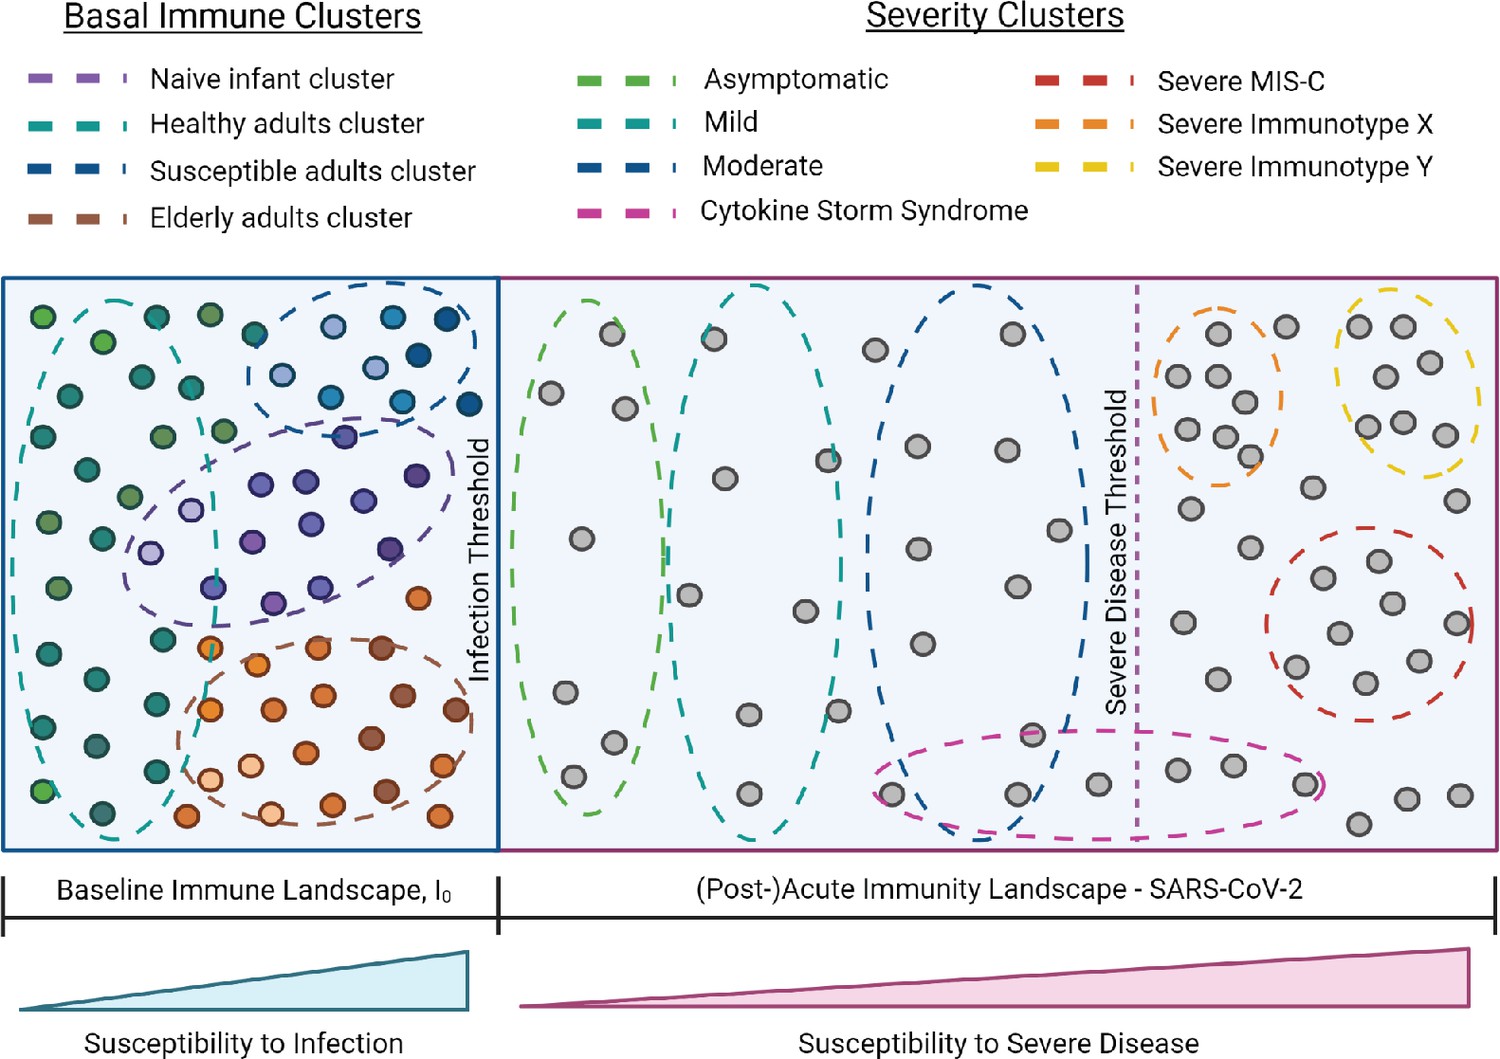
I0 and SARS-CoV-2 infection immune landscape.
Provisional model of the immunological landscape related to coronavirus disease (COVID). Although more studies are needed to refine specific immune profiles, what we know of the immune response to and presentation of SARS-CoV-2 infection suggests it has a distinct landscape compared to influenza. Mathew, et al. identified three cellular-based immunophenotypes associated with COVID outcome (Mathew et al., 2020). However, it’s unclear how these profiles relate to other immunological signatures of COVID disease presentation. Studies have reported mixed associations between cytokine storm and illness outcome, thus this cluster profile spans the threshold for severe disease (Leisman et al., 2020). Lastly, the acute landscape component includes the post-infectious period in order to incorporate complications such as multisystem inflammatory syndrome in children (MIS-C).
Download links
A two-part list of links to download the article, or parts of the article, in various formats.
Downloads (link to download the article as PDF)
Open citations (links to open the citations from this article in various online reference manager services)
Cite this article (links to download the citations from this article in formats compatible with various reference manager tools)
Variation in the basal immune state and implications for disease
eLife 13:e90091.
https://doi.org/10.7554/eLife.90091


