Robust optogenetic inhibition with red-light-sensitive anion-conducting channelrhodopsins
- Institut für Biologie, Experimentelle Biophysik, Humboldt-Universität zu Berlin, Germany
- Faculty of Biology, Technion – Israel Institute of Technology, Israel
- Research Group Neuromodulatory Networks, Leibniz Institute for Neurobiology, Germany
- Aligning Science Across Parkinson's (ASAP) Collaborative Research Network, United States
- Center for Behavioral Brain Sciences, CBBS, Germany
Figures
Figure 1
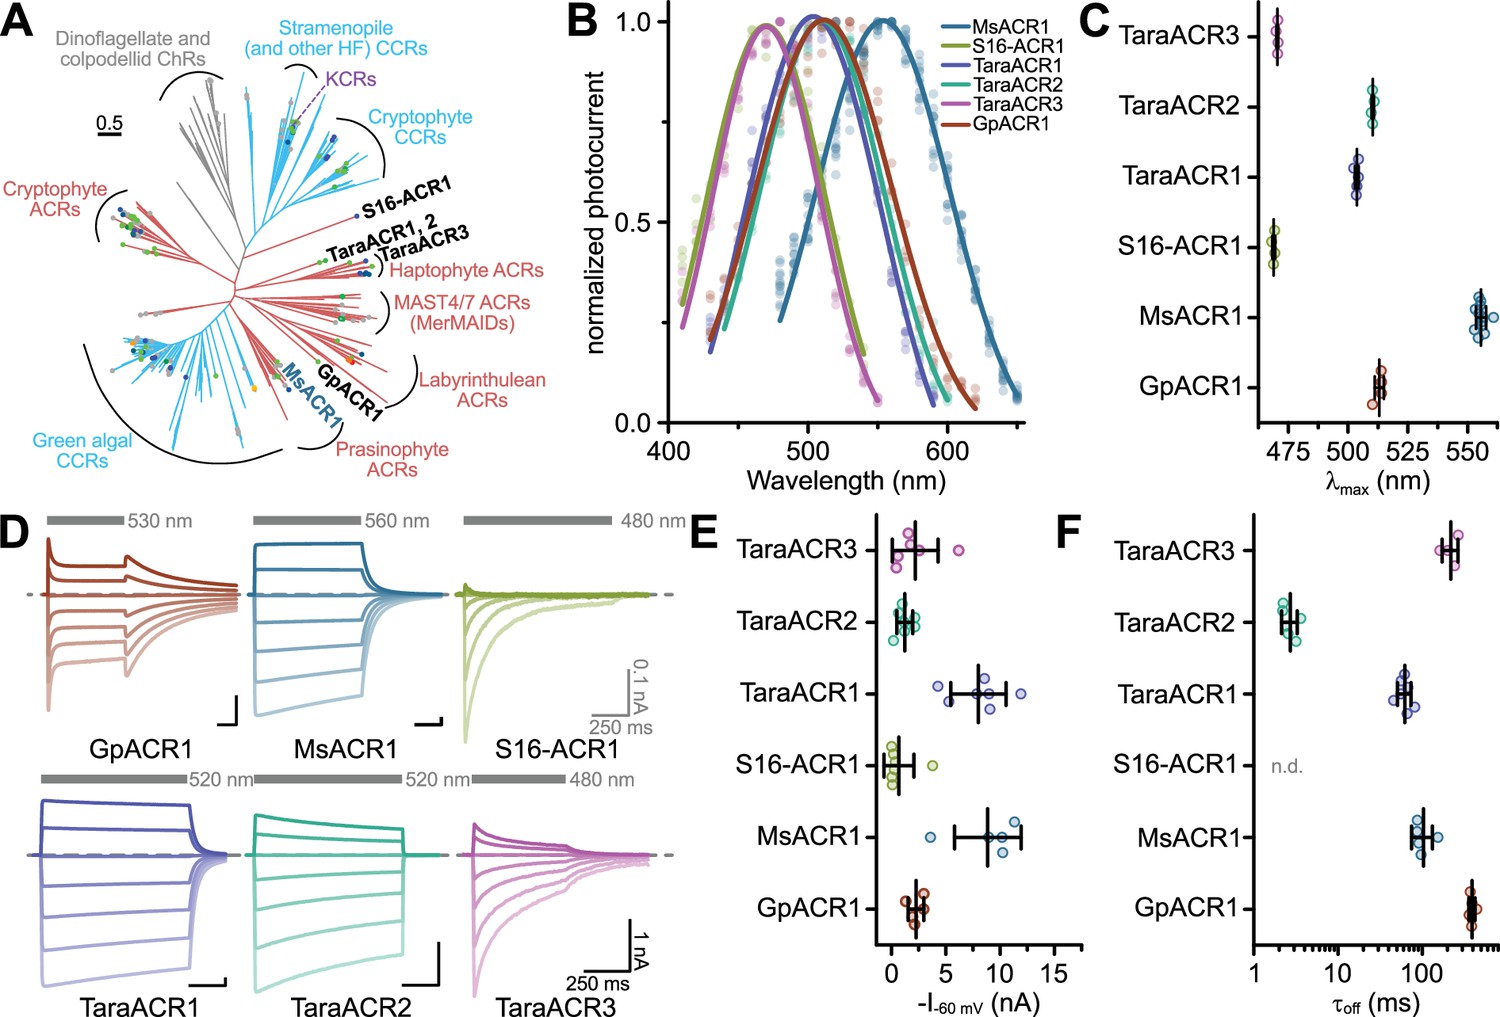
Phylogeny and electrophysiological characterization of identified anion-conducting channelrhodopsins (ACRs).
(A) Phylogenetic relationships among known channelrhodopsins (ChRs) subfamilies with the described ChRs written in black and blue font. The color of the clades indicates ion selectivity: red for ACRs and light-blue for cation-conducting ChRs (CCRs). The color of the dots reflects λmax with gray dots corresponding to proteins not yet having their λmax determined. See the extended version of the tree in Appendix 1—figure 1. (B) Action spectra of identified ACRs. Shown are Gaussian fits, where dots are data points of single measurements. (C) Strongest activation wavelength (λmax) derived from Gaussian fits of recorded action spectra. (D) Example current traces of identified ACRs recorded at holding potentials between −80 and +40 mV. The gray bars indicate the illumination period with excitation light of indicated wavelength. The dashed line indicates 0 nA. (E) Peak photocurrent amplitude at −60 mV holding potential. (F) Off-kinetics (τoff) of the photocurrents upon light-off at −60 mV for tested ACR candidates. Note: τoff for S16-ACR1 could not be determined because photocurrents fully inactivated at −60 mV during the illumination. In (C, E, F), black lines are mean ± standard deviation, and circles are data points of single measurements (GpACR1 n = 4, 5, 5; MsACR1 n = 12, 5, 5; S16-ACR1 n = 4, 7, n.d.; TaraACR1 n = 5, 7, 7; TaraACR2 n = 4, 7, 6; TaraACR3 n = 4, 6, 4 for (C), (E), and (F), respectively). Abbreviation: n.d. means not determined.
-
Figure 1—source data 1
Source data for electrophysiological analysis of identified anion-conducting channelrhodopsins presented in Figure 1B, C, E, F.
- https://cdn.elifesciences.org/articles/90100/elife-90100-fig1-data1-v1.xlsx
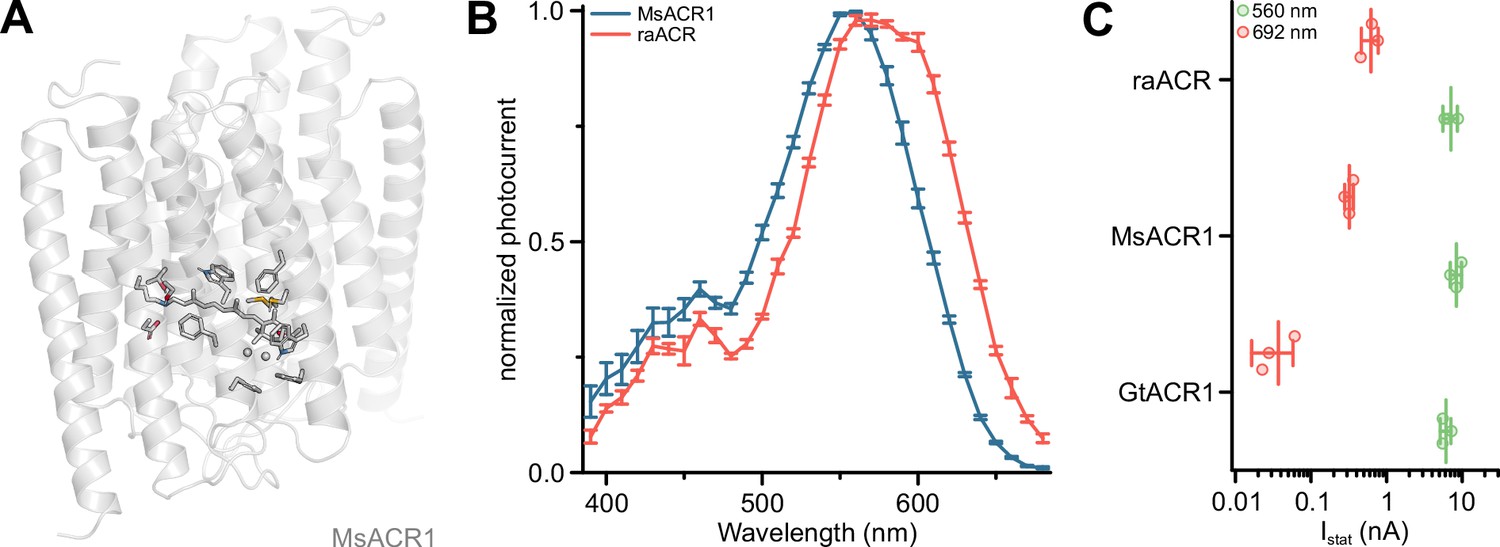
Figure 2
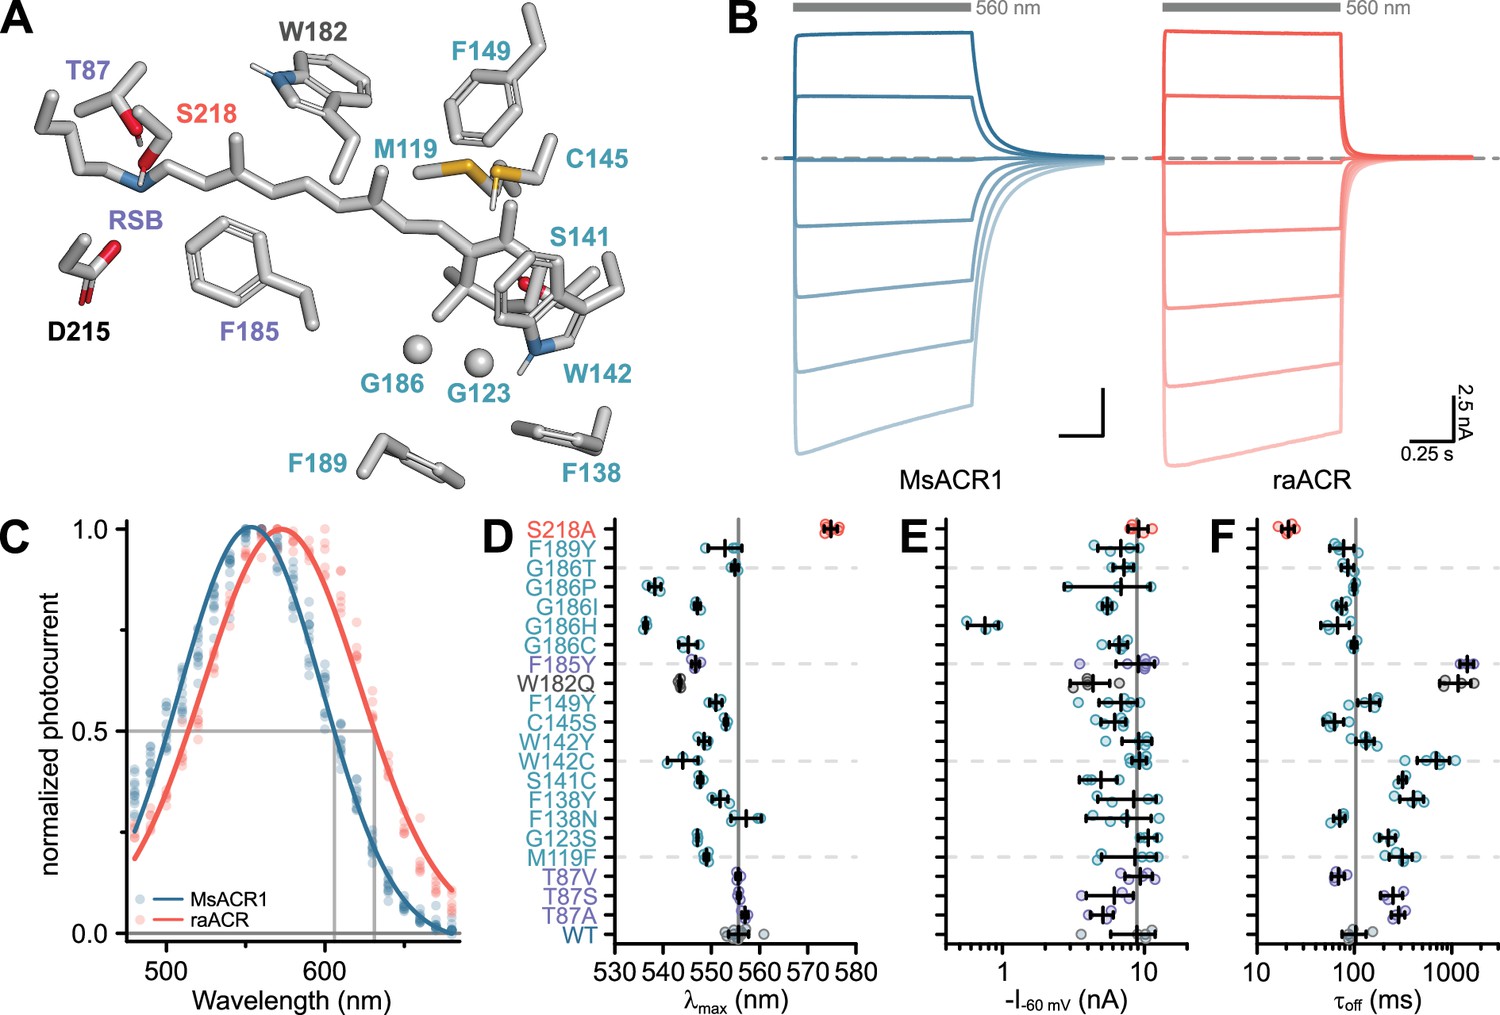
Color-tuning of MsACR1.
(A) Structural model of the MsACR1 retinal binding pocket. Residues close to the β-ionone ring are labeled in cyan, and those close to the retinal Schiff base (RSB) are labeled purple. Residue S218, the position of the raACR mutation, is labeled in light-red, and the putative counterion D215 is labeled black. Residue side chains and the all-trans-retinal chromophore are shown as sticks except for G123 and G186, where the Cɑ is shown as a sphere. Oxygen is colored in red, nitrogen in blue, and sulfur in yellow. (B) Example current traces of MsACR1 (blue) and raACR (MsACR1-S218A; light-red). Gray bars above the traces indicate the illumination period with an excitation light of 560 nm. The dashed line indicates 0 nA. Example current traces of all mutants can be found in Appendix 1—figure 4. (C) Action spectra of MsACR1 (blue) and raACR (red). Dots are data points of single measurements fitted with a Gaussian function (solid line). (D) Strongest activation wavelength (λmax) of the indicated single-residue mutants. (E) Photocurrent amplitudes at −60 mV holding potential (I−60 mV) of the indicated mutants upon excitation with 560 nm light. (F) Off-kinetics (τoff) of the photocurrents upon light-off. In (D–F), black lines are mean ± standard deviation, and circles are data points of single measurements (WT n = 12, 5, and 5, respectively; Mutants n = 3–7).
-
Figure 2—source data 1
Source data for electrophysiological analysis of color-tuning in MsACR1 presented in Figure 2C-F.
- https://cdn.elifesciences.org/articles/90100/elife-90100-fig2-data1-v1.xlsx
Figure 3
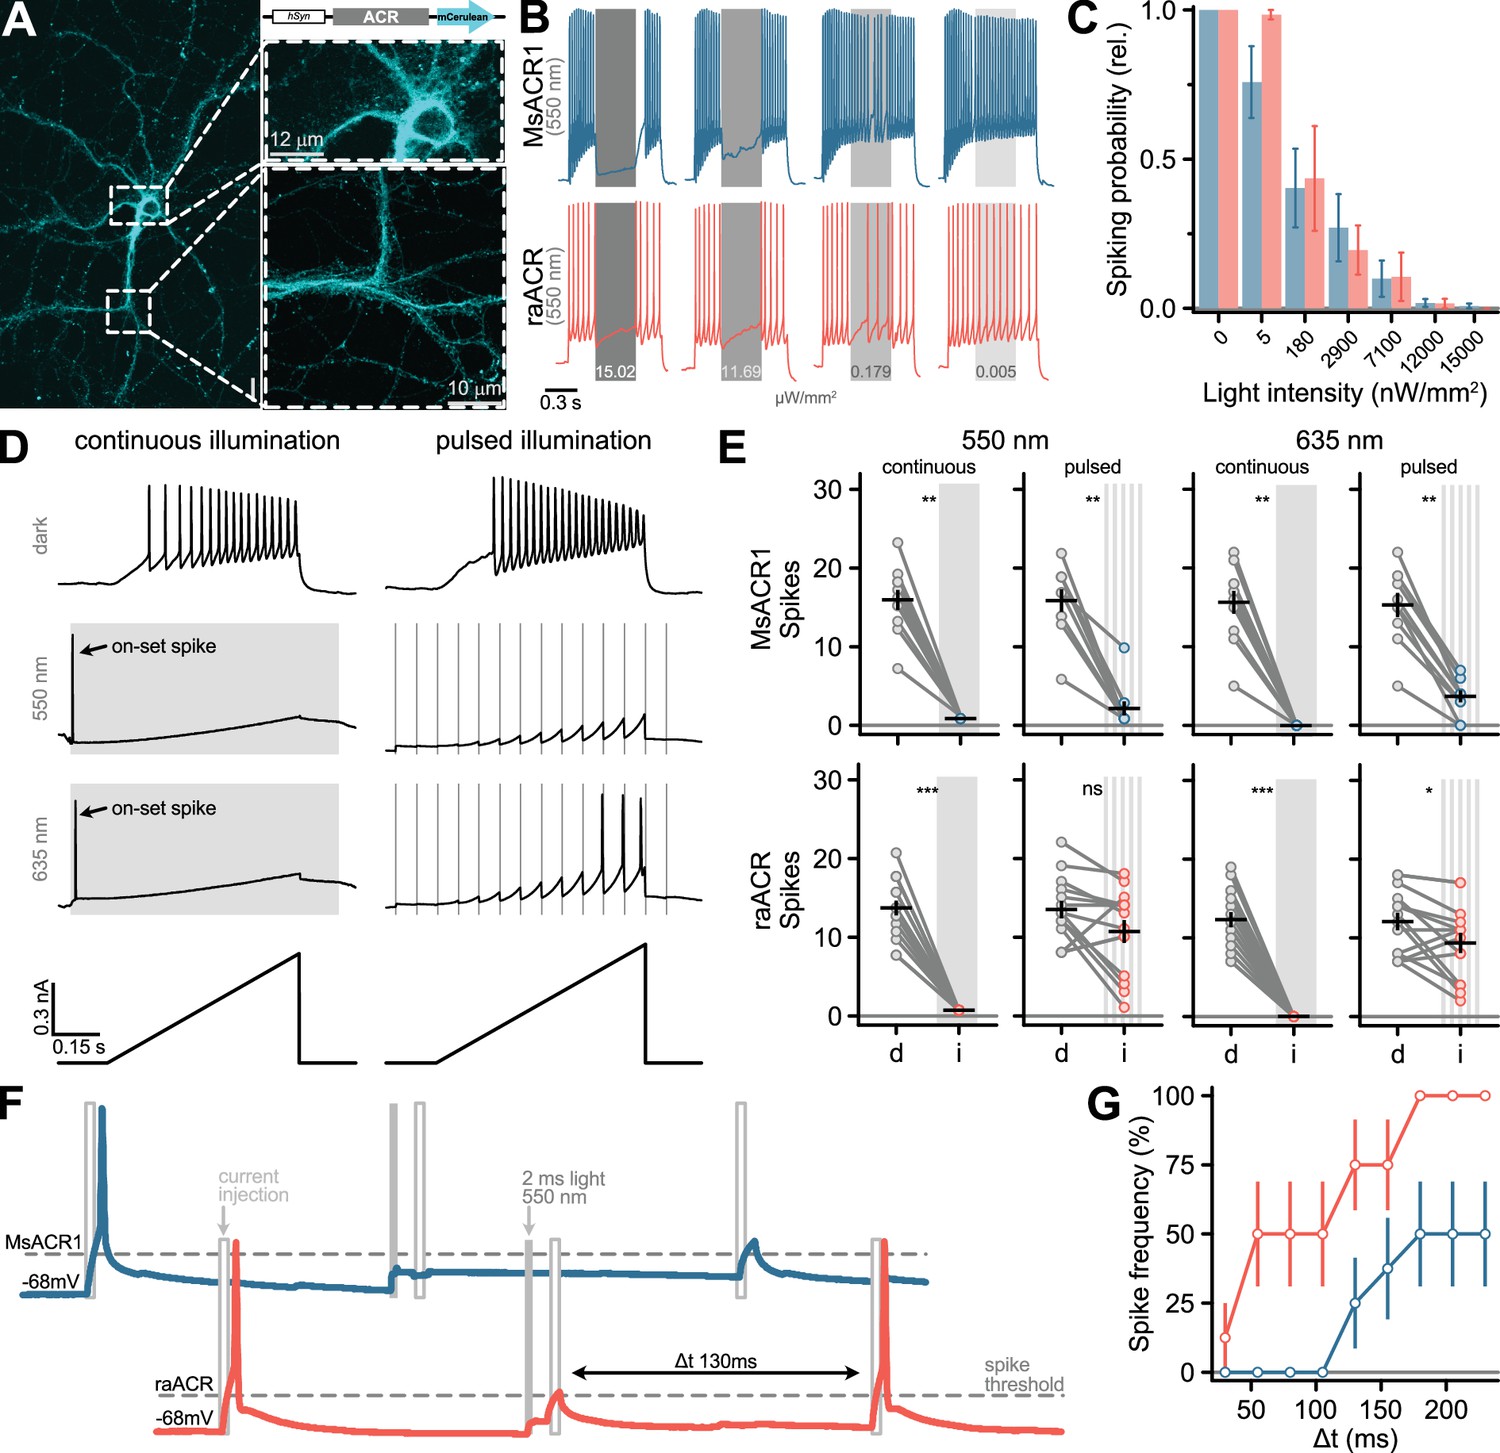
Silencing of neuronal activity in dissociated hippocampal neurons using MsACR1 and raACR.
(A) Confocal image of a hippocampal neuron 10 days after viral transduction expressing MsACR1-mCerulean under control of the hSynapsin1 (hSyn) promoter. The magnified portion of the image of a putative axonal compartment (right side, lower panel) shows a high degree of membrane targeting of MsACR1. Magnification of the somatodendritic compartment (right side, upper panel) reveals the absence of visible protein aggregation. (B) Voltage traces of neuronal spiking elicited by a 1-s 250-pA current step illustrating the efficiency of optical silencing at indicated various light intensities (ranging from 200 to 15 × 103 nW/mm2). MsACR1 and raACR were activated for 300 ms with 550 nm light (gray bars) during the current step. (C) Relative neuronal spiking probability upon optical silencing by MsACR1 (blue) or raACR (red) excited with 550 nm light, as illustrated in (B), at all tested light intensities. (D) Voltage traces of MsACR1-expressing hippocampal neurons upon current ramps under no light, continuous or 10 Hz pulsed illumination with 550 or 635 nm light. Continuous illumination evoked a spike at light on-set (on-set spike). (E) Spikes elicited by current-ramp injection in the dark (d) or upon continuous or pulsed illumination (i) of 550 or 635 nm in neurons expressing MsACR1 (upper row) or raACR (lower row), as shown in (D). Black lines are mean ± standard error, and circles represent single measurements (n = 10–16). Paired two-tailed Wilcoxon or Student’s t-tests were used for MsACR1 and raACR comparisons (ns: p > 0.05, *: p <= 0.05 **: p <= 0.01 ***: p <= 0.001). (F) Temporal precision of neuronal inhibition of MsACR1 (blue) and raACR (red). A paradigm was designed to measure the period after successful suppression of a current-evoked spike in which no new spike can be triggered. (G) Population data of MsACR1 (blue) and raACR (red) for the experiment are shown in (F).
Figure 4
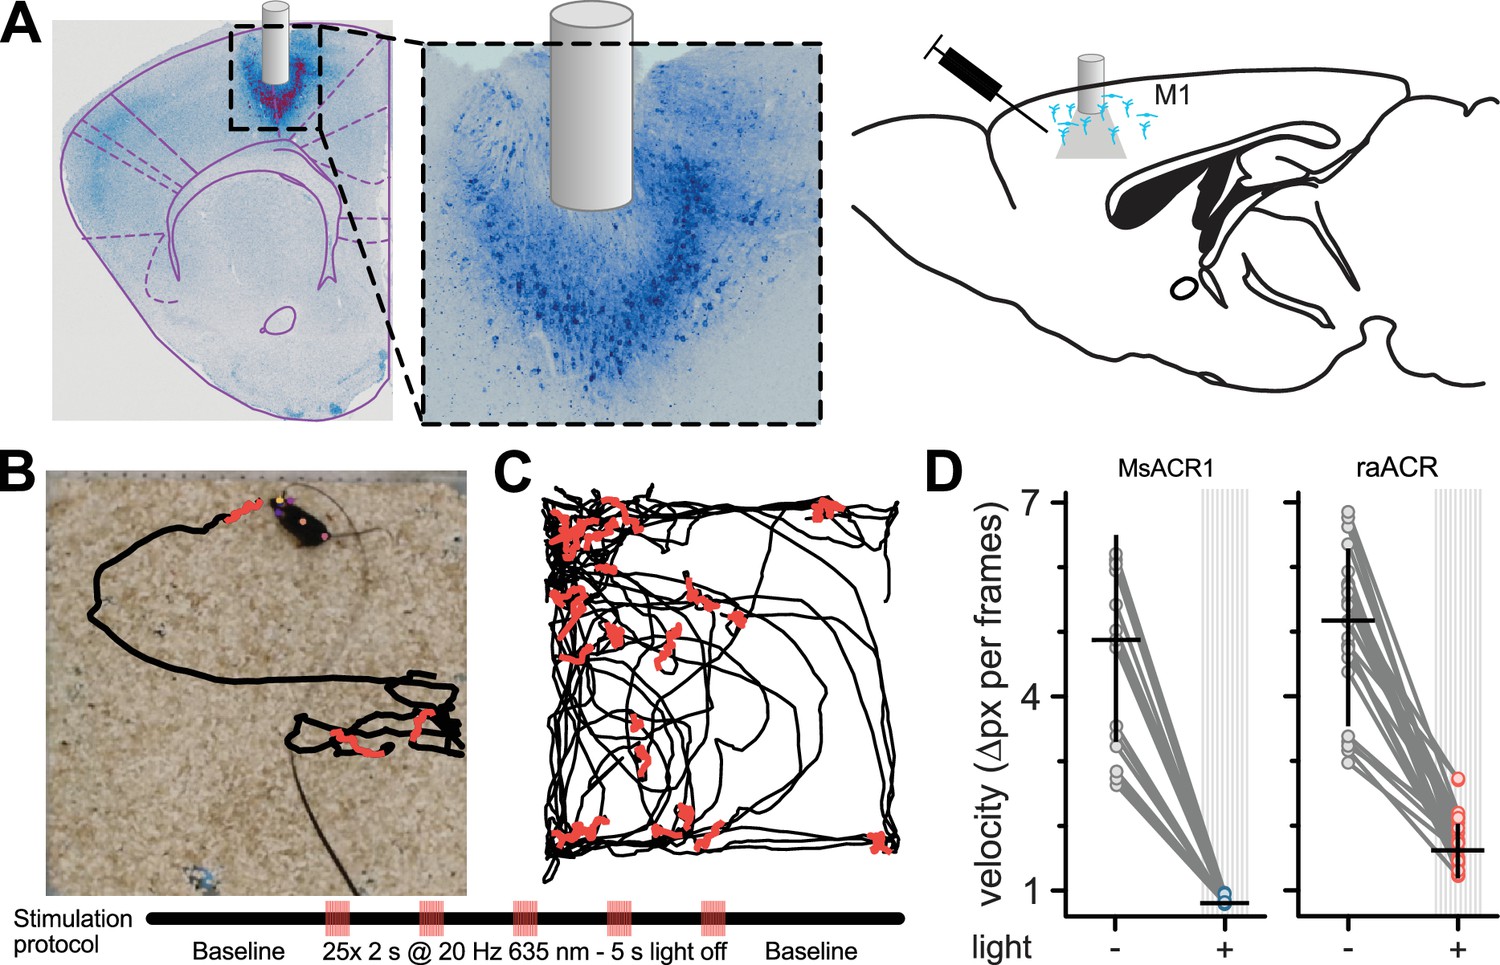
Inhibition of locomotion in rodents in vivo using MsACR1 and raACR.
(A) Confocal images of coronal brain slices confirm the expression of raACR in the primary motor cortex (M1) and the accurate placement of the optical cannula. A close-up of the injection site confirms homogenous expression in the transduced brain volume with no apparent neuronal degeneration. (B) Experimental design and stimulation protocol. Animals were allowed to explore the arena for 1 min before stimulation at 20 Hz with 635 nm for 2 s. (C) The trajectory of a mouse for bouts with no illumination (black) and periods during light stimulation (red). (D) Calculated velocity based on pixel deviation during two consecutive frames for periods with illumination (+) and no illumination (Mann–Whitney U = 23, p < 0.01).
Figure 5
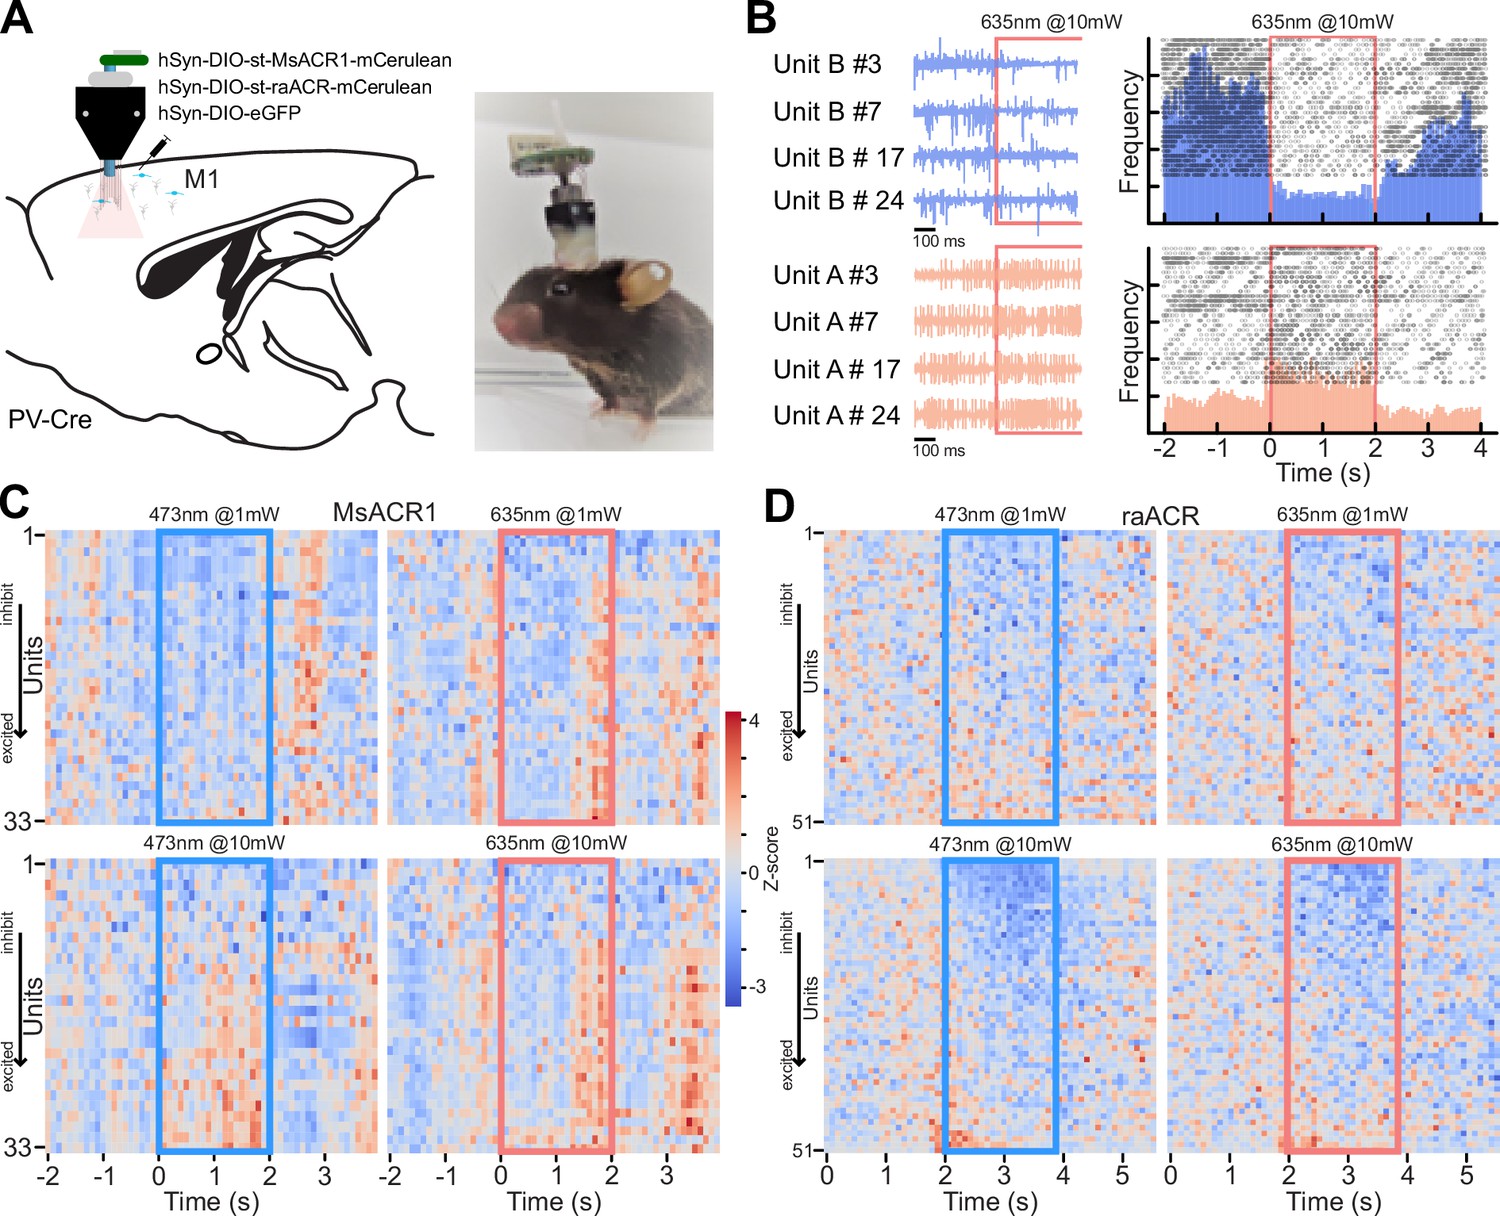
Activation of st-MsACR1 and st-raACR in PV-Cre neurons in M1 leads to complex changes in firing rate.
(A) Illustration of the injection strategy, viral constructs, optrode design, and implantation in PV-Cre mice. The diagram shows the targeting of M1 with hSyn-DIO-st-MsACR1-mCerulean, hSyn-DIO-st-raACR-mCerulean, and hSyn-DIO-eGFP. (B) Recordings from a single electrode 500 ms before and during light stimulation of raACR at 10 mW, 635 nm, in four repeats. Blue traces (Unit B) exhibit a decrease in spiking rate compared to baseline firing during illumination, while traces from Unit A show a repeated increase in firing rate. The peri-stimulus time histogram (PSTH) confirms clear inhibition during light stimulation over the entire 2-s period (upper, blue histogram) and an increase in firing rate (lower, red histogram). (C, D) Summary of the entire dataset as ranked Z-scores for 33 units expressing MsACR1 and 51 units expressing raACR, respectively. Units that respond with reduced spiking upon illumination are displayed at the top of the heat map, while units that respond with increased spiking are shown at the bottom. The heat maps show the Z-scored firing rates for blue light (473 nm) at 1 and 10 mW and red light (635 nm) at 1 and 10 mW.
Appendix 1—figure 1
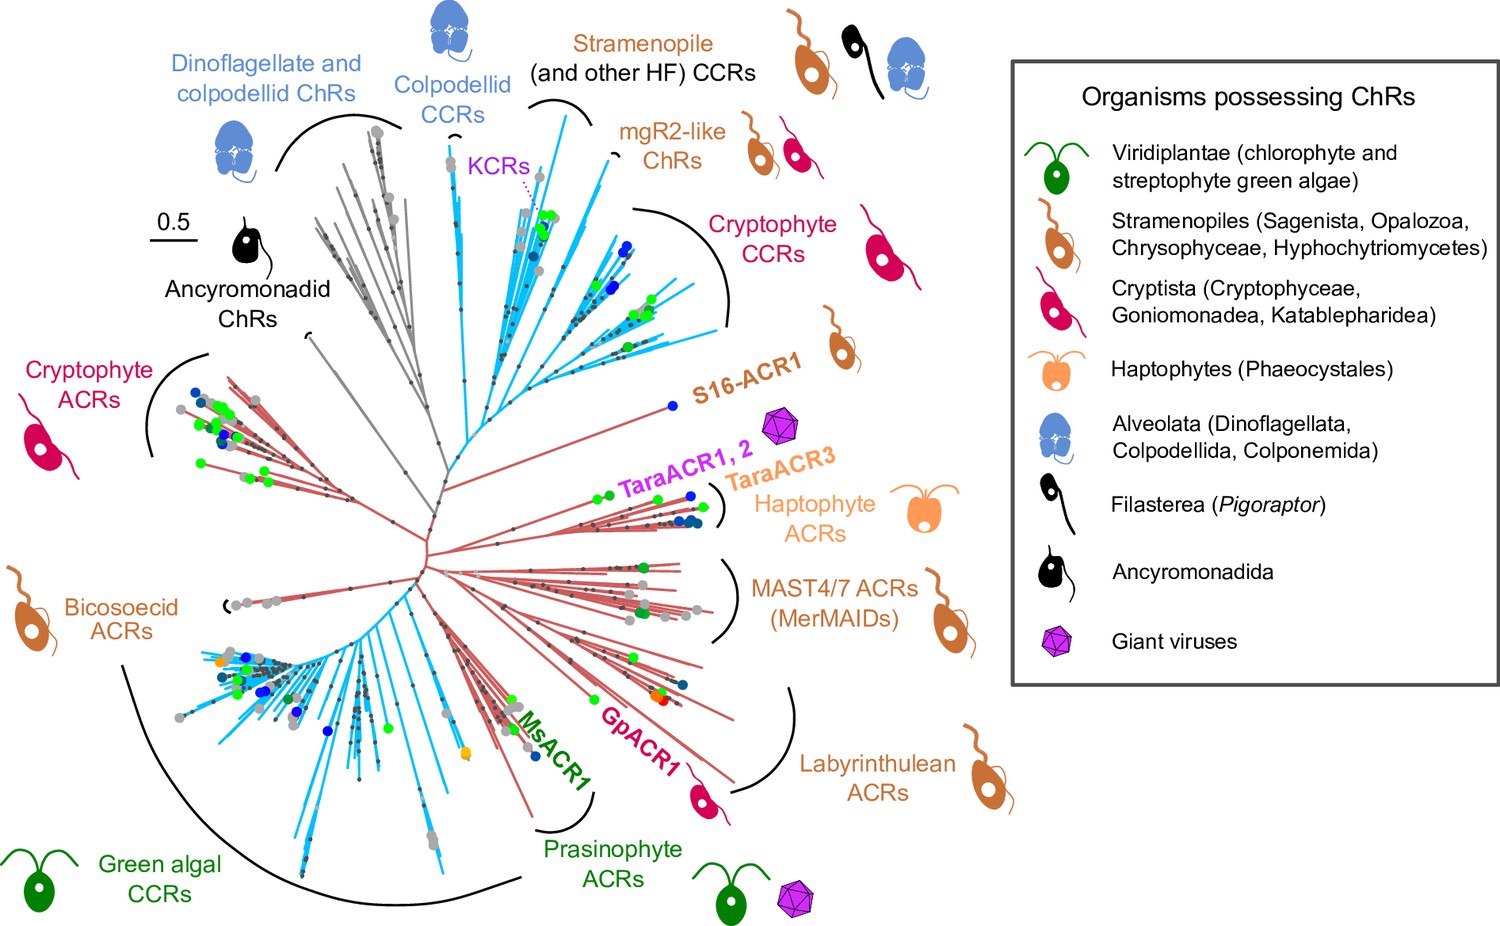
Maximum-likelihood phylogenetic reconstruction of relationships among known channelrhodopsins.
The sequences chosen for the analysis were taken from the Catalog of Natural Channelrhodopsins (Rozenberg, 2023). Names based on the taxonomic affiliation of the organisms possessing the corresponding genes are indicated for major clades. The clades are colored according to the known or putative ion selectivity of their members: red for ACRs and blue for cation-conducting ChRs (CCRs). The color of the dots at the edge tips reflects λmax with gray dots corresponding to proteins known to generate photocurrents but having their λmax not yet determined. Dots on the internal branches reflect ultrafast bootstrap values: black for ≥95 and gray for ≥90. The positions of the proteins characterized here are highlighted with labels. HF – heterotrophic flagellates.
Appendix 1—figure 2
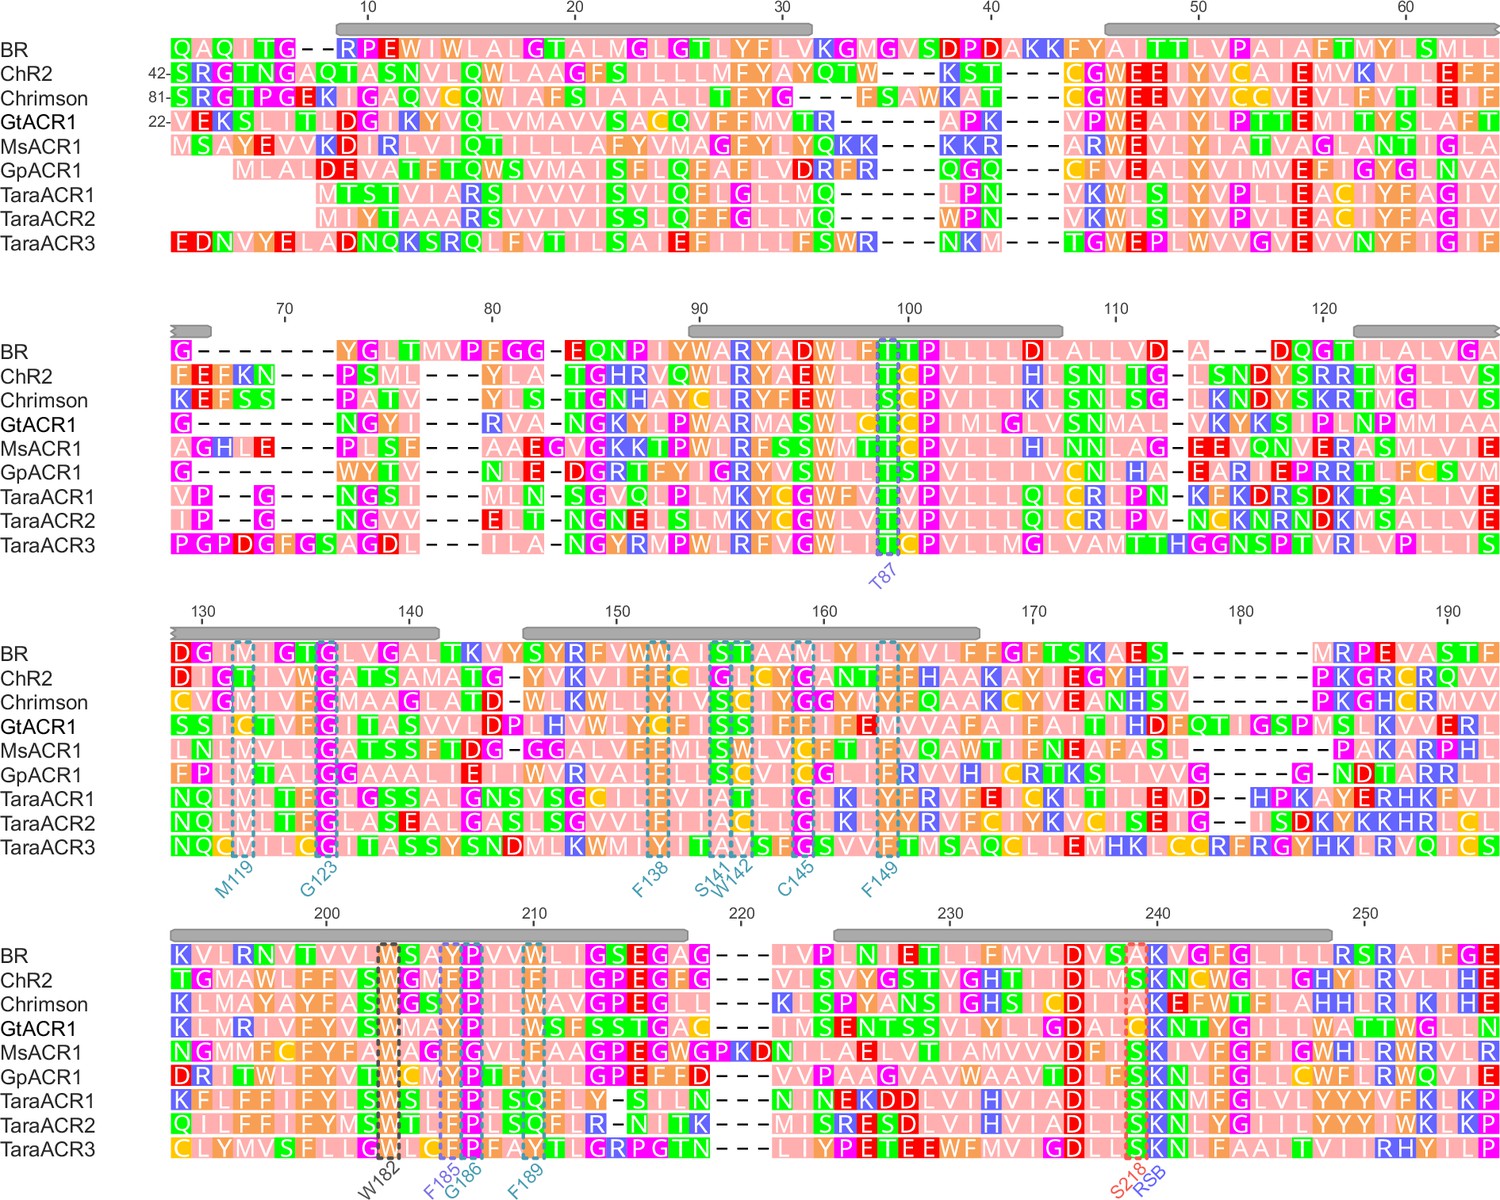
Alignment of the rhodopsin domains of the channelrhodopsins (ChRs) tested in the current study and chosen reference proteins.
The alignment was constructed using structural information using the crystal structures of BR (PDB: 1AP9), ChR2 (6EID), Chrimson (5ZIH), and GtACR1 (6CSM) and AlphaFold structures for the ChRs studied here. Positions for which MsACR1 mutants were tested are indicated below. The gray bars above the alignment columns indicate transmembrane regions as reported in the OPM database for ChR2.
Appendix 1—figure 3
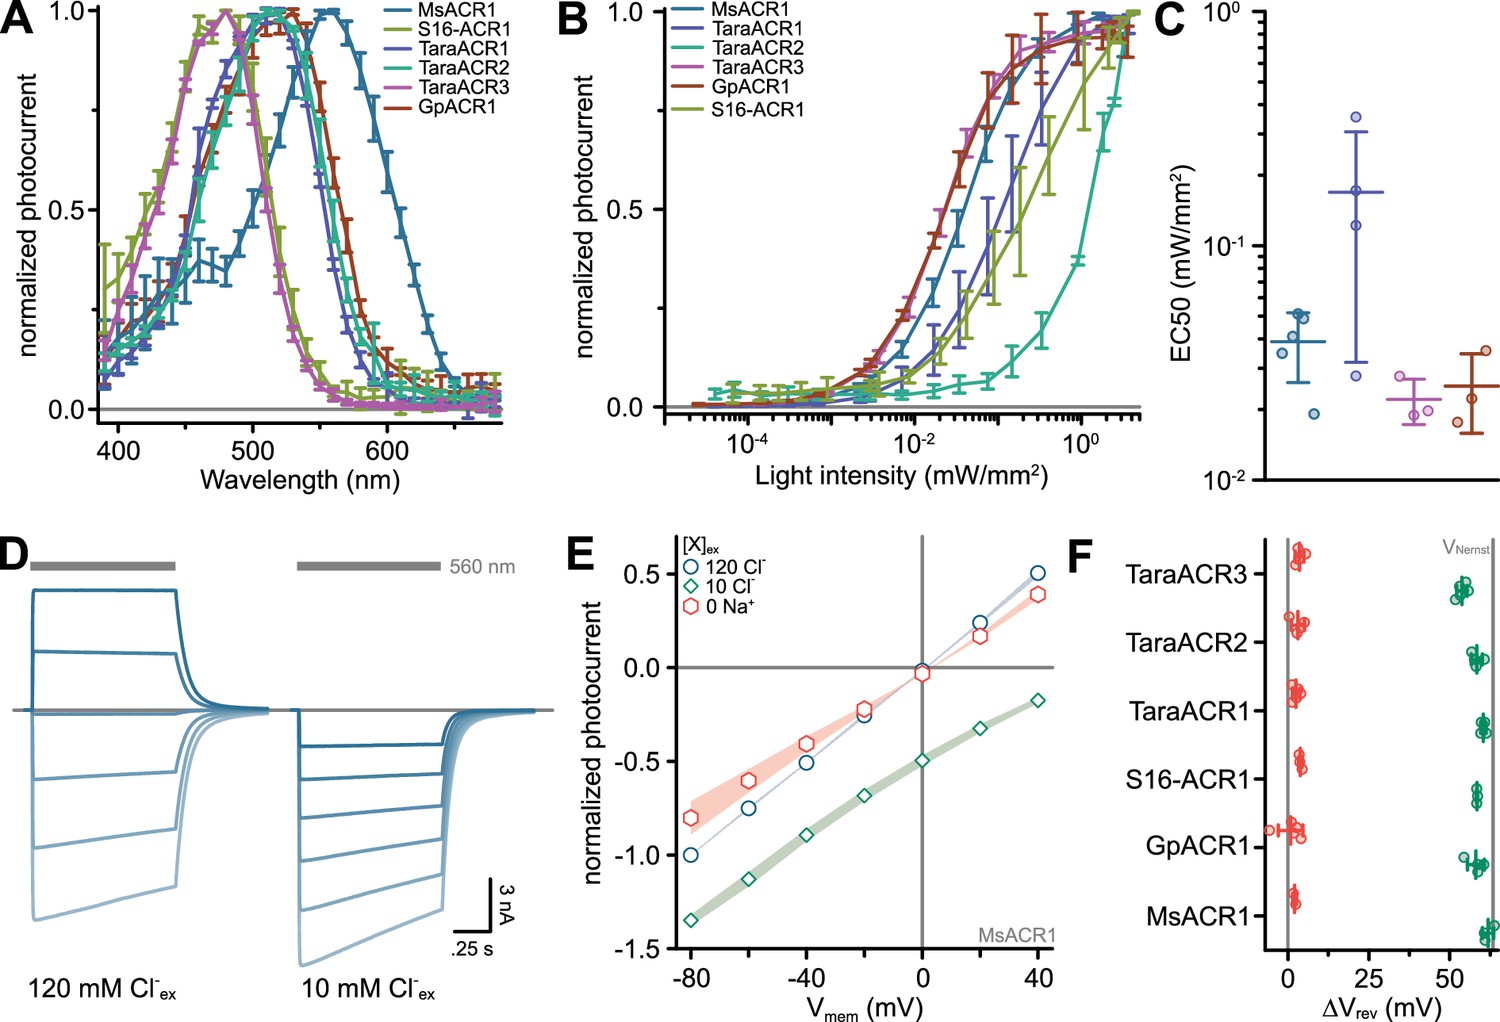
Light sensitivity and ion selectivity of identified ACRs.
(A) Full action spectra of identified ACRs. Shown are mean ± standard deviation connected by lines. (B) Light titration of identified ACRs at light intensities between 38 nW/mm2 and 3.2 mW/mm2 using 1-s light pulses. Shown are mean ± standard error of the mean (SEM) connected by lines. (C) Half-maximal activation light intensity determined by the logarithmic fit of light titration curves. Lines are mean ± standard deviation, and circles are data points of single measurements (n ≥ 3 for all constructs). (D) Exemplary photocurrent traces of MsACR1 upon activation with 560 nm light at the indicated extracellular Cl− concentration. (E) Current–voltage relationship of MsACR1 at indicated extracellular ion conditions. Shown are mean ± SEM. (F) Reversal potential shifts (ΔVrev) upon exchange of the extracellular buffer. Lines are mean ± standard deviation, and circles are data points of single measurements (n ≥ 3 for all constructs).
-
Appendix 1—figure 3—source data 1
Source data for electrophysiological analysis to determine light sensitivity and ion selectivity of identified ACRs presented in Appendix 1—figure 3A-C, E, F.
- https://cdn.elifesciences.org/articles/90100/elife-90100-app1-fig3-data1-v1.xlsx
Appendix 1—figure 4
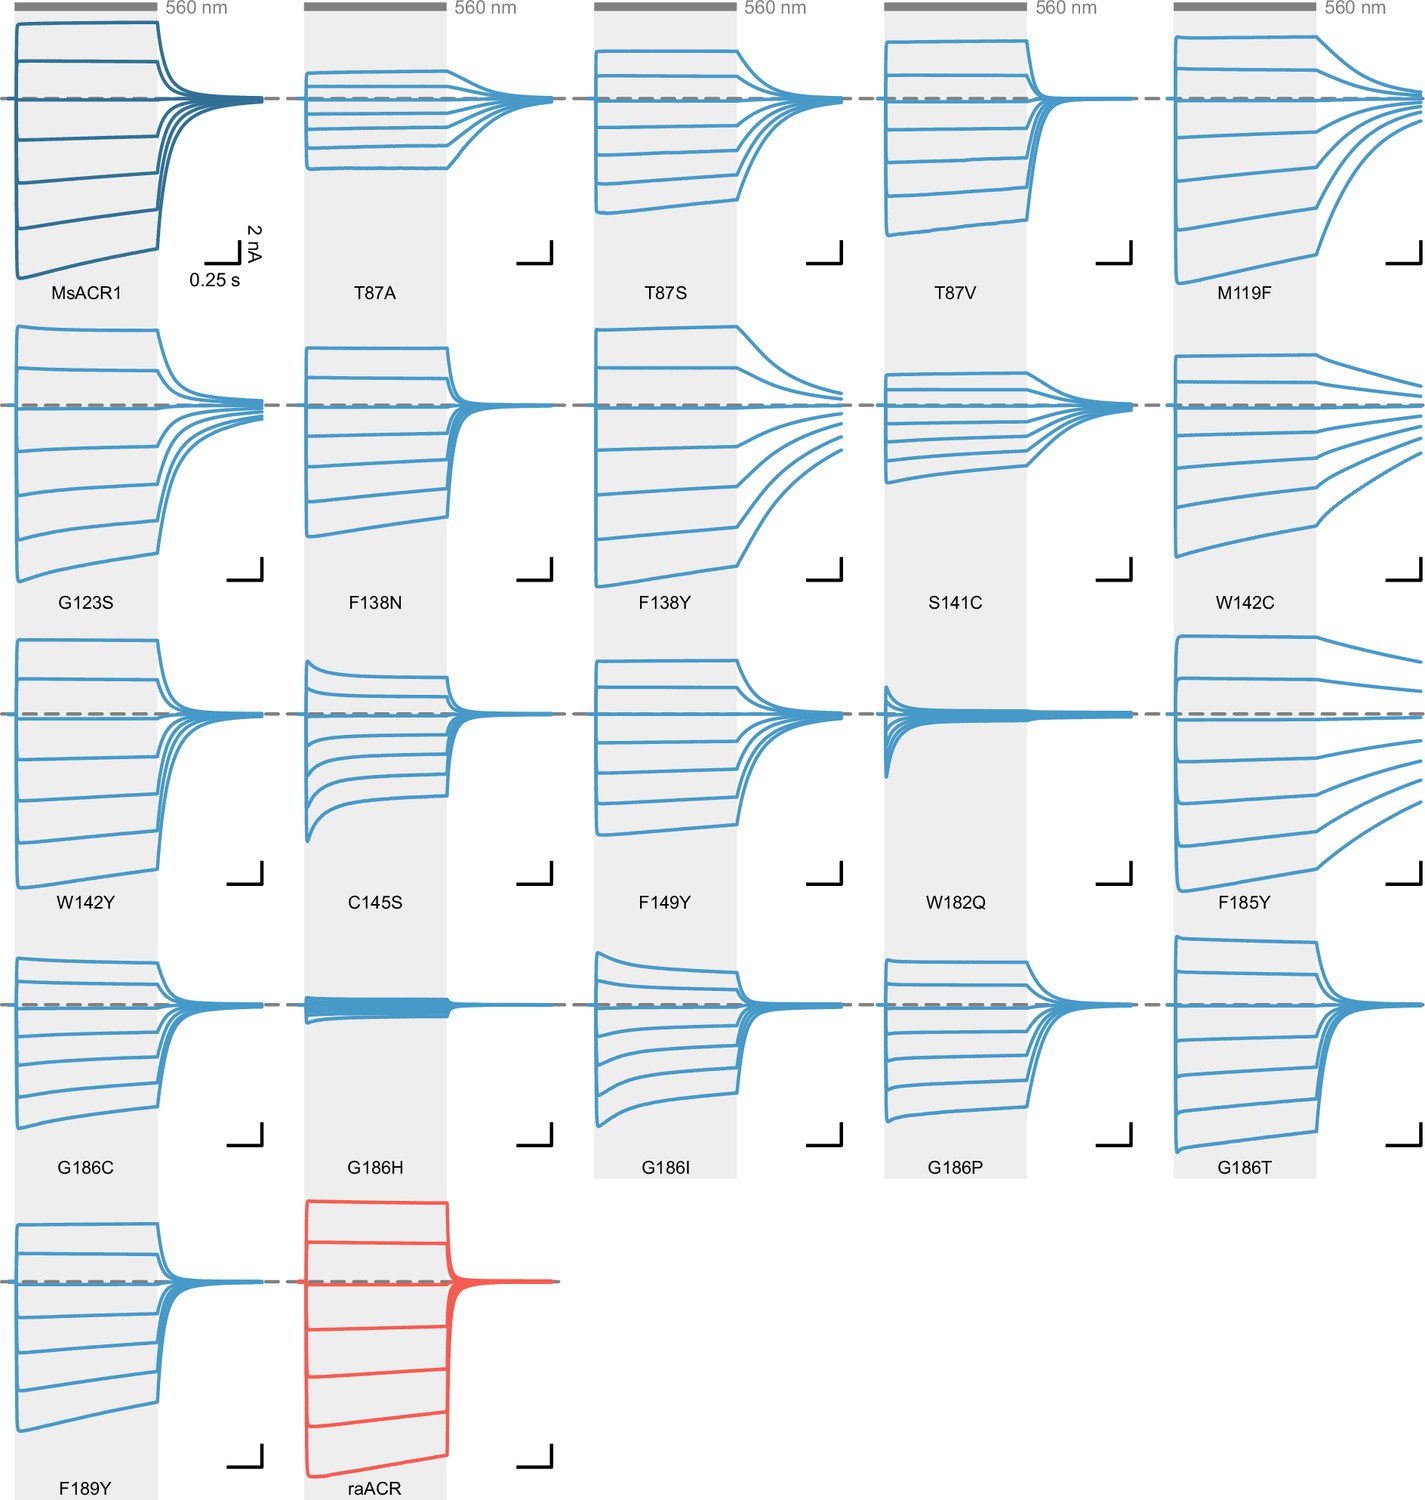
Example photocurrent traces of MsACR1 wild-type and mutants.
Photocurrent traces of MsACR1 and all mutants tested in this study, measured in ND7/23 cells. Photocurrents were elicited with 560 nm light (gray bars) at membrane voltages between −80 and +40 mV in steps of 20 mV. raACR is MsACR1-S218A.
Appendix 1—figure 5
The red-light activity of ACRs.
(A) Structural model of the MsACR1. Residue side chains and the all-trans-retinal chromophore are shown as sticks except for G123 and G186, where the Cɑ is shown as a sphere. Oxygen is colored in red, nitrogen in blue, and sulfur in yellow. (B) Full action spectra of MsACR1 and raACR. Shown are mean ± standard error of the mean (SEM) connected by lines. (C) Photocurrent amplitude of GtACR1, MsACR1, and raACR upon activation with 560 and 692 nm light. Lines are mean ± standard deviation, and circles are data points of single measurements (n = 3 for all constructs).
-
Appendix 1—figure 5—source data 1
Source data for electrophysiological analysis to determine red-light activity of ACRs presented in Appendix 1—figure 5B and C.
- https://cdn.elifesciences.org/articles/90100/elife-90100-app1-fig5-data1-v1.xlsx
Appendix 1—figure 6
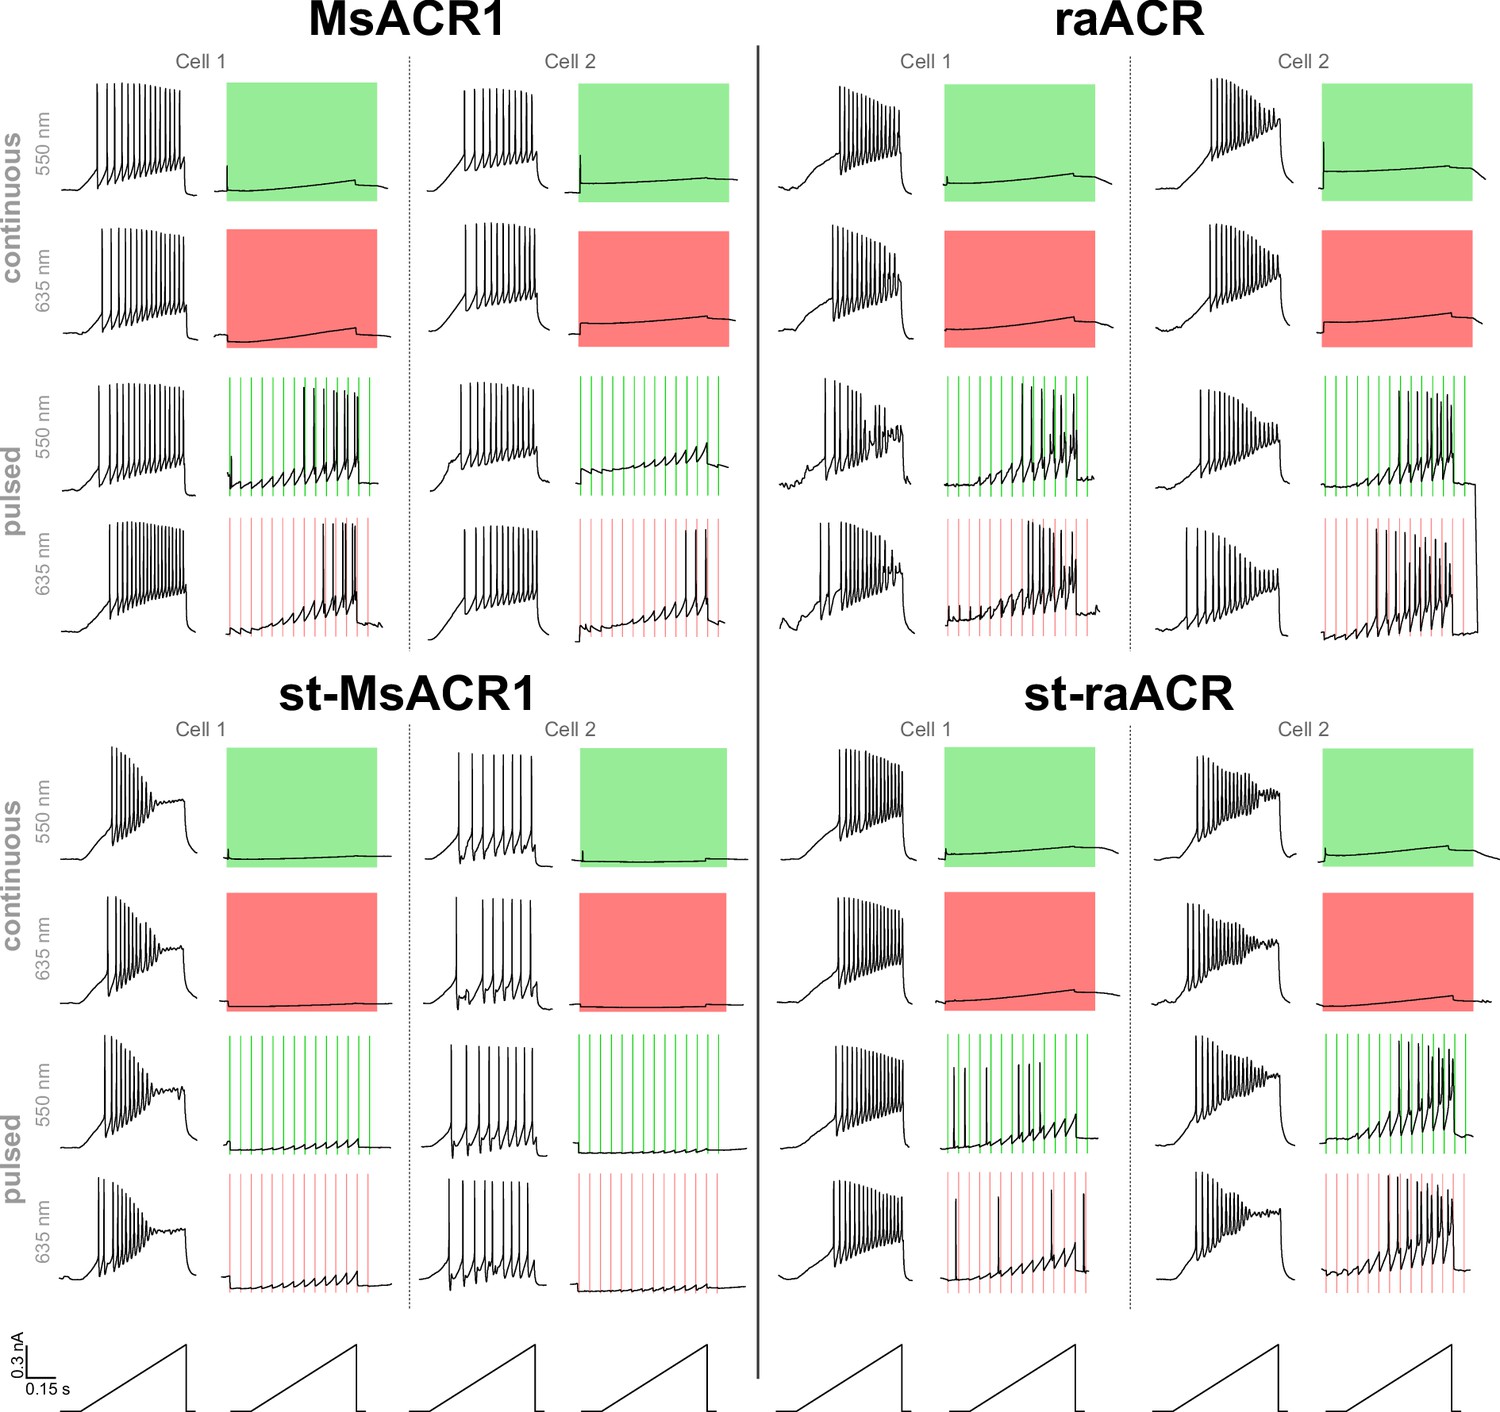
Example traces of MsACR1 and raACR in neurons.
Voltage traces of MsACR1, raACR, and their soma-targeted versions expressing in hippocampal neurons upon current ramps under no light, continuous or 10 Hz pulsed illumination with 550 or 635 nm light.
Appendix 1—figure 7
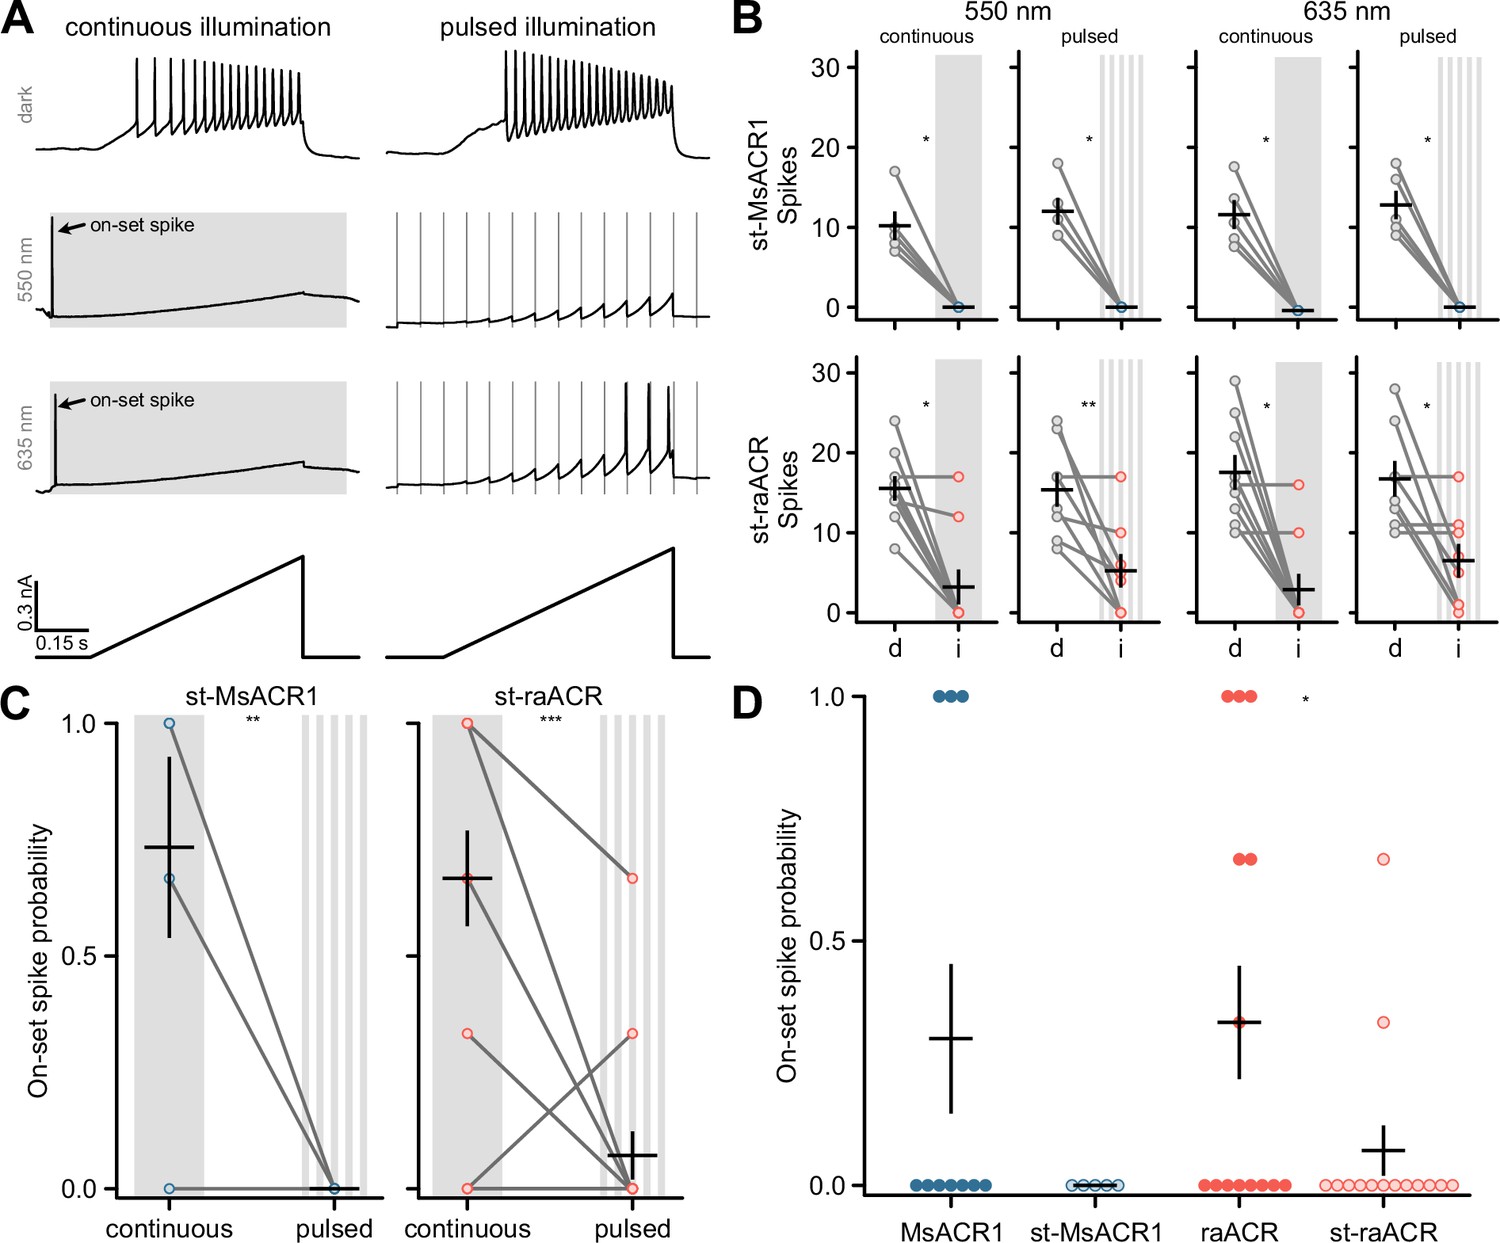
Soma targeting of MsACR1 and raACR.
(A) Stimulation and illumination paradigms used to assess silencing efficiency for soma-targeted MsACR1 and raACR in dissociated hippocampal neurons. (B) Spikes elicited by current-ramp injection in no light (d) or upon continuous or pulsed illumination (i) of 550 or 635 nm in neurons expressing MsACR1 (upper row) or raACR (lower row), as shown in (A). Black lines are mean ± standard error, and circles represent single measurements (n = 5–9). Paired Wilcoxon or Student’s t-tests were used for st-MsACR1 and st-raACR comparisons (p < 0.05). (C) Wilcoxon-test statistic (one-sided) for the occurrence of a light-evoked spike during continuous and pulsed light stimulation of soma-targeted MsACR1 and raACR (n = 5–14), p < 0.05. (D) Wilcoxon-test statistic (one-sided) for the occurrence of a light-evoked spike during pulsed light stimulation (n = 5–16), ns: p > 0.05, *: p <= 0.05, **: p <= 0.01, ***: p <= 0.001
Appendix 1—figure 8
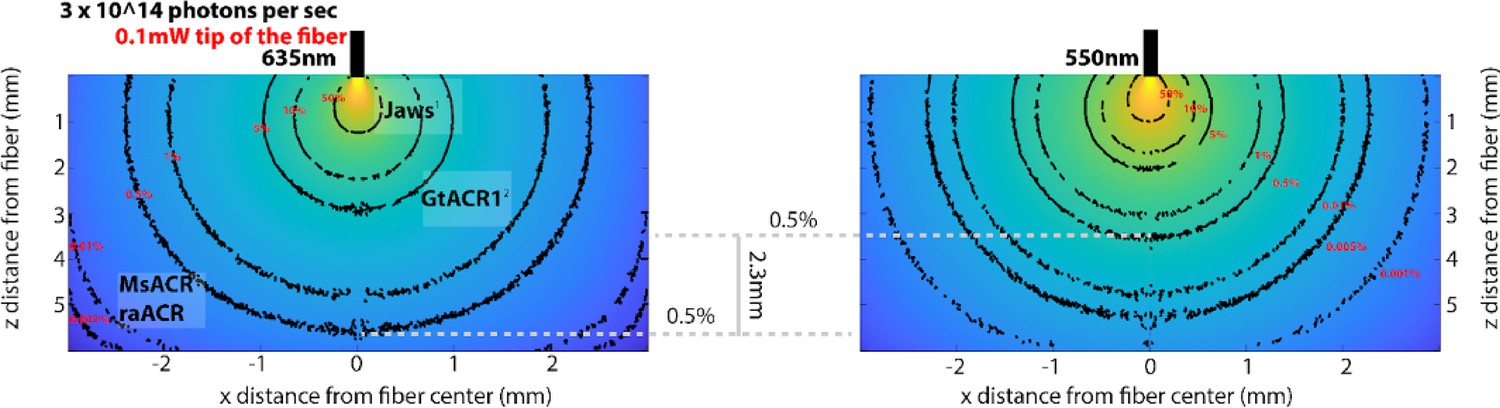
Modeling light propagation at 635 and 550 nm via Monte Carlo simulation.
To model the propagation of photons with different wavelengths (635 and 550 nm) through brain tissue, we utilized the script developed by Stujenske et al., 2015. We initialized the script with a numerical aperture of 0.5 and a fiber radius of 0.1 mm. The absorption coefficient, scatter, and anisotropy parameters were based on the work of Johansson, 2010. We simulated 10 million photons at each wavelength (635 nm on the left and 550 nm on the right). The isolines (depicted in black with red labels) indicate the percentage reduction in the number of photons accordingly. Comparing this reduction to 0.5% of the initial number of photons leaving the optical fiber reveals that photons at a wavelength of 635 nm travel, on a population level, 2.3 mm further than corresponding photons at 550 nm with similar attenuation. We marked the half-maximum activation light intensities (ED50/mW per mm2) for different inhibitory optogenetic tools: red-shifted chloride pump Jaws (Chuong et al., 2014), GtACR1 (Govorunova et al., 2015), and MsACR/raACR (from this study). Note: The range of photons is smaller at 635 nm, and the same color space is used for both graphs, making the changes at 635 nm appear to decrease more drastically, which may seem counterintuitive.
Appendix 1—figure 9
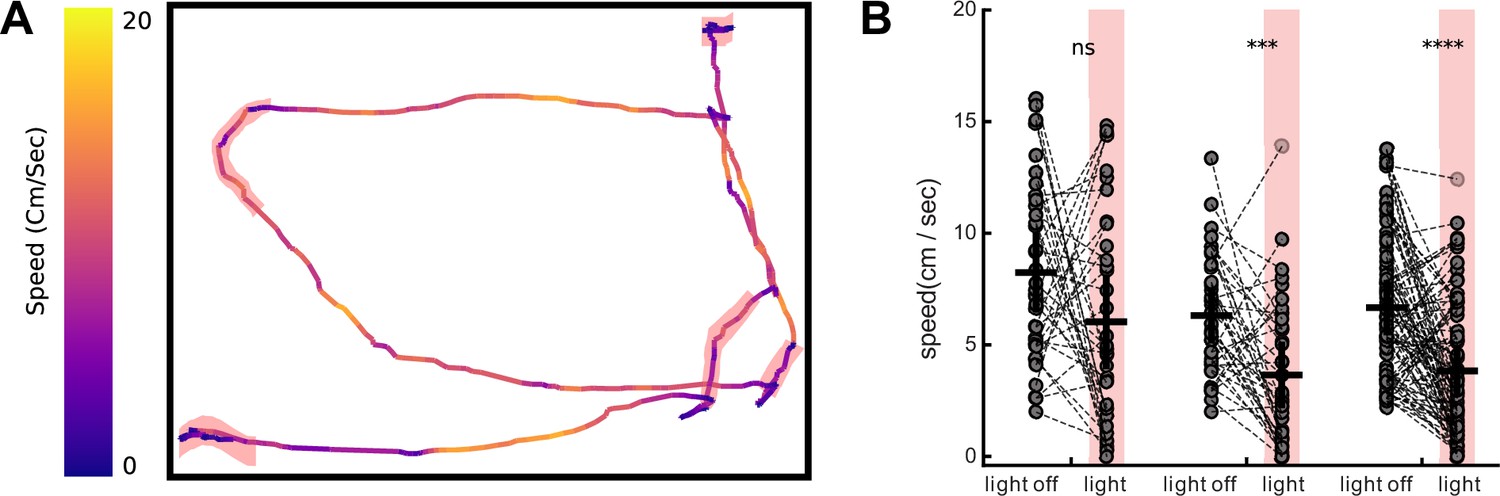
Activation of MsACR1 and raACR in PV-positive neurons in primary motor cortex leads to reduced locomotion in OpenField test.
(A) Speed and trajectory of one example raACR mouse across five stimulation bouts (red highlights). (B) Calculated average velocity 2 s prior to and during light stimulation. Each mouse underwent three non-consecutive sessions and only trials in which the mouse had an average speed of 2.5 cm/s prior to stimulation were used to eliminate persistent immobility. Left to right: eGFP control (n = 2), MsACR1 (n = 2), and raACR (n = 3) (Mann–Whitney U, ns: p > 0.05, ***: p < 0.001, ****: p < 0.0001).
Additional files
-
MDAR checklist
- https://cdn.elifesciences.org/articles/90100/elife-90100-mdarchecklist1-v1.docx
-
Appendix 1—figure 3—source data 1
Source data for electrophysiological analysis to determine light sensitivity and ion selectivity of identified ACRs presented in Appendix 1—figure 3A-C, E, F.
- https://cdn.elifesciences.org/articles/90100/elife-90100-app1-fig3-data1-v1.xlsx
-
Appendix 1—figure 5—source data 1
Source data for electrophysiological analysis to determine red-light activity of ACRs presented in Appendix 1—figure 5B and C.
- https://cdn.elifesciences.org/articles/90100/elife-90100-app1-fig5-data1-v1.xlsx
Download links
A two-part list of links to download the article, or parts of the article, in various formats.
Downloads (link to download the article as PDF)
Open citations (links to open the citations from this article in various online reference manager services)
Cite this article (links to download the citations from this article in formats compatible with various reference manager tools)
Robust optogenetic inhibition with red-light-sensitive anion-conducting channelrhodopsins
eLife 12:RP90100.
https://doi.org/10.7554/eLife.90100.3


