Differential susceptibility of male and female germ cells to glucocorticoid-mediated signaling
- Department of Obstetrics, Gynecology and Reproductive Sciences, Center for Reproductive Sciences, Eli and Edythe Broad Center of Regeneration Medicine and Stem Cell Research, University of California, San Francisco, United States
Figures
Figure 1 with 1 supplement
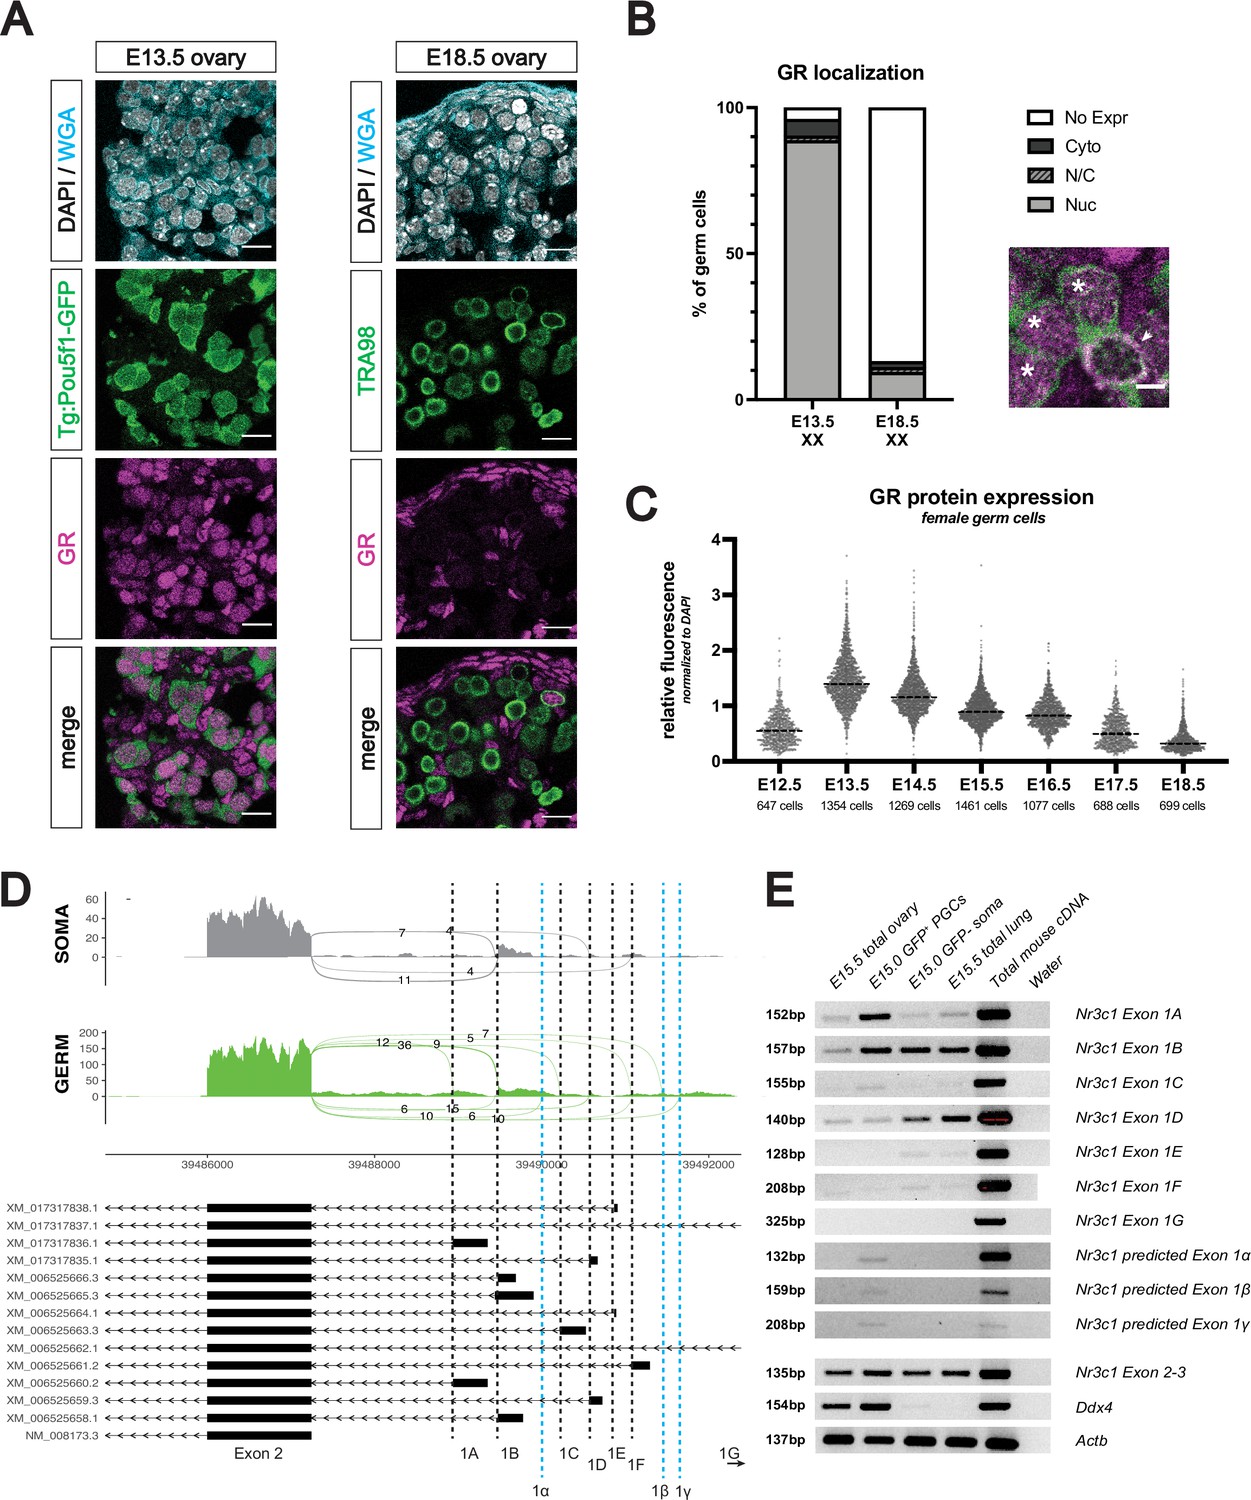
The glucocorticoid receptor is expressed in the developing fetal oocyte.
(A) IF staining showing expression of GR in mouse fetal ovary sections at E13.5 (left) and E18.5 (right), counterstained with DAPI. Germ cells are marked by either transgenic Pou5f1-GFP or TRA98. Cellular membranes were stained with wheat germ agglutinin (WGA) to facilitate computational segmentation of individual cells. Scale bars: 15 μm. (B) Quantification of GR subcellular localization within germ cells of the fetal ovary. Cells from the ovaries of three individual embryos were scored, with a total of 1423 cells and 859 cells analyzed at E13.5 and E18.5, respectively. Zoomed in image showing examples of both nuclear (asterisk) and cytoplasmic (arrowhead) GR staining in germ cells. Scale bar: 5 μm. (C) Quantitative IF analysis of relative GR protein expression in the germ cells across developmental time. Individual cells were computationally segmented using WGA, and GR protein levels were normalized to DAPI on an individual cell basis. Images and total cell numbers counted were obtained from a minimum of three ovaries from three individual embryos at each developmental stage. (D) Sashimi plots showing differences in alternative exon 1 splicing events at the Nr3c1 locus between ovarian germ and somatic cells. Plots were generated from paired-end RNA-seq data of E15.5 germ and somatic cells (saline control; Figure 3A). Previously annotated exon 1 variants have been arbitrarily labeled as exons 1 A through 1 G (with exon 1 A being closest to exon 2). Three novel exon 1 splice sites identified in this study have been labeled as predicted exons 1α, 1β, and 1γ (marked by the dotted blue lines). (E) RT-PCR validation of exon 1 variant usage in bulk E15.5 ovary, as well as sorted populations of germ and somatic cells at E15.0. Total mouse cDNA and water serve as positive and negative controls for all reactions, respectively. E15.5 total lung lysate serves as a positive control for GR expression. Primer set spanning Nr3c1 exon 2–3 junction (present in all isoforms) was used as a positive control for total Nr3c1 transcript.
-
Figure 1—source data 1
Original blot file (1 of 3) for RT-PCR in Figure 1E (Nr3c1 exons 1 A, 1B, 1 C, 1D, 1E and 1 F).
- https://cdn.elifesciences.org/articles/90164/elife-90164-fig1-data1-v1.pdf
-
Figure 1—source data 2
Original blot file (2 of 3) for RT-PCR in Figure 1E (Nr3c1 exons 1 G, Nr3c1 exon 2–3, and Ddx4).
- https://cdn.elifesciences.org/articles/90164/elife-90164-fig1-data2-v1.pdf
-
Figure 1—source data 3
Original blot file (3 of 3) for RT-PCR in Figure 1E (Nr3c1 exons 1α, 1β, 1γ, and Actb).
- https://cdn.elifesciences.org/articles/90164/elife-90164-fig1-data3-v1.pdf
-
Figure 1—source data 4
PDF file containing Figure 1E with original RT-PCR blot files, highlighting bands used in Figure 1E with sample annotations.
- https://cdn.elifesciences.org/articles/90164/elife-90164-fig1-data4-v1.pdf
Figure 1—figure supplement 1
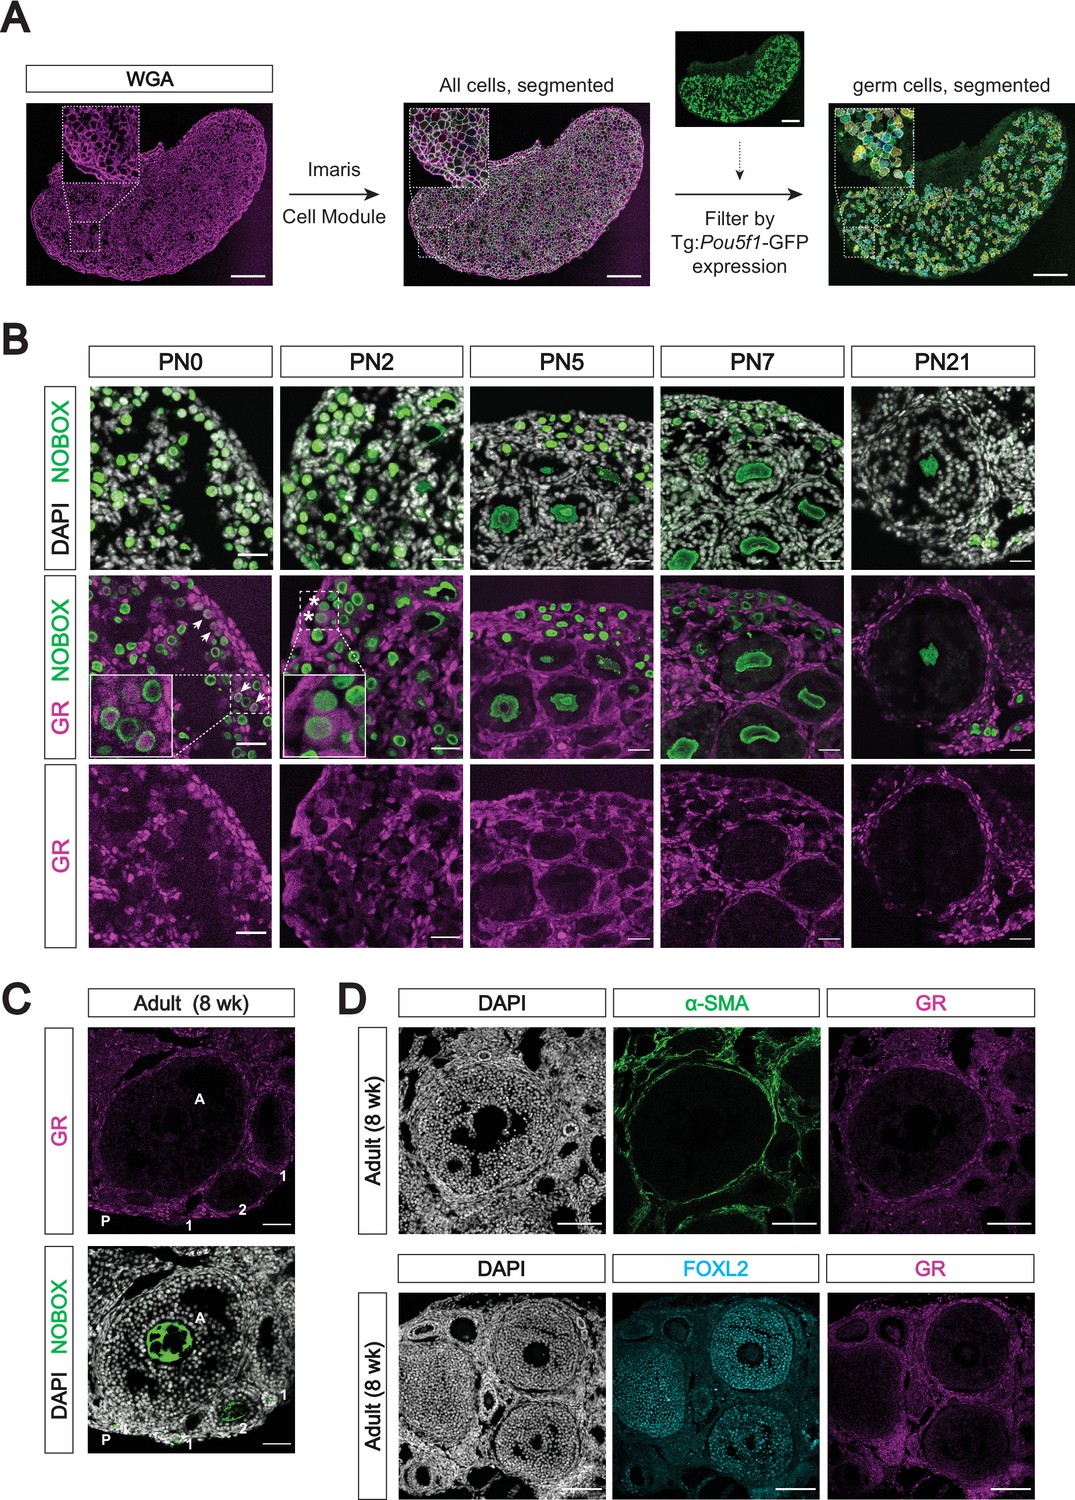
The glucocorticoid receptor is not expressed in the late postnatal and adult oocyte.
(A) Representative images of computational cell segmentation in histologic sections using Imaris’s Cell module. WGA was used to stain all cellular membranes, and expression of a germ cell marker (here Pou5f1-GFP) was used to filter out germ cells from somatic cells. Scale bars: 100 μm. (B) IF staining showing expression of GR in mouse postnatal ovary sections at PN0, PN2, PN5, PN7, and PN21. Oocytes are marked by NOBOX, and all nuclei are stained with DAPI. Cortical oocytes with remaining GR expression at PN0 are marked by arrowheads, and few remaining oocytes with cytoplasmic GR at PN2 are marked by asterisks. Scale bars: 30 μm. (C) IF staining showing GR expression in the adult mouse ovary at 8 weeks of age. Different follicular stages were determined based on classic morphological features, and are abbreviated as follows: P - primordial follicle; 1 - primary follicle; 2 - secondary follicle; A - antral follicle. Oocytes are marked with NOBOX, and nuclei are stained with DAPI. Scale bars: 50 μm. (D) IF staining showing co-expression of GR and somatic cell markers in the adult ovary. The theca interna layer is broadly marked by smooth muscle actin (α-SMA; top), and the granulosa cells are marked by FOXL2 (bottom). Scale bars: 100 μm.
Figure 2 with 1 supplement
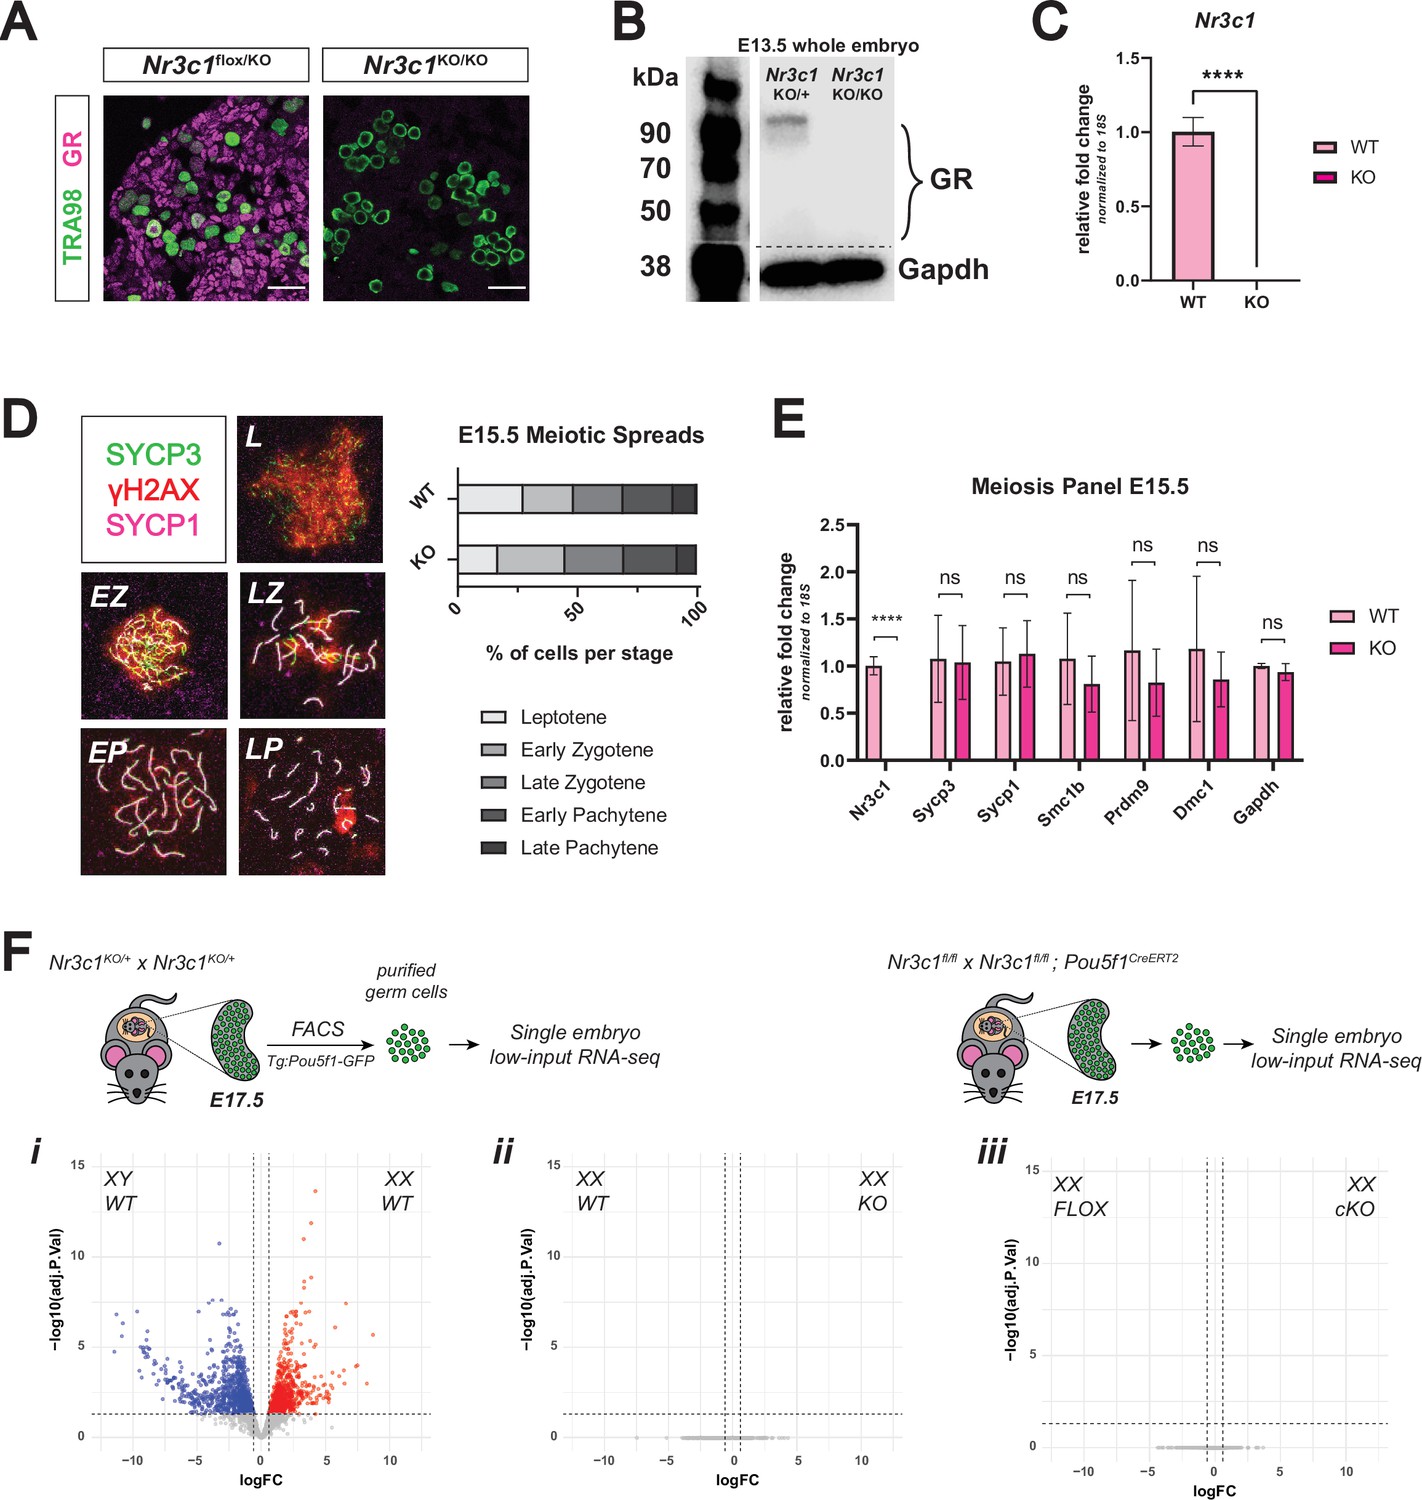
Genetic deletion of the glucocorticoid receptor leads to minimal changes in fetal oocytes.
(A) IF staining for GR in E17.5 ovaries. Nr3c1flox/KO ovaries, which contain one functional floxed allele of GR show robust GR expression, whereas Nr3c1KO/KO ovaries homozygous for the deletion allele show complete loss of GR. Scale bars: 30 μm. (B) Western blot performed on whole cell lysate prepared from entire E13.5 embryos of different genotypes. Membranes were blotted with a GR antibody that recognizes all known GR isoforms, as well as GAPDH as a loading control.(C) qRT-PCR on bulk E15.5 WT (n=3) and KO (n=5) ovaries for Nr3c1, normalized to 18 S ribosomal RNA housekeeping gene using 2-ΔΔCt quantification method. Data are mean ±s.d., and p-values were calculated for each gene using a two-tailed, unpaired t-test, where ****: p≤0.0001. (D) Meiotic spreads performed on germ cell nuclei from E15.5 WT and GR KO ovaries, Left: representative images of meiotic prophase I staging of spreads co-stained with SYCP3 (green), SYCP1 (magenta), and γH2AX (red). Right: Quantification of relative substages based on manual scoring. For WT spreads, a total of 590 nuclei from five embryos were counted; For GR KO spreads, a total of 817 nuclei from seven embryos were counted. L: Leptotene; EZ: Early Zygotene; LZ: Late Zygotene; EP: Early Pachytene; LP: Late Pachytene. (E) qRT-PCR on bulk E15.5 WT (n=3) and KO (n=5) ovaries for a panel of meiotic genes, normalized to 18 S ribosomal RNA housekeeping gene using 2-ΔΔCt quantification method. Nr3c1 serves as a positive control to confirm complete GR knockout, and Gapdh serves as an unchanged negative control. Data are mean ±s.d., and p-values were calculated for each gene using a two-tailed, unpaired t-test, where ****: p≤0.0001, n.s.: not significant. (F) Bulk RNA-seq performed on Tg:Pou5f1-GFP+ sorted germ cells from E17.5 gonads. For each genotype, three to four single-embryo biological replicates were used for low-input library prep followed by 3’ Tag-Seq. Volcano plots show differentially expressed genes (logFC ≥0.6; adjusted p-value ≤0.05) between: (i) WT male and WT female germ cells, (ii) WT and GR KO female germ cells, and (iii) Pou5f1-CreERT2+ GR conditional knockout (cKO) female germ cells and floxed Cre-negative controls.
-
Figure 2—source data 1
Original blot file for western blot in Figure 2B (anti-GR and anti-GAPDH).
- https://cdn.elifesciences.org/articles/90164/elife-90164-fig2-data1-v1.pdf
-
Figure 2—source data 2
PDF files containing Figure 2B, highlighting bands used in Figure 2B with sample annotations.
- https://cdn.elifesciences.org/articles/90164/elife-90164-fig2-data2-v1.pdf
Figure 2—figure supplement 1
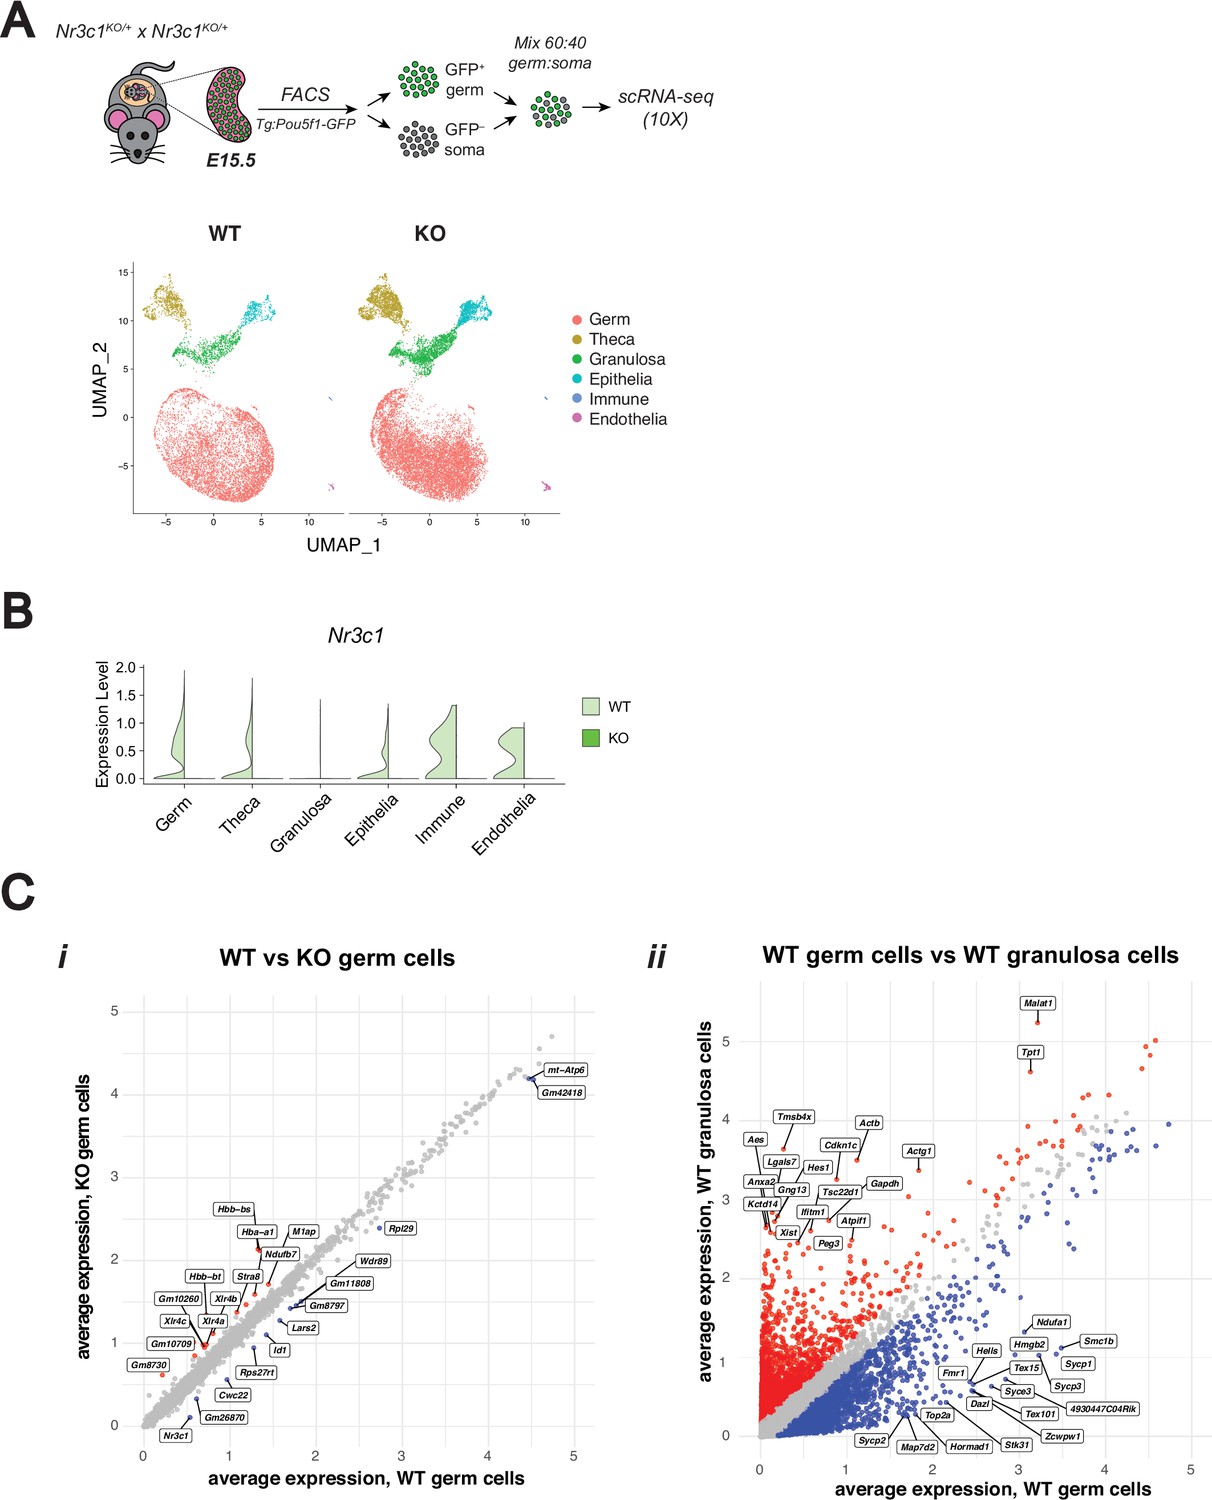
scRNA-seq confirms genetic deletion of the glucocorticoid receptor leads to minimal changes in fetal oocytes.
(A) 10 X Single-cell RNA-sequencing performed on E15.5 WT and GR KO ovaries. A total of n=4 WT ovaries and n=2 KO ovaries were each pooled prior to sorting to enrich for Pou5f1-GFP+ germ cells. UMAP clustering on WT and KO cells, colored by cell type. A total of 24,547 cells post-filtering were analyzed. (B) Violin plot showing Nr3c1 transcript expression in WT vs KO cells across each cell type, confirming GR deletion. (C) Scatter plots comparing log1p normalized average gene expression across total cells of particular conditions: (i) WT vs KO cells within the germ cell cluster, and (ii) WT germ vs WT granulosa cells as a positive control for differential expression analysis. Differentially expressed genes (logFC ≥0.25; adjusted p-value ≤0.05) are labeled in blue or red.
Figure 3 with 1 supplement

Developing ovarian somatic cells, but not germ cells, show robust GR transcriptional activation following exogenous glucocorticoid treatment.
(A) Bulk RNA-seq performed on sorted Tg:Pou5f1-GFP+ germ cells and GFP– somatic cells from fetal ovaries dosed in vivo with dex. Pregnant dams were injected via IP with either 10 μg / g dex or a saline vehicle control at E12.5, E13.5, E14.5, and E15.5, and ovaries were collected for sorting at E15.5. Three biological replicates were used per condition, each consisting of sorted cells from ovaries pooled together from a minimum of two entire independently dosed litters. Volcano plots show dex-induced differentially expressed genes (adjusted p-value ≤0.05) either upregulated (magenta) or downregulated (green) in comparison to vehicle controls for both germ cells, as well as total somatic cell population. (B) Ex vivo culture of E14.5 ovaries for 48 hr with and without 1 μM dex. (i) IF staining for PLZF (Zbtb16) showing induction specifically in the Tg:Pou5f1-GFP– soma, scale bars: 30 μm. (ii) GR shows dynamic subcellular localization in response to ligand, scale bars: 15 μm. (C) Western blot performed on whole cell lysate prepared from adult lung, adult pancreas, adult liver, E13.5 whole ovary, and PN0 whole testis. Membranes were blotted with a GR antibody that recognizes all known GR isoforms, as well as GAPDH as a loading control. The full-length GR protein (“FL GR”) can be seen at just above 90 kDa, and while the truncated inhibitory isoform of GR (“GR-D”) can be seen just below 50 kDa. (D) Sashimi plots showing lack of evidence for intron 8 retention, which would lead to the inhibitory GRβ transcriptional isoform in either ovarian germ or somatic cells. Plots were generated from paired-end RNA-seq data of E15.5 germ and somatic cells (saline control; Figure 3A).
-
Figure 3—source data 1
Original blot file for western blot in Figure 3C (anti-GR and anti-GAPDH).
- https://cdn.elifesciences.org/articles/90164/elife-90164-fig3-data1-v1.pdf
-
Figure 3—source data 2
PDF files containing Figure 3C, highlighting bands used in Figure 3C with sample annotations.
- https://cdn.elifesciences.org/articles/90164/elife-90164-fig3-data2-v1.pdf
Figure 3—figure supplement 1
In vivo dex dosing regimen validation, GO term analysis of RNA-seq from female germ cells dosed with dex in vivo, and meiotic spreads of dex-dosed female germ cell nuclei.
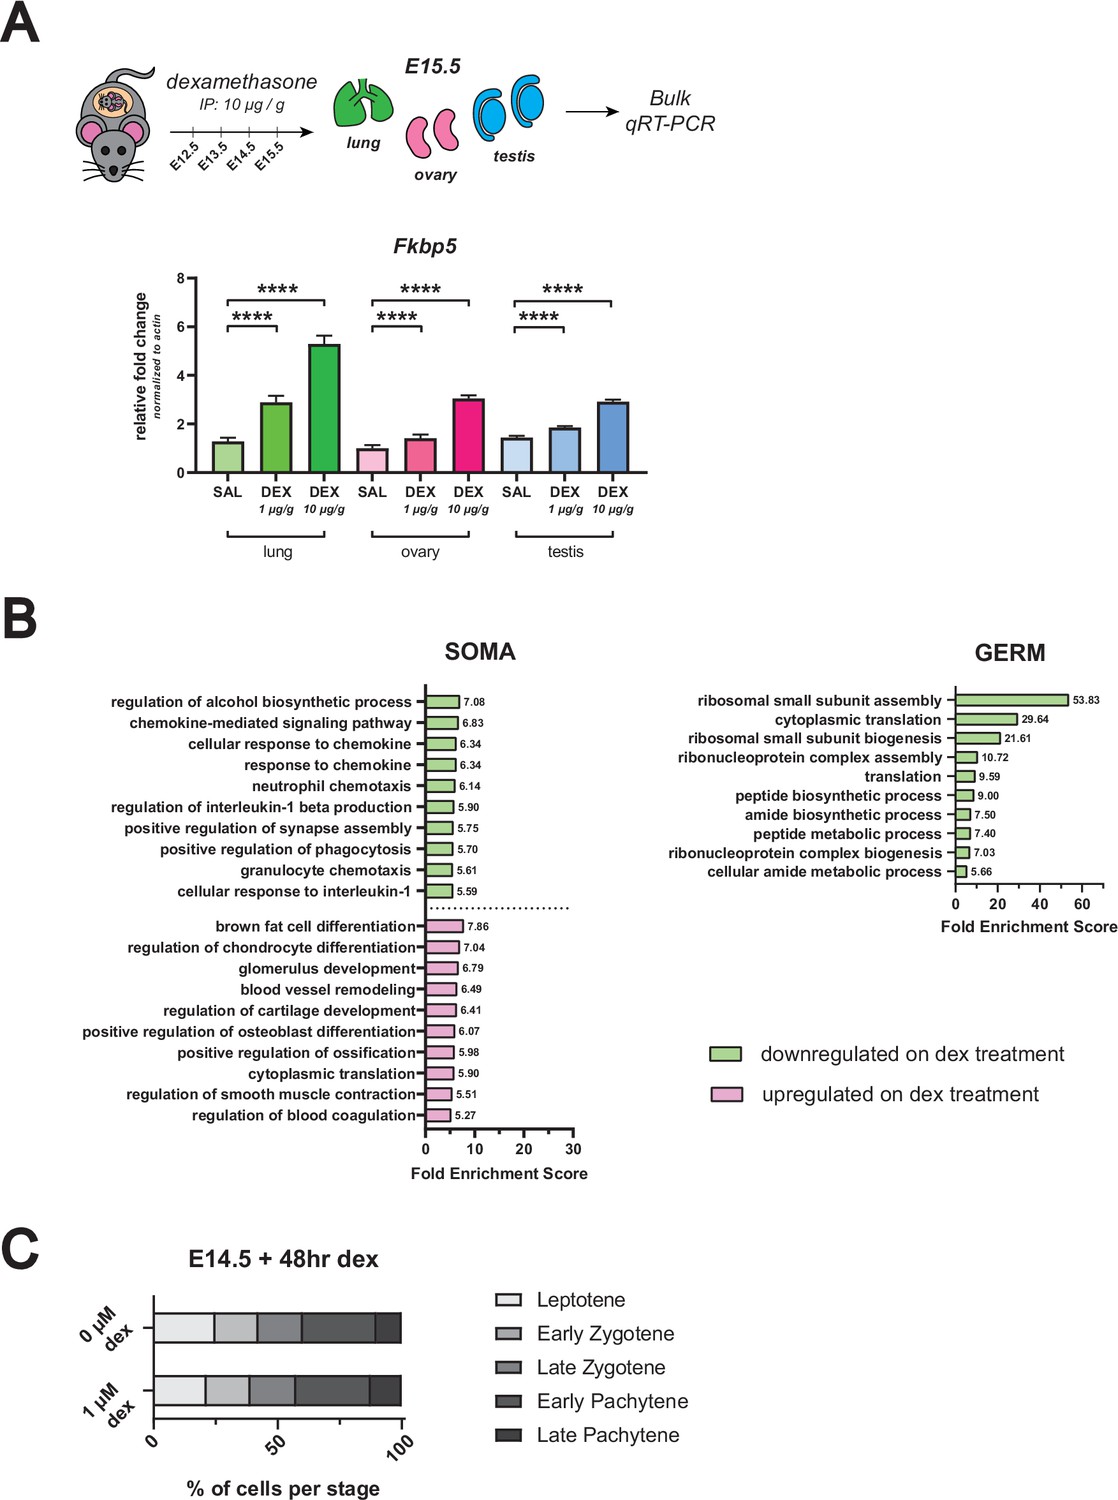
(A) qRT-PCR on bulk E15.5 lung, ovary and testis tissue from in vivo dex-dosed embryos. Expression of Fkbp5, a known canonical GR-responsive gene, is shown following administration with 1 μg/g dex, 10 μg/g dex, or saline vehicle control (n=3 embryos per dose) to verify that maternal administration of dex from E12.5 – E15.5 is able to elicit a transcriptional response in the fetus. Lung serves as a positive control. Data are mean ±s.d., normalized to β-actin housekeeping gene using 2-ΔΔCt quantification method, and p-values were calculated for each dose comparison using a two-tailed, unpaired t-test, where ****: p≤0.0001. (B) GO term enrichment analysis using differentially expressed genes from female in vivo dex-dosed RNA-seq data. The top 10 significant biological processes for upregulated (magenta) and downregulated (green) genes are shown, ranked by fold enrichment score, for both somatic cells and germ cells. Note that no statistically significant enrichment of GO terms was found for the germ cell dex-upregulated gene list. (C) Quantification of relative substages of meiotic spreads performed on germ cell nuclei from E14.5 ovaries cultured for 48 hr ex vivo with or without 1 μM dex. For spreads from 0 μM dex conditions, a total of 357 nuclei from four embryos were counted; For spreads from 1 μM dex conditions, a total of 266 nuclei from four embryos were counted.
Figure 4 with 1 supplement
The glucocorticoid receptor is expressed in the perinatal prospermatogonia and the adult spermatogonia.
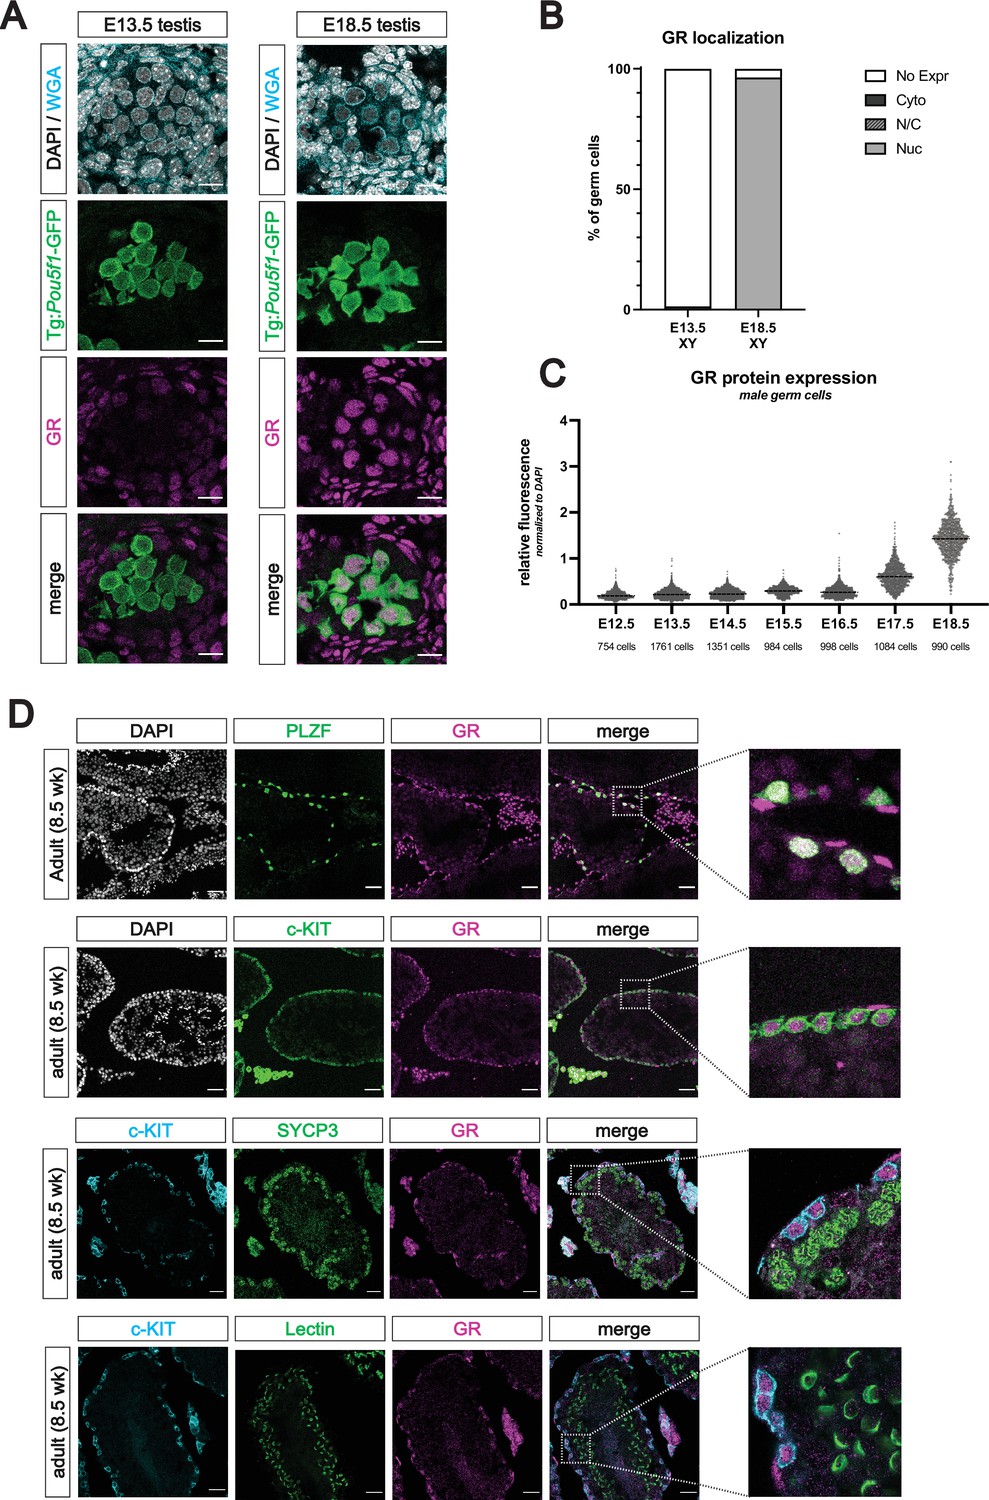
(A) IF staining showing expression of GR in mouse fetal testis sections at E13.5 (left) and E18.5 (right), counterstained with DAPI. Germ cells are marked by transgenic Pou5f1-GFP. Cellular membranes were stained with wheat germ agglutinin (WGA) to facilitate computational segmentation of individual cells. Scale bars: 15 μm. (B) Quantification of GR subcellular localization within germ cells of the fetal testis. Cells from the testes of three individual embryos were scored manually, with a total of 2393 cells and 1364 cells analyzed at E13.5 and E18.5, respectively. (C) Quantitative IF analysis of relative GR protein expression across developmental time in germ cells. Individual cells were computationally segmented using WGA, and GR protein levels were normalized to DAPI on an individual cell basis. Images and total cell numbers counted were obtained from a minimum of three testes from three independent embryos at each developmental stage. (D) IF staining showing expression of GR in mouse adult testis sections. GR expression overlaps with PLZF+ undifferentiated spermatogonia (first row) and c-KIT+ differentiating spermatogonia (second row), zoomed images to highlight overlapping expression. GR is low to absent in SYCP3+ spermatocytes (third row) and PNA Lectin stained spermatids (fourth row). Scale bars: 50 μm (first two rows); 30 μm (last two rows).
Figure 4—figure supplement 1
The glucocorticoid receptor is expressed in the postnatal prospermatogonia.
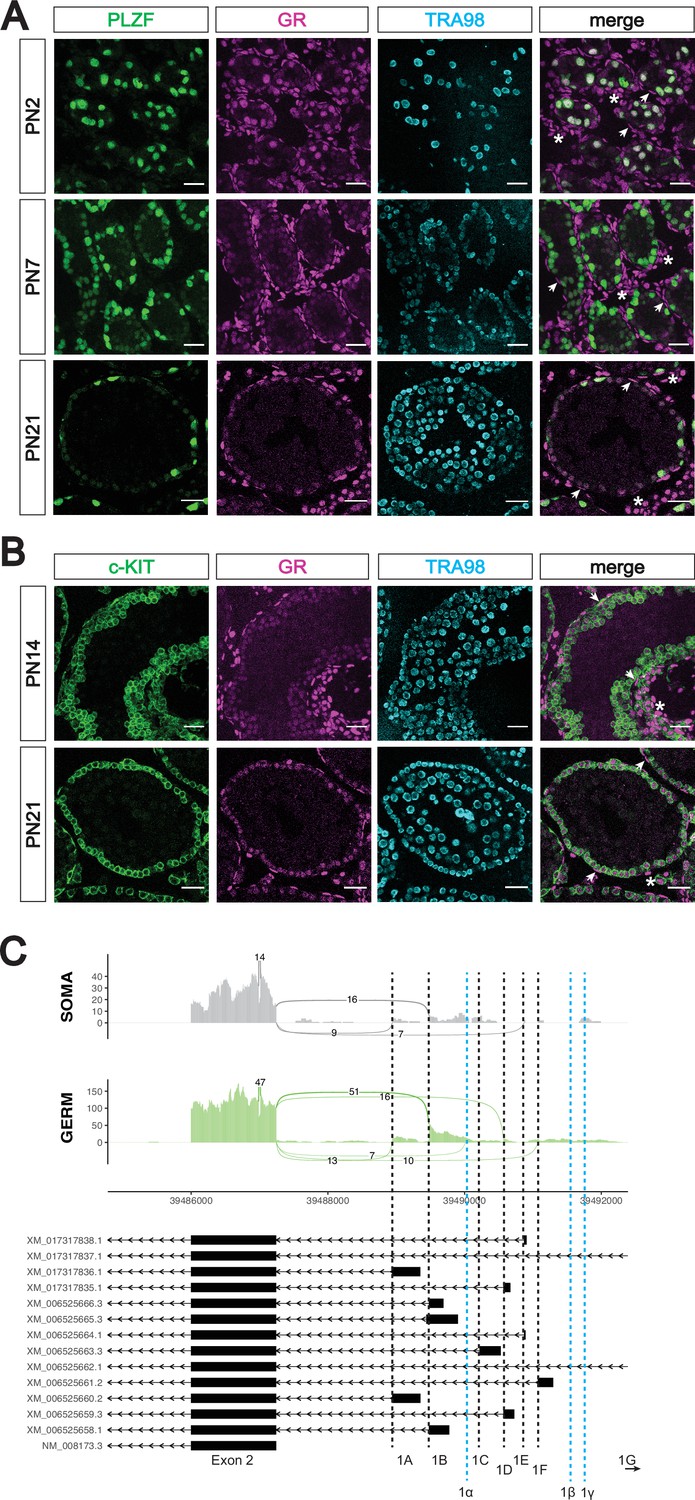
(A) IF staining showing expression of GR in mouse postnatal testis sections at PN2 (top), PN7 (middle), and PN21 (bottom). Spermatogonia are marked by PLZF, and total germ cells are marked by TRA98. Arrowheads show GR+ peritubular myoid cells, and asterisks show GR+ interstitial cells. Scale bars: 30 μm. (B) IF staining showing expression of GR in additional mouse postnatal testis timepoints. sections at PN14 (top) and PN21 (bottom). Differentiating spermatogonia are marked by c-KIT, and total germ cells are marked by TRA98. Arrowheads show GR+ peritubular myoid cells, and asterisks show GR+ interstitial cells. Scale bars: 30 μm. (C) Sashimi plots showing differences in alternative exon 1 splicing events at the Nr3c1 locus between testicular germ and somatic cells. Plots were generated from paired-end RNA-seq data of PN1 germ and somatic cells (saline control; Figure 5A). Previously annotated exon 1 variants have been arbitrarily labeled as exons 1 A through 1 G (with exon 1 A being closest to exon 2). Three novel exon 1 splice sites identified in this study have been labeled as predicted exons 1α, 1β, and 1γ (marked by the dotted blue lines).
Figure 5 with 1 supplement

Glucocorticoid receptor signaling regulates the expression of RNA splicing factors in prospermatogonia.
(A) Bulk RNA-seq performed on sorted Tg:Pou5f1-GFP+ germ cells and GFP– somatic cells from postnatal testes dosed in vivo with dex. Pregnant dams were injected via IP with either 10 μg / g dex or a saline vehicle control at E17.5 and E18.5. Pups were then dosed with either dex or saline via subcutaneous injection at PN0, and testes were collected for sorting at PN1. Three biological replicates were used per condition, each consisting of sorted cells from testes pooled together from a minimum of two entire independently dosed litters. Volcano plots show dex-induced differentially expressed genes (adjusted p-value ≤0.05) either upregulated (orange) or downregulated (cyan) in comparison to vehicle controls for both germ cells, as well as total somatic cell population. (B) (Left) Plotting of germ cell differential expression analysis in (A), labeled specifically with downregulated splicing factors. (Right) qRT-PCR performed on bulk PN2 testis tissue from mice dosed with dex. Pregnant dams were injected via IP with either 1 μg /g dex, 10 μg / g dex, or a saline vehicle control at E17.5 and E18.5, and then pups were dosed with the equivalent condition via subcutaneous injection at PN0 and PN1. Genes queried were for RNA splicing factors found to be differentially downregulated in germ cells in the RNA-seq data (Figure 5A). Data are mean ±s.d., normalized to 18 S ribosomal RNA housekeeping gene using 2-ΔΔCt quantification method, and p-values were calculated for each dose comparison using a two-tailed, unpaired t-test, where *: p≤0.05; **: p≤0.01; n.s.: not significant. (C) Differential transcript splicing analysis performed on sequencing reads derived from PN1 dex-dosed germ cells (Figure 5A). Paired-end RNA-seq results were analyzed using rMATS to detect significant differences in alternative splicing events between saline- and dex-treated germ cells. (Left) Bar graph showing raw numbers of significant (FDR ≤0.05) alternative splicing events, broken down by category. (Right) Representative sashimi plots highlighting select examples of ‘skipped exons’ events that are differentially regulated in germ cells in response to dex treatment.
Figure 5—figure supplement 1
GO term analysis of RNA-seq from male germ cells dosed with dex in vivo.
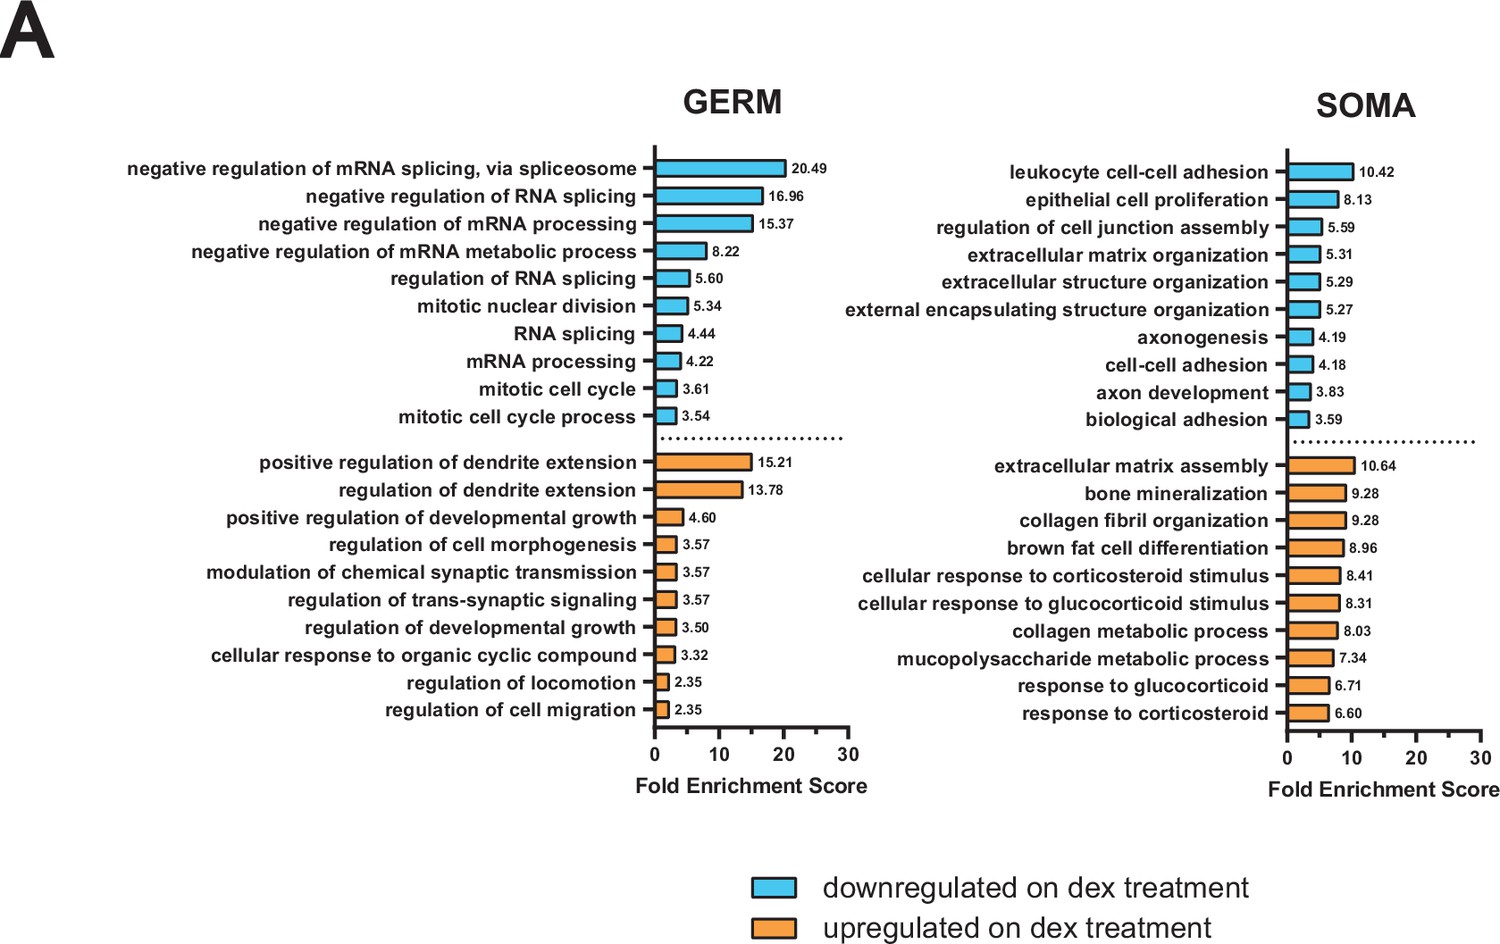
(A) GO term enrichment analysis using differentially expressed genes from in vivo dex-dosed RNA-seq data. The top 10 significant biological processes for upregulated (orange) and downregulated (cyan) genes are shown, ranked by fold enrichment score, for both somatic cells and germ cells.
Figure 6 with 1 supplement
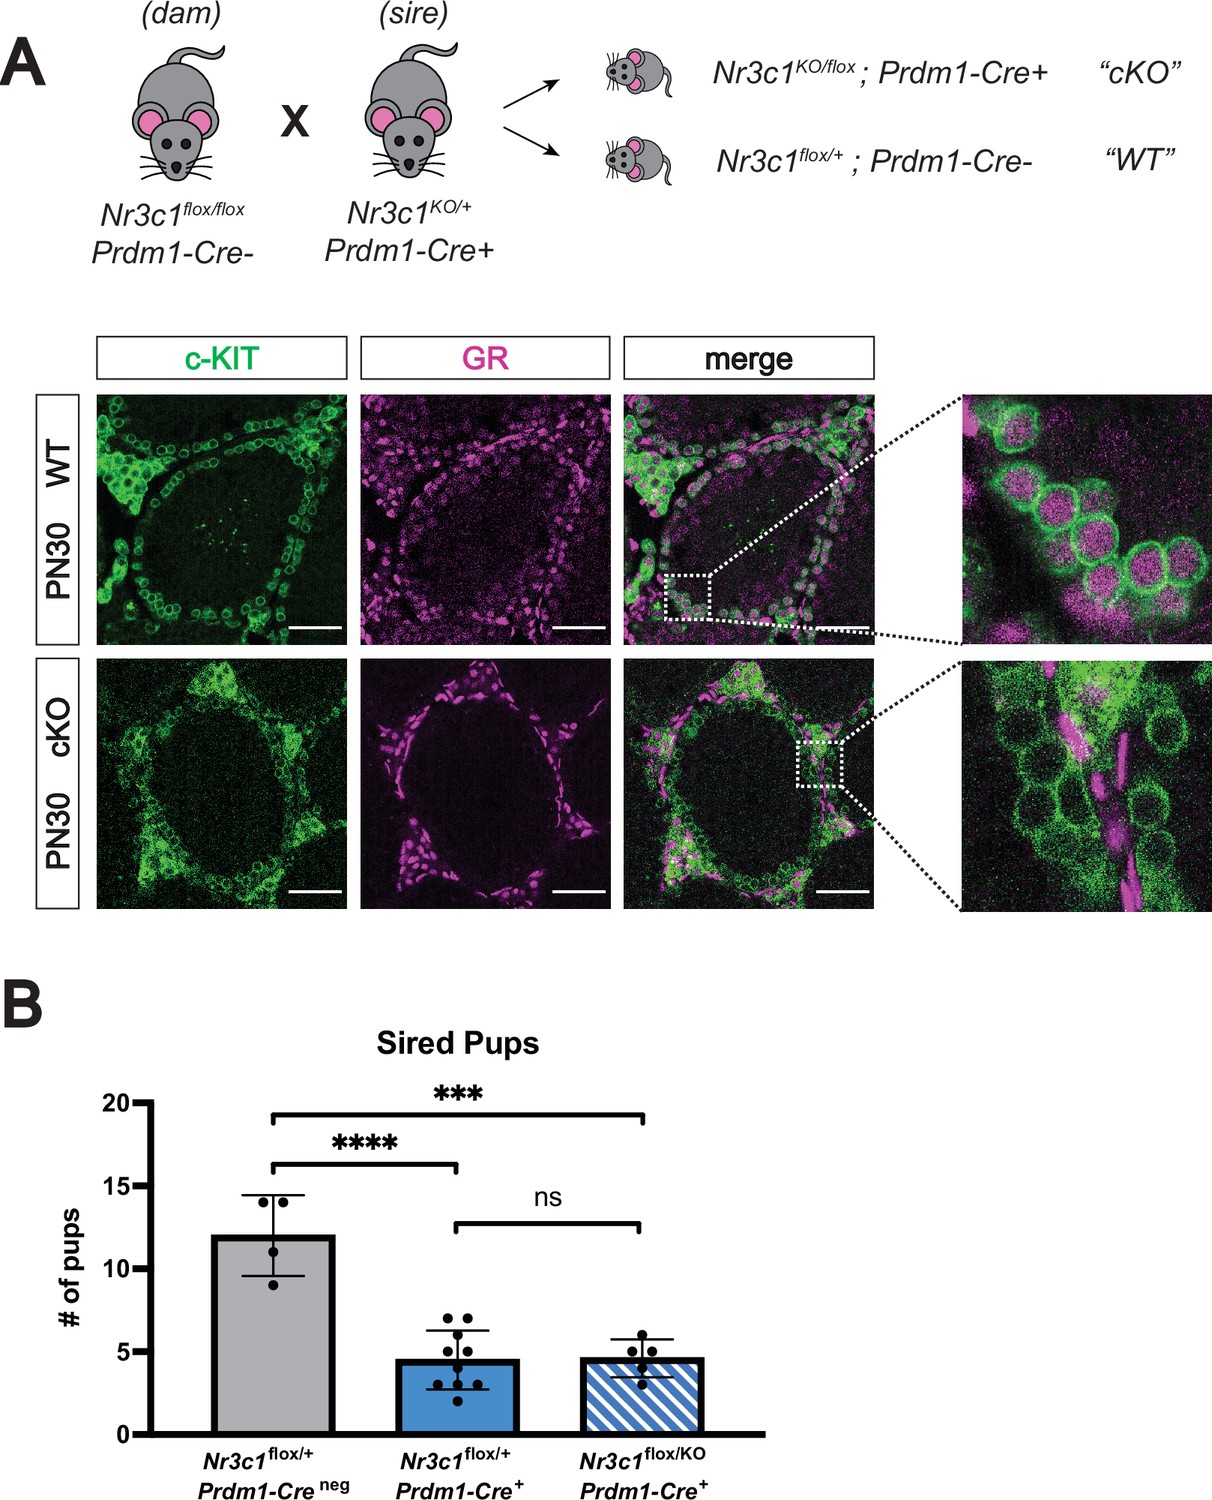
Conditional deletion of GR in the male germline does not affect fertility.
(A) Validation of Prdm1-Cre mediated GR conditional knockout model by IF staining of PN30 testes, showing specific loss of GR in c-KIT+ spermatogonia. Genotypes are represented as cKO (Nr3c1KO/flox; Prdm1-Cre+) and WT (Nr3c1flox/+; Prdm1-Creneg). Scale bars: 50 μm. (B) Fertility test of GR conditional knockout males and controls crossed to WT females, comparing number of pups sired per litter by genotype. Data are mean ±s.d., and p-values were calculated between groups using a two-tailed, unpaired t-test, where ****: p≤0.0001, ***: p≤0.001 and n.s.: not significant.
Figure 6—figure supplement 1

Validation of Prdm1-Cre mediated GR conditional knockout.
(A) Validation of Prdm1-Cre mediated GR conditional knockout model by IF staining of PN30 testes, showing specific loss of GR in PLZF+ spermatogonia. Genotypes are represented as cKO (Nr3c1KO/flox; Prdm1-Cre+) and WT (Nr3c1flox/+; Prdm1-Creneg). Scale bars: 50 μm.
Author response image 1
Additional files
Download links
A two-part list of links to download the article, or parts of the article, in various formats.
Downloads (link to download the article as PDF)
Open citations (links to open the citations from this article in various online reference manager services)
Cite this article (links to download the citations from this article in formats compatible with various reference manager tools)
Differential susceptibility of male and female germ cells to glucocorticoid-mediated signaling
eLife 12:RP90164.
https://doi.org/10.7554/eLife.90164.3


