Species -shared and -unique gyral peaks on human and macaque brains
- School of Automation, Northwestern Polytechnical University, China
- School of Life Science and Technology, MOE Key Lab for Neuroinformation, University of Electronic Science and Technology of China, China
- School of Information Technology, Northwest University, China
- College of Science, North China University of Science and Technology, China
- Cortical Architecture Imaging and Discovery Lab, Department of Computer Science and Bioimaging Research Center, University of Georgia, United States
Figures
Figure 1
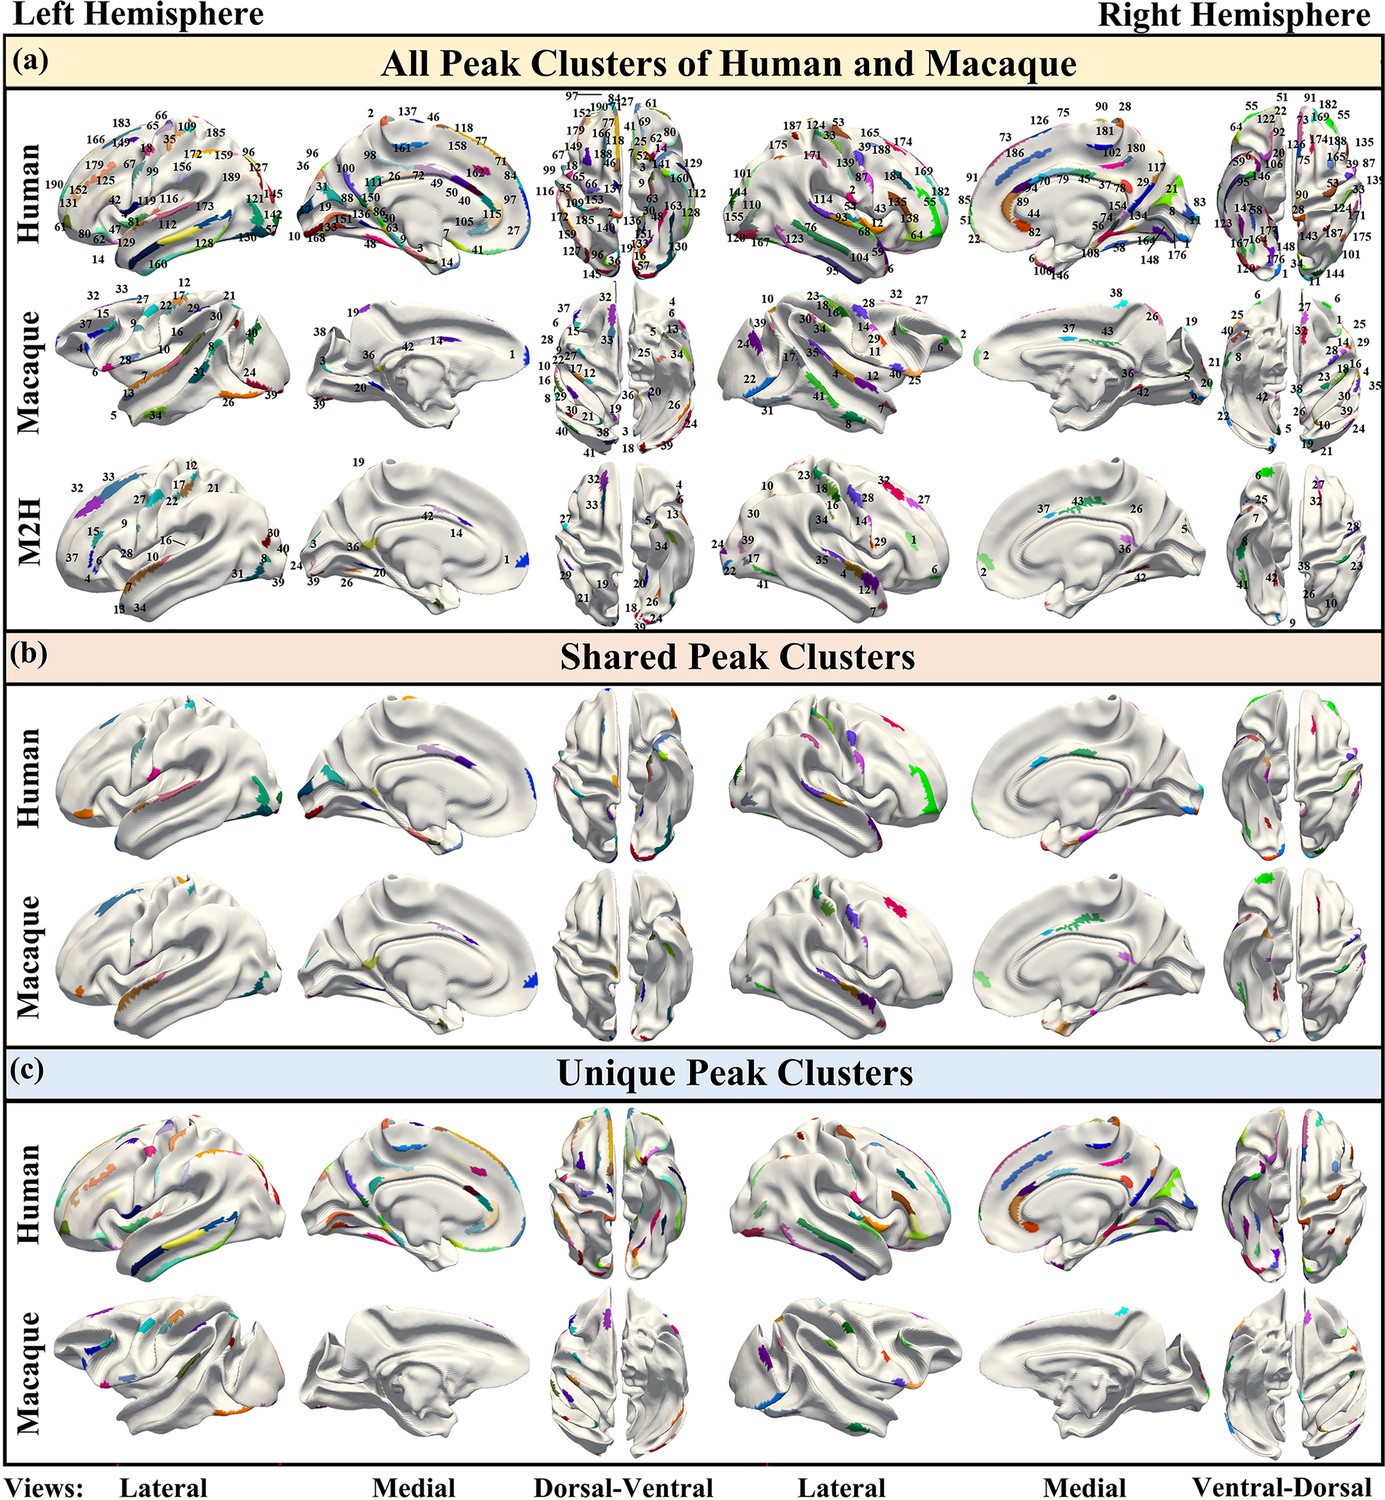
The spatial distribution of all gyral peaks of human and macaque, as well as their shared and unique gyral peaks.
(a) Top: 192 gyral peak clusters of human on human brain template (Conte69, Van Essen et al., 2012b). Middle: 85 gyral peak clusters of macaque on macaque brain template (Yerkes19, Van Essen et al., 2012a). Bottom: The results of mapping macaque gyral peak clusters on the human brain template by the cross-species registration (Xu et al., 2020). The same color of middle and bottom surface indicates the corresponding peak clusters. (b) Peak clusters shared by human and macaque (LH-25, RH-26). On the same hemisphere of the brain, the corresponding-colored regions on both human and macaque represent the corresponding shared peak clusters. In addition, the color of the left and right hemisphere clusters are not related. (c) Unique peak clusters of two species map on the surface of their respective surface template.
Figure 2
Spatial distribution characteristics of shared and unique gyral peaks.
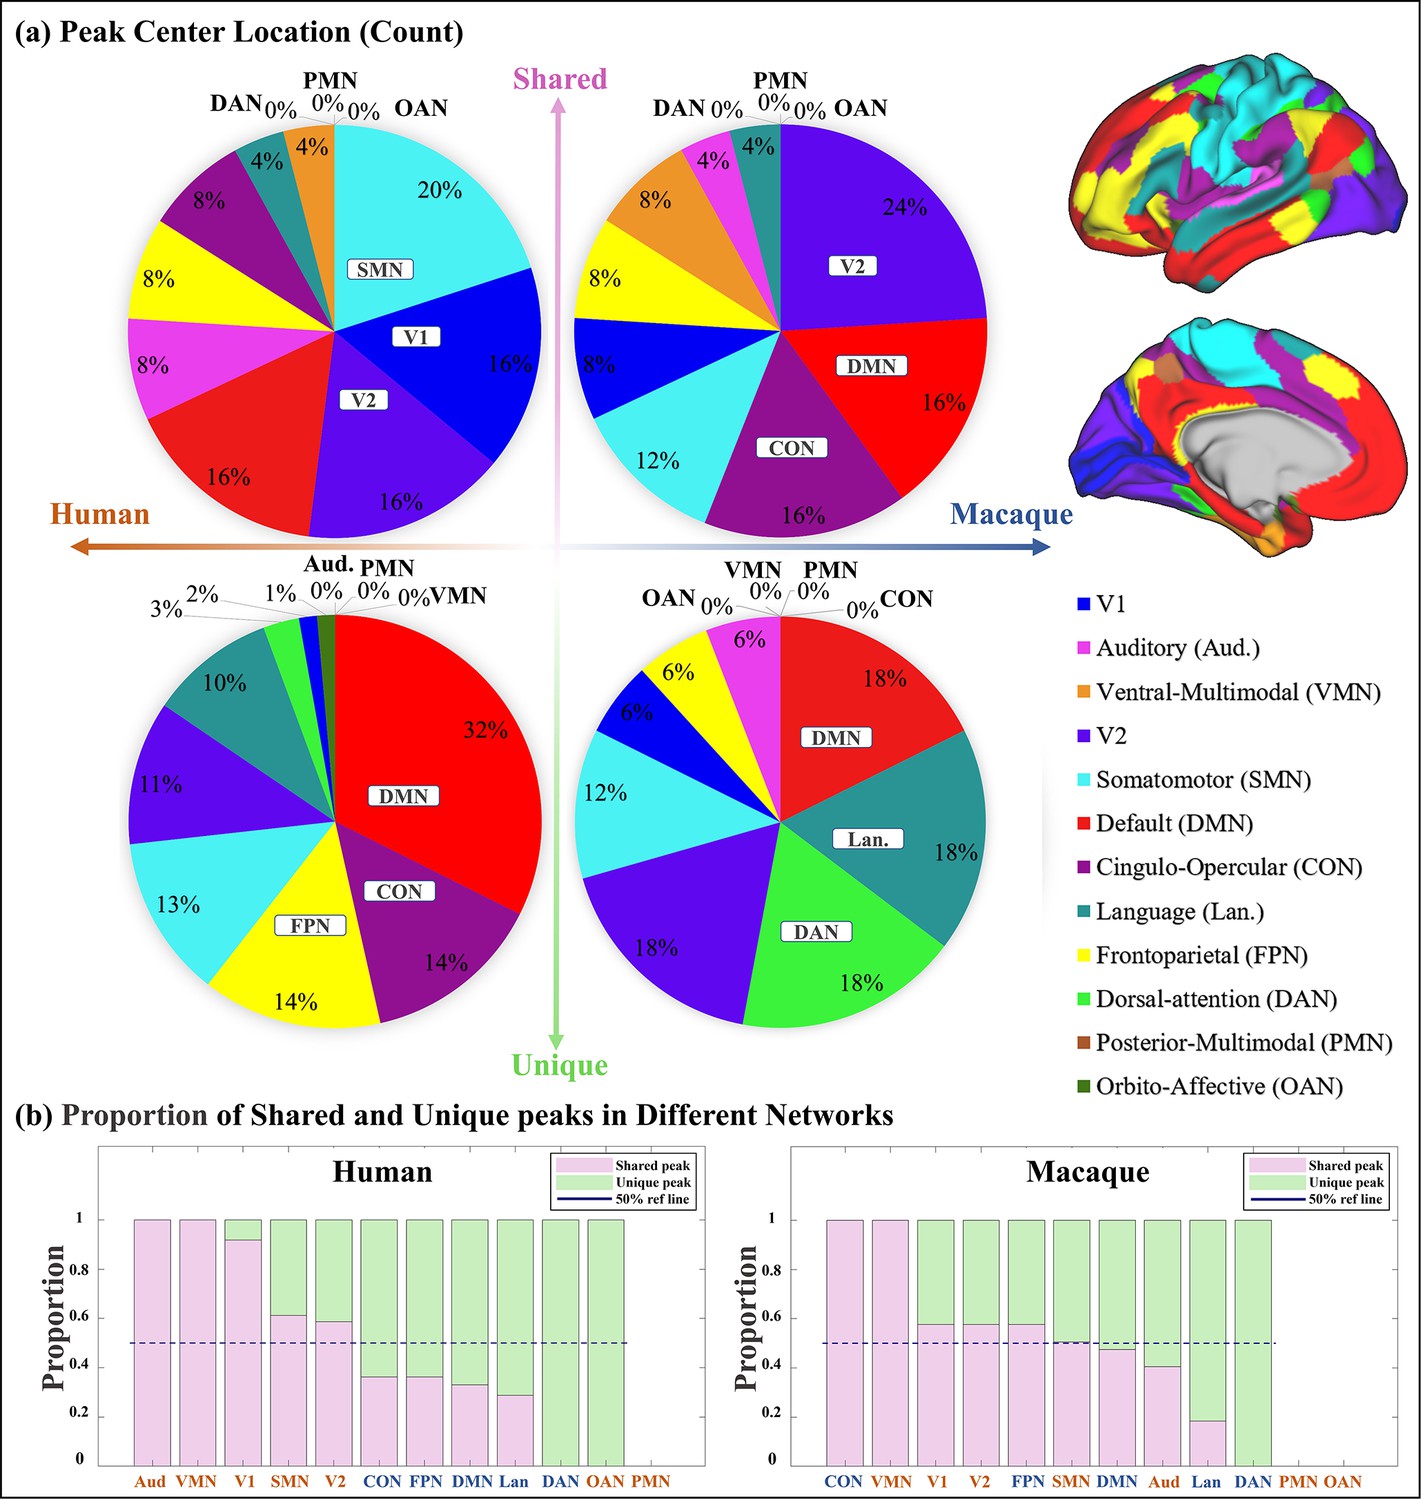
(a) Pie chart shows the count of shared and unique peaks across different brain networks for both human and macaque. Right panel shows the Cole-Anticevic (CA) networks (Ji et al., 2019) on human surface as a reference. (b) The ratio of shared and unique peaks in each brain network in the Cole-Anticevic (CA) atlas. The pink and green color bins represent ratios of shared and unique peaks, respectively. The dark blue dashed line represents the 50% reference line. For each brain region, the sum of the ratios of shared and unique peaks is equal to 1.
Figure 3

Consistency results of shared and unique peaks of two species.
(a) Mean peak count (± SD) covered by shared and unique peak clusters in two species. ***indicates p<0.001. The t-values for the t-tests in humans and macaques are 4.74 and 2.67, respectively. (b) Linear regression results of the consistency of peak clusters shared between macaque and human brains. The pink and blue colors represent the left and right hemispheres, respectively. The results of the linear regression are depicted in the figure. While there was a positive correlation observed in the consistency of gyral peaks between macaque and human, the obtained p-value for the fitted results exceeded the significance threshold of 0.05.
Figure 4
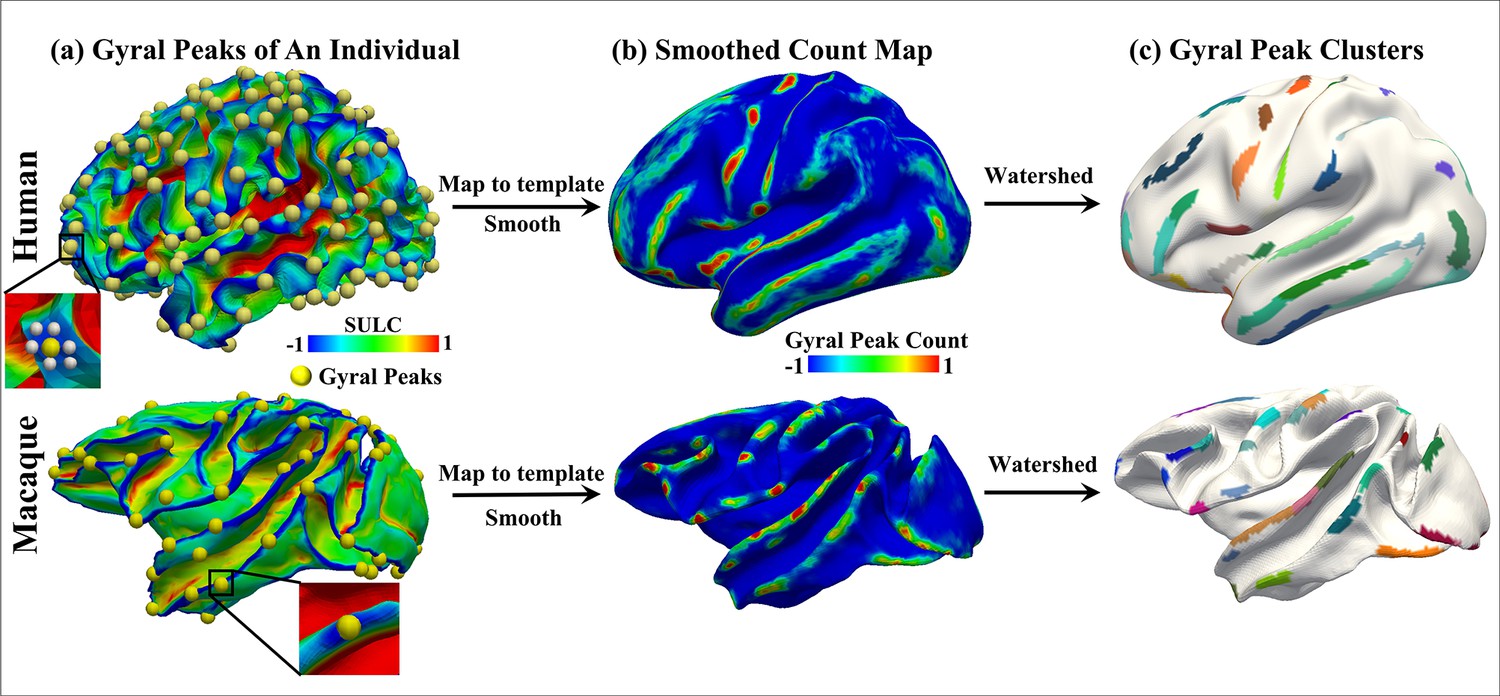
Peak cluster extraction pipeline.
The two rows represent the human brain and the macaque brain, respectively. (a) Shows the locations of all extracted peaks in an individual. (b) Due to resampling of the human and macaque surface, there is a vertex-to-vertex correspondence between individuals. Therefore, all individual peaks were placed on the template brain surface and undergo isotropic smoothing, resulting in the count map shown in (b), where the highlighted regions indicate a higher frequency of peak occurrences across individuals. (c) shows the results of clustering the count map using watershed algorithm, resulting in peak clusters for both species. A total of 192 peak clusters were detected in the human brain, while 85 peak clusters were detected in the macaque brain.
Figure 5

The original form of AHBA data is region × gene.
The accuracy and MSE line charts of the training set and testing set corresponding to lambda from 10–4 to 1. Purple and orange respectively represent the accuracy and mse obtained by 10-fold cross verification. The final lambda determined is 0.027, which can ensure the maximum accuracy and minimum MSE at the same time.
Appendix 3—figure 1
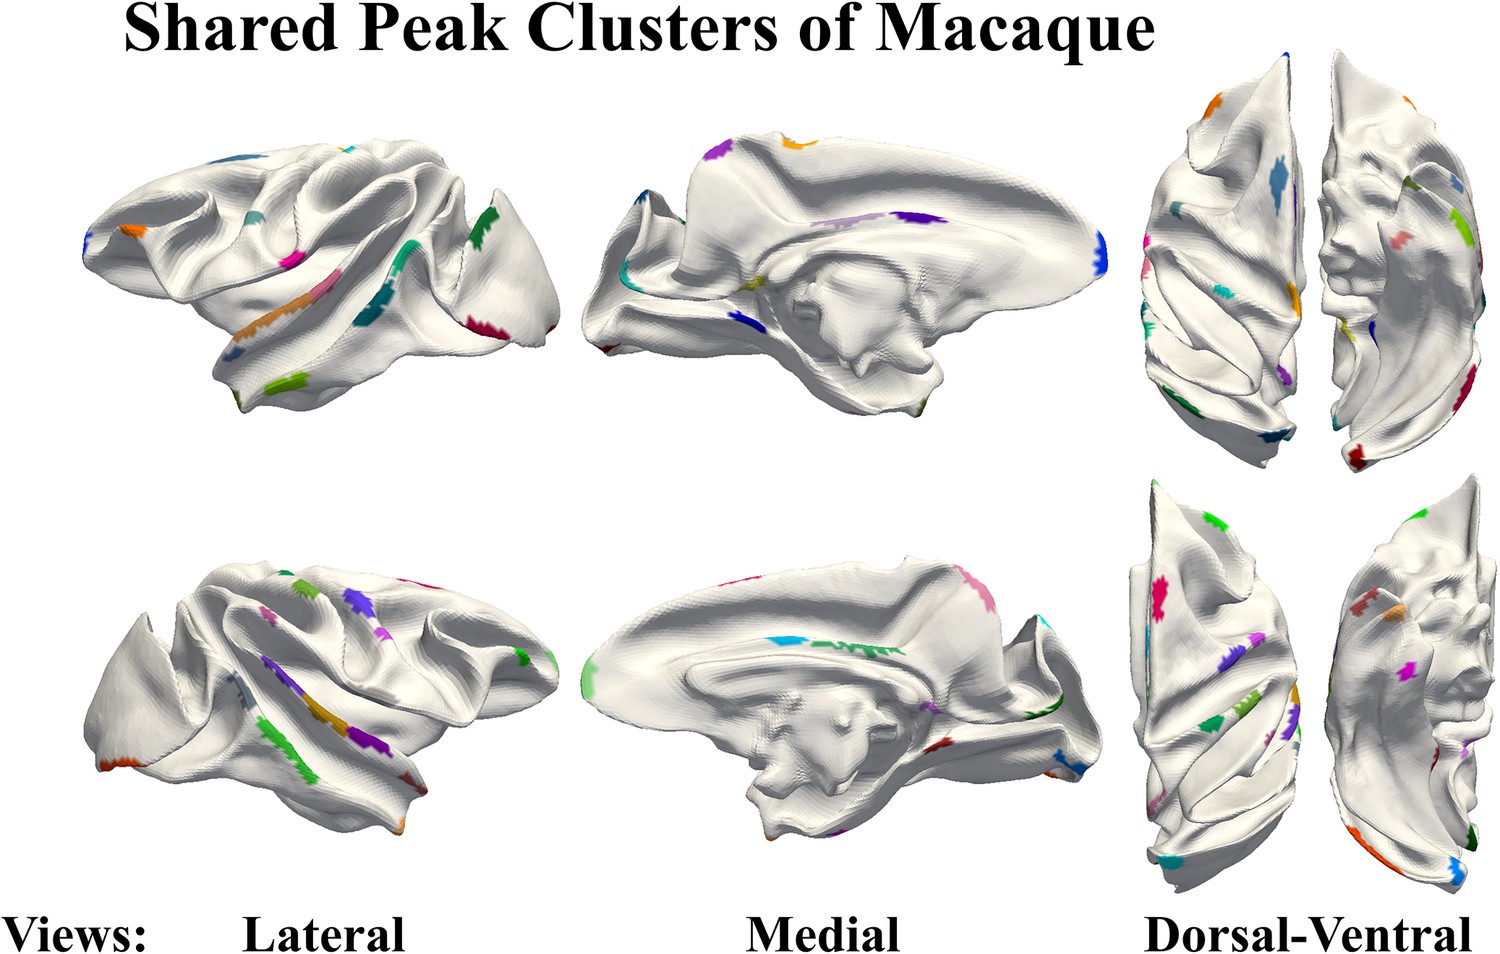
Macaques share peak clusters display on the surface of the macaque brain template.
Appendix 3—figure 2
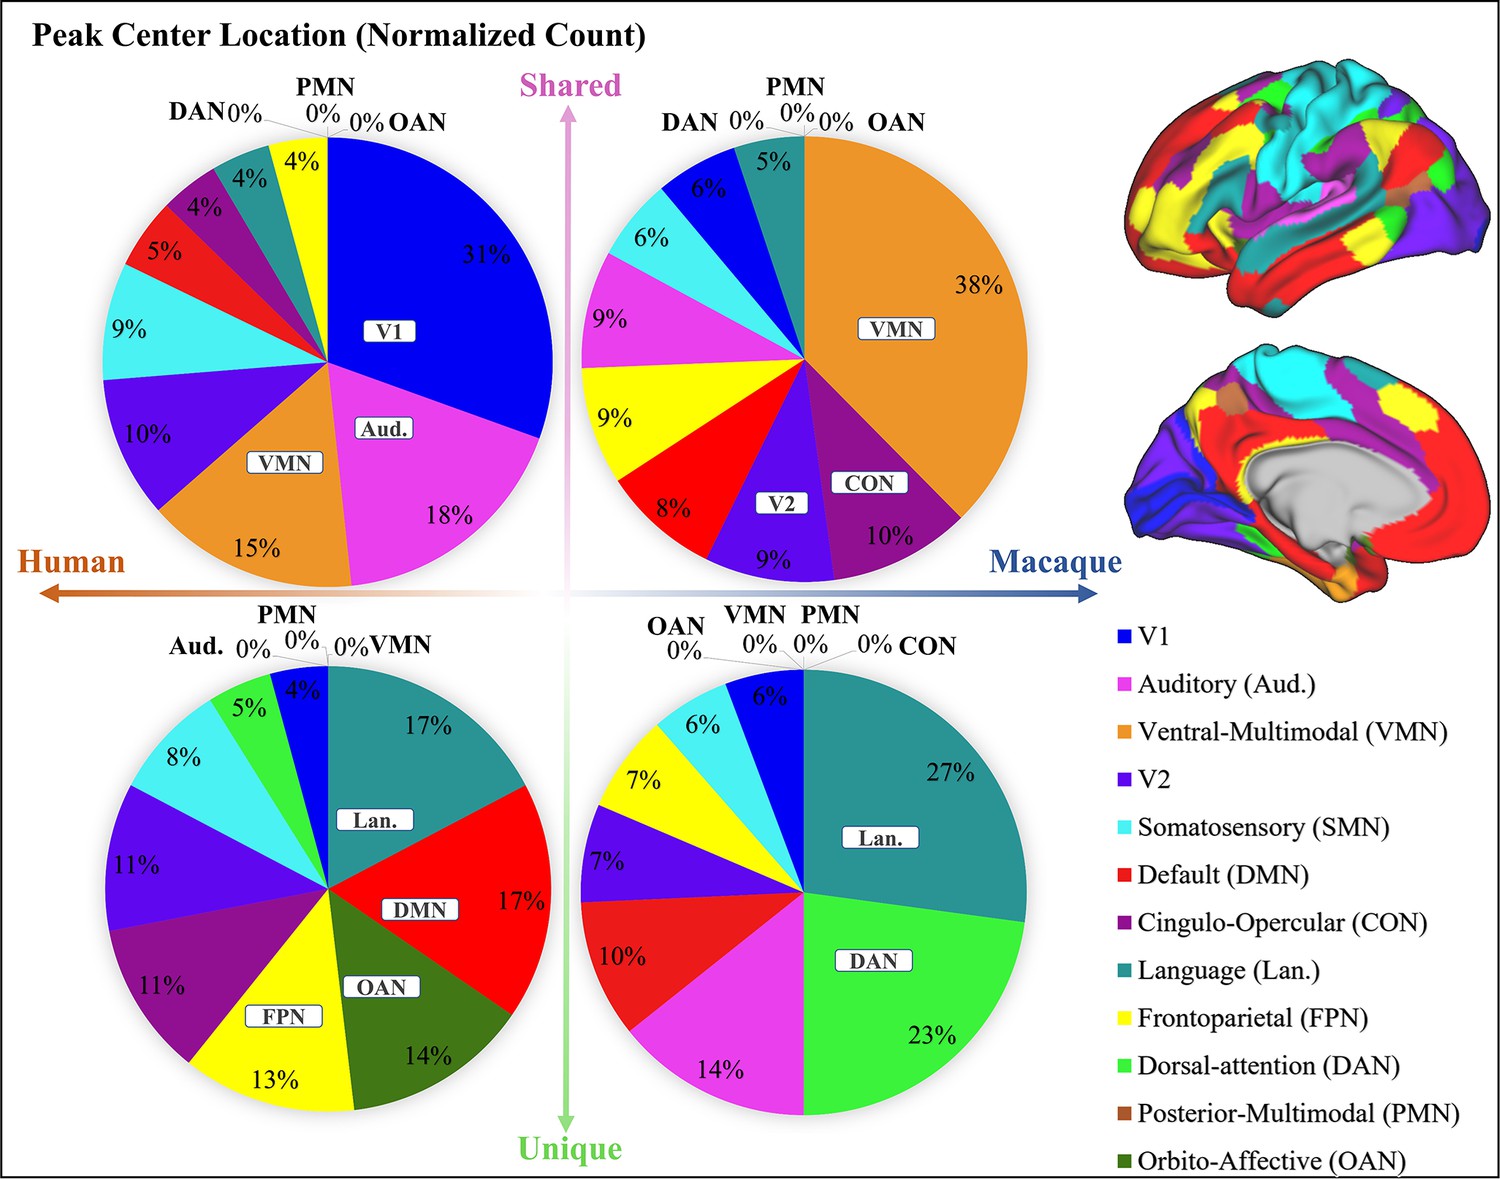
Pie chart shows the normalized count of shared and unique peaks across different brain networks both for human and macaque.
Right panel shows the Cole-Anticevic (CA) networks (Ji et al., 2019) on human surface as a reference.
Appendix 4—figure 1

Confidence of shared peak clusters.
(a) Location of shared peaks. (b) Confidence of shared peak clusters defined by the coincidence rate of clusters between human and macaque. (c) Confidence of shared peak clusters defined by the distance of cluster centers between human and macaque.
Author response image 1

Pie chart shows the count of shared and unique peaks across different brain networks for both human and macaque.
Right panel shows the Cole-Anticevic (CA) networks (Ji et al. 2019) on human surface as a reference.
Author response image 2

The ratio of shared and unique peaks in each brain network in the Cole-Anticevic (CA) atlas.
The pink and green color bins represent ratios of shared and unique peaks, respectively. The dark blue dashed line represents the 50% reference line. For each brain region, the sum of the ratios of shared and unique peaks is equal to 1.
Author response image 3

Pie chart shows the count of shared and unique peaks across different brain networks for both human and macaque.
Right panel shows the Cole-Anticevic (CA) networks (Ji et al. 2019) on human surface as a reference.
Author response image 4

Shared peak clusters of macaque, shows on macaque brain template.
Author response image 5

Consistency results of shared and unique peaks of two species.
(a) Mean peak count (± SD) covered by shared and unique peak clusters in two species.***indicates p<0.001. The t-values for the t-tests in humans and macaques are 4.74 and 2.67, respectively. (b) Linear regression results of the consistency of peak clusters shared between macaque and human brains. The pink and blue colors represent the left and right hemispheres, respectively. The results of the linear regression are depicted in the figure. While there was a positive correlation observed in the consistency of gyral peaks between macaque and human, the obtained p-value for the fitted results exceeded the significance threshold of 0.05.
Tables
Table 1
The number of shared and unique peaks in lower- and higher-order brain networks of the two species.
Lower-order networks include visual 1 (V1), visual 2 (V2), auditory (Aud), somatomotor (SMN), posterior multimodal (PMN), ventral multimodal (VMN), and orbito-affective networks (OAN), higher order networks include cingulo-opercular (CON), dorsal attention (DAN), language (Lan), frontoparietal (FPN), default-mode network (DMN).
| Lower/Higher cortex | Human | Macaque |
|---|---|---|
| Shared peak | 33/18 | 29/22 |
| Unique peak | 37/104 | 14/20 |
Table 2
The mean (± SD) of anatomical features, as well as the p-values and t-values of the t-test between shared and unique peak clusters.
In the t-test, n for human is 880 and for macaque is 591. The bold font is the one with the larger values of shared and unique peaks.
| Human | Macaque | |||||||
|---|---|---|---|---|---|---|---|---|
| Sulc | Curv | Myelin | Thickness | Area | Sulc | Curv | Area | |
| Shared | 0.93±0.05 | 0.31±0.02 | 1.85±0.10 | 2.71±0.14 | 1.19±0.09 | 0.86±0.03 | 0.55±0.03 | 0.94±0.44 |
| Unique | 0.79±0.05 | 0.32±0.01 | 1.83±0.11 | 2.94±0.12 | 1.09±0.05 | 0.80±0.04 | 0.58±0.03 | 0.91±0.17 |
| p | <0.001 | <0.001 | <0.001 | <0.001 | <0.001 | <0.001 | <0.001 | 0.59 |
| t | 58.43 | –16.26 | 6.51 | –36.67 | 30.43 | 6.07 | –5.32 | 0.54 |
Table 3
The mean (± SD) functional connectivity characteristics, as well as the p-values and t-values of the t-test between shared and unique peak clusters of human and macaque.
In the t-test, n for human is 880 and for macaque is 591. The bold font represent the larger values between the shared peak and unique peaks.
| Degree | Strength | CC | Betweeness | Efficiency | ||
|---|---|---|---|---|---|---|
| Human FC | Shared | 141.13±30.46 | 52.27±22.84 | 0.20±0.07 | 1.87±0.74(×103) | 0.25±0.07 |
| Unique | 119.88±18.03 | 44.35±15.24 | 0.19±0.05 | 1.46±0.43(×103) | 0.24±0.06 | |
| p | <0.001 | <0.001 | <0.001 | <0.001 | <0.001 | |
| t | 7.78 | 5.24 | 3.94 | 4.42 | 3.37 | |
| Macaque FC | Shared | 136.60±21.89 | 43.74±8.85 | 0.18±0.05 | 2.00±0.50(×103) | 0.25±0.07 |
| Unique | 134.69±23.51 | 43.30±8.15 | 0.17±0.05 | 2.18±0.60(×103) | 0.24±0.07 | |
| p | <0.01 | <0.001 | <0.01 | <0.001 | >0.05 | |
| t | 2.98 | 5.01 | 2.64 | –6.52 | 0.53 |
Table 4
The mean values (± SD) of brain regions that appeared within a 3-ring neighborhood for shared and unique peaks in 10 common human atlases.
All the shared peaks in the table have a greater number of neighboring brain regions compared to the unique peaks. All p<0.001, false discovery rate (FDR) corrected.
| Atlas Name | Glasser2016 | Schaefer-100 | Schaefer-200 | Schaefer-300 | Vosdewael-100 |
|---|---|---|---|---|---|
| Share Nbr | 2.43±0.15 | 1.89±0.12 | 2.12±0.11 | 2.23±0.11 | 1.57±0.17 |
| Unique Nbr | 2.37±0.09 | 1.74±0.09 | 2.08±0.10 | 2.17±0.10 | 1.46±0.10 |
| p | <0.001 | <0.001 | <0.001 | <0.001 | <0.001 |
| t | 8.32 | 26.66 | 4.50 | 18.08 | 34.09 |
| Atlas Name | Yeo2011(17) | Aparc | Aparc2009 | BA | Cole-Anticevic |
| Share Nbr | 1.76±0.11 | 1.58±0.12 | 1.95±0.13 | 1.58±0.12 | 1.65±0.11 |
| Unique Nbr | 1.73±0.08 | 1.33±0.07 | 1.94±0.09 | 1.29±0.08 | 1.57±0.07 |
| p | <0.001 | <0.001 | <0.001 | <0.001 | <0.001 |
| t | 22.29 | 56.37 | 3.80 | 69.84 | 22.44 |
Table 5
The mean values (± SD) of brain regions that appeared within a 3-ring neighborhood for shared and unique peaks in 3 common macaque atlases.
For both Markov91 and Cole-Anticevic atlas, the shared peaks has more variety of functional regions around it than the unique peaks. But for the altas BA05, the conclusion was reversed. The bold font represent the larger values between the shared peak and unique peaks. All p<0.001, false discovery rate (FDR) corrected.
| Atlas Name | Markov91 | Cole-Anticevic | BA05 |
|---|---|---|---|
| Share Nbr | 2.73±0.27 | 1.77±0.17 | 1.61±0.16 |
| Unique Nbr | 2.16±0.15 | 1.58±0.16 | 1.80±0.16 |
| p | <0.001 | <0.001 | <0.001 |
| t | –7.4 | 14.93 | 6.49 |
Table 6
Seven genes were selected using LASSO that showed significant differential expression in shared and unique peaks.
| Gene symbol | Gene function |
|---|---|
| PECAM1 | The protein encoded by this gene is found on the surface of platelets, monocytes, neutrophils, and some types of T-cells, and makes up a large portion of endothelial cell intercellular junctions. The encoded protein is a member of the immunoglobulin superfamily and is likely involved in leukocyte migration, angiogenesis, and integrin activation. [provided by RefSeq, May 2010] |
| TLR1 | The protein encoded by this gene is a member of the Toll-like receptor (TLR) family which plays a fundamental role in pathogen recognition and activation of innate immunity. They recognize pathogen-associated molecular patterns (PAMPs) that are expressed on infectious agents, and mediate the production of cytokines necessary for the development of effective immunity. [provided by RefSeq, Jul 2008] |
| SNAP29 | This gene, belonging to the SNAP25 gene family, encodes a protein involved in various membrane trafficking processes. Other members of this gene family, such as SNAP23 and SNAP25, encode proteins that bind to a syntaxin protein and facilitate the docking and fusion of synaptic vesicle membranes with the plasma membrane. [provided by RefSeq, Jul 2008] |
| DHRS4 | Exhibits protein binding and oxidoreductase activities, involved in cellular metabolic processes including ketone metabolism, regulation of reactive oxygen species, and steroid metabolism. Found in the nucleus and peroxisomal membrane. [provided by Alliance of Genome Resources, Apr 2022] |
| BHMT2 | Homocysteine, a sulfur-containing amino acid, is crucial for methylation reactions. The protein encoded by this gene is one of two methyltransferases that facilitate the transfer of a methyl group from betaine to homocysteine. Irregularities in homocysteine metabolism have been linked to conditions ranging from vascular disease to neural tube birth defects. This gene has alternatively spliced transcript variants encoding different isoforms.[provided by RefSeq, May 2010] |
| PLBD1 | Predicted to enable phospholipase activity. Predicted to be involved in phospholipid catabolic process. Located in extracellular space. [provided by Alliance of Genome Resources, Apr 2022] |
| KCNH5 | This gene encodes a member of voltage-gated potassium channels. Members of this family have diverse functions, including regulating neurotransmitter and hormone release, cardiac function, and cell volume. This protein is an outward-rectifying, noninactivating channel. Alternative splicing results in multiple transcript variants. [provided by RefSeq, Jul 2013] |
Appendix 1—table 1
Parameter selection of gyral peaks detection in human and macaque.
| Assignments | Parameters | Meanings | Human | Macaque |
|---|---|---|---|---|
| Detect Individual Peaks | x | Search peaks ring | 4 | 3 |
| Anisotropic Smooth | k | Anisotropic Smooth ring | 1 | 1 |
| n | Smooth iteration | 20 | 20 | |
| Watershed Clustering | fg | Minimum count value for cluster coverage | 45 | 4 |
| bg | Maximum count value for cluster coverage | 209 | 28 | |
| merge | Determinants of whether two clusters are merged | 7 | 3 |
Appendix 2—table 1
The location of human peak clusters.
| Location | Human Cluster Number | Location | Human Cluster Number |
|---|---|---|---|
| G_and_S_frontomargin | 61 | G_oc-temp_med-Parahip | 3,9,15,63,74,108 |
| G_and_S_occipital_inf | 120,130 | G_orbital | 20,25,52,55,60,62,64,69,92,113 |
| G_and_S_paracentral | 2,28 | G_pariet_inf-Angular | 175,189 |
| G_and_S_subcentral | 23,38 | G_pariet_inf-Supramar | 156,171,172 |
| G_and_S_transv_frontopol | 51,182 | G_parietal_sup | 140,178,185,187 |
| G_and_S_cingul-Ant | 40,44,89,105,115,162,186 | G_postcentral | 33,35,99,109,124,139,153,170 |
| G_and_S_cingul-Mid-Ant | 49,70,72,158 | G_precentral | 18,39,53,65,66,67,87,90,107 |
| G_and_S_cingul-Mid-Post | 45,79 | G_precuneus | 88,100,117,143,180,192 |
| G_cingul-Post-dorsal | 26,37,78,98,102 | G_rectus | 7,13,22,27,41,82 |
| G_cingul-Post-ventral | 29,150,154 | G_temp_sup-Lateral | 47,59,68,81,93,114,116 |
| G_cuneus | 21,31,34,36 | G_temporal_inf | 95,123,128,160 |
| G_front_inf-Opercular | 42,43,125 | G_temporal_middle | 76,104,112,129,173 |
| G_front_inf-Orbital | 80 | Pole_occipital | 1,11,17,24,57,142 |
| G_front_inf-Triangul | 132,135,138 | Pole_temporal | 6,14,106,141,146 |
| G_front_middle | 131,149,152,165,179,184,188 | S_calcarine | 83 |
| G_front_sup | 46,71,73,75,77,84,85,91,97,118,126, 137,157,161,174,181,183,191 | S_front_middle | 190 |
| G_Ins_lg_and_S_cent_ins | 16,32,54,119 | S_front_sup | 166,169 |
| G_insular_short | 4,12 | S_intrapariet_and_P_trans | 159 |
| G_occipital_middle | 101,110,121,127,155 | S_oc-temp_med_and_Lingual | 151 |
| G_occipital_sup | 96,103,144,145 | S_orbital-H_Shaped | 122 |
| G_oc-temp_lat-fusifor | 48,58,147,163,164,167 | S_pericallosal | 50,94 |
| G_oc-temp_med-Lingual | 8,10,19,56,133,134,136,148,168,176,177 | S_subparietal | 111 |
Appendix 2—table 2
The location of macaque peak clusters.
| Location | Macaque Cluster Number | Location | Macaque Cluster Number |
|---|---|---|---|
| Area 2 | 11,15,37,43,48 | Area 13 | 5,7,10,13,16,46,49,54,77 |
| Area 3 | 4,32,33,69,74 | Area 14 | 31,34,50,55,83 |
| Area 4 | 9,27,56,70,71 | Area 15 | 25,26 |
| Area 5 | 1,44 | Area 16 | 14,42,79,85 |
| Area 6 | 22,35,58,80 | Area 20 | 3,18,38,39,41,47,51,57,61,62,63 |
| Area 7 | 2,6,12,17,28,45,53,60,65,67,76,82 | Area 21 | 8,23,24,30,40,64,66,81 |
| Area 9 | 19,29,68,72 | Area 23 | 75 |
| Area 12 | 20,21,52,59,73,84 | Area 24 | 36,78 |
Appendix 3—table 1
Location of shared peak clusters on human.
| Clusters in LH | Location | Clusters in RH | Location |
|---|---|---|---|
| LH Shared 1 | G_front_sup | RH Shared 1 | G_and_S_transv_frontopol |
| LH Shared 2 | G_and_S_subcentral | RH Shared 2 | G_postcentral |
| LH Shared 3 | G_cuneus | RH Shared 3 | G_temp_sup-Lateral |
| LH Shared 4 | G_oc-temp_med-Parahip | RH Shared 4 | G_occipital_sup |
| LH Shared 5 | G_temp_sup-Lateral | RH Shared 5 | G_orbital |
| LH Shared 6 | G_occipital_middle | RH Shared 6 | Pole_temporal |
| LH Shared 7 | G_precentral | RH Shared 7 | Pole_occipital |
| LH Shared 8 | G_temp_sup-Lateral | RH Shared 8 | G_front_inf-Opercular |
| LH Shared 9 | G_orbital | RH Shared 9 | G_temp_sup-Lateral |
| LH Shared 10 | G_postcentral | RH Shared 10 | G_oc-temp_med-Parahip |
| LH Shared 11 | Pole_temporal | RH Shared 11 | G_precentral |
| LH Shared 12 | G_and_S_cingul-Mid-Ant | RH Shared 12 | Pole_occipital |
| LH Shared 13 | G_oc-temp_med-Lingual | RH Shared 13 | G_occipital_middle |
| LH Shared 14 | G_parietal_sup | RH Shared 14 | G_postcentral |
| LH Shared 15 | G_oc-temp_med-Lingual | RH Shared 15 | Pole_occipital |
| LH Shared 16 | Pole_occipital | RH Shared 16 | G_precuneus |
| LH Shared 17 | G_oc-temp_med-Parahip | RH Shared 17 | G_precentral |
| LH Shared 18 | G_and_S_occipital_inf | RH Shared 18 | G_pariet_inf-Supramar |
| LH Shared 19 | S_front_sup | RH Shared 19 | G_front_sup |
| LH Shared 20 | Pole_temporal | RH Shared 20 | Unkown |
| LH Shared 21 | G_precentral | RH Shared 21 | G_temp_sup-Lateral |
| LH Shared 22 | G_cingul-Post-ventral | RH Shared 22 | G_cingul-Post-ventral |
| LH Shared 23 | Pole_occipital | RH Shared 23 | G_and_S_cingul-Mid-Ant |
| LH Shared 24 | Pole_occipital | RH Shared 24 | G_oc-temp_lat-fusifor |
| LH Shared 25 | G_and_S_cingul-Mid-Ant | RH Shared 25 | G_oc-temp_med-Lingual |
| RH Shared 26 | G_and_S_cingul-Mid-Post |
Appendix 6—table 1
The mean (± SD) structural connectivity characteristics of shared and unique peak clusters of human.
The bold font represent the larger values between the shared peak and unique peaks. *indicates P<0.05; **indicates P<0.01,***indicates P<0.001
| Degree | Strength | CC | Betweeness | Efficiency | |
|---|---|---|---|---|---|
| Shared | 31.37±5.04 | 32.29±5.79 | 0.23±0.04 | 5.50±2.12(×103) | 0.43±0.05 |
| Unique | 31.79±3.23 | 29.46±3.43 | 0.19±0.02 | 5.10±1.08(×103) | 0.39±0.03 |
| p | <0.01 | <0.001 | <0.001 | <0.001 | <0.001 |
| t | 2.39 | 9.08 | 23.01 | 5.66 | 21.20 |
Appendix 7—table 1
The mean values (± SD) of brain regions where shared and unique peaks appeared within a 3-ring neighborhood in 21 common human atlases.
The p-values were corrected by FDR.
| Atlas Name | Yeo2011(7) | Glasser2016 | Schaefer-100 | Schaefer-200 | Schaefer-300 | Schaefer-400 | Schaefer-500 |
|---|---|---|---|---|---|---|---|
| Share Nbr | 1.48±0.10 | 2.43±0.15 | 1.89±0.12 | 2.12±0.11 | 2.23±0.11 | 2.46±0.13 | 2.50±0.14 |
| Unique Nbr | 1.54±0.07 | 2.37±0.09 | 1.74±0.09 | 2.08±0.10 | 2.17±0.10 | 2.39±0.09 | 2.51±0.09 |
| p | <0.001 | <0.001 | <0.001 | <0.001 | <0.001 | <0.001 | <0.001 |
| t | –8.04 | 8.32 | 26.66 | 4.50 | 18.08 | 17.60 | 7.72 |
| Atlas Name | Schaefer-600 | Schaefer-700 | Schaefer-800 | Schaefer-900 | Schaefer-1000 | Vosdewael-100 | Vosdewael-200 |
| Share Nbr | 2.48±0.14 | 2.76±0.14 | 2.85±0.16 | 2.86±0.12 | 3.07±0.14 | 1.57±0.17 | 1.71±0.11 |
| Unique Nbr | 2.60±0.10 | 2.74±0.10 | 2.74±0.12 | 2.87±0.09 | 3.03±0.10 | 1.46±0.10 | 1.73±0.08 |
| p | <0.001 | 0.39 | <0.001 | <0.001 | <0.001 | <0.001 | <0.001 |
| t | –14.04 | 2.42 | 11.98 | –5.75 | 4.23 | 34.09 | 7.44 |
| Atlas Name | Vosdewael-300 | Vosdewael-400 | Yeo2011(17) | Aparc | Aparc2009 | BA | Cole-Anticevic |
| Share Nbr | 1.96±0.12 | 2.21±0.15 | 1.76±0.11 | 1.58±0.12 | 1.95±0.13 | 1.58±0.12 | 1.65±0.11 |
| Unique Nbr | 2.02±0.09 | 2.32±0.10 | 1.73±0.08 | 1.33±0.07 | 1.94±0.09 | 1.29±0.08 | 1.57±0.07 |
| p | <0.001 | 0.13 | <0.001 | <0.001 | <0.001 | <0.001 | <0.001 |
| t | 5.41 | –2.82 | 22.29 | 56.37 | 3.80 | 69.84 | 22.44 |
Appendix 8—table 1
The 28 genes selected by LASSO and their corresponding p-values from Welch’s t-test.
| Gene Symbol | p | Gene Symbol | p | Gene Symbol | p | Gene Symbol | p |
|---|---|---|---|---|---|---|---|
| INPP4A | 0.76 | TLR1 | 0.02 | KCNH5 | 0.04 | OTULIN | 0.18 |
| ITGA1 | 0.19 | TPST1 | 0.94 | TMEM248 | 0.27 | DTX2 | 0.15 |
| JUNB | 0.57 | SNAP29 | 0.01 | ANO2 | 0.26 | SERPINB9P1 | 0.12 |
| PECAM1 | 0.04 | TRAM2 | 0.70 | PLEKHA3 | 0.90 | LHFPL5 | 0.63 |
| PRKCH | 0.10 | DHRS4 | 0.05 | PLBD1 | 0.01 | GK5 | 0.51 |
| NECTIN1 | 0.84 | LPIN1 | 0.34 | DENND1C | 0.37 | ZNF662 | 0.77 |
| SRC | 0.20 | BHMT2 | 0.01 | CXXC4 | 0.20 | NAP1L6 | 0.58 |
Author response table 1
The number of shared and unique peaks in lower- and higher-order brain networks of the two species.
Lower-order networks include visual 1 (V1), visual 2 (V2), auditory (Aud), somatomotor (SMN), posterior multimodal (PMN), ventral multimodal (VMN), and orbito-affective networks (OAN), higher-order networks include cingulo-opercular (CON), dorsal attention (DAN), language (Lan), frontoparietal (FPN), default-mode network (DMN).
| Lower/Higher networks | Human | Macaque |
|---|---|---|
| Shared peak | 33//18 | 29//22 |
| Unique peak | 37//104 | 14//20 |
Author response table 2
The mean values (± SD) of brain regions that appeared within a 3-ring neighborhood for shared and unique peaks in 3 common macaque atlases.
For both Markov91 and Cole-Anticevic atlas, the shared peaks has more variety of functional regions around it than the unique peaks. But for the altas BA05, the conclusion was reversed. The bold font represent the larger values between the shared peak and unique peaks. All p<0.001, after false discovery rate (FDR) corrected.
| Atlas Name | Markov91 | Cole- Anticevic | BA05 |
|---|---|---|---|
| Share | 2.73+-0.27 | 1.77+-0.17 | 1.61+-0.16 |
| Nbr | |||
| Unique | 2.16+-0.15 | 1.58+-0.16 | 1.80+-0.16 |
| Nbr | |||
| p | < 0.001 | < 0.001 | < 0.001 |
| t | -7.4 | 14.93 | 6.49 |
Author response table 3
The mean values (± SD) of brain regions that appeared within a 3-ring neighborhood for shared and unique peaks in 10 common human atlases.
All the shared peaks in the table have a greater number of neighboring brain regions compared to the unique peaks. All p<0.001, false discovery rate (FDR) corrected.
| Atlas Name | Glasser2016 | Schaefer- 100 | Schaefer- 200 | Schaefer- 300 | Vosdewael- 100 |
|---|---|---|---|---|---|
| Share Nbr | 2.43+-0.15 | 1.89+-0.12 | 2.12+-0.11 | 2.23+-0.11 | 1.57+-0.17 |
| Unique Nbr | 2.37+-0.09 | 1.74+-0.09 | 2.08+-0.10 | 2.17+-0.10 | 1.46+-0.10 |
| p | < 0.001 | < 0.001 | < 0.001 | < 0.001 | < 0.001 |
| t | 8.32 | 26.66 | 4.50 | 18.08 | 34.09 |
| Atlas Name | Yeo2011(17) | Aparc | Aparc2009 | BA | Cole- Anticevic |
| Share Nbr | 1.76+-0.11 | 1.58+-0.12 | 1.95+-0.13 | 1.58+-0.12 | 1.65+-0.11 |
| Unique Nbr | 1.73+-0.08 | 1.33+-0.07 | 1.94+-0.09 | 1.29+-0.08 | 1.57+-0.07 |
| p | < 0.001 | < 0.001 | < 0.001 | < 0.001 | < 0.001 |
| t | 22.29 | 56.37 | 3.80 | 69.84 | 22.44 |
Author response table 4
The mean values (± SD) of brain regions where shared and unique peaks appeared within a 3-ring neighborhood in 21 common human atlases.
The p-values were corrected by FDR.
| Atlas Nam e | Yeo2011 (7) | Glasser2 016 | Schaefer- 100 | Schaefe r-200 | Schaefe r-300 | Schaefer -400 | Schaefer -500 |
|---|---|---|---|---|---|---|---|
| Shar e Nbr | 1.48+-0.1 0 | 2.43+-0.1 5 | 1.89+-0.1 2 | 2.12+-0 11 | 2.23+-0 11 | 2.46+-0 13 | 2.50+-0.1 4 |
| Uniq ue Nbr | 1.54+-0.0 7 | 2.37+-0.09 | 1.74+-0.09 | 2.08+-0 10 | 2.17+-0.1 0 | 2.39+-0.0 9 | 2.51+-0 09 |
| p | < 0.001 | < 0.001 | < 0.001 | < 0.001 | < 0.001 | < 0.001 | < 0.001 |
| -8.04 | 8.32 | 26.66 | 4.50 | 18.08 | 17.60 | 7.72 | |
| Atlas Nam e | Schaefer -600 | Schaefer- 700 | Schaefer- 800 | Schaefe r-900 | Schaefe r-1000 | Vosdew ael-100 | Vosdew ael-200 |
| Shar e Nbr | 2.48+-0.1 4 | 2.7 | 2.85+-0.1 6 | 2.86+-0 12 | 3.07+-0 14 | 1.57+-0 17 | 1.71+-0.1 1 |
| Uniq ue Nbr | 2.60+-0.1 0 | 2.74+-0.10 | 2.74+-0.12 | 2.87+-0 09 | 3.03+-0.1 0 | 1.46+-0.1 0 | 1.73+-0 08 |
| p | < 0.001 | 0.39 | < 0.001 | < 0.001 | < 0.001 | < 0.001 | < 0.001 |
| -14.04 | 2.42 | 11.98 | -5.75 | 4.23 | 34.09 | 7.44 | |
| Atlas Nam e | Vosdewa el-300 | Vosdewa el-400 | Yeo2011( 17) | Aparc | Aparc20 09 | BA | Cole- Anticevi c |
| Shar e Nbr | 1.96+-0.1 2 | 2.21+-0.15 | 1.76+-0.1 1 | 1.58+-0 12 | 1.95+-0 13 | 1.58+-0. 12 | 1.65+-0 11 |
| Uniq ue Nbr | 2.02+-0.0 9 | 2.32+-0.10 | 1.73+-0.08 | 1.33+-0 07 | 1.94+-0.0 9 | 1.29+-0.0 8 | 1.57+-0.0 7 |
| n | < 0.001 5.41 | 0.13 -2.82 | < 0.001 22.29 | < 0.001 56.37 | < 0.001 3.80 | < 0.001 69.84 | < 0.001 22.44 |
Author response table 5
The 28 genes selected by LASSO and their corresponding p-values from Welch’s t-test.
| Gene Symbol | p | Gene Symbol | p | Gene Symbol | p | Gene Symbol | p |
|---|---|---|---|---|---|---|---|
| INPP4A | 0.76 | TLR1 | 0.02 | KCNH5 | 0.04 | OTULIN | 0.18 |
| ITGA1 | 0.19 | TPST1 | 0.94 | TMEM248 | 0.27 | DTX2 | 0.15 |
| JUNB | 0.57 | SNAP29 | 0.01 | ANO2 | 0.26 | SERPINB9P1 | 0.12 |
| PECAM1 | 0.04 | TRAM2 | 0.70 | PLEKHA3 | 0.90 | LHFPL5 | 0.63 |
| PRKCH | 0.10 | DHRS4 | 0.05 | PLBD1 | 0.01 | GK5 | 0.51 |
| NECTIN1 | 0.84 | LPIN1 | 0.34 | DENND1C | 0.37 | ZNF662 | 0.77 |
| SRC | 0.20 | BHMT2 | 0.01 | CXXC4 | 0.20 | NAP1L6 | 0.58 |
Author response table 6
Seven genes were selected using LASSO that showed significant differential expression in shared and unique peaks.
| Gene Symbol | ene Function |
|---|---|
| ECAM1 | The protein encoded by this gene is found on the surface of platelets, monocytes, neutrophils, and some types of T-cells, and makes up a large portion of endothelial cell intercellular junctions. The encoded protein is a member of the immunoglobulin superfamily and is likely involved in leukocyte migration, angiogenesis, and integrin activation. [provided by RefSeq, May 2010] |
| LR1 | The protein encoded by this gene is a member of the Toll-like receptor (TLR) family which plays a fundamental role in pathogen recognition and activation of innate immunity. They recognize pathogen-associated molecular patterns (PAMPs) that are expressed on infectious agents, and mediate the production of cytokines necessary for the development of effective immunity. [provided by RefSeq, Jul 2008] |
| NAP29 | This gene, belonging to the SNAP25 gene family, encodes a protein involved in various membrane trafficking processes. Other members of this gene family, such as SNAP23 and SNAP25, encode proteins that bind to a syntaxin protein and facilitate the docking and fusion of synaptic vesicle membranes with the plasma membrane. [provided by RefSeq, Jul 2008] |
| HRS | Exhibits protein binding and oxidoreductase activities, involved in cellular metabolic processes including ketone metabolism, regulation of reactive oxygen species, and steroid metabolism. Found in the nucleus and peroxisomal membrane. [provided by Alliance of Genome Resources, Apr 2022 ] |
| HMT2 | Homocysteine, a sulfur-containing amino acid, is crucial for methylation reactions. The protein encoded by this gene is one of two methyltransferases that facilitate the transfer of a methyl group from betaine to homocysteine. Irregularities in homocysteine metabolism have been linked to conditions ranging from vascular disease to neural tube birth defects. This gene has alternatively spliced transcript variants encoding different isoforms.[provided by RefSeq, May 2010] |
| LBD1 | Predicted to enable phospholipase activity. Predicted to be involved in phospholipid catabolic process. Located in extracellular space. [provided by Alliance of Genome Resources, Apr 2022] |
| CNH5 | This gene encodes a member of voltage-gated potassium channels. Members of this family have diverse functions, including regulating neurotransmitter and hormone release, cardiac function, and cell volume. This protein is an outward-rectifying, noninactivating channel. Alternative splicing results in multiple transcript variants. [provided by RefSeq, Jul 2013] |
Additional files
Download links
A two-part list of links to download the article, or parts of the article, in various formats.
Downloads (link to download the article as PDF)
Open citations (links to open the citations from this article in various online reference manager services)
Cite this article (links to download the citations from this article in formats compatible with various reference manager tools)
Species -shared and -unique gyral peaks on human and macaque brains
eLife 12:RP90182.
https://doi.org/10.7554/eLife.90182.3


