14-3-3 protein augments the protein stability of phosphorylated spastin and promotes the recovery of spinal cord injury through its agonist intervention
- Department of Orthopedics, The First Affiliated Hospital of Jinan University, China
Figures
Figure 1 with 1 supplement
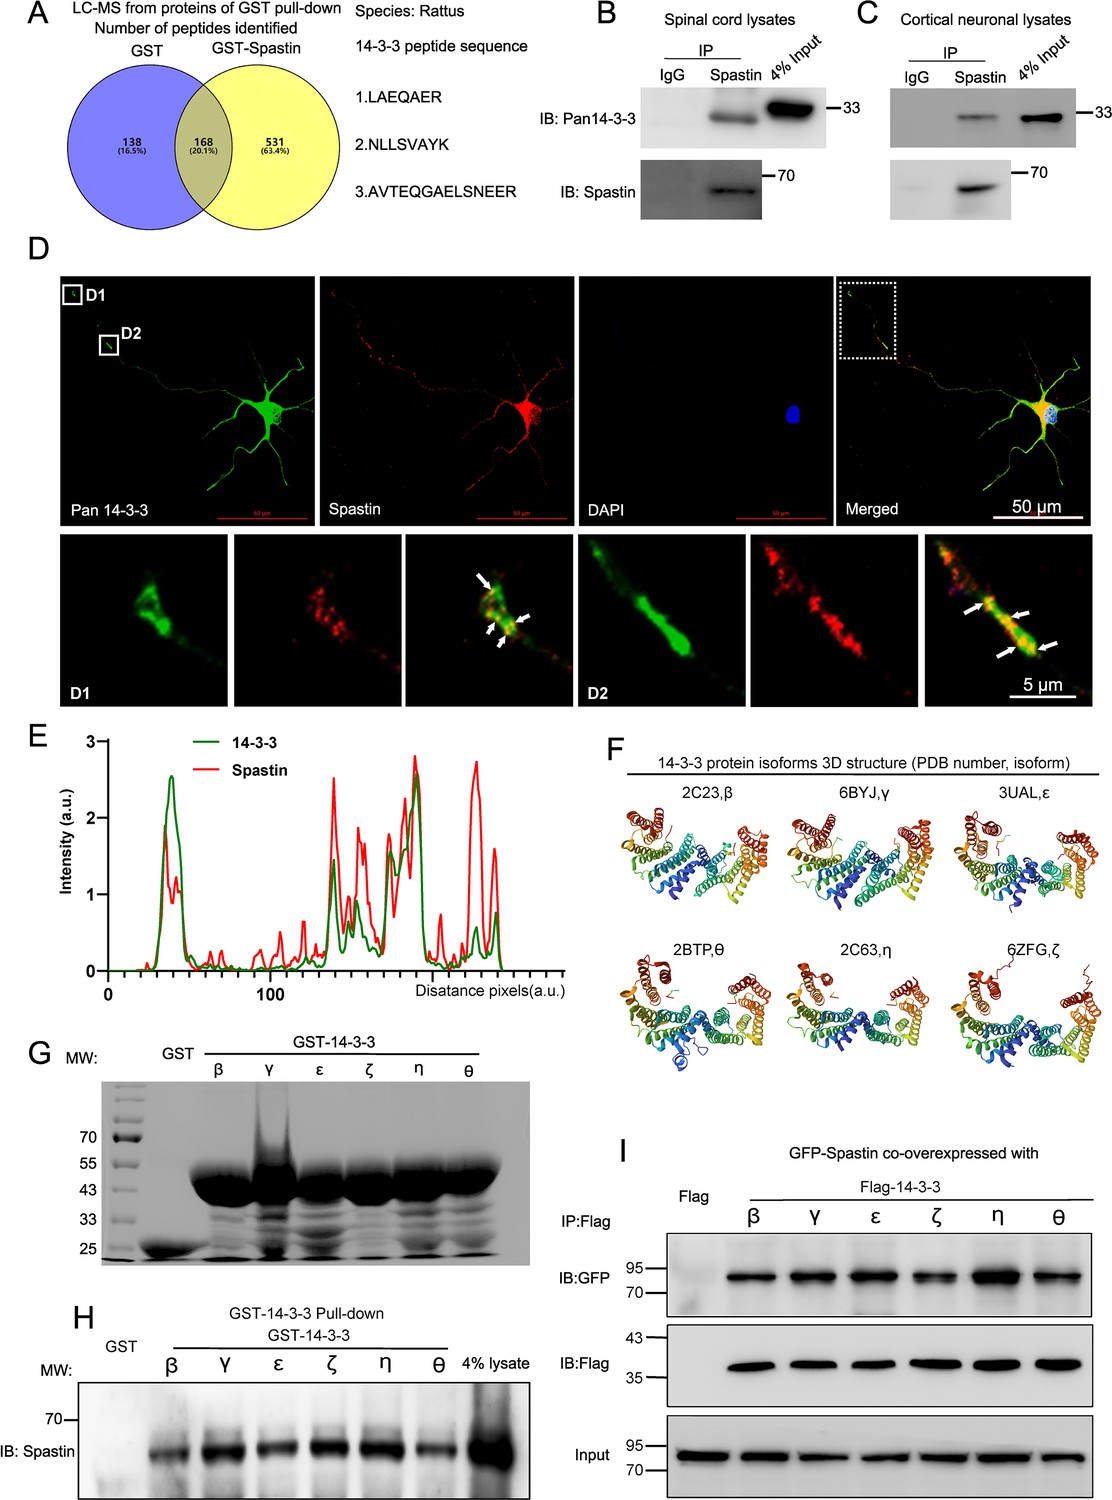
14-3-3 interacts with spastin in vivo and in vitro.
(A) Proteins from the spinal cord tissue (approximately 1 cm around the T10 level) were pulldowned by purified GST and GST-Spastin proteins and the proteins obtained were subjected to mass spectrometry analysis. The 306 peptides were identified in the GST group and 699 peptides in the GST-Spastin group. The peptides that were common to both the GST and GST-Spastin groups were excluded, and 531 peptides were the peptides of proteins that interact with spastin. Three 14-3-3 protein peptides were shown. (B) Immunoprecipitation assay using spastin antibody was performed from spinal cord lysates and Pan 14-3-3 antibody was used for western blotting. (C) Immunoprecipitation assay using spastin antibody was performed from cortical neural lysates and Pan 14-3-3 antibody was used for western blot. (D) Hippocampal neurons were stained with 14-3-3 (green) and spastin (red) antibodies, the growth cone (D1) and axon shaft (D2) profile were shown. Scale bar: 50 μm, 5 μm. (E) Localization of spastin (red line) and 14-3-3 (green line) protein in the hippocampal neurons were analyzed and the intensity of the white dotted line across the neurite compartment were measured. (F) The highly conserved spatial conformation of different 14-3-3 protein isoforms were shown. (G) Purified GST and GST-14-3-3s fusion proteins were subjected to sodium dodecyl-sulfate polyacrylamide gel electrophoresis and coomassie blue staining was confirmed the successful purification of relative proteins. (H) GST fusion proteins were used to pull down the lysates of the spinal cord and spastin antibody was used for western blotting. (I) HEK 293T cells were transfected with Flag-tagged 14-3-3s and GFP-tagged spastin, the cell lysates were subjected to GFP-Trap assay, and Flag antibody was used to detect the presence of 14-3-3s.
-
Figure 1—source data 1
Pulldowned peptides list from the mass spectrum.
- https://cdn.elifesciences.org/articles/90184/elife-90184-fig1-data1-v1.xlsx
-
Figure 1—source data 2
Raw and annotated immunoblots for Figure 1.
- https://cdn.elifesciences.org/articles/90184/elife-90184-fig1-data2-v1.zip
-
Figure 1—source data 3
Numerical data for Figure 1E.
- https://cdn.elifesciences.org/articles/90184/elife-90184-fig1-data3-v1.xlsx
Figure 1—figure supplement 1
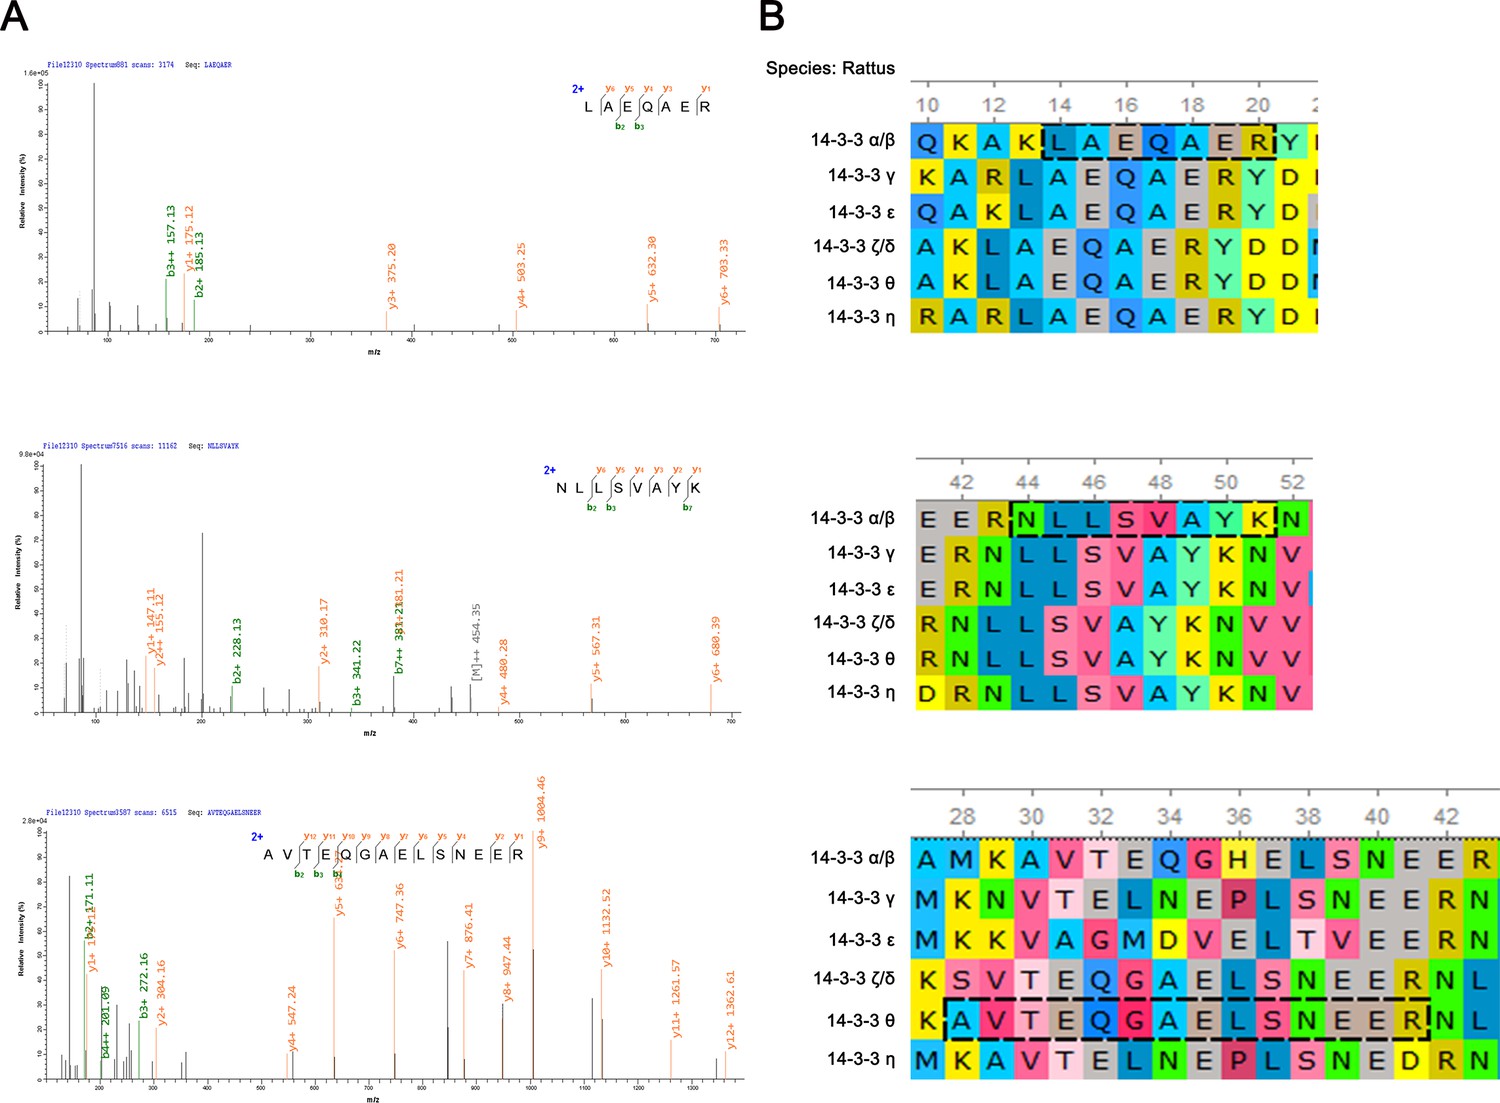
The peptides of 14-3-3 essential for the interaction with spastin are highly conserved in all 14-3-3 isoforms.
(A) The peak chart of binding peptides from LC-MS to spastin were shown. (B) Different 14-3-3 protein isoforms (rat species) were aligned and the LC-MS peptides were cropped to show the conservatism.
Figure 2 with 1 supplement
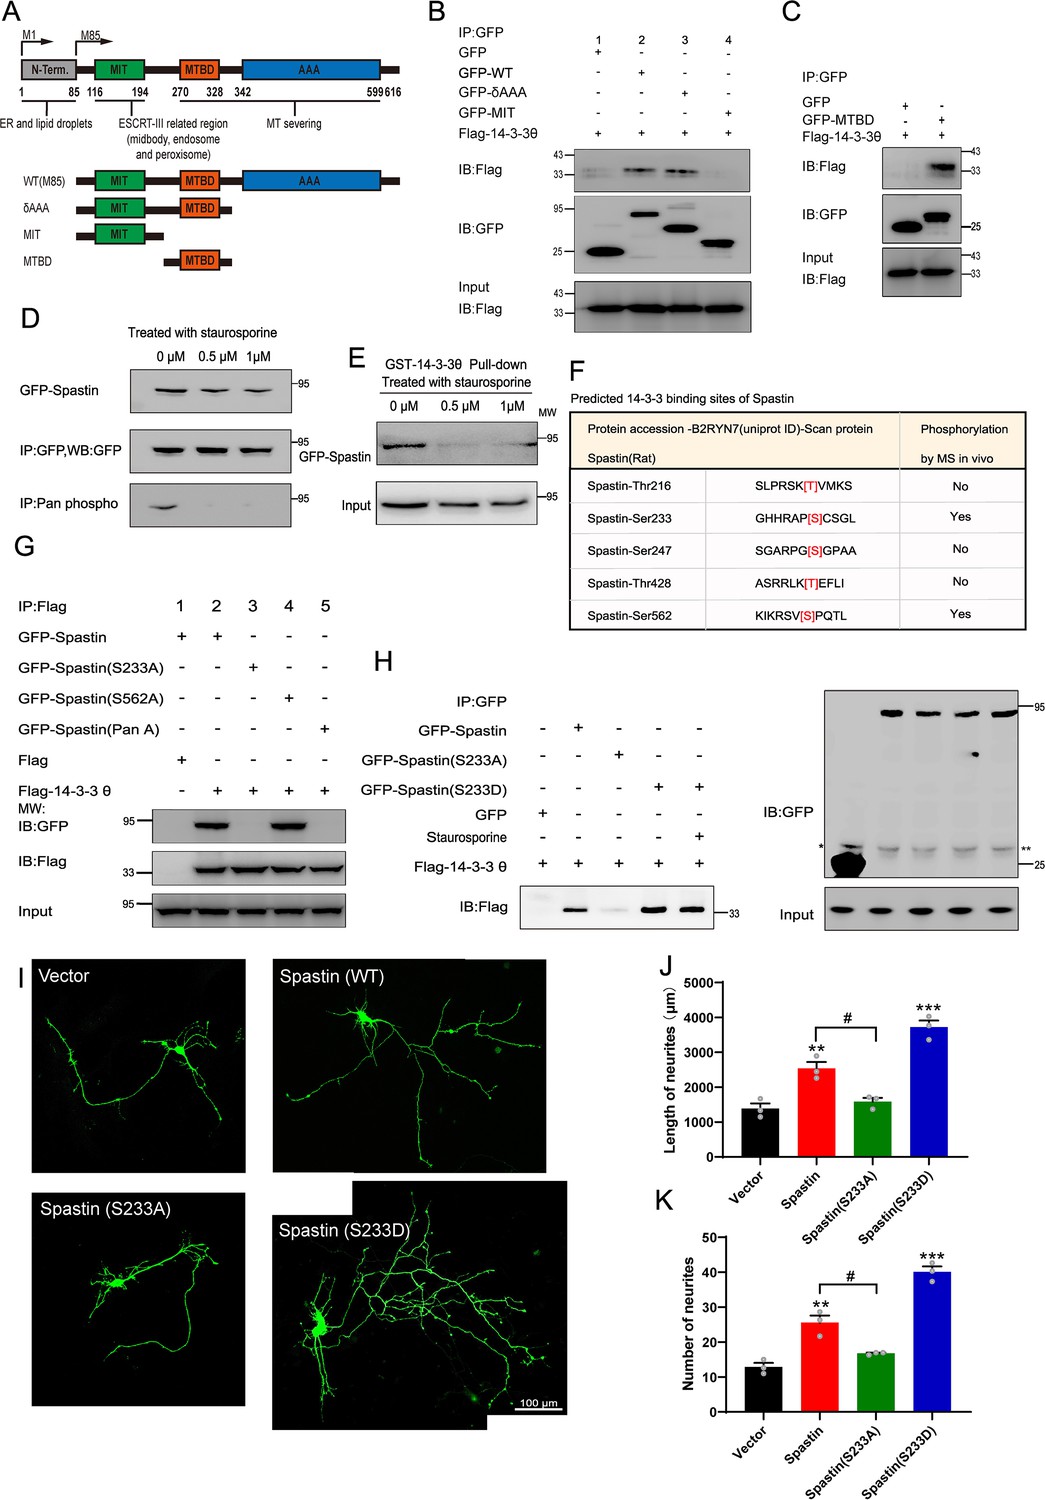
Ser233 in spastin is essential for the interaction with 14-3-3 and important for neurite outgrowth.
(A) Schematic illustration of the gene truncation strategy for the modular domain of spastin. (B) Truncation mutants of spastin together with Flag-tagged 14-3-3 were transfected into HEK 293T cells, and cell lysates were immunoprecipitated by GFP-Trap assay. Flag antibody were used for detecting the flag-tagged 14-3-3 fusion protein. (C) The microtubule-binding domain (MTBD) truncated GFP-tagged spastin were transfected together with Flag-tagged 14-3-3 into HEK 293T cells, and subjected to GFP trap assay. (D) GFP-tagged spastin was transfected into HEK293T cells by treatment with staurosporine (a broad spectrum protein kinase inhibitor) or not. GFP-Trap beads were used to enrich GFP-Spastin, and the phosphorylation levels of spastin were detected using a Pan phosphoserine/threonine antibody. (E) HEK 293T cells were transfected with GFP-spastin and then treated with or without staurosporine for 1 hr. Cell lysates were pull downed by GST 14-3-3 fusion protein and GFP antibodies were used for western blotting. (F) The binding sites between 14-3-3 and spastin were predicted using the scansite 2.0 software and whether these sites could be phosphorylated were confirmed by the phosphosite plus website. (G) Ser233 and Ser562 of spastin were mutated to alanine, these GFP fusion mutations were transfected together with Flag-tagged 14-3-3, and then cell lysates were subjected to GFP-trap assay. Flag antibody was used to detect the binding ability between spastin mutations and 14-3-3. (H) GFP-tagged wild-type spastin, spastin S233A (mimicking dephosphorylation), or spastin S233D (mimicking phosphorylation) were co-transfected with Flag-tagged 14-3-3 into HEK293T cells. The group transfected with GFP-Spastin S233D was additionally treated with staurosporine. Cells were lysed and immunoprecipitation were conducted using GFP-Trap, and western blot analysis was performed using Flag antibodies to investigate the impact of Ser233 phosphorylation in spastin on its interaction with 14-3-3. (I) Hippocampal neurons were grown on DIV2 and transfected with spastin Ser233 mutations (Spastin S233A, Spastin S233D), then fixed at DIV 3. Representative images of transfected neurons as indicated were shown. Quantitative analysis of the length of neurites (J) and the number of neurites (K) were shown. Data were represented as the mean value of three independent experiments (n=3). All error bars are SEM. Differences across multiple groups were determined using One-way analysis of variance (ANOVA), followed by Newman-Keuls post hoc tests for mean separations. *p<0.05. Scale bar: 100 μm.
-
Figure 2—source data 1
Raw and annotated blots for Figure 2.
- https://cdn.elifesciences.org/articles/90184/elife-90184-fig2-data1-v1.zip
-
Figure 2—source data 2
Numerical data for Figure 2J–K.
- https://cdn.elifesciences.org/articles/90184/elife-90184-fig2-data2-v1.xls
Figure 2—figure supplement 1
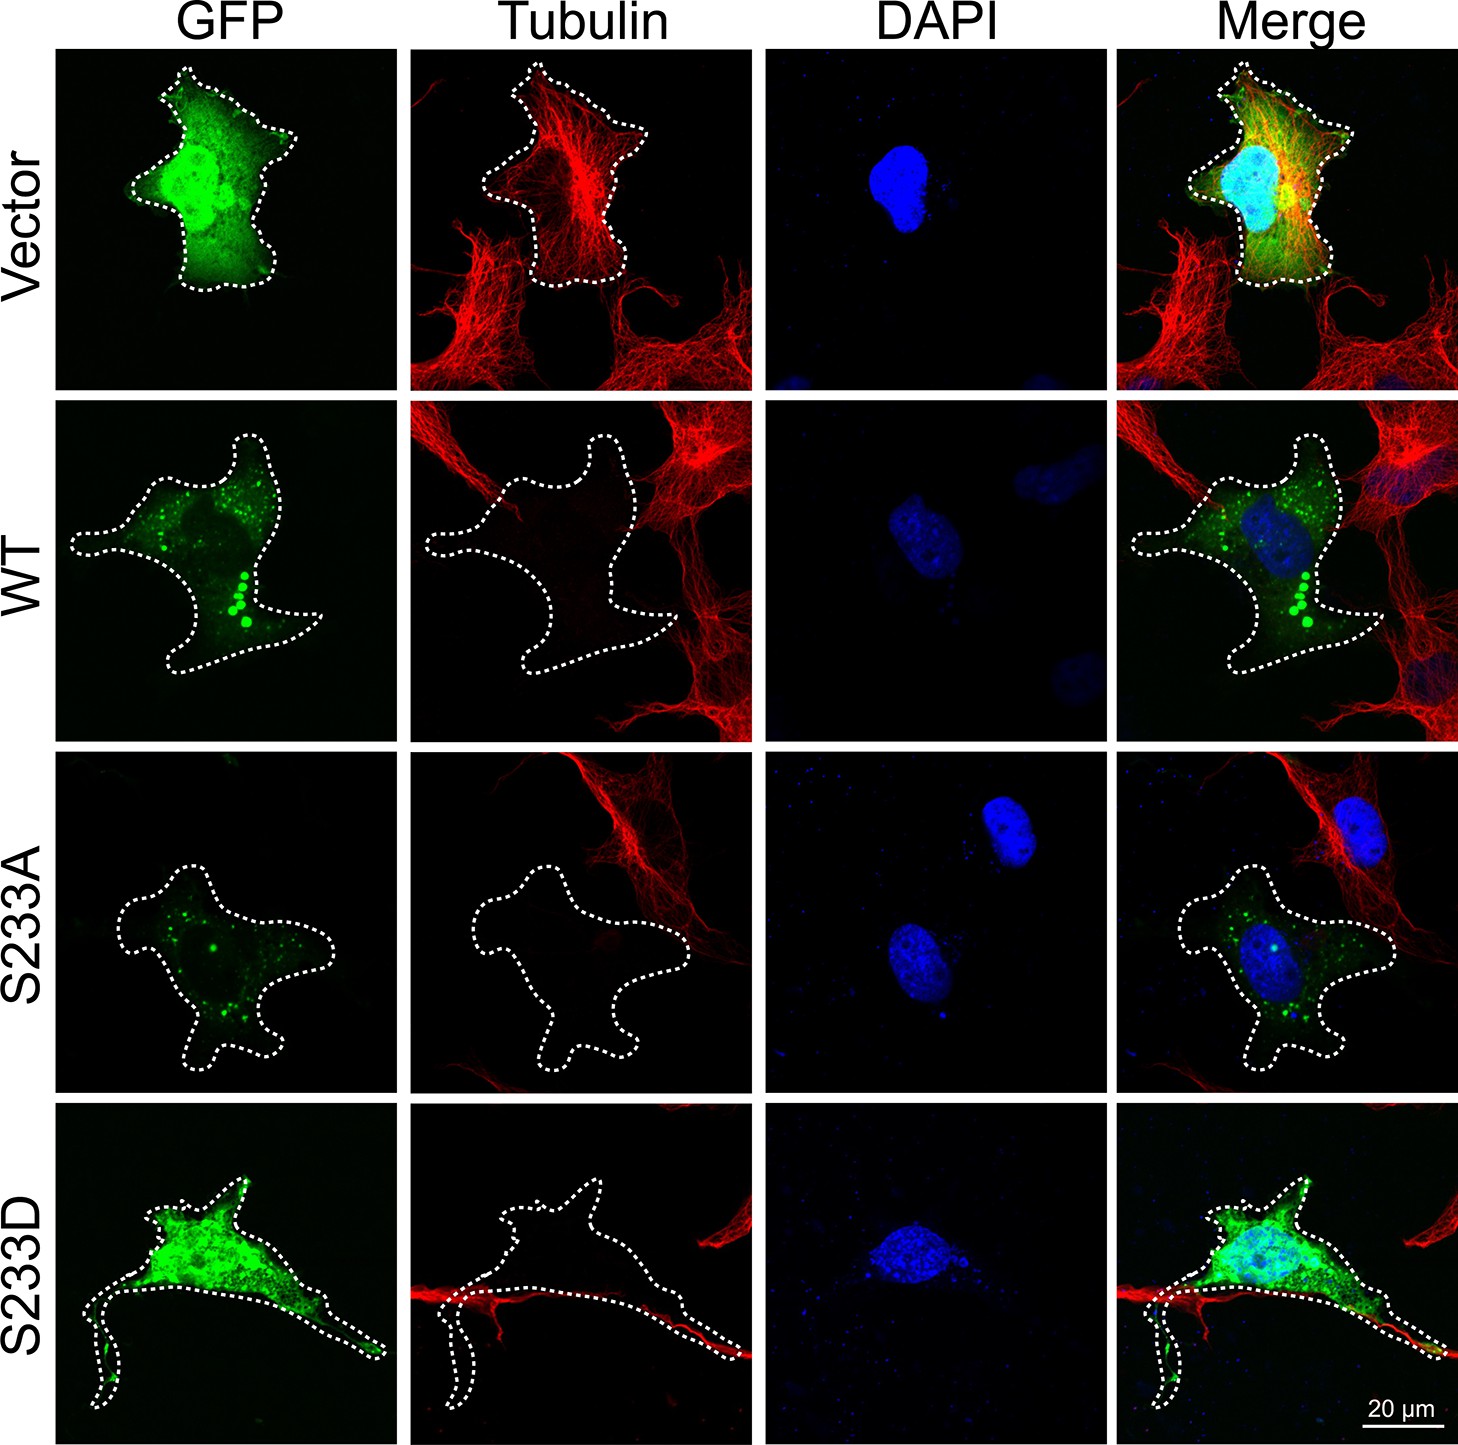
The phosphorylation of Ser233 in spastin does not affect the microtubule severing activity of spastin.
GFP and GFP-tagged spastin or its S233 phosphorylation mutants (S223A and S233D) were transfected into the COS7 cells. Cells were then fixed and stained with tubulin antibody to visualize the microtubule. Both GFP-tagged spastin S233A and spastin S233D could sever the microtubules efficiently. Scale bar: 20 μm.
Figure 3 with 1 supplement
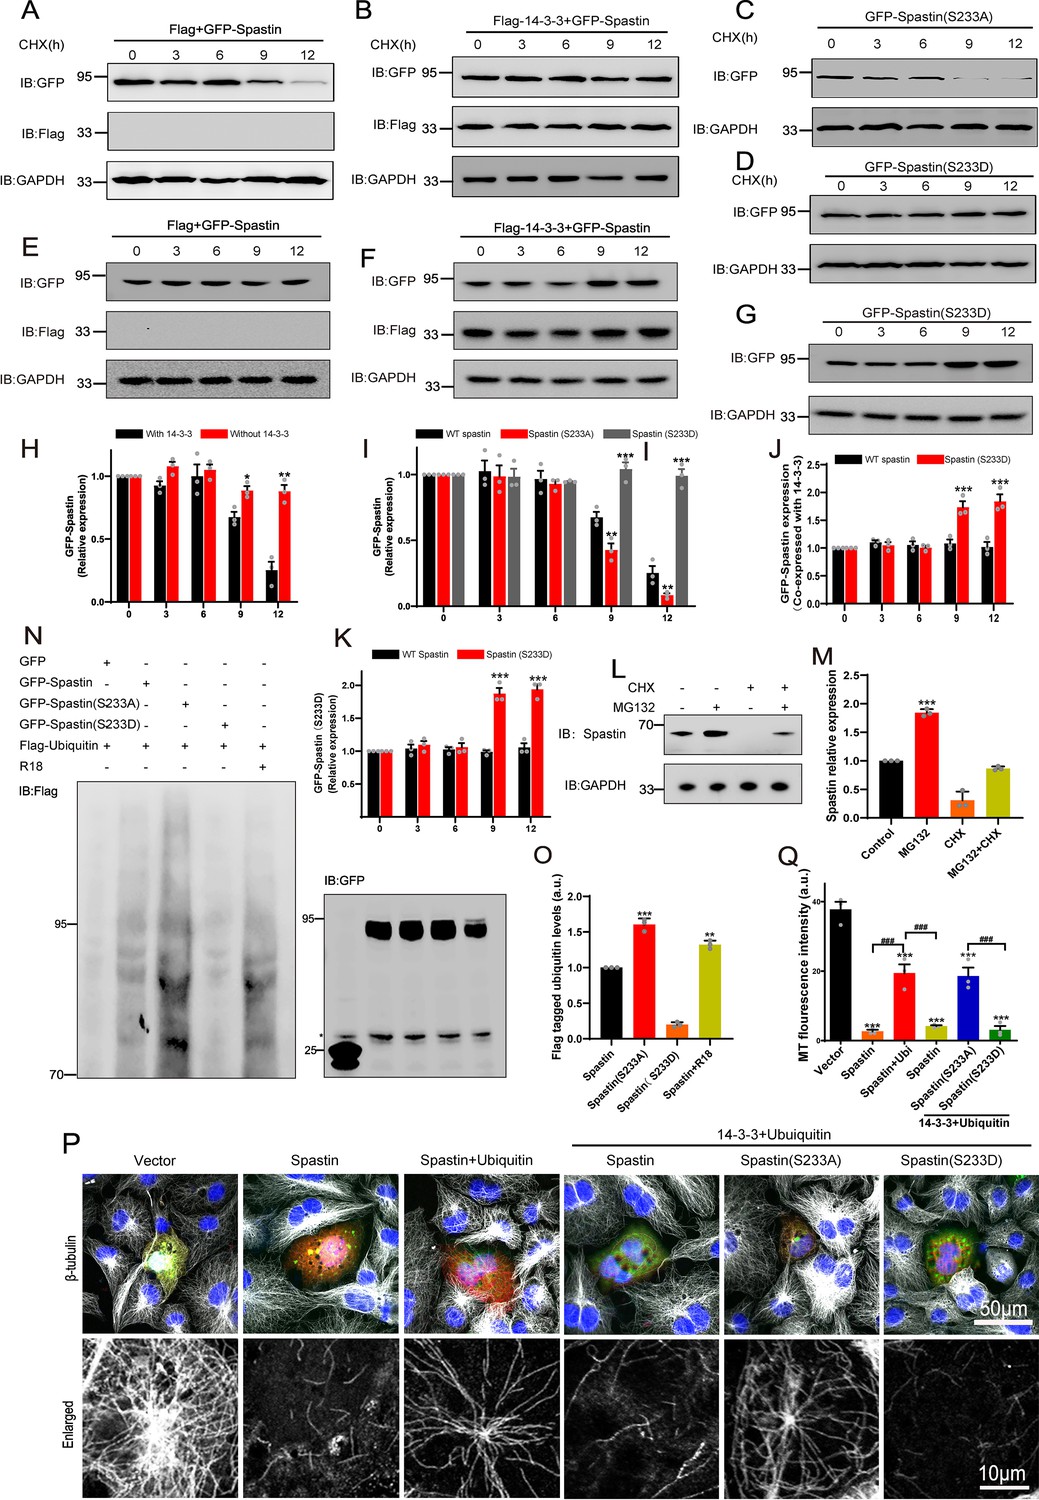
14-3-3 protein protects spastin by Ser233 phosphorylation from degradation through ubiquitin pathway.
(A, B) GFP-tagged spastin together with Flag or with Flag-tagged 14-3-3 was transfected into HEK 293T cells. Following the addition of protein synthesis inhibitor (cycloheximide, CHX), cell lysates were subjected to western blot to detect the GFP-tagged spastin protein levels. (C, D) Western blot analysis of HEK 293T cell lysates transfected with spastin mutations (S233A or S233D) after treating with cycloheximide at different indicated times. (E, F) GFP-tagged spastin with Flag or Flag-tagged 14-3-3 were co-transfected into HEK293T cells. Cell protein lysates from different time points were collected for western blot. (G) GFP-tagged spastin S233D was transfected into HEK293T cells, and western blot experiments were conducted to observe the protein expression levels of GFP-tagged spastin at different time points. (H) Quantitative analysis of spastin protein levels after addition of cycloheximide with or without 14-3-3 protein (n=3, *p<0.05). (I) Quantitative analysis of GFP-tagged spastin protein levels upon transfected with different spastin mutations (n=3, *p<0.05). (J) Quantitative analysis of spastin protein levels with or without 14-3-3 protein (n=3, *p<0.05). (K) Quantitative analysis of GFP-Spastin (S233D) protein levels at different time points (n=3, *p<0.05). (L) Cultured cortical neurons were treated with proteasome inhibitor MG132 or/and CHX for 36 hr, cell lysates were subjected to western blot analysis. (M) Quantification analysis of spastin protein levels (n=3, *p<0.05). (N) HEK 293T cells were transfected with GFP-tagged spastin or its S233 mutants and Flag-tagged ubiquitin, together with R18 or not, cells were harvested and subjected to immunoprecipitation using GFP antibody. Flag antibody was used to detect the ubiquitin band. (O) Quantitative analysis of the ubiquitination levels of GFP-Spastin (n=3, *p<0.05). (P) COS7 cells were transfected with indicated GFP-tagged spastin with or without Flag-tagged ubiquitin for 24 hr. Then, cells were fixed and stained with tubulin antibody to visualize microtubule arrangements. (Q) The normalized quantitative analysis of microtubule fluorescence intensity among indicated groups. Data were represented as the mean value of three independent experiments (n=3). All error bars are SEM. *p<0.05, **p<0.01, ***p<0.001. Scale bar: 50 μm, 10 μm.
-
Figure 3—source data 1
Raw and annotated blots for Figure 3.
- https://cdn.elifesciences.org/articles/90184/elife-90184-fig3-data1-v1.zip
-
Figure 3—source data 2
Numerical data for Figure 3H.
- https://cdn.elifesciences.org/articles/90184/elife-90184-fig3-data2-v1.xlsx
-
Figure 3—source data 3
Numerical data for Figure 3I.
- https://cdn.elifesciences.org/articles/90184/elife-90184-fig3-data3-v1.xlsx
-
Figure 3—source data 4
Numerical data for Figure 3J.
- https://cdn.elifesciences.org/articles/90184/elife-90184-fig3-data4-v1.xlsx
-
Figure 3—source data 5
Numerical data for Figure 3K.
- https://cdn.elifesciences.org/articles/90184/elife-90184-fig3-data5-v1.xlsx
-
Figure 3—source data 6
Numerical data for Figure 3M.
- https://cdn.elifesciences.org/articles/90184/elife-90184-fig3-data6-v1.xlsx
-
Figure 3—source data 7
Numerical data for Figure 3O.
- https://cdn.elifesciences.org/articles/90184/elife-90184-fig3-data7-v1.xlsx
-
Figure 3—source data 8
Numerical data for Figure 3Q.
- https://cdn.elifesciences.org/articles/90184/elife-90184-fig3-data8-v1.xlsx
Figure 3—figure supplement 1
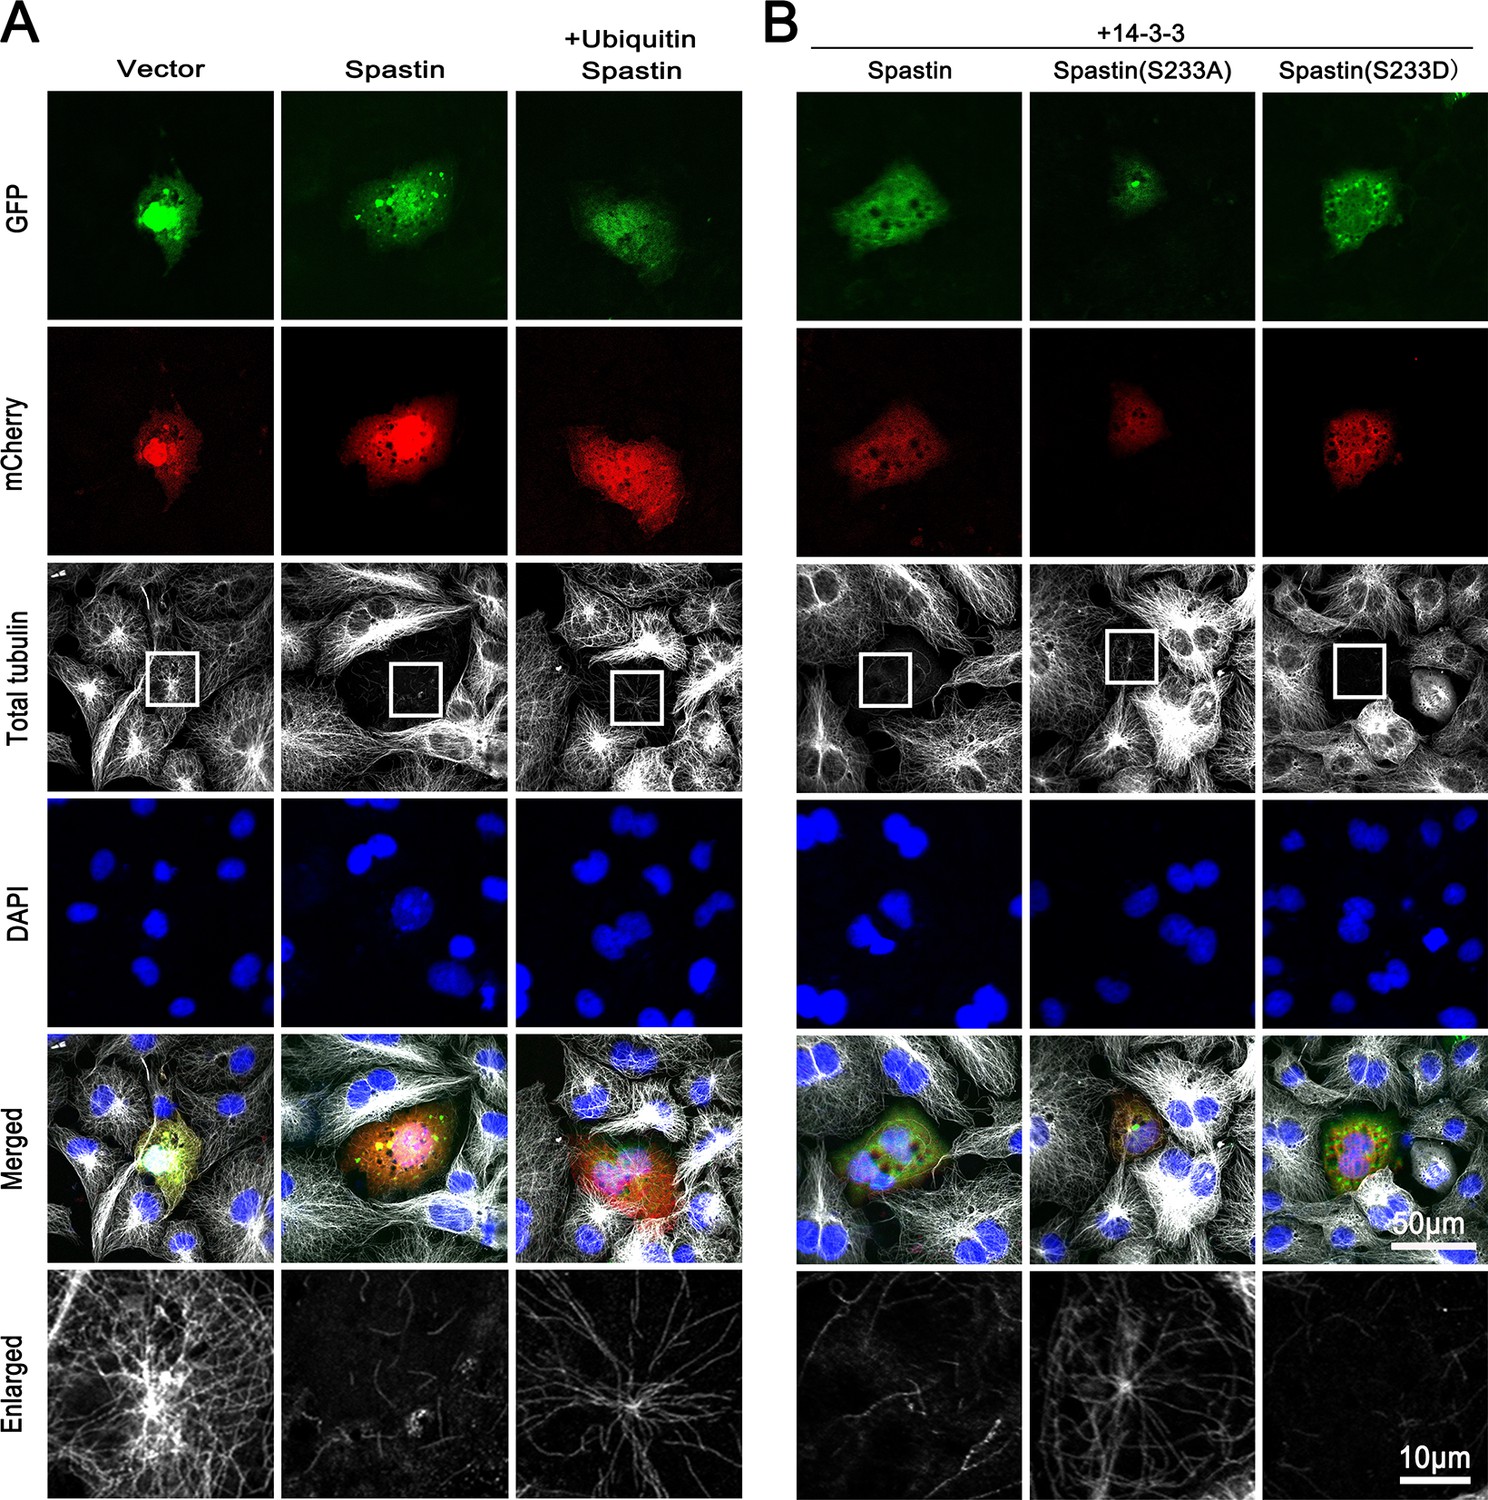
14-3-3 regulates spastin-dependent microtubule severing ability.
(A) GFP-tagged spastin were transfected with Flag-tagged ubiquitin into COS7 cells, and cells were stained with β-tubulin antibody. (B) Under the same conditions, mCherry-tagged spastin were transfected together with different Ser233 spastin mutations (spastin S233A or spastin S233D). Cells were also stained with β-tubulin to visualize the microtubule (MT) cytoskeleton. Scar bar, 50 μm and 10 μm.
Figure 4 with 3 supplements
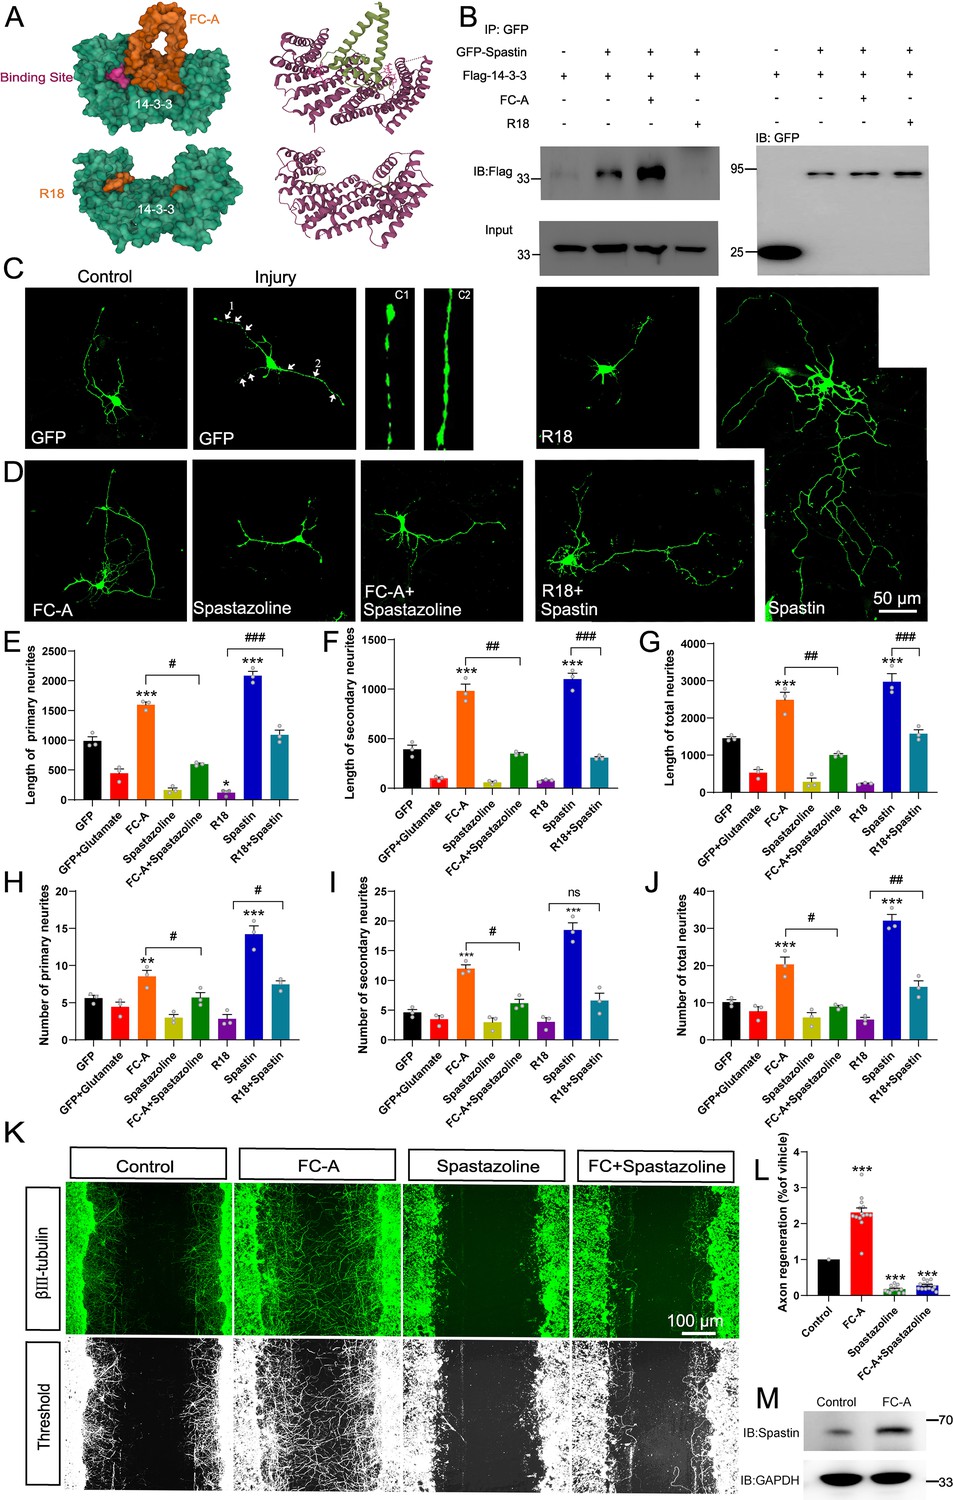
14-3-3 agonist Fusicoccin (FC-A) promotes the repair of neurite outgrowth and regeneration after injury via spastin.
(A) The surface structure and secondary structure of the molecular docking model between 14-3-3 protein with FC-A (PDB:2O98) or R18 (PDB:1A38). (B) HEK 293T cells were transfected with GFP-tagged spastin and Flag-tagged 14-3-3, cell lysates were incubated with FC-A or R18 and then subjected to GFP-trap assay. Flag antibodies were used to detect the 14-3-3 binding. (C) Hippocampal neurons (DIV2) were transfected with GFP to visualize its morphology. Neurons were then incubated with glutamate (120 μM) to induce injury, the neurite breakages and swellings were found in C1 and C2. (D) The injured neurons were transfected with spastin and incubated with FC-A, R18, or spastazoline for 24 hr, then cells were fixed and images were taken by confocal microscopy. Neurons were traced using Image J Pro Plus and quantitative analysis of the length of primary neurites (E), secondary neurites, (F) and total neurites (G) were performed. Quantitative analysis of the number of primary neurites (H), secondary neurites (I) and total neurites (J) from three independent experiments (n=3). *p<0.05, **p<0.01, ***p<0.001. Scale bar: 50 μm. (K) Primary cortical neurons were grown and scratch assays were performed at DIV7. FC-A or spastazoline were applied and incubated for 36 hr. Then, cells were stained with βIII-tubulin to visualize the morphology of neurites. (L) Cortical neurons cultured in vitro were treated with FC-A for 36 hr, and western blot experiments were conducted to observe the protein levels of spastin. (M) Quantitative analysis of the normalized axon regeneration rate. n=14 scratches from three experiments. All error bars are SEM. *p<0.05, **p<0.01, ***p<0.001. Scale bar: 100 μm.
-
Figure 4—source data 1
Raw and annotated blots for Figure 4.
- https://cdn.elifesciences.org/articles/90184/elife-90184-fig4-data1-v1.zip
-
Figure 4—source data 2
Numerical data for Figure 4E–J.
- https://cdn.elifesciences.org/articles/90184/elife-90184-fig4-data2-v1.xls
-
Figure 4—source data 3
Numerical data for Figure 4L.
- https://cdn.elifesciences.org/articles/90184/elife-90184-fig4-data3-v1.xls
Figure 4—figure supplement 1
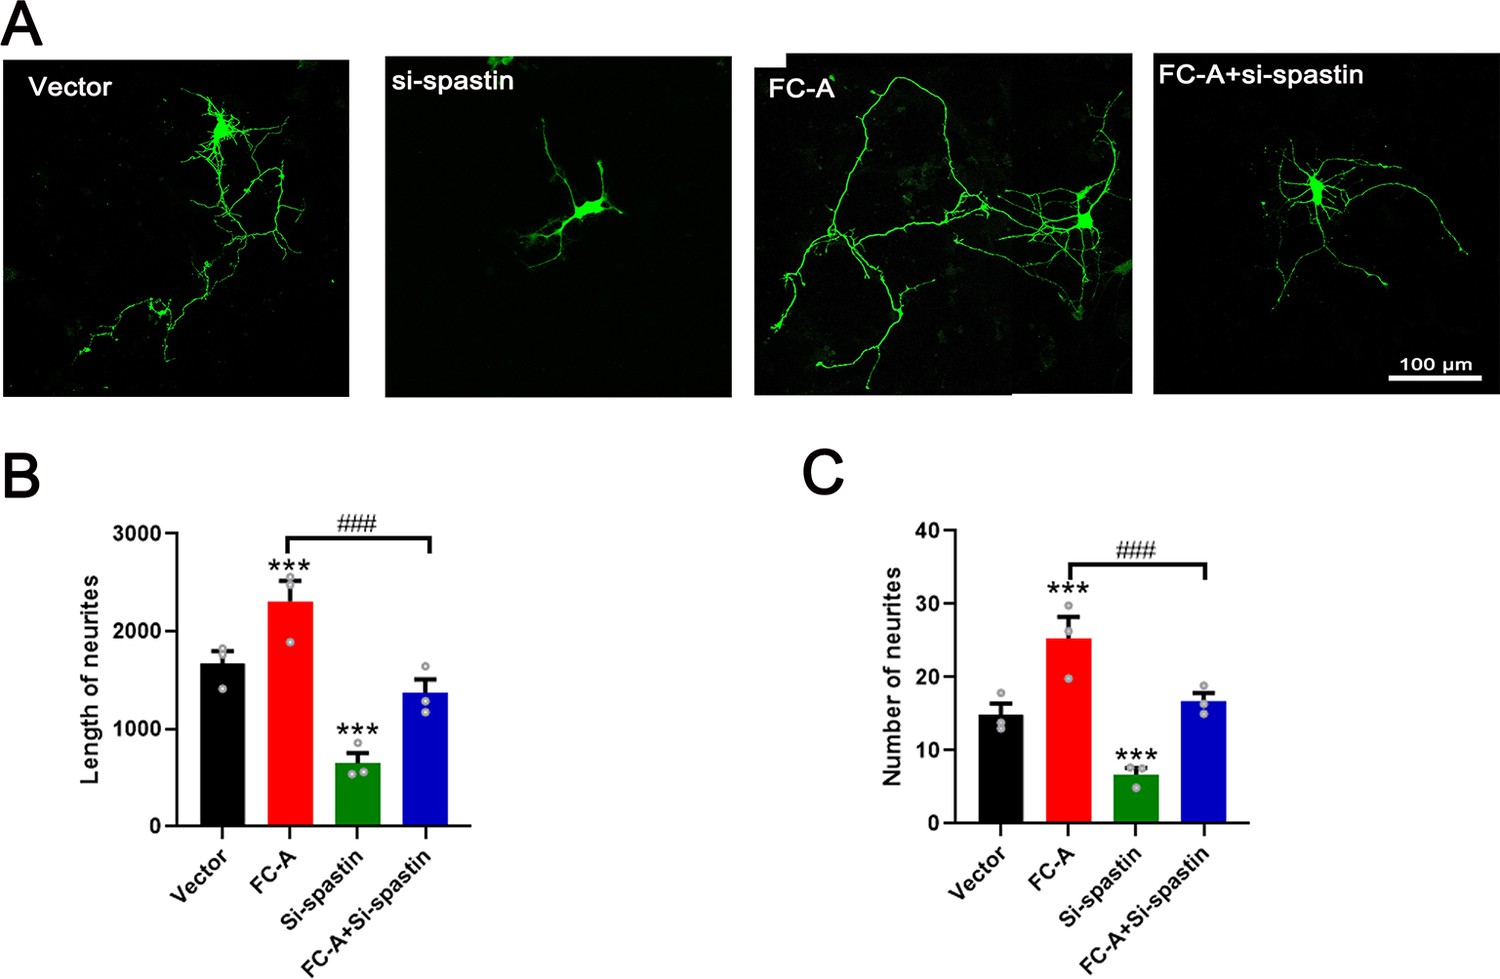
14-3-3 agonist Fusicoccin-A (FC-A) promoted neurite outgrowth of hippocampal neurons in stages 2–3 via spastin.
(A) Hippocampal neurons at DIV2 were transfected with GFP plasmids together with or without interference to knockdown spastin expression, to visualize the morphology of neurons. Neurons were then incubated with FC-A for 24 hr, then cells were fixed and images were taken by confocal microscopy. Neurons were traced using Image J Pro Plus and quantitative analysis of the length of total neurites (B) and (C) the number of total neurites (n=3). All error bars are SEM. *p<0.05, **p<0.01, ***p<0.01. Scale bar: 100 μm.
Figure 4—figure supplement 2

14-3-3 inhibitor R18 inhibited neurite outgrowth of hippocampal neurons in stages 2–3 via spastin.
(A) Hippocampal neurons at DIV2 were transfected with GFP or GFP-tagged spastin, together with R18 or not accordingly. Cells were fixed and images were taken by confocal microscopy. Neurons were traced using Image J Pro Plus and quantitative analysis of (B) the length of total neurites and (C) the number of total neurites (n=3). All error bars are SEM. *p<0.05, **p<0.01, ***p<0.01. Scale bar: 100 μm.
Figure 4—figure supplement 3
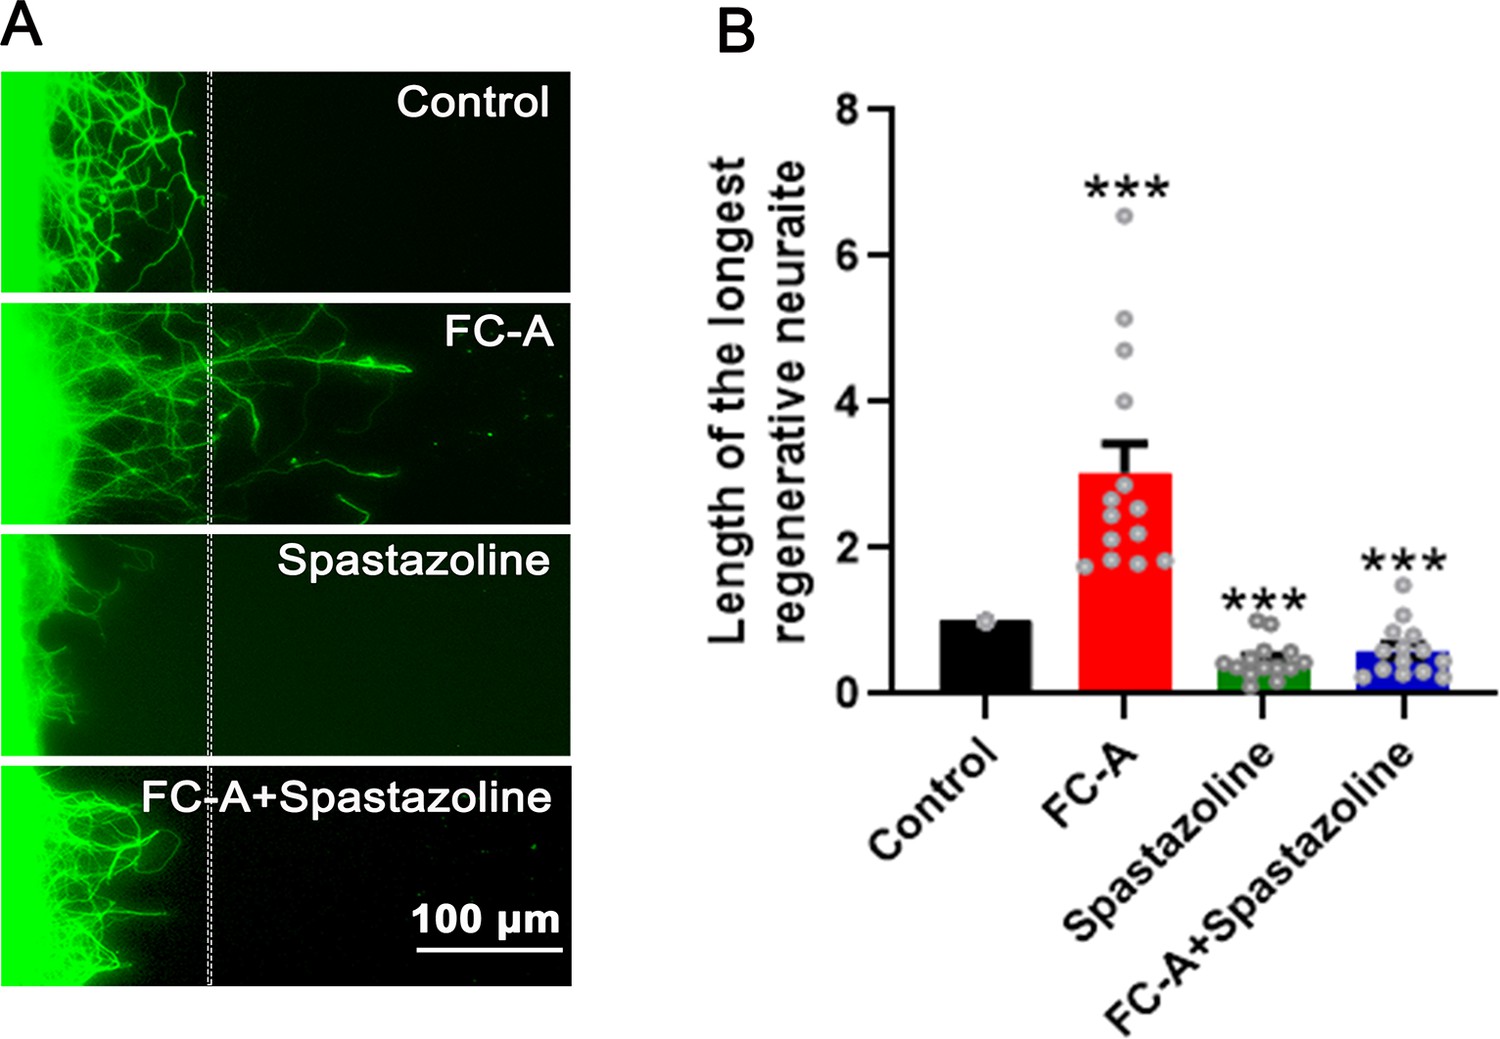
14-3-3 agonist Fusicoccin-A (FC-A) promoted neurite regeneration of cortical neurons in via spastin.
(A) Cortical neurons were cultured for 7 days and subjected to mechanical scratched with a pipet tip. Cells were incubated with FC-A or spastazoline for 24 hr. Cells were fixed and stained with βIII-Tubulin. (B) Quantification of the longest regenerative neurites (n≥13 axons). All error bars are SEM. *p<0.05, **p<0.01, ***p<0.01. Scale bar: 100 μm.
Figure 5 with 4 supplements
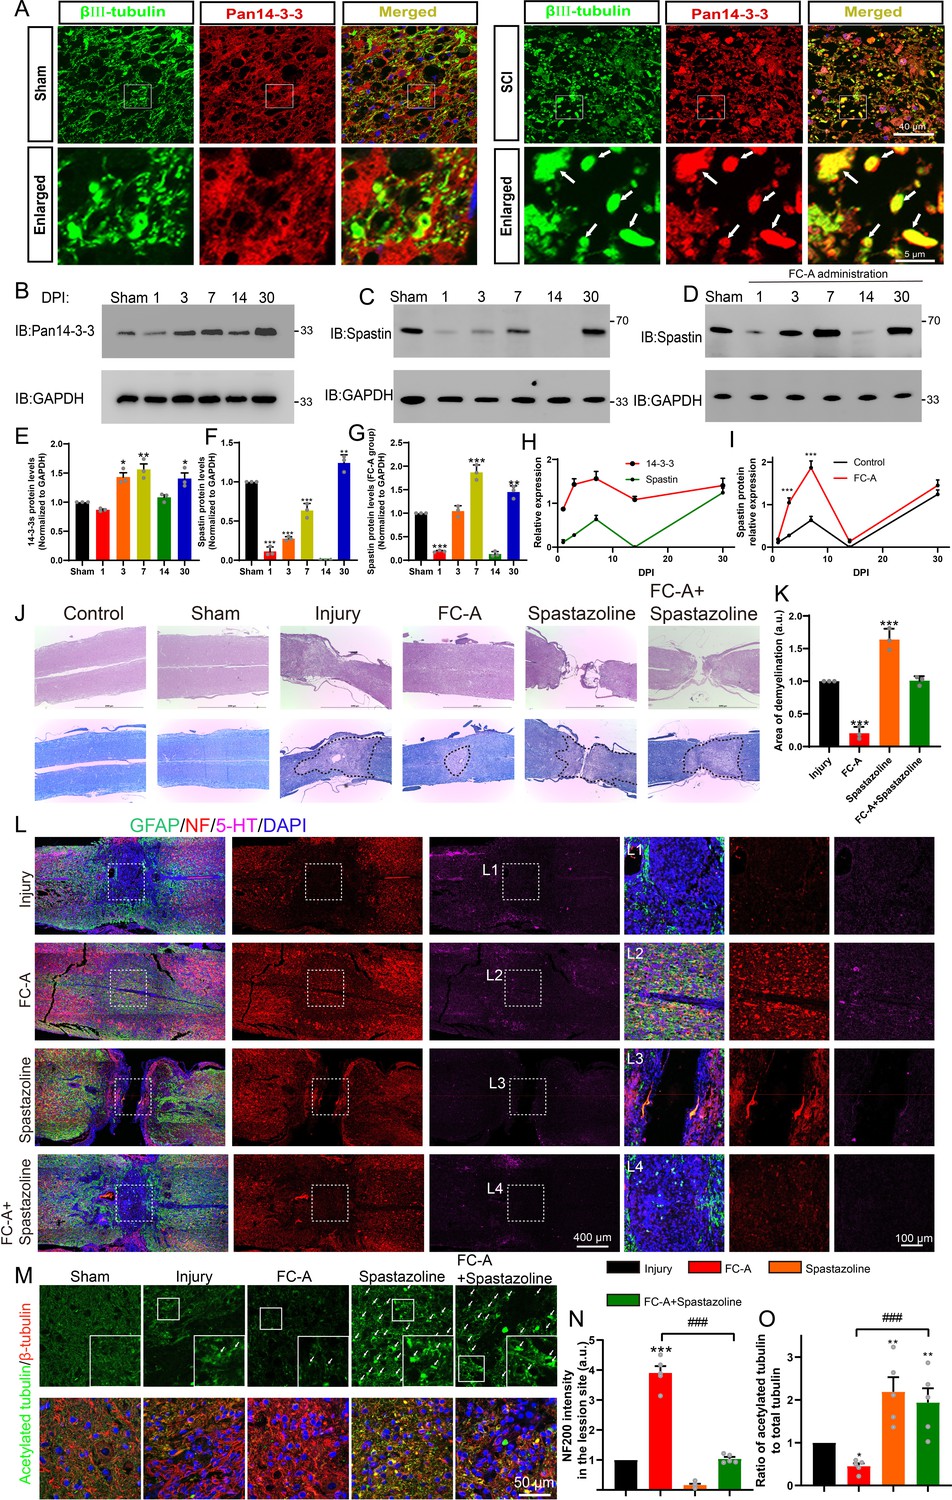
14-3-3/spastin pathway is involved in nerve regeneration after spinal cord injury by targeting microtubules (MTs).
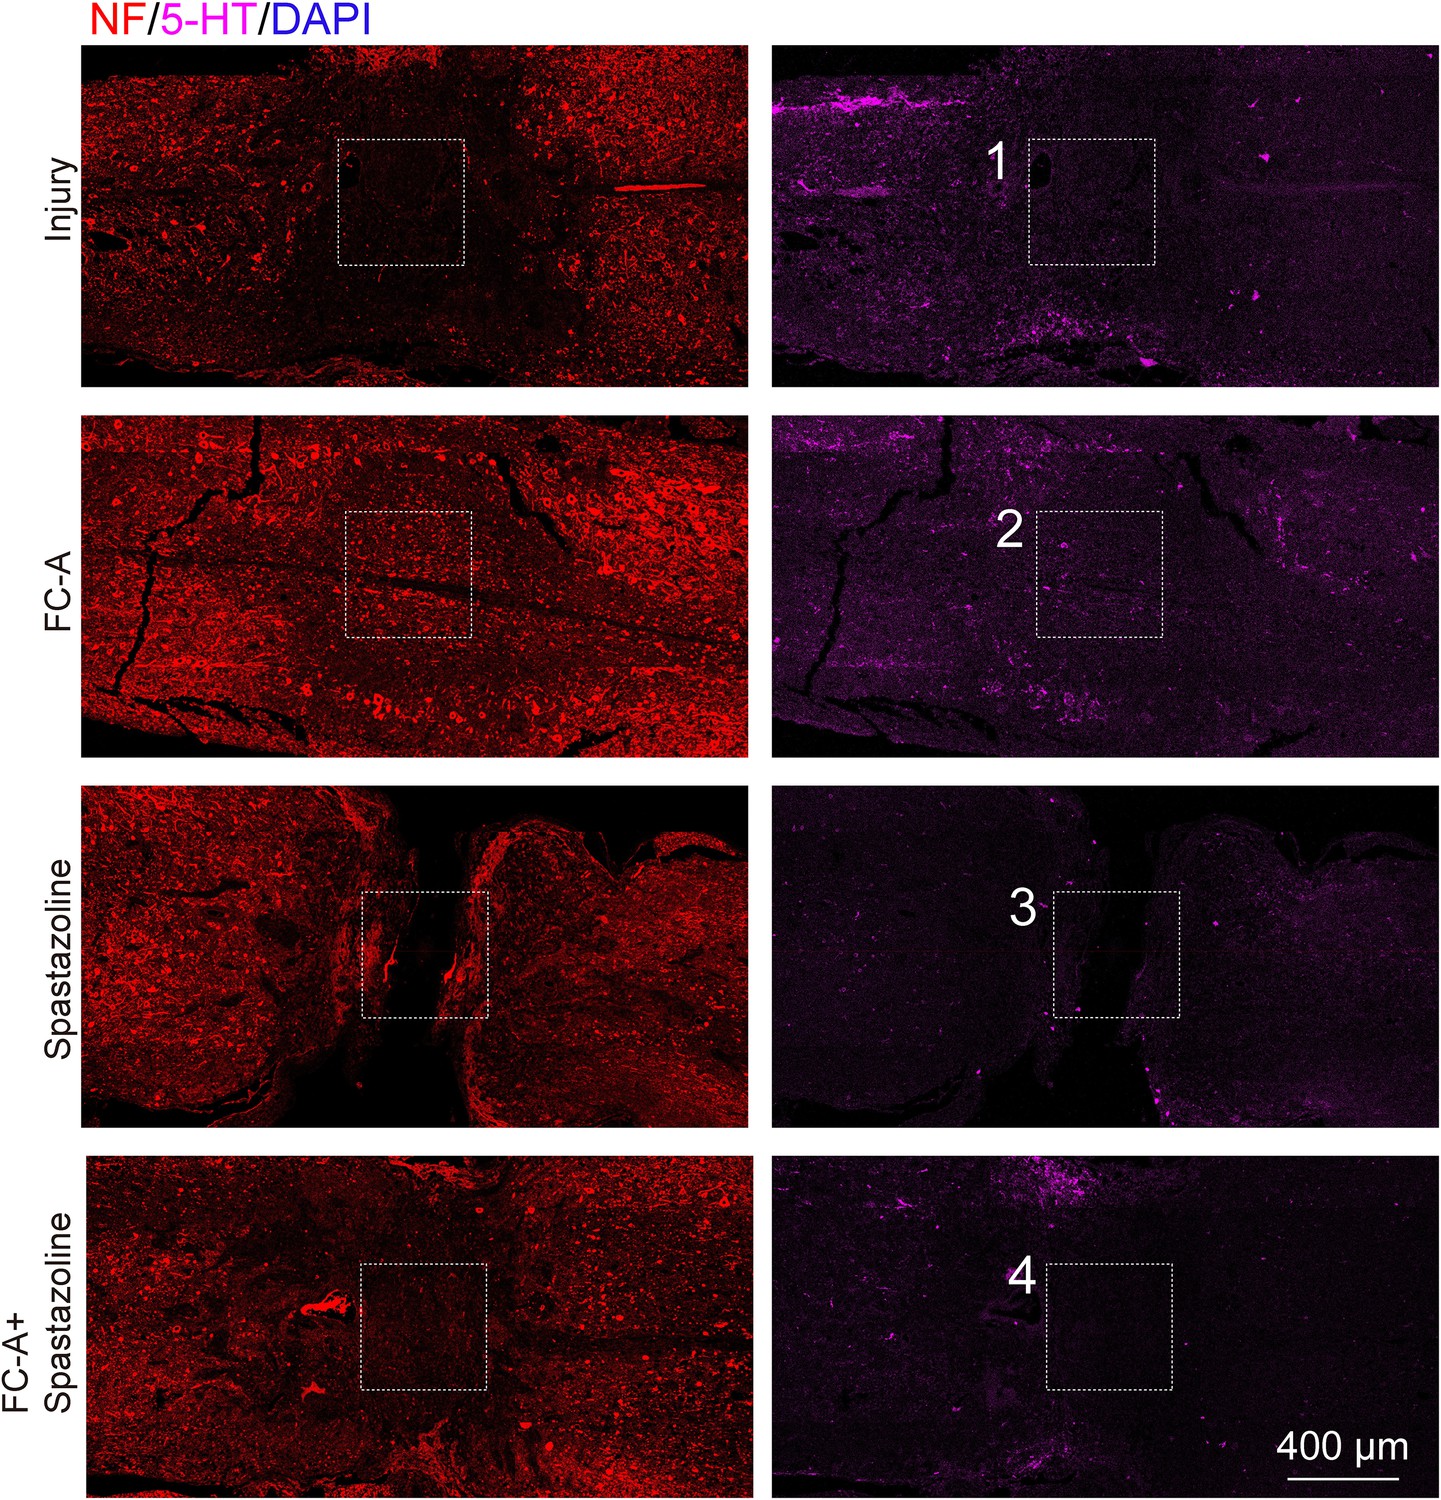
(A) After spinal cord contusion, the lesion site of spinal tissue in the sham group and the SCI group were stained with Pan 14-3-3 (red) and βIII tubulin (green). The arrows mean the elevated 14-3-3 protein in the neuronal compartment. Scale bar: 40 μm, 5 μm. (B, C) After spinal cord contusion, the spinal cord tissues of the lesion site (near 1 cm) at indicated times (1, 3, 7 14, and 30 DPI) were ground and lysed, then subjected to western blot with 14-3-3 and spastin antibody. (D) After spinal cord injury, intraperitoneal injections of Fusicoccin-A (FC-A) were administered. Tissue from the lesion site was collected at indicated time points and subjected to western blot to observe the spastin protein levels. (E, F) Quantitative analysis of the 14-3-3 protein expression and spastin protein expression (n=3 per group). (G) Quantitative analysis of the spastin protein expression administrated with FC-A after spinal cord injury (n=3 per group). (H) Analysis of the expression trends of 14-3-3 and spastin proteins following spinal cord injury. (I) Trend analysis of spastin protein expression levels in lesion site of mice with spinal cord injury, comparing the injury control group with the FC-A treatment group. (J) 14-3-3 agonist FC-A and spastin inhibitor spastazoline were admisnistrated after spinal cord contusion. At 45 DPI (Days post-injury), the tissues were fixed and embedded, then cut horizontally and longitudinally. Hematoxylin and eosin (H&E) and LFB (Luxol fast blue stain) were stained. The spinal cord demyelination was shown inside the area of the dotted line. Scale bar: 2000 μm. (K) Quantitative analysis of demyelinated area in the lesion site among different groups (n=3, *p<0.05). (L) The slices were then subjected to immunofluorescence staining, and GFAP (green) was stained to label astrocytes, neurofilament (NF) (red) was stained to label neurons and 5-HT (magenta) was stained to label monoaminergic axons. The lesion site in different groups was boxed and enlarged in (L1, L2, L3, L4). Scale bar: 400 μm, 100 μm. (M) The spinal cord slices were stained with acetylated tubulin (Stable MTs which lack dynamics) and β-tubulin (total tubulin). Scale bar: 50 μm. (N) The normalized intensity of NF was quantified (n=5 animals per group). Mean ± SEM. *p<0.05, **p<0.01, ***p<0.001. (O) The normalized ratio of acetylation tubulin to total tubulin was calculated by the intensity value of acetylated tubulin divided by total tubulin (n=5 per group). Mean ± SEM. *p<0.05, **p<0.01, ***p<0.001.
-
Figure 5—source data 1
Raw images for Figure 5 (Part 1).
- https://cdn.elifesciences.org/articles/90184/elife-90184-fig5-data1-v1.zip
-
Figure 5—source data 2
Raw images for Figure 5 (Part 2).
- https://cdn.elifesciences.org/articles/90184/elife-90184-fig5-data2-v1.zip
-
Figure 5—source data 3
Raw and annotated blots for Figure 5.
- https://cdn.elifesciences.org/articles/90184/elife-90184-fig5-data3-v1.zip
-
Figure 5—source data 4
Numerical data for Figure 5E–I.
- https://cdn.elifesciences.org/articles/90184/elife-90184-fig5-data4-v1.xlsx
-
Figure 5—source data 5
Numerical data for Figure 5K.
- https://cdn.elifesciences.org/articles/90184/elife-90184-fig5-data5-v1.xlsx
-
Figure 5—source data 6
Numerical data for Figure 5N–O.
- https://cdn.elifesciences.org/articles/90184/elife-90184-fig5-data6-v1.xlsx
Figure 5—figure supplement 1
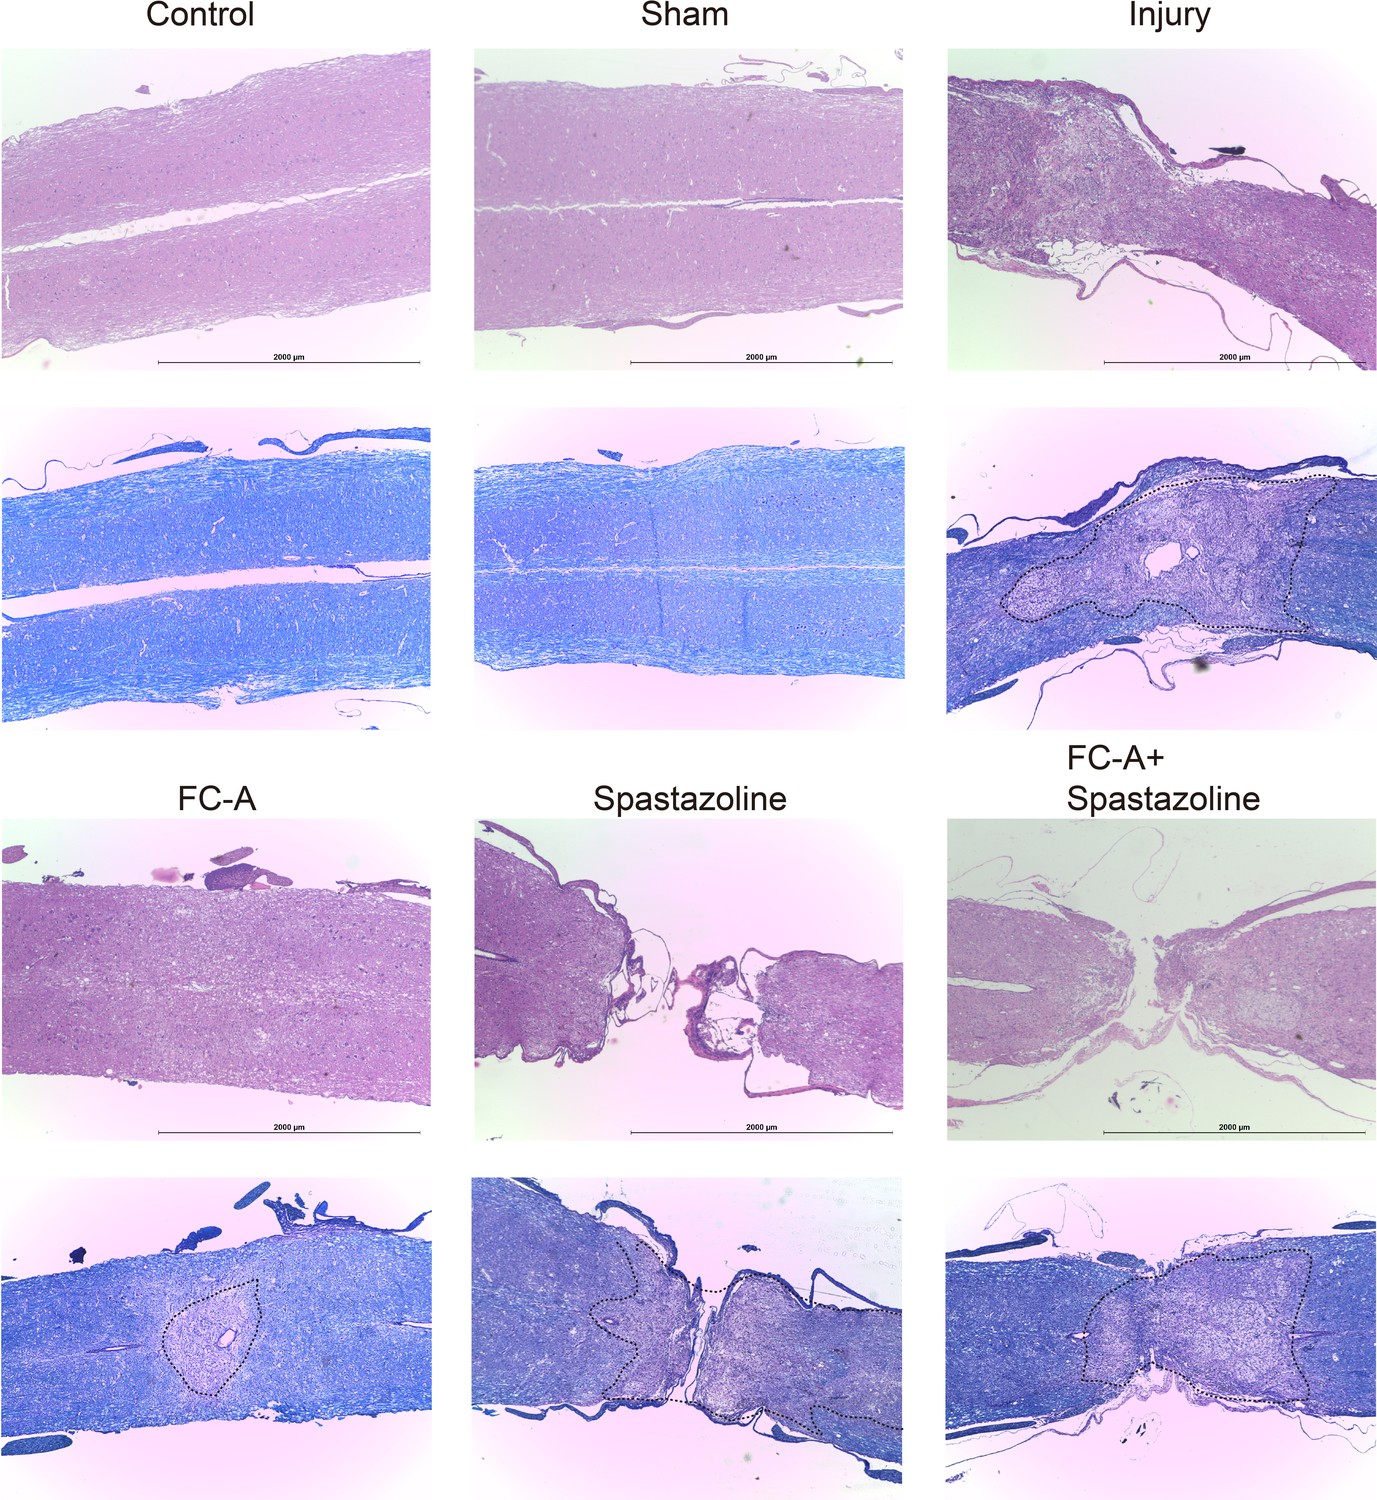
After spinal cord contusion, the 14-3-3 agonist Fusicoccin-A (FC-A) and spastin inhibitor spastazoline were administered.
Hematoxylin and eosin (H&E) and Luxol fast blue stain (LFB) were used for staining. Demyelination of the spinal cord can be observed within the region enclosed by the dotted line. This image is an enlargement of Figure 5J. Scale bar: 2000 μm.
Figure 5—figure supplement 2
Following spinal cord contusion, 14-3-3 agonist Fusicoccin-A (FC-A) and spastin inhibitor spastazoline were administered.
Figure 5—figure supplement 3
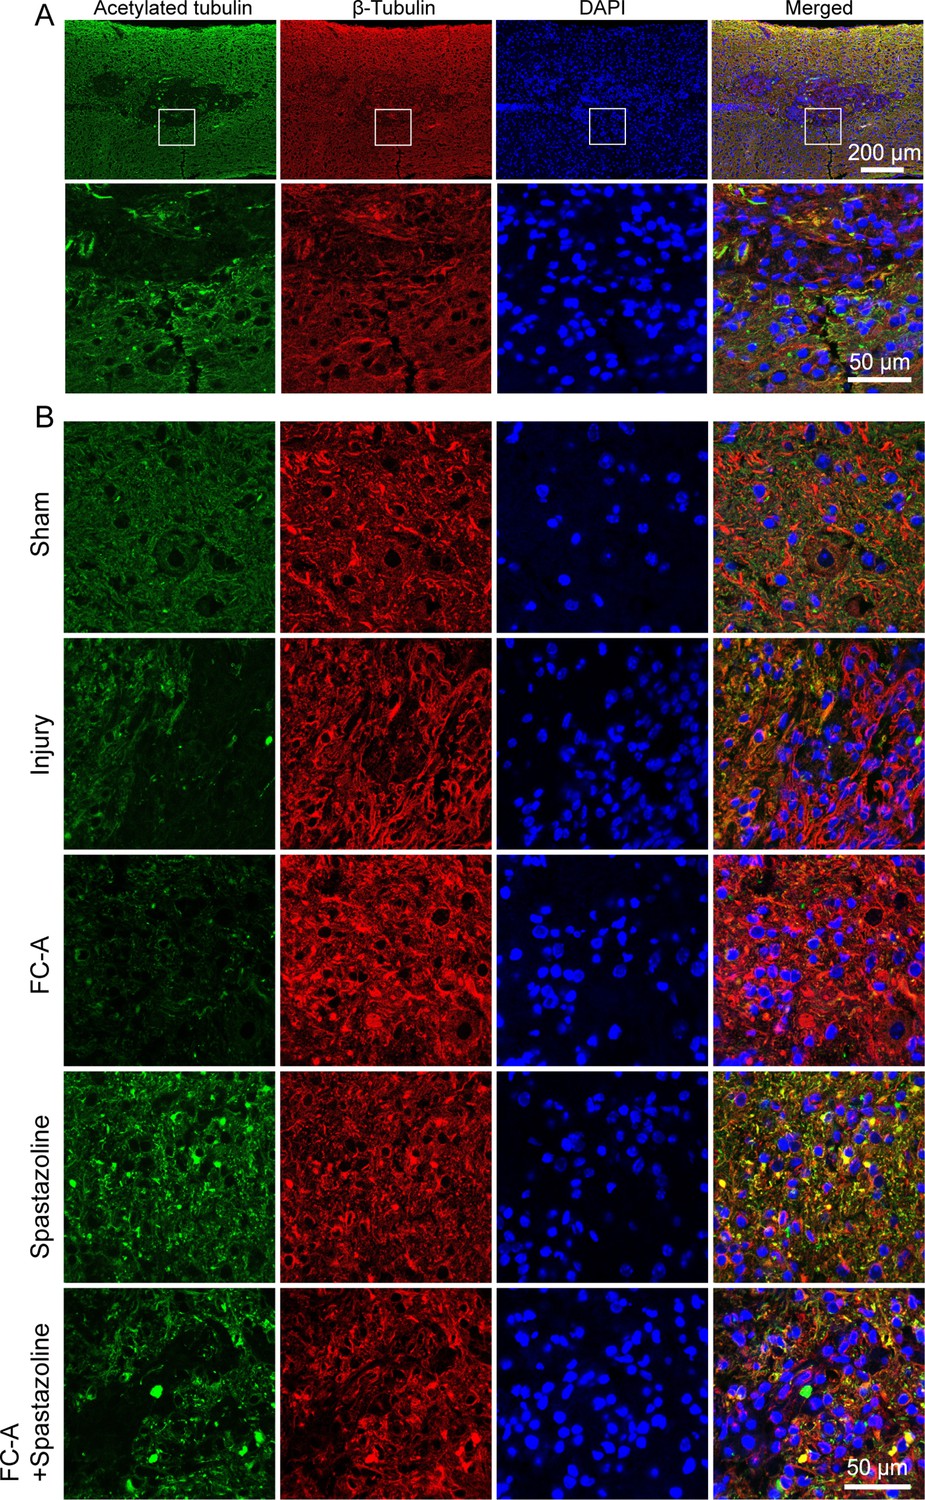
Microtubule stability in the lesion site of mice after spinal cord contusion and administrated with Fusicoccin-A (FC-A) and spastazoline.
(A) The sagittal overview of the lesion site of spinal cord injury. Acetylated tubulin (green) and β-tubulin (red) were stained to label stable microtubules (MTs) and total MTs. Scale bar: 200 μm, 50 μm. (B) The intensity and proportion of acetylated tubulin and β-tubulin around the lesion site in different groups (sham, injury, FC-A, spastazoline, and FC-A + spastazoline). Scale bar: 50 μm. (C) Higher resolution image in panel B.
Figure 5—figure supplement 4
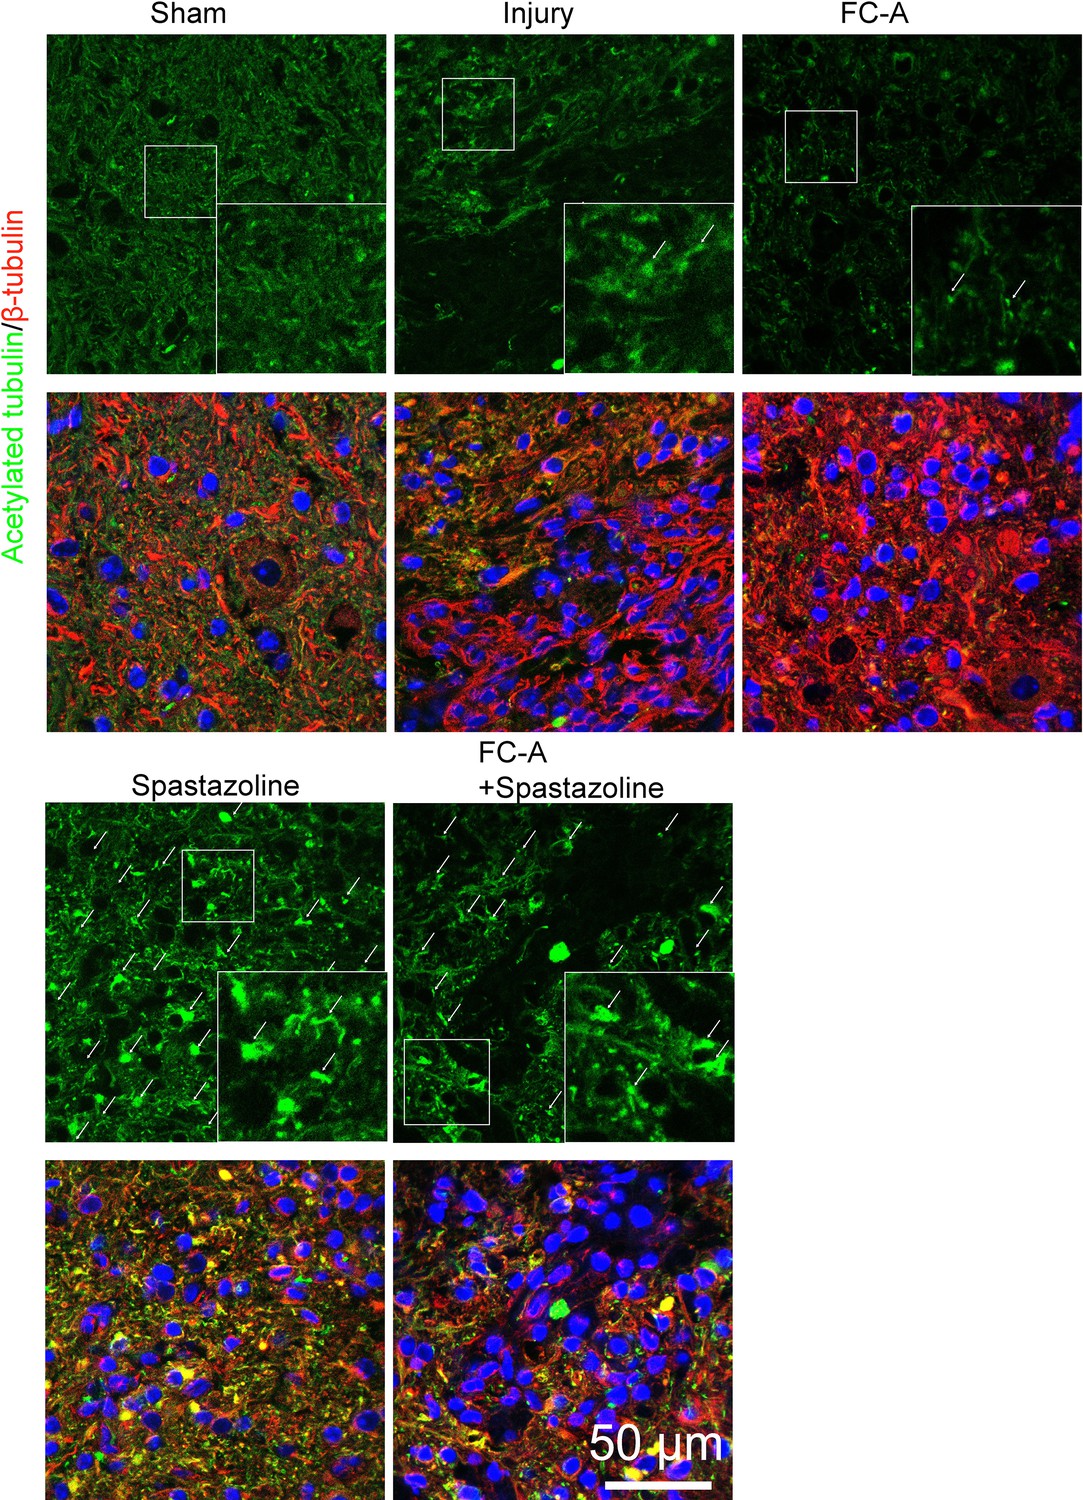
Higher resolution image in Figure 5—figure supplement 3.
Scale bar: 50 μm.
Figure 6
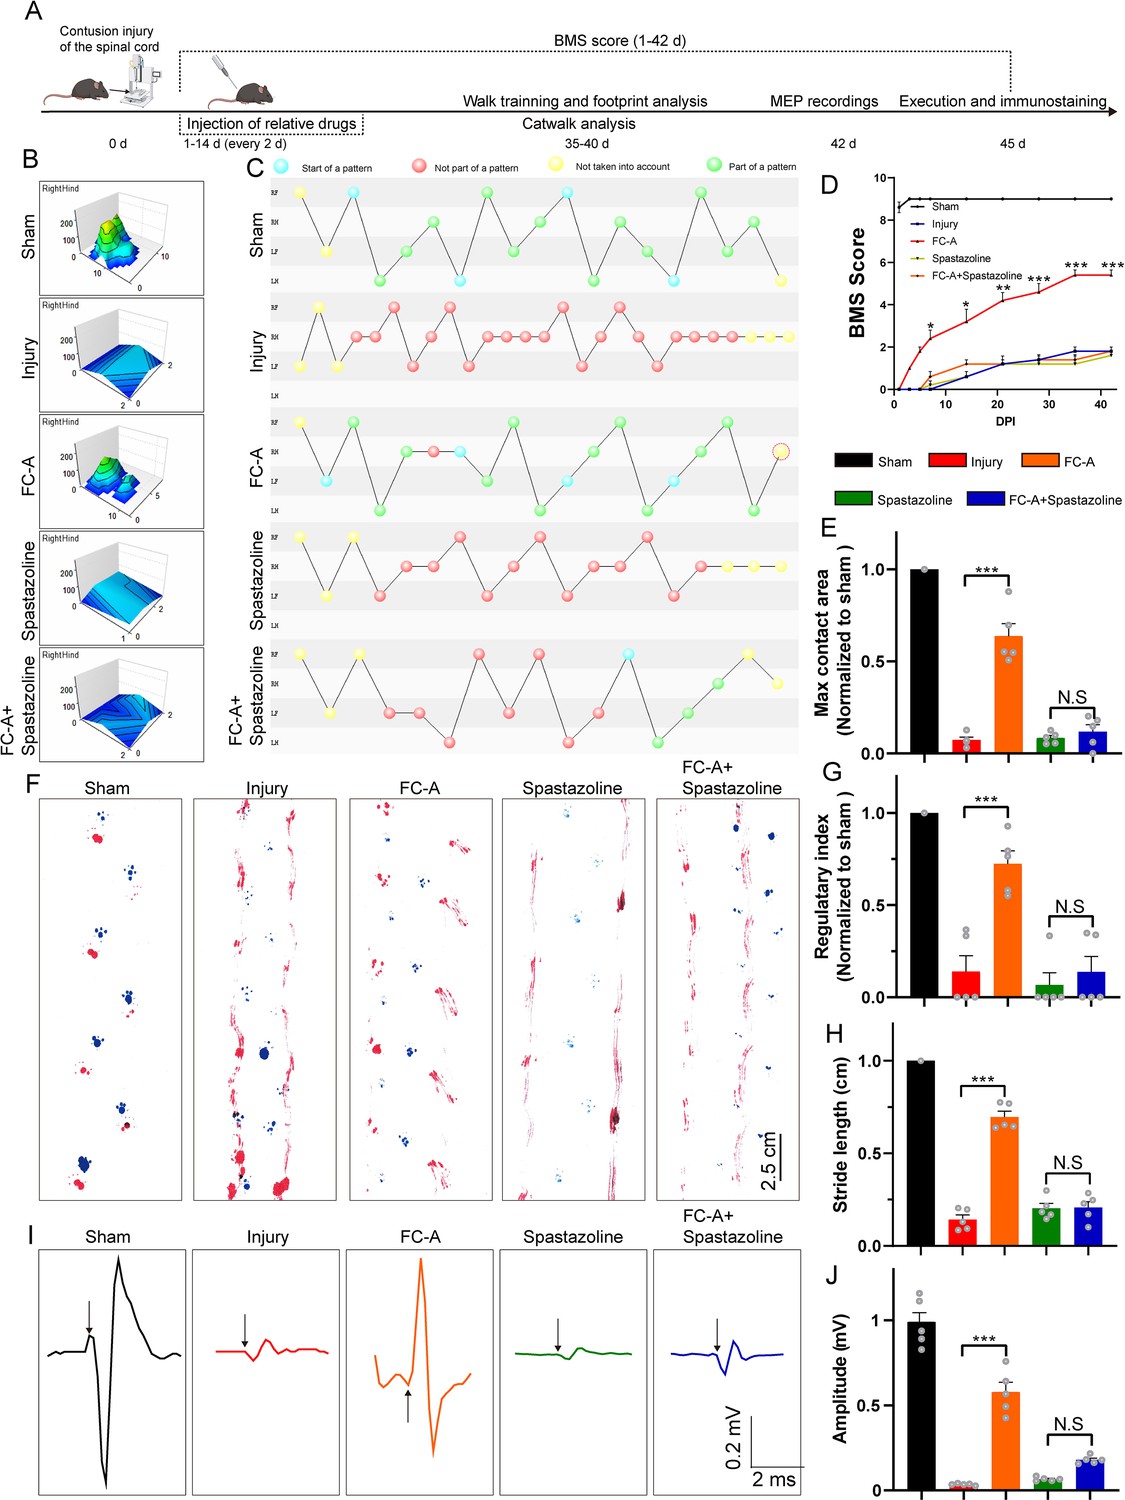
14-3-3/spastin pathway coordinates locomotor recovery after spinal cord contusion.
(A) Schematic illustration of relative treatments and examinations at different indicated times. (B) The max contact areas of the right hindlimb were recorded and analyzed by the Catwalk software. (C) The footfall patterns were visualized by the Catwalk software. The blue dot represents the start of a pattern. The red dot represents the gait was not part of a pattern. The yellow dot represents that the gait was not taken into account. The green one means the gait belongs to a normal part of a pattern. (D) Basso mouse scale (BMS) scores at different indicated days after injury and data were represented as mean ± SEM. (n=5 group, data were analyzed by one-way ANOVA, and Bonferroni’s multiple-comparison test were used for post hoc comparisons). (E) The quantitative analysis of the hindlimb (right) max contact area. (n=5 animals per group). (F) Footprint analysis of the mice at 6 weeks after spinal cord contusion. The forelimbs were marked with blue and the hindlimbs were marked with red. Scale bar: 2.5 cm. (G) The normalized regularity index of the footfall pattern calculated by Catwalk software (~100% in the sham group, n=5 animals per group). (H) Quantitative analysis of the stride length in the footprint assay. The mean stride length of each walk was counted, n=5 animals per group. (I) Motor evoked potentials (MEPs) were recorded at 7 weeks after spinal cord contusion. The craniotomy was performed and the M1 region of the sensorimotor cortex were stimulated by a single square-wave stimulus of 0.5 mA, 0.5 ms duration, 2 ms time delay, and 1 Hz. The MEP were recorded with the signals detected by the electrode on the gastrocnemius muscle. The representative histograms of the amplitude-times are shown. The arrows indicated the stimulus. (J) The current amplitudes of the MEP were quantified, n=5 animals per group. Mean ± SEM. *p<0.05, **p<0.01, ***p<0.001.
-
Figure 6—source data 1
Numerical data for Figure 6.
- https://cdn.elifesciences.org/articles/90184/elife-90184-fig6-data1-v1.xls
Figure 7 with 4 supplements
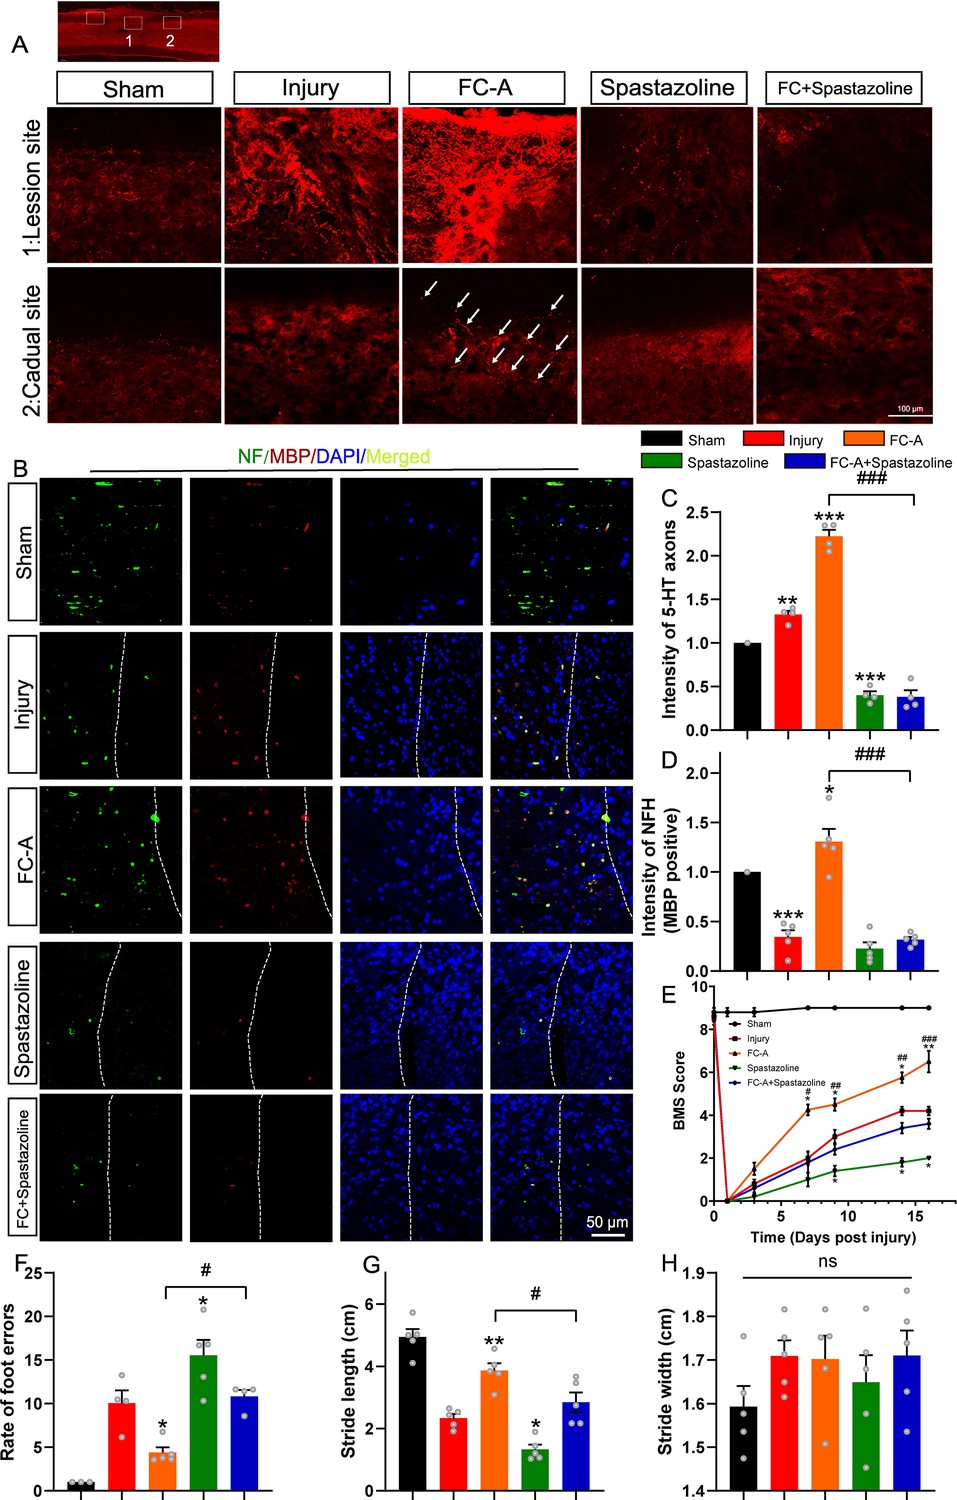
Fusicoccin-A (FC-A) promotes axon regeneration in a T10 lateral hemisection spinal cord injury model.
(A) The spinal cords of adult mice were subjected to lateral hemisection and administrated by intraperitoneal injection with FC-A or spastazoline. Sagittal view of 5-HT-immunoreactive raphespinal fibers in the spinal cord on 17 DPI. Scale bar: 100 μm. (B) Sagittal view of neurofilaments which was myelin basic protein (MBP) positive in the white manner of the lesion site of the spinal cord. Scale bar: 50 μm. (C) The normalized quantification of 5-HT immunoreactive fluorescence intensity (0.5 mm caudal to the lesion site, n=5 animals per group). (D) The normalized quantification of NF (Neurofilament) immunoreactive fluorescence intensity in the lesion site (n=5 animals per group). (E) The locomotor function of mice after SCI were scored at the indicated time points according to the standard of the Basso Mouse Scale (BMS). (F) Foot fault test was performed and the total steps and steps dropped out of the right hindlimb were recorded. The rate of the foot errors was analyzed, n=5 animals per group. *p<0.05, **p<0.01, ***p<0.001. (G, H) The footprint assay was performed and stride length (G) and stride width (H) quantitatively analyzed. Data were presented as mean ± SEM, n=5 animals per group, the mean value of each animal’s walk were calculated.
-
Figure 7—source data 1
Raw Images for Figure 7.
- https://cdn.elifesciences.org/articles/90184/elife-90184-fig7-data1-v1.zip
-
Figure 7—source data 2
Numerical data for Figure 7C.
- https://cdn.elifesciences.org/articles/90184/elife-90184-fig7-data2-v1.xlsx
-
Figure 7—source data 3
Numerical data for Figure 7D.
- https://cdn.elifesciences.org/articles/90184/elife-90184-fig7-data3-v1.xlsx
-
Figure 7—source data 4
Numerical data for Figure 7E.
- https://cdn.elifesciences.org/articles/90184/elife-90184-fig7-data4-v1.xlsx
-
Figure 7—source data 5
Numerical data for Figure 7F.
- https://cdn.elifesciences.org/articles/90184/elife-90184-fig7-data5-v1.xlsx
-
Figure 7—source data 6
Numerical data for Figure 7G.
- https://cdn.elifesciences.org/articles/90184/elife-90184-fig7-data6-v1.xlsx
-
Figure 7—source data 7
Numerical data for Figure 7H.
- https://cdn.elifesciences.org/articles/90184/elife-90184-fig7-data7-v1.xlsx
Figure 7—figure supplement 1
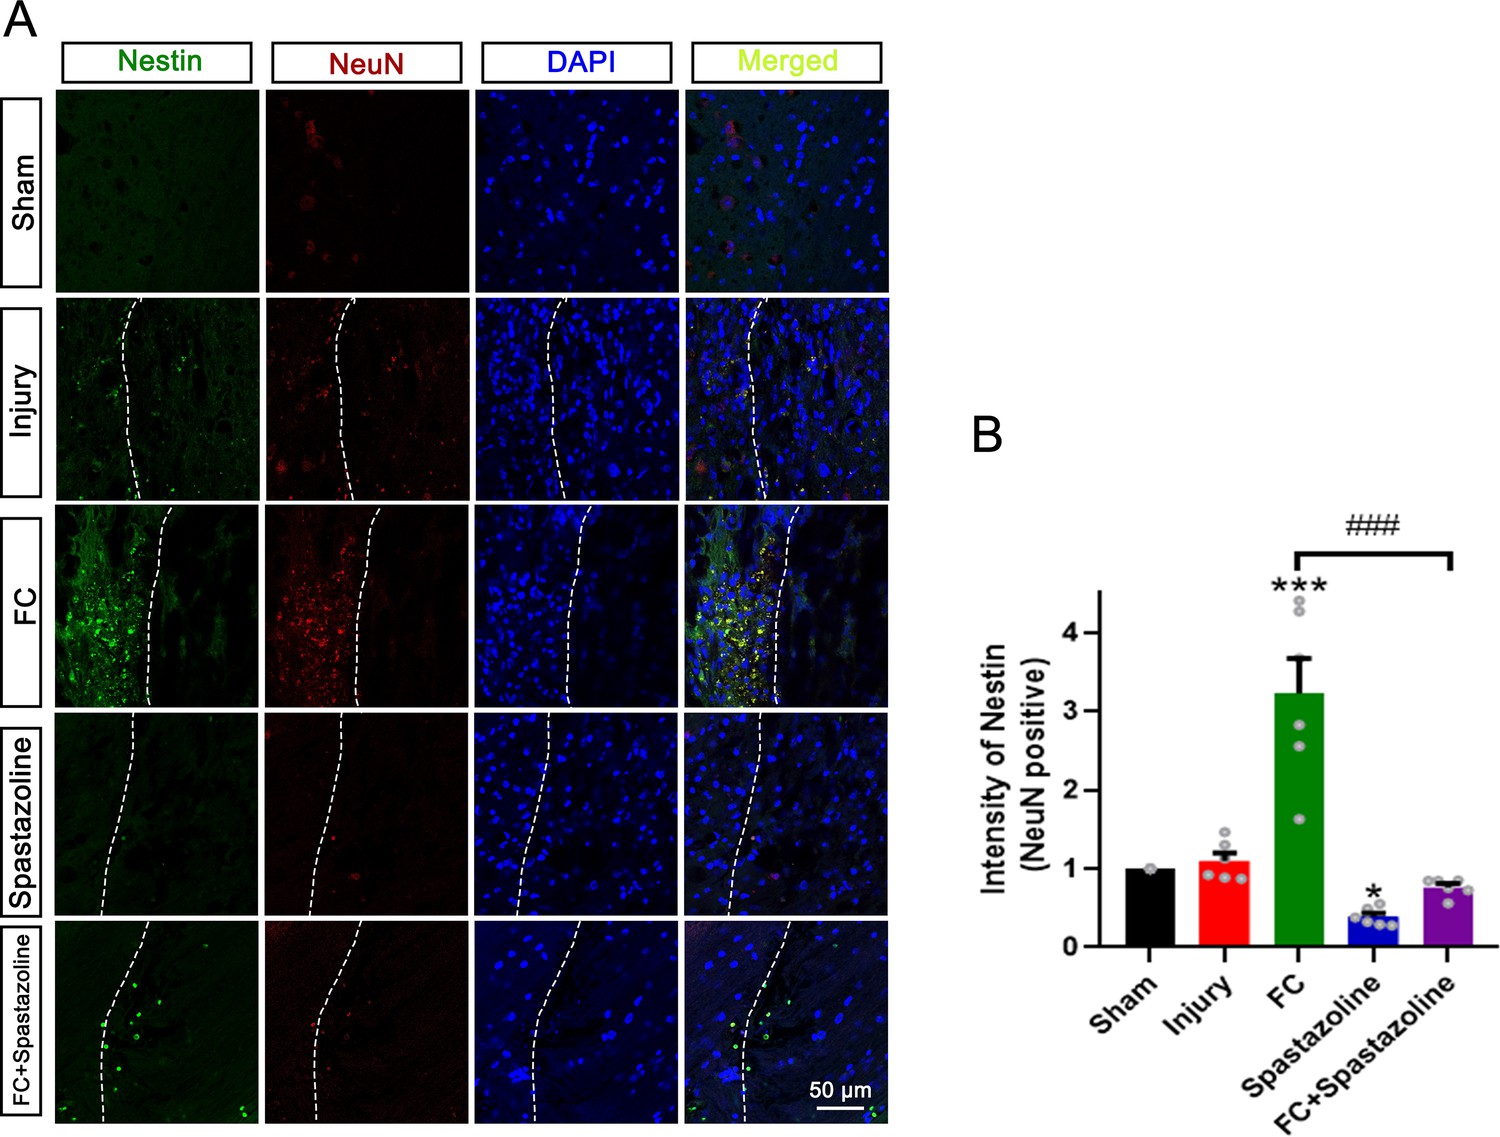
14-3-3 agonist Fusicoccin-A (FC-A) promotes the Nestin expression which was NeuN-positive.
(A) Sagittal view of Nestin (green) and NeuN (red) immunofluorescence in the white manner of the lesion site after SCI. Scale bar: 50 μm. (B) Quantification of the ratio of Nestin to NeuN immunoreactive fluorescence intensity (0.5 mm caudal to the lesion site). Data were presented as mean ± SEM, n=5 animals per group.
Figure 7—figure supplement 2
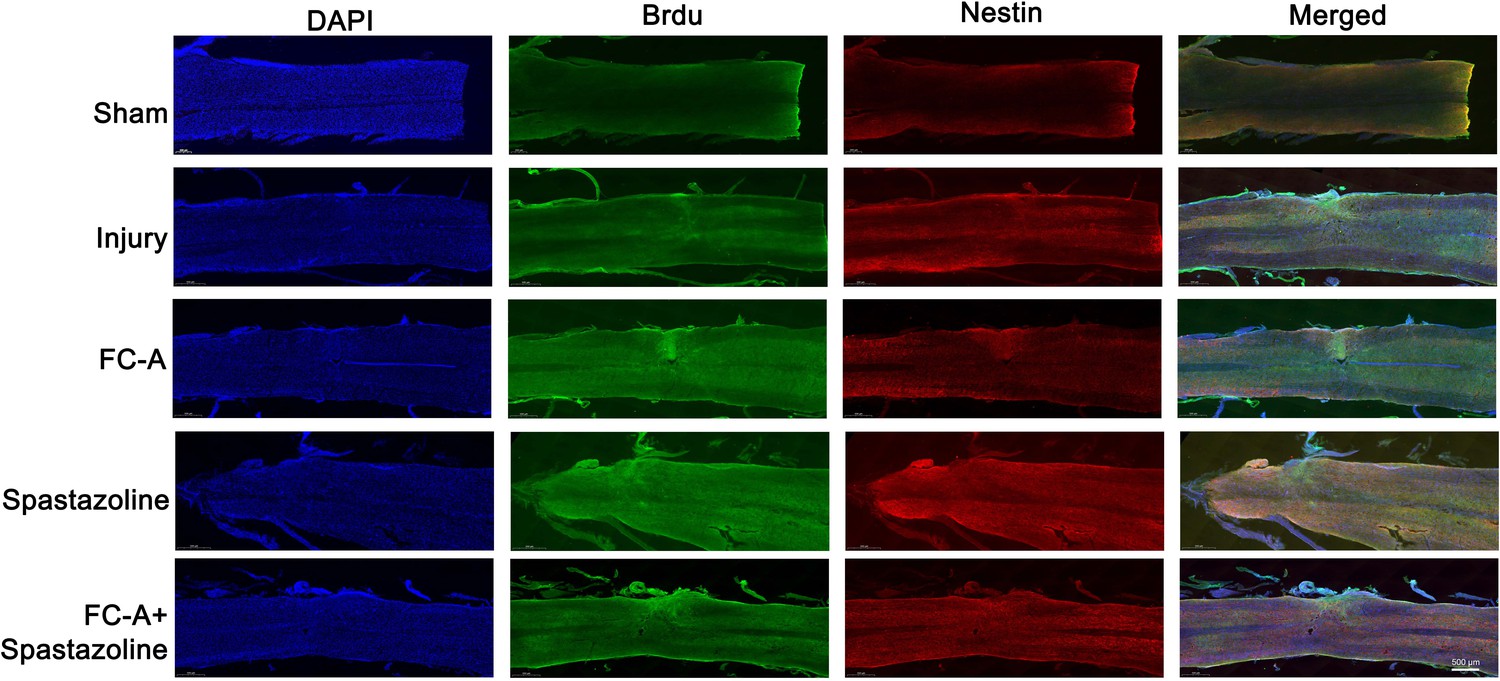
14-3-3 agonist Fusicoccin-A (FC-A) promotes the Nestin expression which is mainly co-localized with BrdU.
Sagittal view of BrdU (green) and Nestin (red) immunofluorescence in the white manner of the lesion site after SCI. Scale bar: 500 μm.
Figure 7—figure supplement 3

Footprint assay of mice after the intervention by Fusicoccin-A (FC-A) and spastazoline following spinal cord injury.
Example images depicting footprint analysis on 16 DPI (days post-injury). The measurement of the stride length and width were shown in red line. Scale bar: 2.5 cm.
Figure 7—figure supplement 4
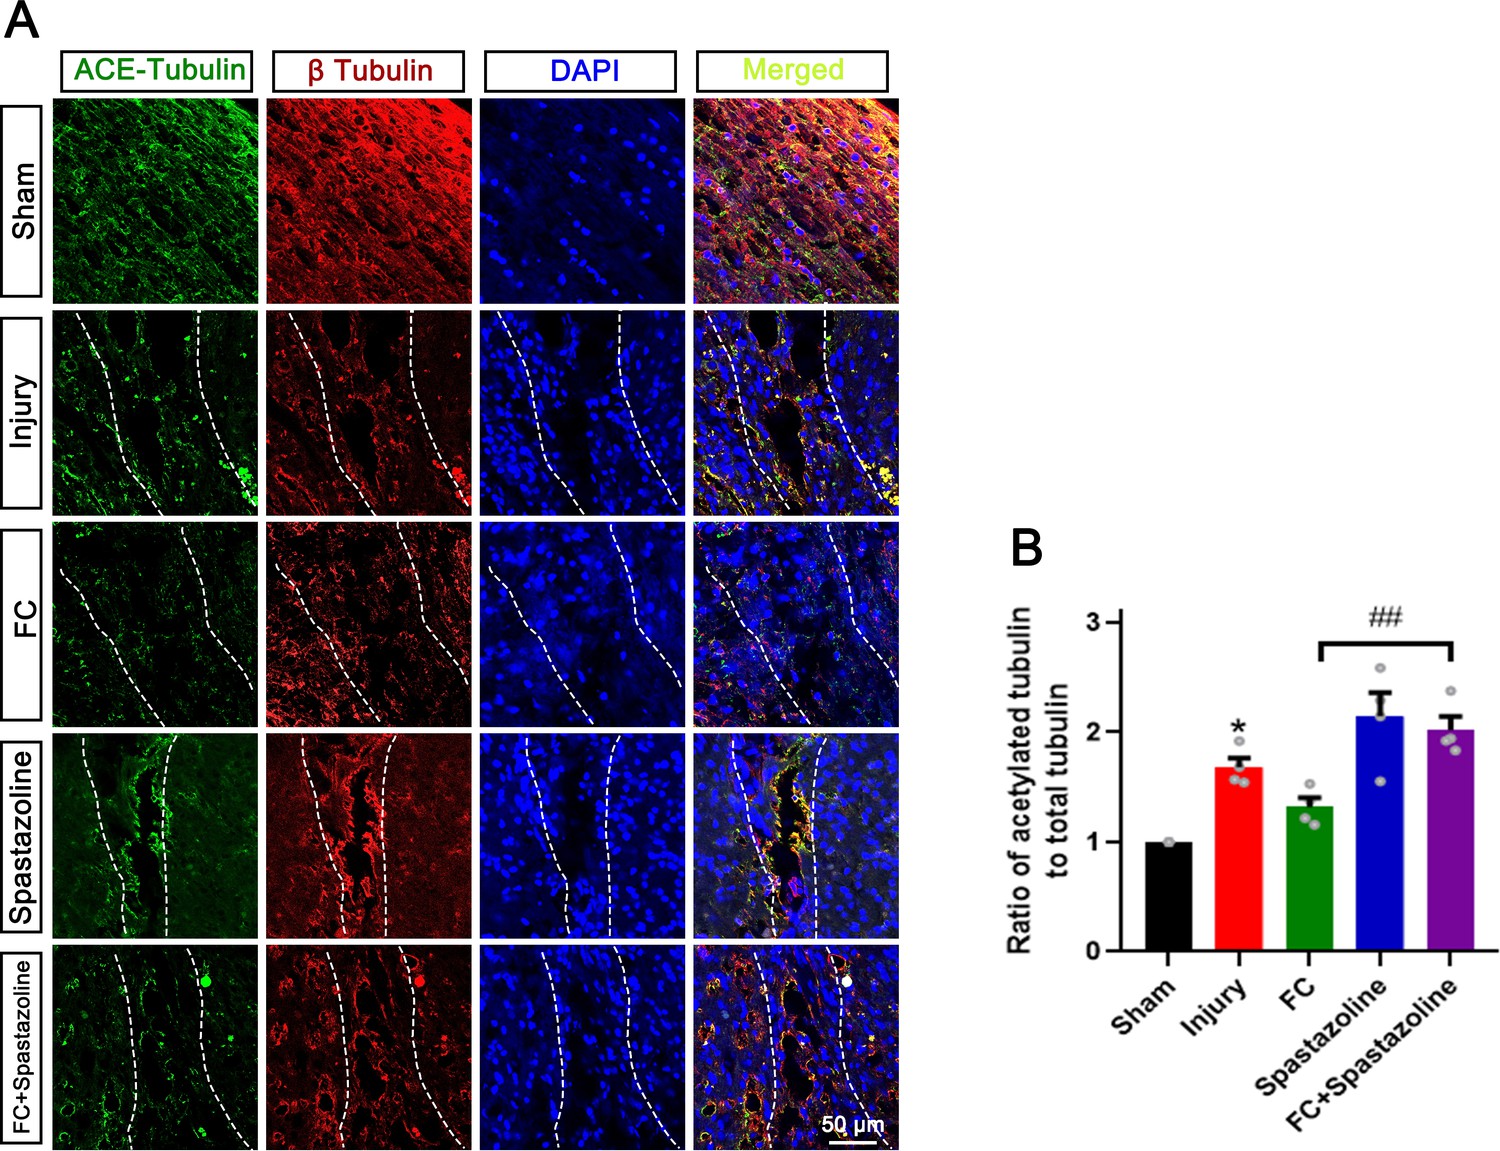
Microtubule stability of in the lesion site of mice in a T10 lateral hemisection spinal cord injury model after relative drug administration.
(A) Sagittal view of acetylated tubulin (green) and β-tubulin (red) immunofluorescence in the white manner of the lesion site after SCI. Scale bar: 50 μm. (B) Quantification of the ratio of acetylated tubulin to β-tubulin immunoreactive fluorescence intensity (0.5 mm caudal to the lesion site). Data were presented as mean ± SEM, n=5 animals per group.
Additional files
Download links
A two-part list of links to download the article, or parts of the article, in various formats.
Downloads (link to download the article as PDF)
Open citations (links to open the citations from this article in various online reference manager services)
Cite this article (links to download the citations from this article in formats compatible with various reference manager tools)
14-3-3 protein augments the protein stability of phosphorylated spastin and promotes the recovery of spinal cord injury through its agonist intervention
eLife 12:RP90184.
https://doi.org/10.7554/eLife.90184.4


