Heparan sulfate promotes TRAIL-induced tumor cell apoptosis
- Department of Oral Biology, School of Dental Medicine, University at Buffalo, The State University of New York, United States
- Division of Chemical Biology and Medicinal Chemistry, Eshelman School of Pharmacy, University of North Carolina, United States
- Macromolecular Structure Group, Epigenetics and Stem Cell Biology Laboratory, National Institute of Environmental Health Sciences, National Institutes of Health, United States
- Genome Integrity and Structural Biology Laboratory, National Institute of Environmental Health Sciences, National Institutes of Health, United States
Figures
Figure 1
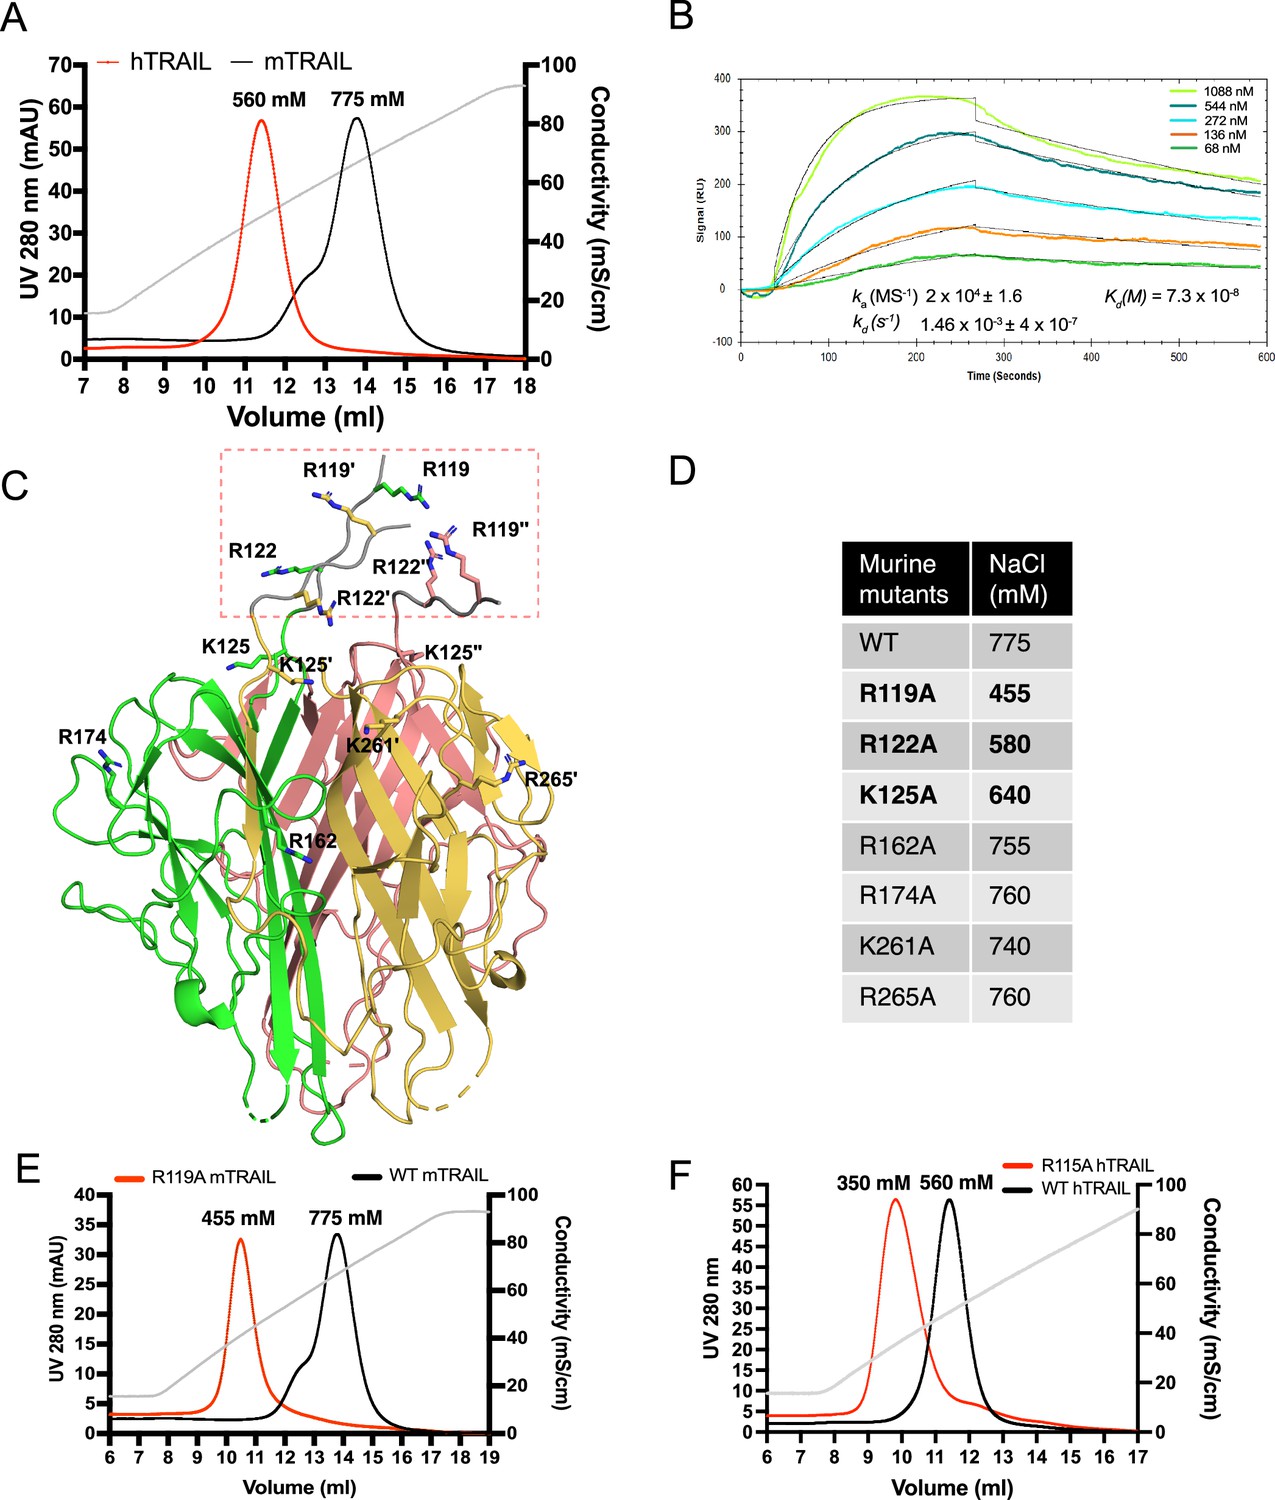
TNF-related apoptosis-inducing ligand (TRAIL) is a heparan sulfate (HS) binding protein and binding involves three N-terminal basic residues.
(A) Binding of murine TRAIL (mTRAIL) and human TRAIL (hTRAIL) to heparin-Sepharose column. The gray line represents the salt gradient (in conductivity mS/cm, from 150 mM to 1 M). (B) Surface plasmon resonance (SPR) analysis of binding between hTRAIL and HS GlcNS6S- GlcA-GlcNS6S-(IdoA2S-GlcNS6S)4-GlcA dodecamer oligosaccharide. (C) Residues potentially involved in HS- binding. Crystal structure of mTRAIL homotrimer is shown in the cartoon. The three monomers are displayed in green, salmon, and gold, respectively. Because residues 118–123 were disordered in our mTRAIL structure, these residues (118PRGGRP123, backbone shown in gray random coils, enclosed in the red dashed rectangle) were manually modeled onto the last visible N-terminal residue (Q124) of the crystal structure of mTRAIL to allow displaying R119 and R122. (D) Salt elution position of wild-type (WT) or mutants mTRAIL on HiTrap heparin- Sepharose column. (E) Chromatogram of WT and R119A mTRAIL binding to heparin column. (F) Chromatogram of WT and R115A hTRAIL binding to heparin column.
Figure 2
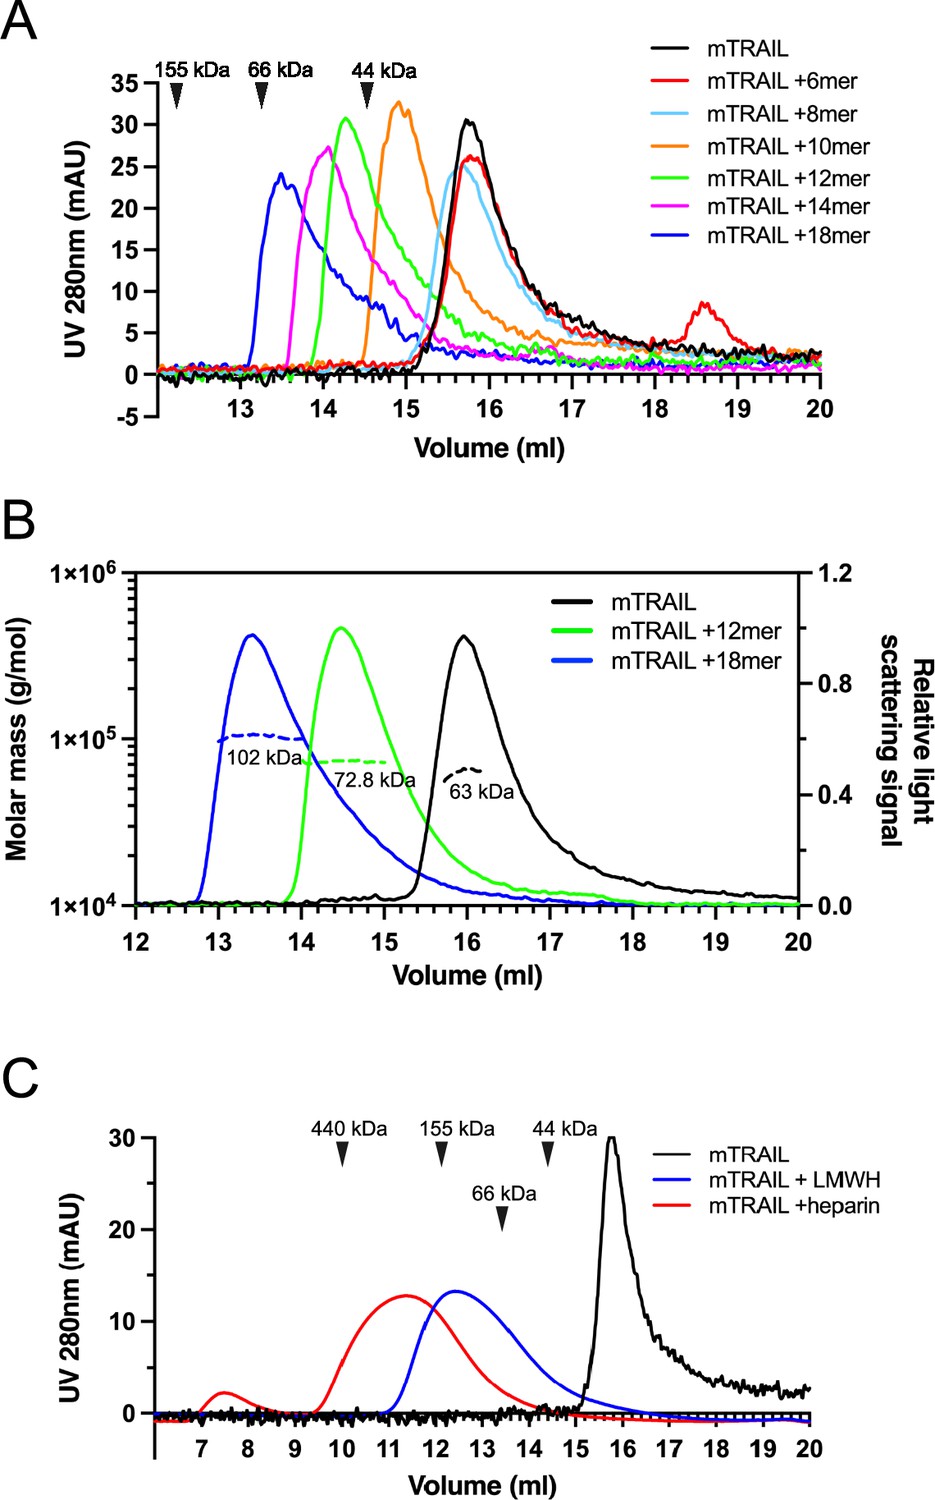
Heparan sulfate (HS) induces TNF-related apoptosis-inducing ligand (TRAIL) to form higher-order oligomers in a length-dependent manner.
(A) Size exclusion chromatography (SEC) analysis of murine TRAIL (mTRAIL) in complex with HS oligosaccharides of different sizes (6mer, 8mer, 10mer, 12mer, 14mer, and 18mer) on Superdex200 Increase column. Elution position of the molecular weight standards (IgG, 155 kDa; BSA, 66 kDa, and ovalbumin, 44 kDa) are indicated with black triangles. (B) MW determination of TRAIL, TRAIL/12mer complex, and TRAIL/18mer complex by SEC-MALS. The MW data was plotted as dotted lines (left Y-axis) and the relative light scatter signals were plotted as solid lines (right Y-axis) (C) SEC analysis of mTRAIL in complex with low molecular weight heparin (LMWH) and full-length heparin.
Figure 3
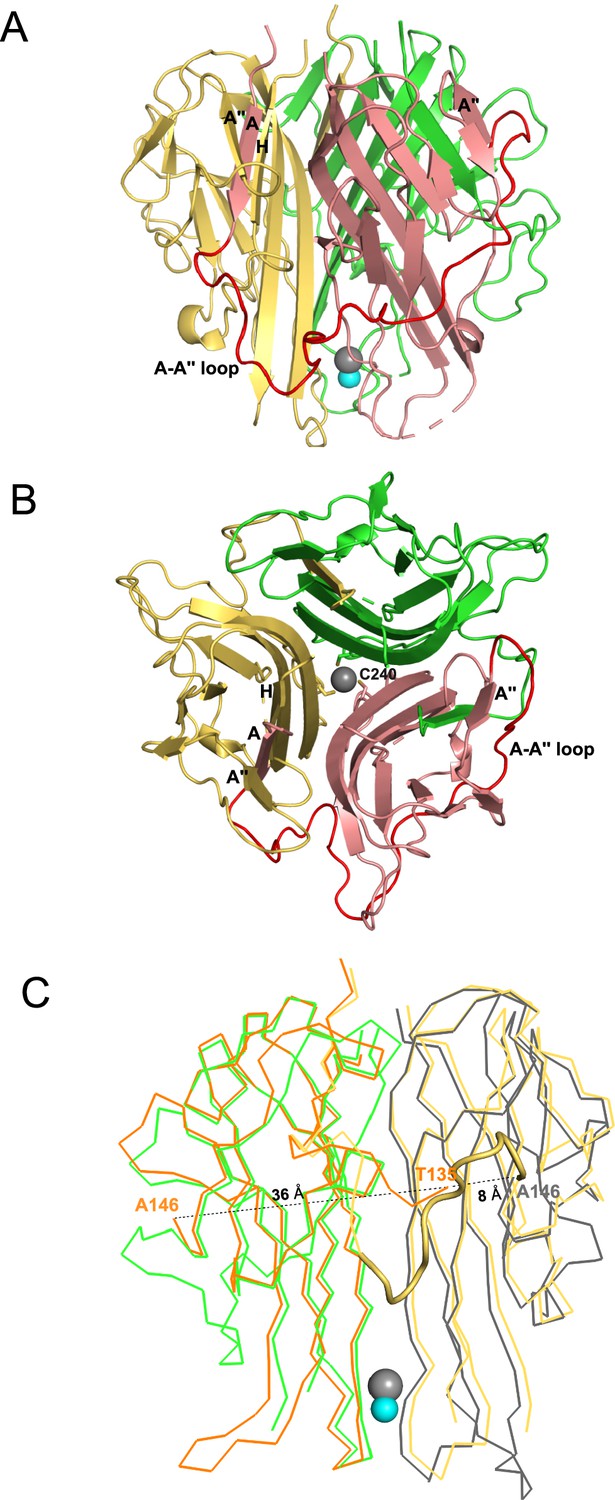
Crystal structural murine TRAIL (mTRAIL).
(A) mTRAIL is observed as a strand-swapped homotrimer. Note the N-terminus strand A of one monomer (salmon) is inserted into the β-sheet of the neighboring monomer (yellow). Beta strands A and A" of the salmon monomer, and the strands A" and H of the yellow monomers are labeled. The loop connecting strands A and A” (The A-A" loop) of the salmon monomer is shown in red. Zinc and chloride are shown in cyan and gray spheres, respectively. (B) Looking down from the threefold axis of domain-swapped mTRAIL homotrimer. Side chains of Cys240, which are responsible for chelating Zn2+, are shown in sticks. (C) Overlay of the crystal structure of human TRAIL (hTRAIL) (1DU3) and mTRAIL. To facilitate visualization, only two monomers of hTRAIL (orange and gray) and two monomers of mTRAIL (green and yellow) are shown in the ribbon representation. In the hTRAIL structure, the fragment between T135 and A146 is missing, whereas the homologous fragment in mTRAIL structure is visible (yellow cartoon representation). Note the T135 of the orange human monomer is 36 Å away from A146, where it is only 8 Å from A146 of the neighboring gray human monomer.
Figure 4
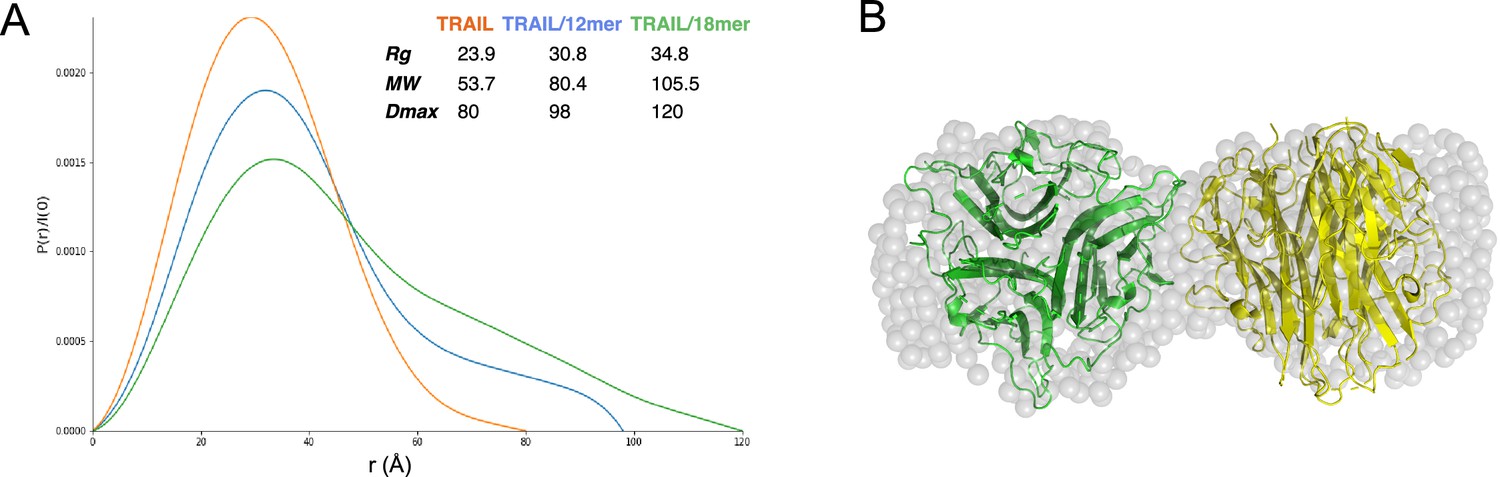
Structural analysis of TNF-related apoptosis-inducing ligand (TRAIL)/oligosaccharide complexes by small angle X-ray scattering (SAXS).
(A) SAXS analysis of size exclusion chromatography (SEC)-purified TRAIL (red), TRAIL/12merNS2S6S complex (blue), and TRAIL/18merNS2S6S complex (green). Shown are overlays of P(r) function plots, along with Rg, Dmax, and MW values were determined from SAXS data. (B) GASBOR-generated ab initio model of TRAIL/18mer complex (with a χ2=0.93) is shown in transparent gray beads. The crystallographic hexamer is manually superimposed onto the GASBOR model with one trimer green and the other yellow.
-
Figure 4—source data 1
Small angle X-ray scattering (SAXS) raw data file for apo TNF-related apoptosis-inducing ligand (TRAIL), TRAIL/12merNS2S6S complex, and TRAIL/18merNS2S6S complex.
- https://cdn.elifesciences.org/articles/90192/elife-90192-fig4-data1-v1.zip
Figure 5

Heparan sulfate (HS) contributes to cell surface binding of TNF-related apoptosis-inducing ligand (TRAIL).
Binding of mouse TRAIL (100 ng/ml and 300 ng/ml) to 4T1 breast cancer cells (A) and human TRAIL to MDA-MB-453 breast cancer cells (B), with or without heparin lyase III (HL-III) pretreatment, were determined by a FACS-based binding assay. The bound TRAIL were detected by staining with a goat anti-TRAIL antibody, followed by anti-goat-IgG Alexa-647. The shaded histogram is from cells stained only with primary and secondary antibodies. (C) Binding of wild-type (WT) and R115A hTRAIL (300 ng/ml) to MDA-MB-453 cells, with or without HL-III pretreatment were determined by a FACS-based binding assay.
Figure 6
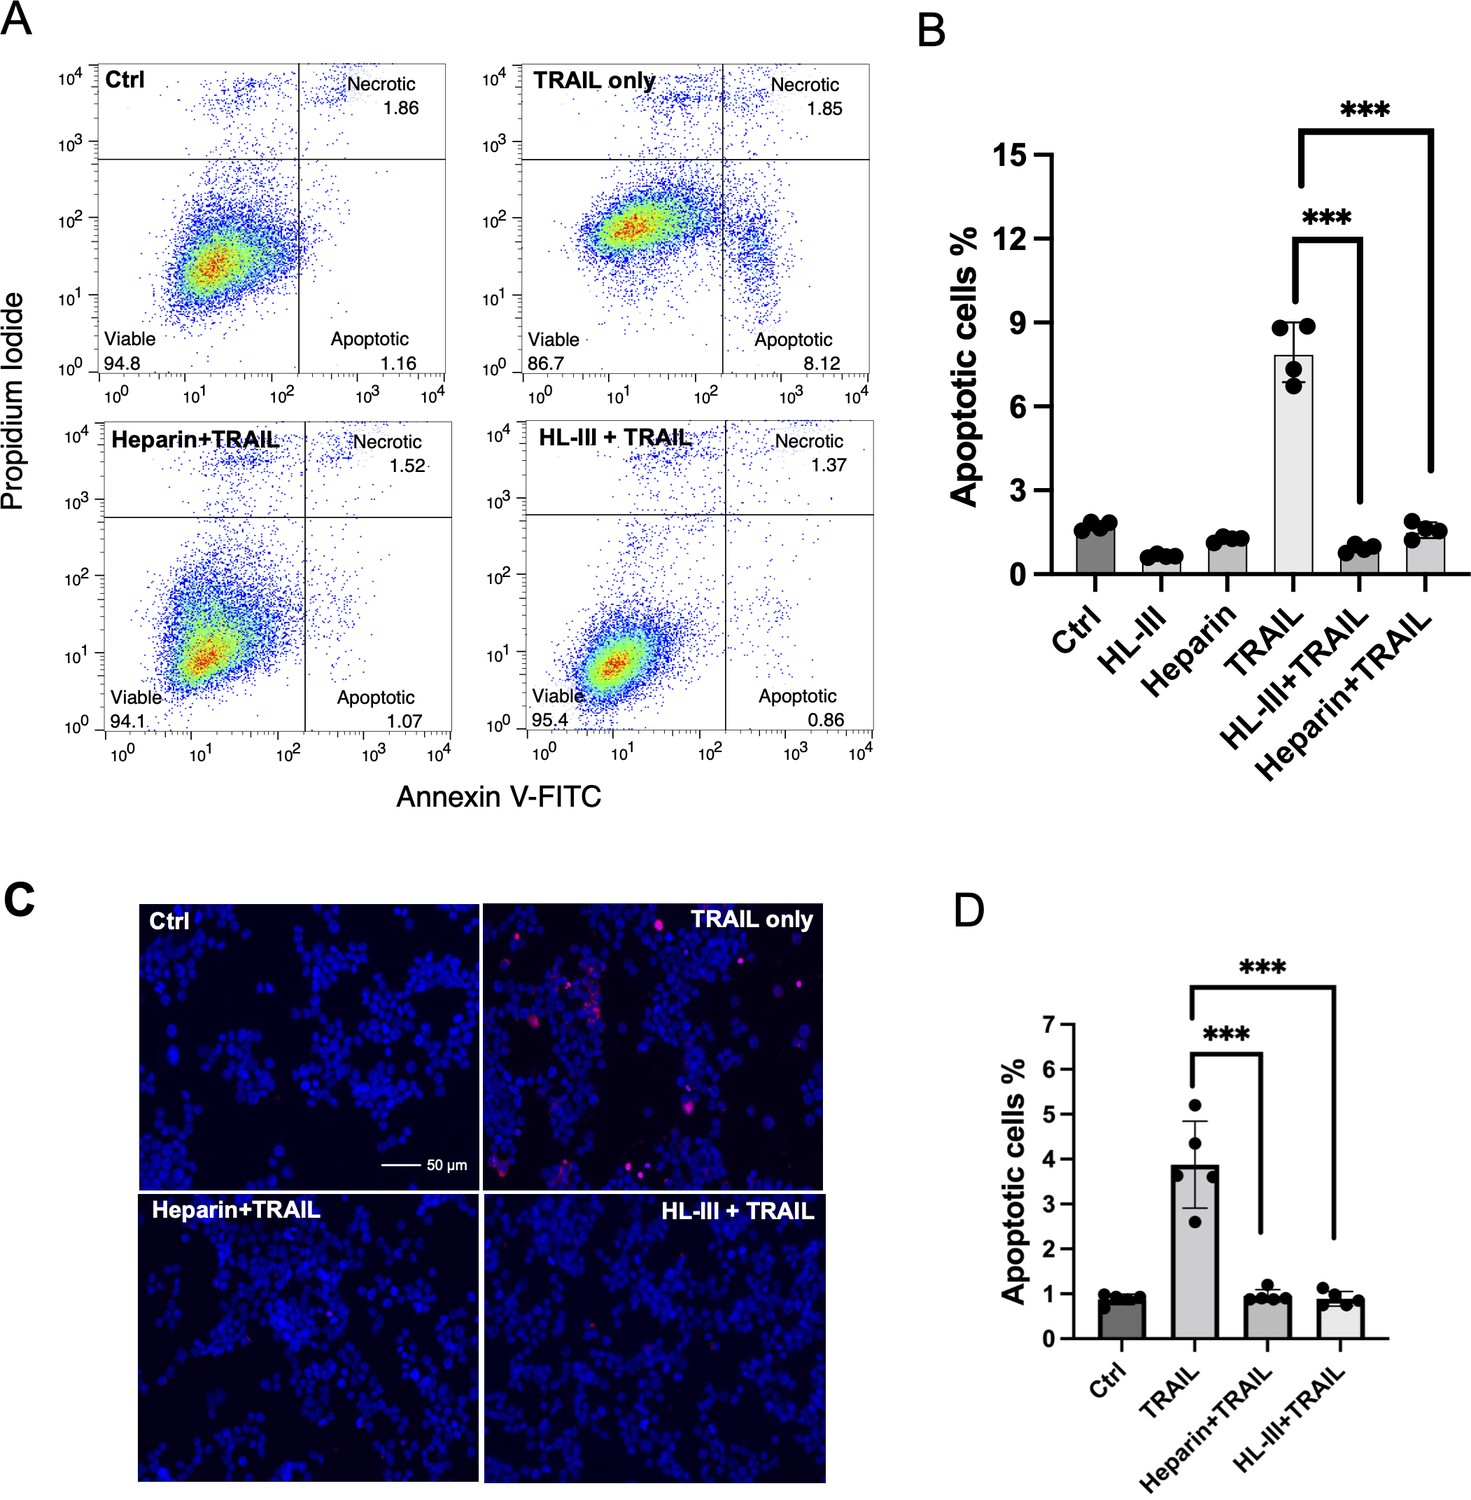
Cell surface heparan sulfate (HS) promotes TNF-related apoptosis-inducing ligand (TRAIL)-induced breast cancer cell apoptosis.
(A) The representative Annexin V-FITC apoptotic assay plots and gating method of MDA-MB-453 cells treated with human TRAIL (hTRAIL) (30 ng/ml), in the presence or absence of heparin lyase III (HL-III) and exogenous heparin. Analysis was performed after cells were treated with hTRAIL for 6 hr. (B) Statistical analysis of TRAIL-induced early apoptotic cell population with various treatments. *** represents p<0.0001 by Student’s t-test. Data are representative of at least three separate assays. (C) MDA-MB-453 cells were treated with TRAIL (30 ng/ml) in the presence or absence of HL-III and exogenous heparin for 6 hr. TUNEL staining was performed to visualize apoptosis. Apoptotic cells were stained red. Nuclei were stained blue with DAPI. Scale bar: 50 μm. (D) Statistical analysis of TUNEL staining.
-
Figure 6—source data 1
Excel file with raw data used to generate Figure 6B.
- https://cdn.elifesciences.org/articles/90192/elife-90192-fig6-data1-v1.xlsx
-
Figure 6—source data 2
Excel file with raw data used to generate Figure 6D.
- https://cdn.elifesciences.org/articles/90192/elife-90192-fig6-data2-v1.xlsx
Figure 7

Cell surface heparan sulfate (HS) promotes TRAIL-induced myeloma cell apoptosis.
(A) TNF-related apoptosis-inducing ligand (TRAIL)-induced apoptosis (at 1, 3, 10, 30 ng/ml) was tested using RPMI-8226 myeloma cells by Annexin V-FITC assay. Cells were analyzed after incubation with human TRAIL (hTRAIL) for 3 hr. (B) hTRAIL (1 or 3 ng/ml)- induced RPMI-8226 cell apoptosis with or without heparin lyase III (HL-III) treatment (5 mU/ml) were determined by Annexin V-FITC assay. (C) Representative scatter plots and gating method of Annexin V-FITC assay. Cells are treated with 1 ng/ml TRAIL in the presence of absence of HL-III (5 mU/ml) and heparin (1 μg/ml). (D) The effects of heparin and HS oligosaccharides 12mer towards TRAIL-induced RPMI8226 cell apoptosis were determined by Annexin V-FITC assay. (E) WT hTRAIL and R115A hTRAIL-induced RPMI8226 cell apoptosis were determined by Annexin V-FITC assay. Error bars represent S.D. ** represents p<0.01, *** represents p<0.0001 by Student’s t-test. Data are representative of at least three separate assays.
-
Figure 7—source data 1
Excel file with raw data used to generate Figure 7A.
- https://cdn.elifesciences.org/articles/90192/elife-90192-fig7-data1-v1.xlsx
-
Figure 7—source data 2
Excel file with raw data used to generate Figure 7B.
- https://cdn.elifesciences.org/articles/90192/elife-90192-fig7-data2-v1.xlsx
-
Figure 7—source data 3
Excel file with raw data used to generate Figure 7D.
- https://cdn.elifesciences.org/articles/90192/elife-90192-fig7-data3-v1.xlsx
-
Figure 7—source data 4
Excel file with raw data used to generate Figure 7E.
- https://cdn.elifesciences.org/articles/90192/elife-90192-fig7-data4-v1.xlsx
Figure 8
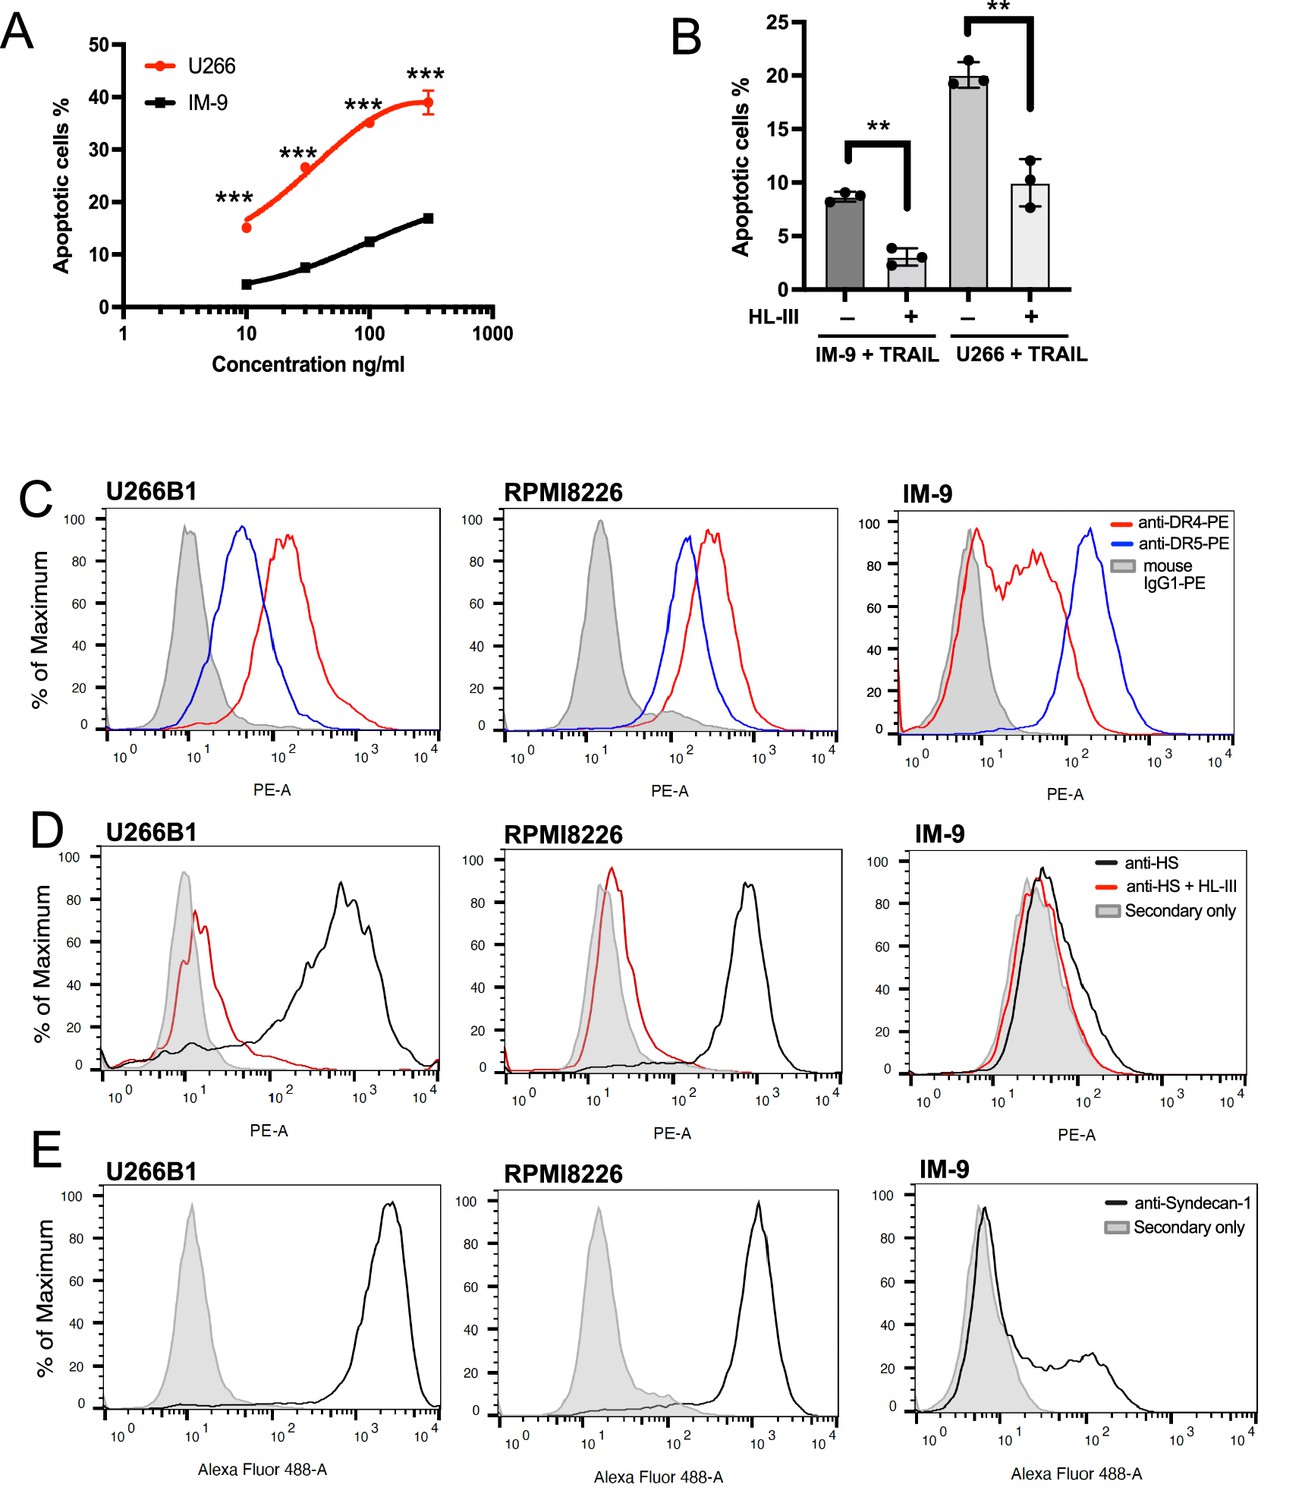
Cell surface heparan sulfate (HS) level contributes to TNF-related apoptosis-inducing ligand (TRAIL) sensitivity towards myeloma cells.
(A) The sensitivity of U266 and IM-9 cells to TRAIL (10, 30, 100, 300 ng/ml) was determined by Annexin V-FITC assay. (B) TRAIL (100 ng/ml)-induced apoptosis of IM-9 and U266 cells, with or without heparin lyase III (HL-III) pretreatment, were determined by Annexin V-FITC assay. (C) Expression of TRAIL receptor DR4 and DR5 on U266B1, RPMI-8226, and IM-9 cells were determined with PE conjugated mAbs against DR4 and DR5 using FACS. The shaded histograms are from cells stained with mouse IgG1-PE conjugate. (D) Expressions of cell surface HS on untreated cells or cells pretreated with HL-III were determined by a human anti-HS mAb, followed by an anti-human-IgG Alexa-594 secondary antibody. The shaded histogram is from cells stained with secondary antibody only. (E) Expression of cell surface syndecan-1 was determined by a mouse anti- syndecan-1 mAb followed by an anti-mouse-IgG Alexa-488 secondary antibody. The shaded histogram is from cells stained with secondary antibody only. Error bars represent S.D. ** represents p<0.01 and *** represents p<0.0001 by Student’s t-test. Data are representative of at least three separate assays.
-
Figure 8—source data 1
Excel file with raw data used to generate Figure 8A.
- https://cdn.elifesciences.org/articles/90192/elife-90192-fig8-data1-v1.xlsx
-
Figure 8—source data 2
Excel file with raw data used to generate Figure 8B.
- https://cdn.elifesciences.org/articles/90192/elife-90192-fig8-data2-v1.xlsx
Figure 9

Heparan sulfate (HS) forms a complex with TNF-related apoptosis-inducing ligand (TRAIL) and death receptor 5 (DR5) and regulates TRAIL-induced DR5 internalization.
(A) While DR5 does not bind heparin by itself (left half of the gel), DR5-TRAIL complex can bind heparin (right half of the gel), indicating DR5-TRAIL-heparin can form a ternary complex through TRAIL. Representative of three experiments with identical results (B) DR5 and HS bind to different surfaces on TRAIL. Crystal structure of hTRAIL-DR5 complex (IDU3). Human TRAIL (hTRAIL) is shown in the cartoon and the three monomers are displayed in green, salmon and gold, respectively. The three DR5 molecules are shown in gray cartoon. Because residues 114–119 of hTRAIL are disordered in this structure, these residues (114VRERGP119, backbone shown in gray random coils) were manually modeled onto the last visible N-terminal residue (Q120) of the hTRAIL. Sidechains responsible for HS binding (from R115, R117, and R121) are shown in sticks. (C–E) TRAIL-dependent internalization of DR4 and DR5 was determined by a FACS-based assay. Cell surface levels of TRAIL receptor DR5(C) and DR4 (D) were determined before TRAIL stimulation, and 30 min and 1 hr after TRAIL stimulation. The shaded histograms are from cells stained mouse IgG1-PE conjugate. (E) Plot of time-dependent internalization of cell surface DR5, with or without HL-III treatment. n=3. *** represents p<0.0001. Data is representative of three experiments with similar results.
-
Figure 9—source data 1
Original silver stain gel picture for Figure 9A.
- https://cdn.elifesciences.org/articles/90192/elife-90192-fig9-data1-v1.zip
-
Figure 9—source data 2
Original silver stain gel picture for Figure 9A with relevant lanes labeled.
- https://cdn.elifesciences.org/articles/90192/elife-90192-fig9-data2-v1.zip
-
Figure 9—source data 3
Excel file with raw data used to generate Figure 9E.
- https://cdn.elifesciences.org/articles/90192/elife-90192-fig9-data3-v1.xlsx
Tables
Table 1
List of heparan sulfate (HS) oligosaccharides used in the study.
| Oligosaccharides | Structure |
|---|---|
| 6mer | GlcNS6S-GlcA-GlcNS6S-IdoA2S-GlcNS6S-GlcA-pNP* |
| 8mer | GlcNS6S-GlcA-GlcNS6S-(IdoA2S-GlcNS6S)2-GlcA-pNp |
| 10mer | GlcNS6S-GlcA-GlcNS6S-(IdoA2S-GlcNS6S)3-GlcA-pNP |
| 12mer | GlcNS6S-GlcA-GlcNS6S-(IdoA2S-GlcNS6S)4-GlcA-pNP |
| 14mer | GlcNS6S-GlcA-GlcNS6S-(IdoA2S-GlcNS6S)5-GlcA-pNP |
| 18mer | GlcNS6S-GlcA-GlcNS6S-(IdoA2S-GlcNS6S)7-GlcA-pNP |
-
*
pNP = p-nitrophenol. pNP has an UV absorbance peak at 310 nm, which also has significant absorbance at UV 280 nm.
Table 2
Data collection and refinement statistics.
| mTRAIL*,† | |
|---|---|
| PDB ID code | 8SLR |
| Data collection | |
| Space group | P4132 |
| Cell dimensions | |
| a, b, c (Å) | 147.35, 147.35, 147.35 |
| α, β, γ (°) | 90, 90, 90 |
| Resolution (Å) | 50.00–2.40 (2.44-2.40)‡ |
| Rsym (%) | 11.0 (93.0) |
| I / σI | 4.6 (1.8) |
| Completeness (%) | 99.9 (100.0) |
| Redundancy | 9.4 (9.9) |
| Refinement | |
| Resolution (Å) | 40.50 (2.40) |
| No. reflections | 21,811 |
| Rwork / Rfree (%) | 15.48/18.06 |
| No. atoms | |
| Protein | 1314 |
| Water | 105 |
| Other | 15 |
| B-factors | |
| Protein | 46.57 |
| Water | 51.61 |
| Other | 86.98 |
| R.m.s. deviations | |
| Bond lengths (Å) | 0.006 |
| Bond angles (°) | 0.817 |
| Ramachandran Plot | |
| Allowed (%) | 3.31 |
| Favored (%) | 96.7 |
-
*
A single crystal was used to collect each dataset.
-
†
These crystals were collected on the Southeast Regional Collaborative Access Team (SER-CAT) 22-ID beamline at the Advanced Photon Source at Argonne National Laboratory.
-
‡
Values in parentheses are for the highest-resolution shell.
Table 3
Compositional analysis of heparan sulfate (HS) expressed by myeloma cell lines.
| Disaccharides | ng/106 cells | ||
|---|---|---|---|
| IM-9 | RPMI 8226 | U266 | |
| △UA2S-GlcNS6S | 1.53 | 4.16 | 1.34 |
| △UA-GlcNS6S | 0.26 | 5.12 | 0.78 |
| △UA2S-GlcNS | 1.38 | 2.43 | 3.30 |
| △UA-GlcNS | 2.66 | 14.33 | 9.74 |
| △UA2S-GlcNAc6S | 0.07 | 0.16 | 0.09 |
| △UA-GlcNAc6S | 0.26 | 7.57 | 0.63 |
| △UA2S-GlcNAc | 0.59 | 0.76 | 0.86 |
| △UA-GlcNAc | 19.38 | 77.95 | 54.70 |
| Total amount of HS | 26.13 | 112.48 | 71.44 |
| Disaccharides with ≥2 sulfations | 3.24 | 11.87 | 5.51 |
Key resources table
| Reagent type (species) or resource | Designation | Source or reference | Identifiers | Additional information |
|---|---|---|---|---|
| Strain, strain background (Escherichia coli) | Origami-B (DE3) | Millipore Sigma | Cat#: 70837 | |
| Cell line (Homo-sapiens) | MDA-MB-453 | ATCC | Cat#: HTB-131 | Identity authenticated by SRT profiling, negative for mycoplasma |
| Cell line (Homo-sapiens) | RPMI-8226 | ATCC | Cat#: CCL-155 | Identity authenticated by SRT profiling, negative for mycoplasma |
| Cell line (Homo-sapiens) | U266B1 | ATCC | Cat#: TIB-196 | Identity authenticated by SRT profiling, negative for mycoplasma |
| Cell line (Homo-sapiens) | IM-9 | ATCC | Cat#: CCL-159 | Identity authenticated by SRT profiling, negative for mycoplasma |
| Antibody | anti-mouse TRAIL (goat polyclonal) | R&D systems | Cat#: AF1121 | FC: 1 µg/ml |
| Antibody | anti-human TRAIL (goat polyclonal) | R&D systems | Cat#: AF375 | FC: 1 µg/ml |
| Antibody | Anti-human DR4 (mouse monoclonal) | Biolegend | Cat#: B376455 | FC: 1 µg/ml |
| Antibody | Anti-human DR5 (mouse monoclonal) | Biolegend | Cat#: B347680 | FC: 1 µg/ml |
| Antibody | Anti-HS human monoclonal (HS-20) | PMID:27185050 | Gift from Dr. Ho (NCI) | FC: 2 µg/ml |
| Antibody | Anti-human syndecan-1 (mouse monoclonal) | Biolegend | Cat#: B280312 | FC: 10 µg/ml |
| Recombinant DNA reagent | pET21b (plasmid) | Millipore Sigma | Cat#: 69741 | |
| Recombinant protein | Murine TRAIL (E. coli) | Produced in the lab | ||
| Recombinant protein | Human TRAIL (E. coli) | Produced in the lab | ||
| Recombinant protein | Human TRAIL (mammalian) | Biolegend | B294007 | |
| Recombinant protein | Mouse DR5-Fc fusion | R&D systems | 721-DR | |
| Commercial assay or kit | TUNEL staining kit | Thermofisher | Cat#: C10619 | |
| Commercial assay or kit | Annexin-FITC staining kit | R&D Systems | Cat#: 4830–250 K | |
| Software, algorithm | ImageJ (v1.50i) | PMID:22930834 | RRID:SCR_003070 | |
| Software, algorithm | Graphpad Prism 7 | GraphPad Software | RRID:SCR_002798 |
Additional files
Download links
A two-part list of links to download the article, or parts of the article, in various formats.
Downloads (link to download the article as PDF)
Open citations (links to open the citations from this article in various online reference manager services)
Cite this article (links to download the citations from this article in formats compatible with various reference manager tools)
Heparan sulfate promotes TRAIL-induced tumor cell apoptosis
eLife 12:RP90192.
https://doi.org/10.7554/eLife.90192.3


