Dynamic analysis of circulating tumor DNA to predict the prognosis and monitor the treatment response of patients with metastatic triple-negative breast cancer: A prospective study
- Department of Breast Medical Oncology, Shandong Cancer Hospital and Institute, Shandong First Medical University and Shandong Academy of Medical Sciences, China
- School of Medicine, Nankai University, China
- Department of Bioinformatics, Berry Oncology Corporation, China
- Department of Radiation Oncology, Shandong Cancer Hospital and Institute, Shandong First Medical University and Shandong Academy of Medical Sciences, China
Figures
Figure 1 with 1 supplement
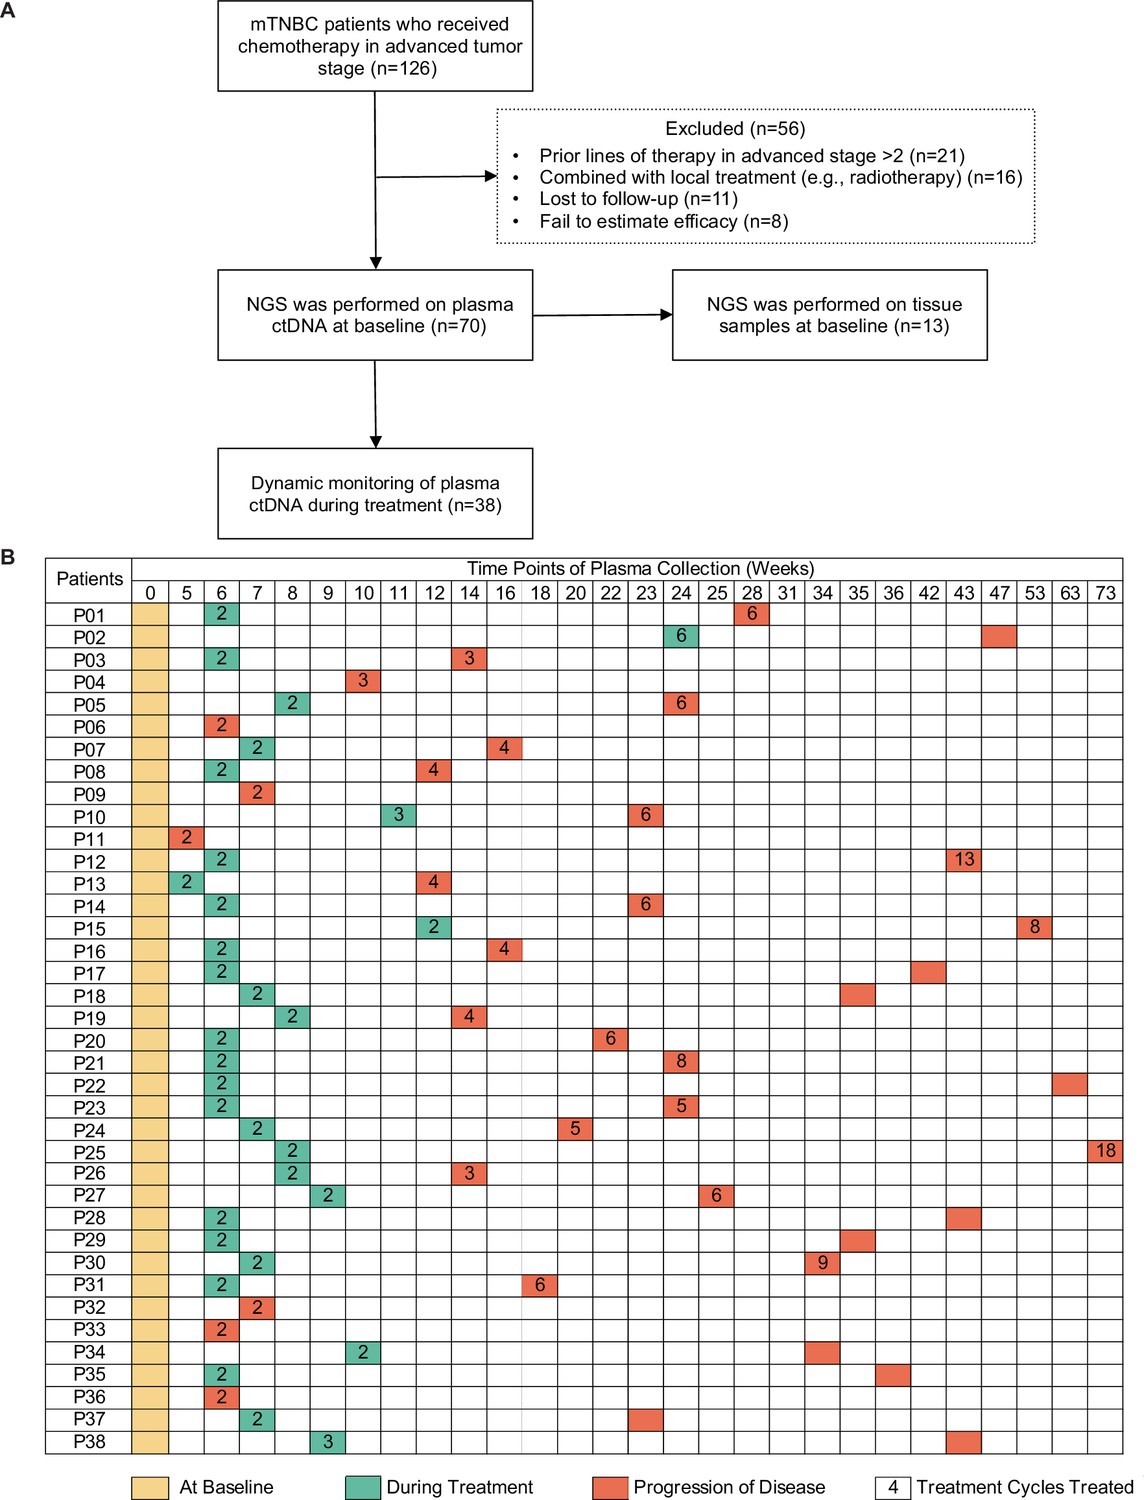
Study design and sample collection.
(A) Study flowchart. After excluding 56 patients, 70 patients with mTNBC were included in the final analysis. Baseline blood samples were collected from all patients (n=70), and paired tumor tissues were collected from 13 patients for NGS. (B) Blood-sample-derived ctDNA was dynamically monitored at baseline (yellow), during treatment (green), and at progression (orange) for 38 of the 70 patients. ctDNA, circulating tumor DNA; mTNBC, metastatic triple-negative breast cancer; NGS, next-generation sequencing.
Figure 1—figure supplement 1
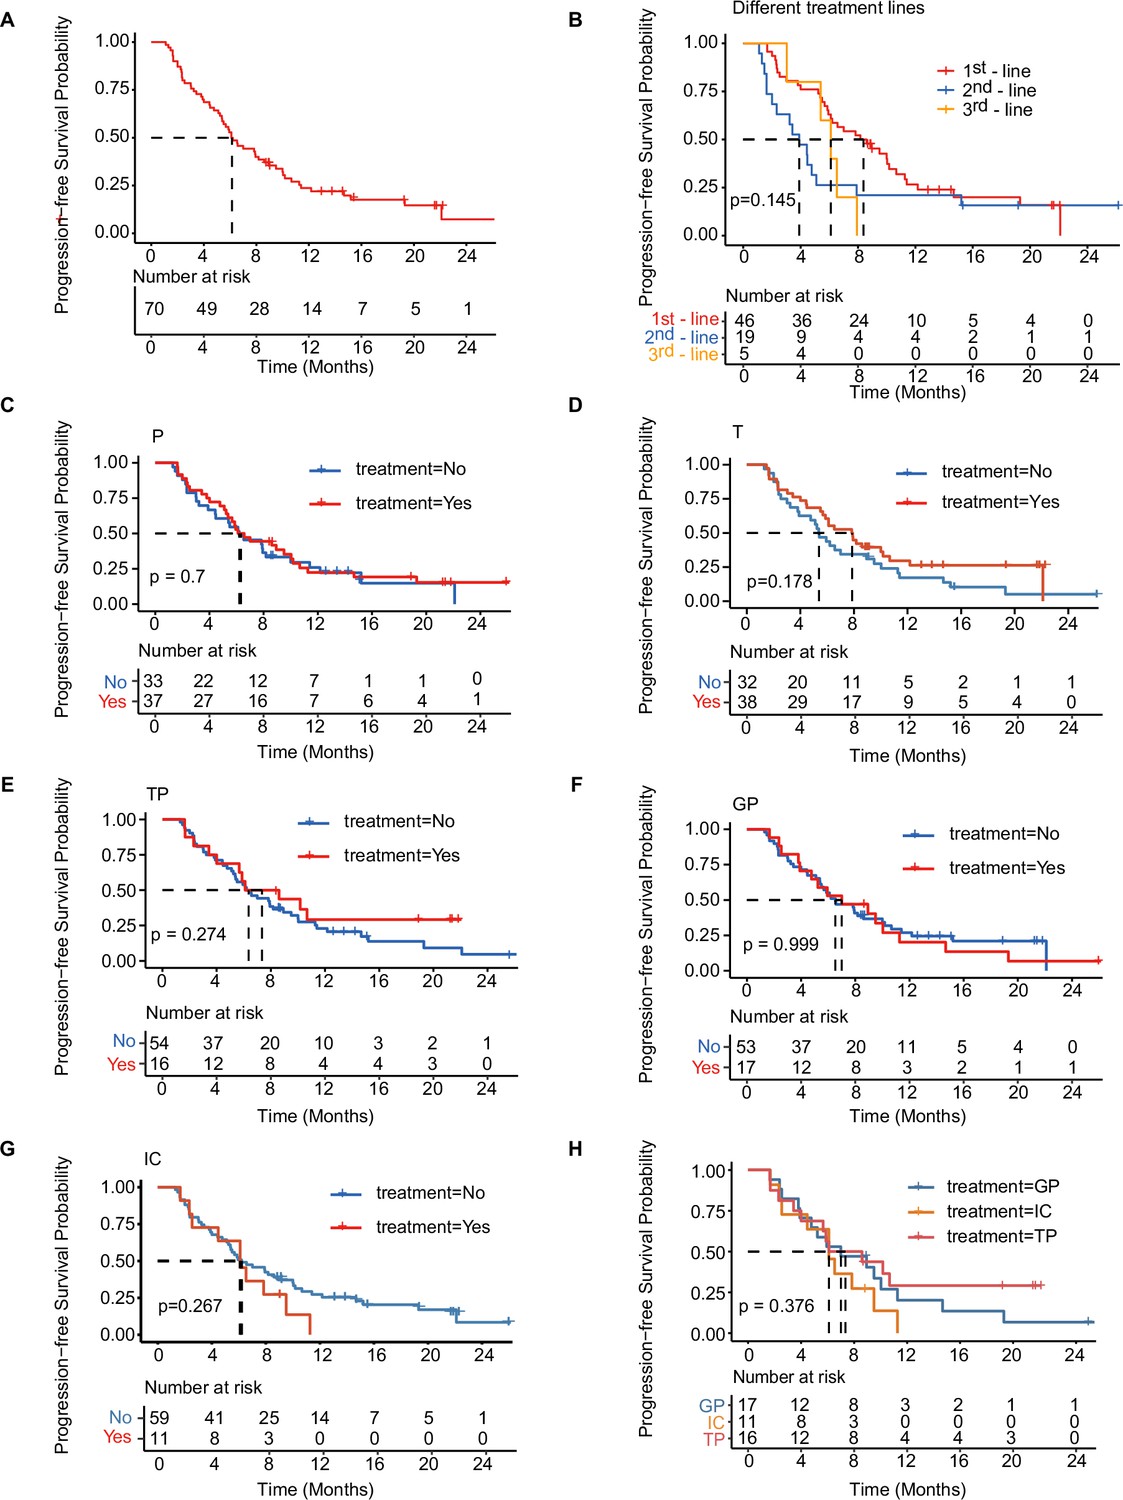
Kaplan-Meier analysis of PFS in total cohort and treatment-related subgroups of patients.
(A) Kaplan–Meier analysis of PFS in all patients with mTNBC. (B) Kaplan–Meier analysis of PFS in patients with different lines of treatment. (C–H) Kaplan–Meier analysis of PFS in patients treated with distinct treatment regimens. GP, gemcitabine- and platinum-based treatment; IC, immunotherapy plus chemotherapy; mTNBC, metastatic triple-negative breast cancer; P, platinum-based treatment; PFS, progression-free survival; T, taxane-based treatment; TP, taxane- and platinum-based treatment. A p-value <0.05 was used as a measure of statistical significance.
Figure 2 with 1 supplement

Mutation characteristics of patients with mTNBC.
(A) The landscape of ctDNA mutations in 70 patients with mTNBC before treatment initiation. The patients (n=70) were divided into four groups (PD, SD, PR, and CR) according to the best treatment response (from left to right). The top half of the figure shows SNVs with a mutation frequency ≥5%, and the bottom half shows CNVs with a mutation frequency ≥10%; the different colored rectangles represent different types of variation. (B) Concordance between the genomic alterations in the blood-derived ctDNA and the tissue-derived tDNA. The mutated genes detected in at least two samples are shown here. The concordance rate = shared mutated genes/(all genes × the number of comparisons)×100% = (1 – [ctDNA-specific and tissue-specific mutated genes]/[all genes × the number of comparisons])×100% = (1 – [37+37]/[457×13])×100% = 98.75%. CNVs, copy number variants; CR, complete response; ctDNA, circulating tumor DNA; tDNA, tumor DNA; mTNBC, metastatic triple-negative breast cancer; PD, progressive disease; PR, partial response; SD, stable disease; SNVs, single-nucleotide variants.
Figure 2—figure supplement 1

Comparison of mutation frequency between ctDNA and tissue.
The mutation frequency in ctDNA was significantly lower than in tissues (p<0.001). ctDNA, circulating tumor DNA. A p-value <0.05 was used as a measure of statistical significance.
Figure 3 with 1 supplement

Prognostic relevance of mutations in patients with mTNBC.
(A) Twelve mutated genes, comprising HLA-B (CNG), BTG2 (CNG), MCL1 (CNG), H3F3A (CNG), MYC (CNG), KMT2C (SNV), KYAT3 (CNG), ARID4B (CNG), CD22 (CNG), TGFB1 (CNG), SGK1 (CNG), and RSPO2 (CNG) were identified as being associated with a higher risk of recurrence or progression in patients with mTNBC (all had HRs >1 and a p<0.05). (B) The left half of the figure summarizes the ctDNA status of all patients (n=70) at different time points; 38 patients also had their ctDNA status recorded during treatment and at progression. Solid dots represent ctDNA+ patients, while unfilled dots represent ctDNA– patients. The length of line segments in the right half of the figure denotes the PFS of patients, whereby the bars indicate the best response (PD, SD, PR, or CR) observed during treatment. (C) Comparison of ctDNA status (ctDNA+, red; ctDNA−, blue) among all the blood samples (n=139) from patients with different treatment responses (PD, SD, PR, or CR). (D) The tumor size of the ctDNA+ group at baseline was significantly greater than that of the ctDNA− group at baseline. (E) ctDNA+ at baseline was significantly associated with a shorter PFS. CNG, copy number gain; CR, complete response; ctDNA, circulating tumor DNA; ctDNA−, ctDNA negative; ctDNA+, ctDNA positive; HR, hazard ratio; mTNBC, metastatic triple-negative breast cancer; PD, progressive disease; PFS, progression-free survival; PR, partial response; SD, stable disease; SNV, single-nucleotide variant. A p-value <0.05 was used as a measure of statistical significance.
Figure 3—figure supplement 1
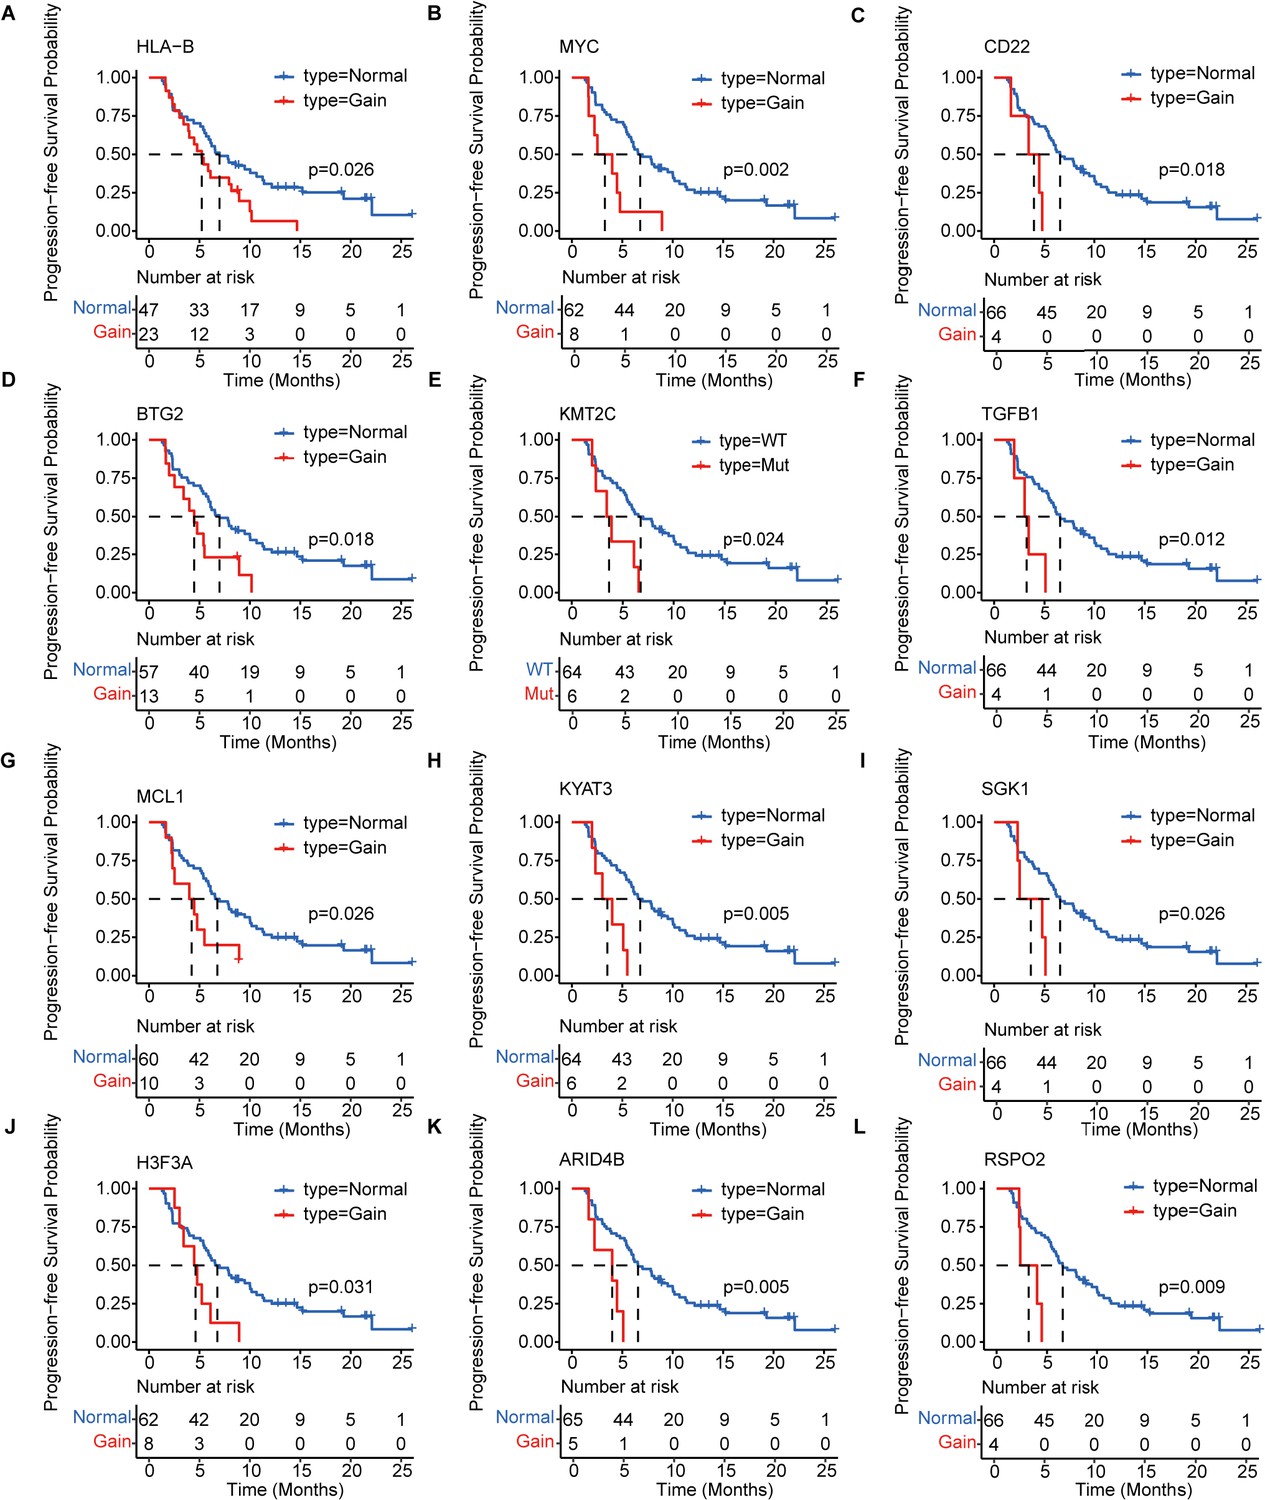
Kaplan–Meier analysis of the PFS of 12 prognosis-relevant mutated genes in patients with mTNBC.
Patients with mutated HLA-B (A), MYC (B), CD22 (C), BTG2 (D), KMT2C (E), TGFB1 (F), MCL1 (G), KYAT3 (H), SGK1 (I), H3F3A (J), ARID4B (K), or RSPO2 (L) had a significantly shorter PFS. Gain = copy number gain; mTNBC, metastatic triple-negative breast cancer patients; Mut, mutated; PFS, progression-free survival. WT, wild type. A p-value <0.05 was used as a measure of statistical significance.
Figure 4
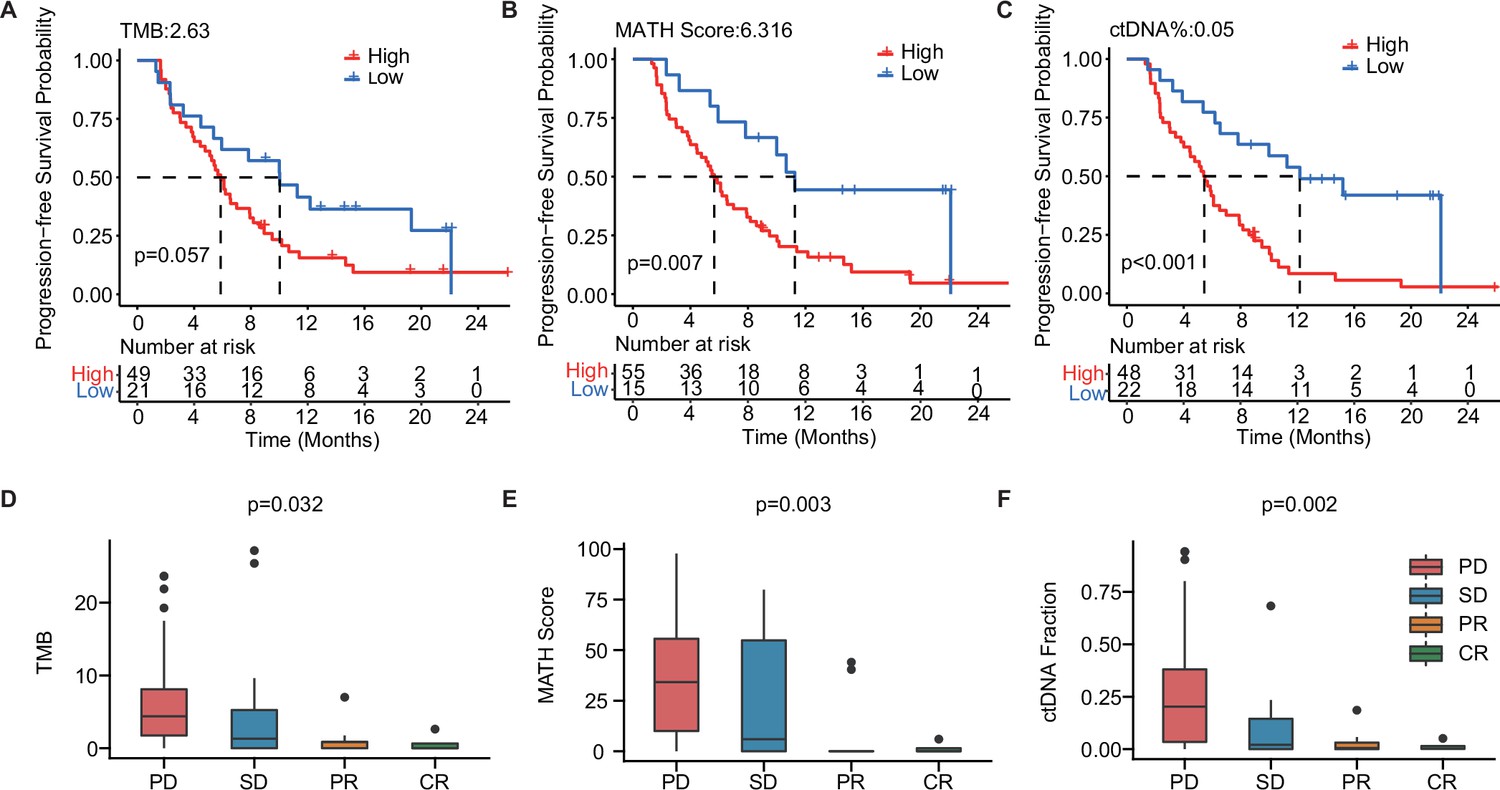
The baseline-ctDNA-derived TMB, MATH score, and ctDNA% were associated with the clinical outcomes of patients with mTNBC.
Higher TMB (≥2.63) (A), MATH score (≥6.316) (B), and ctDNA% (≥0.05) (C) were linked to a shorter PFS. The optimal cut-off values for TMB, MATH score, and ctDNA% were determined using the R package ‘survminer’. Comparison of TMB (D), MATH score (E), and ctDNA% (F) in patients with different treatment responses (PD, SD, PR, or CR). CR, complete response; ctDNA, circulating tumor DNA; ctDNA%, ctDNA fraction; mTNBC, metastatic triple-negative breast cancer; PFS, progression-free survival; PD, progressive disease; PR, partial response; SD, stable disease; TMB, tumor mutational burden. A p-value <0.05 was used as a measure of statistical significance.
Figure 5

Dynamic ctDNA changes in patients with mTNBC.
(A–D) Dynamic changes in tumor size were observed by radiological examination (CT/MRI) and the conventional tumor markers CEA, CA125, and CA153 (left side) or the VAF/copy number of 12 prognosis-relevant genes (right side) in four patients who each had a different best treatment response: PD (Patient 32), SD (Patient 31), PR (Patient 29), and CR (Patient 18). (E) The correlation between tumor size (measured using CT/MRI) and conventional tumor markers (CEA, CA125, CA153) or ctDNA parameters (TMB, MATH score, ctDNA%). Blue: positive correlation; red: negative correlation (the stronger the correlation, the darker the color). (F) Patients with a ctDNA+ status across all time points (All positive) tended to have a shorter PFS than those who were ctDNA− at least once during the dynamic monitoring process (Other). CR, complete response; ctDNA, circulating tumor DNA; ctDNA−, ctDNA negative; ctDNA+, ctDNA positive; ctDNA%, ctDNA fraction; mTNBC, metastatic triple-negative breast cancer; PFS, progression-free survival; PD, progressive disease; PR, partial response; SD, stable disease; TMB, tumor mutational burden; VAF, variant allelic frequency. A p-value <0.05 was used as a measure of statistical significance.
Tables
Table 1
The baseline characteristics in study population.
| Characteristics | All patients-no. (%)(n=70) | Dynamic monitoring patients-no. (%)(n=38) |
|---|---|---|
| Age (yrs), median (range) | 46 (26–75) | 47 (27–75) |
| ≤50 | 45 (64.3) | 26 (68.4) |
| ˃50 | 25 (35.7) | 12 (31.6) |
| Histopathologic diagnosis | ||
| Invasive ductal carcinoma | 58 (82.9) | 29 (76.3) |
| Other | 10 (14.3) | 7 (18.4) |
| NA | 2 (2.9) | 2 (5.3) |
| Pathological grade | ||
| I-II | 12 (17.1) | 10 (26.3) |
| III | 39 (55.7) | 20 (52.6) |
| NA | 19 (27.1) | 8 (21.1) |
| Disease stage at initial diagnosis | ||
| I | 7 (10.0) | 5 (13.2) |
| II | 20 (28.6) | 10 (26.3) |
| III | 33 (47.1) | 20 (52.6) |
| IV | 7 (10.0) | 3 (7.9) |
| NA | 3 (4.3) | 0 |
| Disease-free interval (months) | ||
| ≤12 (including stage IV at initial diagnosis) | 23 (32.9) | 11 (28.9) |
| >12 | 47 (67.1) | 27 (71.1) |
| Sites of metastasis | ||
| Visceral | 56 (80.0) | 33 (86.8) |
| Non-visceral | 14 (20.0) | 5 (13.2) |
| Previous lines of chemotherapy during metastatic stage | ||
| 0 | 46 (65.7) | 22 (57.9) |
| 1 | 19 (27.1) | 11 (28.9) |
| 2 | 5 (7.1) | 5 (13.2) |
Table 2
The treatment characteristics and responses of patients.
| Treatment characteristics and responses | All patients-no. (%)(n=70) | Dynamic monitoring patients-no. (%)(n=38) |
|---|---|---|
| Treatment regimens | ||
| Contained gemcitabine +platinum | 17 (24.3) | 10 (26.3) |
| Contained taxane +platinum | 16 (22.9) | 7 (18.4) |
| Contained vinorelbine +platinum | 4 (5.7) | 1 (2.6) |
| Contained taxane but no platinum | 22 (31.4) | 14 (36.8) |
| Other | 11 (15.7) | 6 (15.8) |
| Treatment modalities | ||
| Immunotherapy +chemotherapy | 11 (15.7) | 6 (15.8) |
| Chemotherapy | 59 (84.3) | 32 (84.2) |
| Treatment responses | ||
| CR | 4 (5.7) | 4 (10.5) |
| PR | 23 (32.9) | 9 (23.7) |
| SD | 31 (44.3) | 18 (47.4) |
| PD | 12 (17.1) | 7 (18.4) |
Table 3
Multivariate cox regression analysis of multiple clinical factors and ctDNA status with PFS of patients.
| Variable | HR (95 CI) | p value |
|---|---|---|
| Age (≤50 vs. ˃ 50 years) | 1.21 (0.47–3.1) | 0.694 |
| Histopathologic diagnosis (IDC vs. non-IDC) | 0.64 (0.15–2.73) | 0.55 |
| Pathological grade (III vs. I-II) | 1.23 (0.53–2.86) | 0.629 |
| DFI (≤12 months vs. ˃ 12 months) | 1.69 (0.6–4.71) | 0.319 |
| ctDNA status (ctDNA+ vs. ctDNA–) | 2.67 (1.2–5.96) | 0.016 |
| T stage (T1 vs. T2 vs. T3) | 0.75 (0.38–1.47) | 0.397 |
| N stage (N1 vs. N2 vs. N3) | 0.79 (0.57–1.1) | 0.161 |
| CEA elevation (Yes vs. No) | 1.75 (0.64–4.81) | 0.278 |
| CA125 elevation (Yes vs. No) | 0.67 (0.24–1.88) | 0.445 |
| CA153 elevation (Yes vs. No) | 1.86 (0.62–5.57) | 0.268 |
| Ki-67 (≥30% vs.<30%) | 0.78 (0.33–1.88) | 0.582 |
| Site of metastasis (visceral vs. non-visceral) | 0.54 (0.18–1.61) | 0.267 |
| TMB (High vs. Low) | 1.08 (0.38–3.09) | 0.88 |
-
Footnotes: Disease-free interval (DFI) was defined as the time from the initial surgery to the disease progression; IDC: invasive ductal carcinoma.
Additional files
-
Supplementary file 1
The list of 457 genes detected in this study.
Footnotes: Listed in this file are 457 genes, known to be frequently mutated in tumors, and were designed to compose a targeted NGS panel in this study to capture targeted DNA segments.
- https://cdn.elifesciences.org/articles/90198/elife-90198-supp1-v2.docx
-
MDAR checklist
- https://cdn.elifesciences.org/articles/90198/elife-90198-mdarchecklist1-v2.pdf
Download links
A two-part list of links to download the article, or parts of the article, in various formats.
Downloads (link to download the article as PDF)
Open citations (links to open the citations from this article in various online reference manager services)
Cite this article (links to download the citations from this article in formats compatible with various reference manager tools)
Dynamic analysis of circulating tumor DNA to predict the prognosis and monitor the treatment response of patients with metastatic triple-negative breast cancer: A prospective study
eLife 12:e90198.
https://doi.org/10.7554/eLife.90198


