Interdependence of plasma membrane nanoscale dynamics of a kinase and its cognate substrate underlies Arabidopsis response to viral infection
- Univ. Bordeaux, CNRS, Laboratoire de Biogenèse Membranaire (LBM), France
- Université Paris-Saclay, CNRS, INRAE, Univ Evry, Université Paris Cité, Institute of Plant Sciences Paris-Saclay (IPS2), France
- Faculty of Biology, University of Freiburg, Germany
- Faculty of Biology, University of Munich (LMU), Germany
- Department of Plant, Soil and Microbial Sciences, Michigan State University, United States
- Laboratoire de Recherche en Sciences Végétales (LRSV), Université de Toulouse, CNRS, UPS, Toulouse INP, France
- INRAE, GAFL, France
- Graduate School of Agricultural and Life Sciences, The University of Tokyo, Japan
- UMR 1332 BFP, INRAE Univ. Bordeaux, France
- Center of Plant Molecular Biology (ZMBP), University of Tübingen, Germany
- CIBSS – Centre for Integrative Biological Signalling Studies, University of Freiburg, Germany
Figures
Figure 1 with 3 supplements
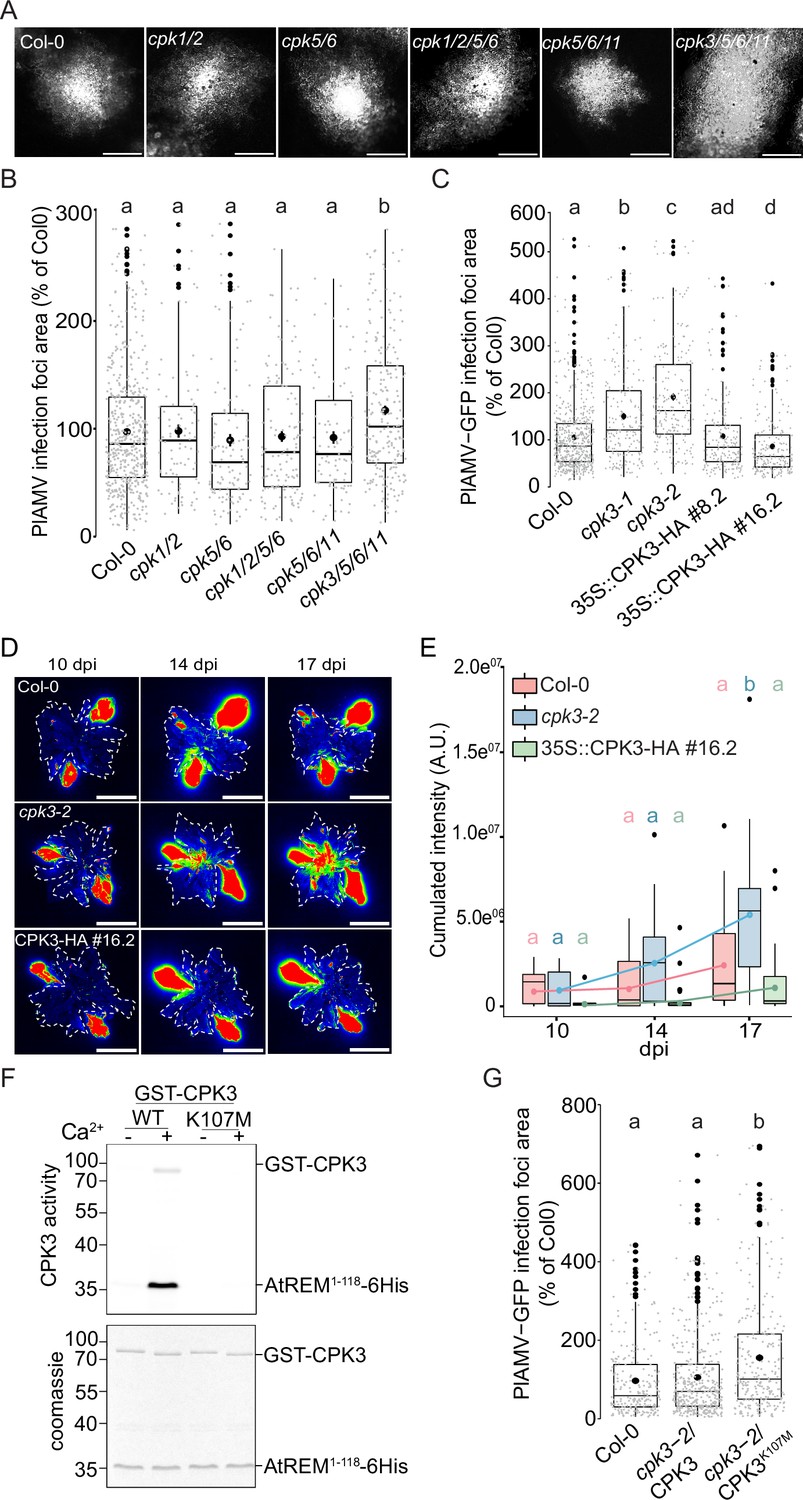
Arabidopsis thaliana calcium-dependent protein kinase 3 (CPK3) is specifically involved in the restriction of plantago asiatica mosaic virus (PlAMV) cell-to-cell movement.
(A) Representative images of PlAMV-GFP infection foci at 5 dpi in the different mutant backgrounds. Scale bar = 500 µm. (B) Box plots of the mean area of PlAMV-GFP infection foci 5 d after infection in CPK multiple mutant lines, normalized to the mean area measured in Col-0. Three independent biological repeats were performed, with at least 47 foci per experiment and per genotype. Significant differences were revealed using a One-Way ANOVA followed by a Tukey’s multiple comparison test. Letters are used to discriminate between statistically different conditions (p<0.05). (C) Box plots of the mean area of PlAMV-GFP infection foci in cpk3-1 and cpk3-2 single mutants and in CPK3 over-expressing lines (Pro35S:CPK3-HA #8.2 and Pro35S:CPK3-HA #16.2), normalized to the mean area measured in Col-0. Three independent biological repeats were performed, with at least 56 foci per experiment and per genotype. Significant differences were revealed using a one-way ANOVA followed by a Tukey’s multiple comparison test. Letters are used to discriminate between statistically different conditions (p<0.05). (D) Representative images of A. thaliana plants infected with PlAMV-GFP and imaged with a CCD Camera from 10 to 17 dpi. The region of interest used for measurement of pixel intensity is circled with a white dotted line. Multicolored scale is used to enhance contrast and ranges from blue (low intensity) to red (high intensity). Scale bar = 4 cm. (E) Box plots of the mean cumulated intensity measured in infected leaves in Col-0, cpk3-2, and Pro35S:CPK3-HA #16.2 during systemic viral propagation. Two independent experiments were conducted. Statistical differences could be observed between the genotypes and time-points using a Kruskal-Wallis followed by a Dunn’s multiple comparison test (p<0.05). For clarity, only the results of the statistical test of the comparison of the different time-points (10, 14, and 17 dpi) within a genotype are displayed and are color-coded depending on the genotype. (F) Kinase activity of CPK3 dead variant. Recombinant proteins GST-CPK3 WT and K107M were incubated with REM1.21-118-6His in kinase reaction buffer in the presence of EGTA (-) or 100 µM free Ca2+ (+). Radioactivity is detected on dried gel (upper panel). The protein amount is monitored by Coomassie staining (lower panel). (G) Box plots of the mean area of PlAMV-GFP infection foci in cpk3-2 complemented lines cpk3-2/Pro35S:CPK3-myc and cpk3−2/Pro35S:CPK3K107M-myc. Three independent biological repeats were performed, with at least 51 foci per experiment and per genotype. Significant differences were revealed using a one-way ANOVA followed by a Tukey’s multiple comparison test. Letters are used to discriminate between statistically different conditions (p<0.0001).
-
Figure 1—source data 1
Original files for western blot analysis displayed in Figure 1F.
- https://cdn.elifesciences.org/articles/90309/elife-90309-fig1-data1-v1.zip
-
Figure 1—source data 2
PDF file containing original western blots for Figure 1F, indicating the relevant bands and tested conditions.
- https://cdn.elifesciences.org/articles/90309/elife-90309-fig1-data2-v1.zip
-
Figure 1—source data 3
Related to Figure 1B.
- https://cdn.elifesciences.org/articles/90309/elife-90309-fig1-data3-v1.xlsx
-
Figure 1—source data 4
Related to Figure 1C.
- https://cdn.elifesciences.org/articles/90309/elife-90309-fig1-data4-v1.xlsx
-
Figure 1—source data 5
Related to Figure 1E.
- https://cdn.elifesciences.org/articles/90309/elife-90309-fig1-data5-v1.xlsx
-
Figure 1—source data 6
Related to Figure 1G.
- https://cdn.elifesciences.org/articles/90309/elife-90309-fig1-data6-v1.xlsx
Figure 1—figure supplement 1
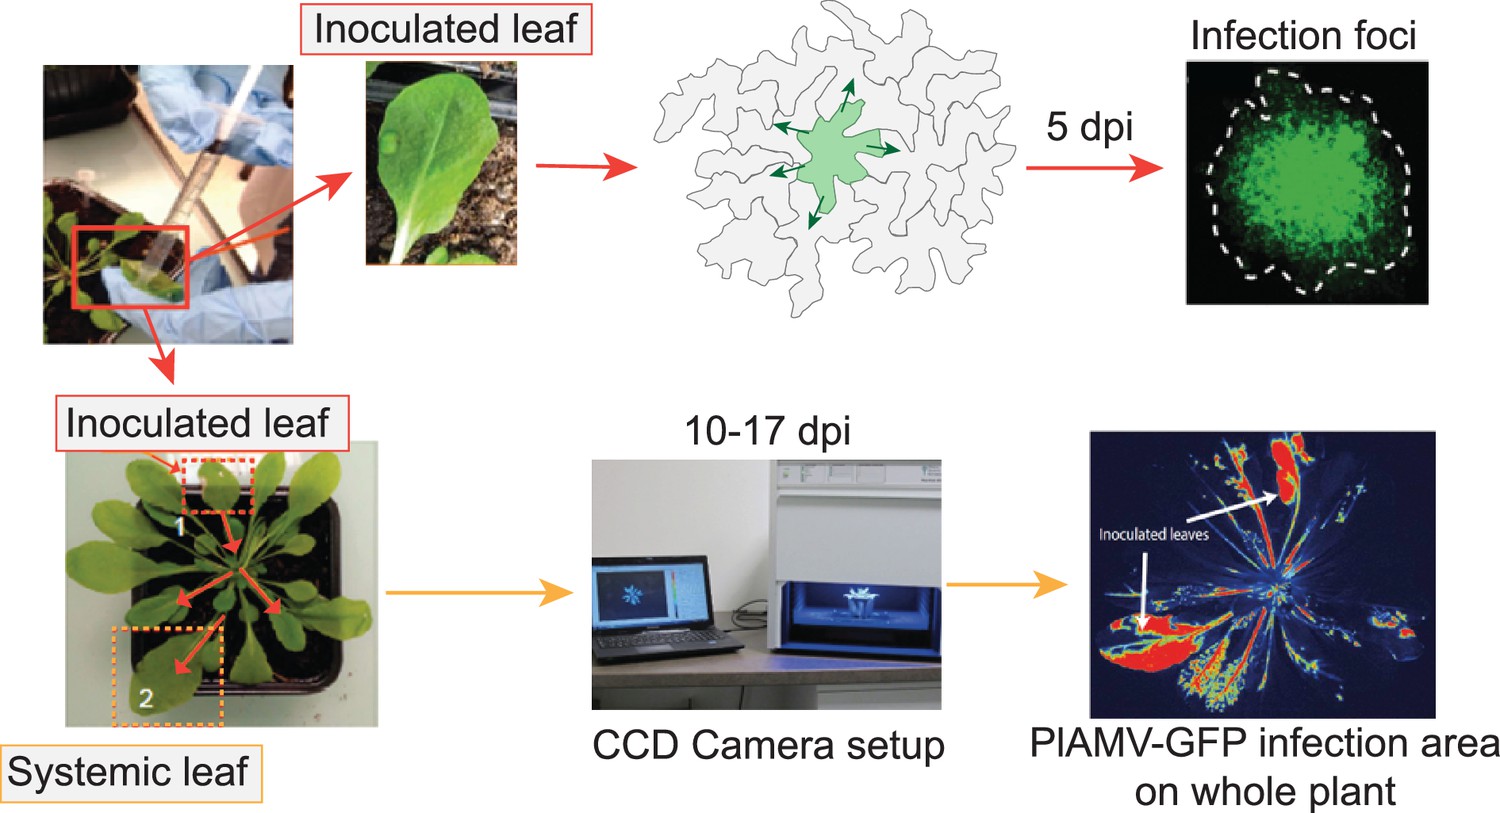
Viral propagation experimental design.
Schematic representation of the method used for local and systemic plantago asiatica mosaic virus (PlAMV) propagation assays. Shorty, 3-wk-old A. thaliana leaves are infiltrated with PlAMV-GFP. For local propagation, the inoculated leaves are cut out at 5 dpi to observe individual foci using a macroscope. For systemic propagation, the whole plant is imaged with a CCD camera at 10, 14, and 17 dpi to follow the evolution of PlAMV propagation.
Figure 1—figure supplement 2
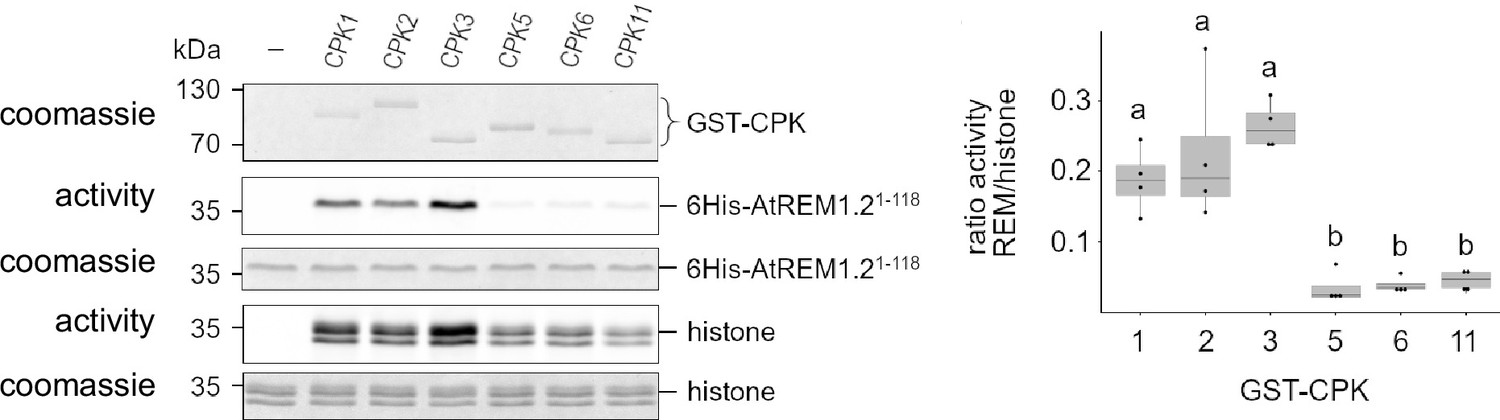
Specificity of calcium-dependent protein kinase 3 (CPK) kinase activity towards REM1.2 in vitro.
Left panel: GST-CPKs recombinant proteins were incubated with REM1.21-118-6His or histone as substrates, in kinase reaction buffer in the presence of Ca2+. The radioactivity is detected on dried gel and the protein amount is monitored by Coomassie staining. Right panel: the radioactive signals were quantified with ImageQuant and the ratio between REM1.2 and histone phosphorylations is shown in a boxplot (n=4). Different letters indicate statistical differences (p<0.05, ncompar test from R).
-
Figure 1—figure supplement 2—source data 1
Original files for western blot analysis displayed in Figure 1—figure supplement 2.
- https://cdn.elifesciences.org/articles/90309/elife-90309-fig1-figsupp2-data1-v1.zip
-
Figure 1—figure supplement 2—source data 2
PDF file containing original western blots for Figure 1—figure supplement 2, indicating the relevant bands and tested conditions.
- https://cdn.elifesciences.org/articles/90309/elife-90309-fig1-figsupp2-data2-v1.zip
Figure 1—figure supplement 3

Calcium-dependent protein kinase 3 (CPK3) protein levels in knock-out and overexpressing lines.
Western blot of CPK3 on seedlings of cpk3-1 and cpk3-2 mutant lines along with Pro35S:CPK3-HA #8.2 and Pro35S:CPK3-HA #16.2 overexpressing lines. CPK3 was detected with anti-CPK3 antibody. Protein loading was monitored by Coomassie staining.
-
Figure 1—figure supplement 3—source data 1
Original files for western blot analysis displayed in Figure 1—figure supplement 3.
- https://cdn.elifesciences.org/articles/90309/elife-90309-fig1-figsupp3-data1-v1.zip
-
Figure 1—figure supplement 3—source data 2
PDF file containing original western blots for Figure 1—figure supplement 3, indicating the relevant bands and tested conditions.
- https://cdn.elifesciences.org/articles/90309/elife-90309-fig1-figsupp3-data2-v1.zip
Figure 2 with 3 supplements
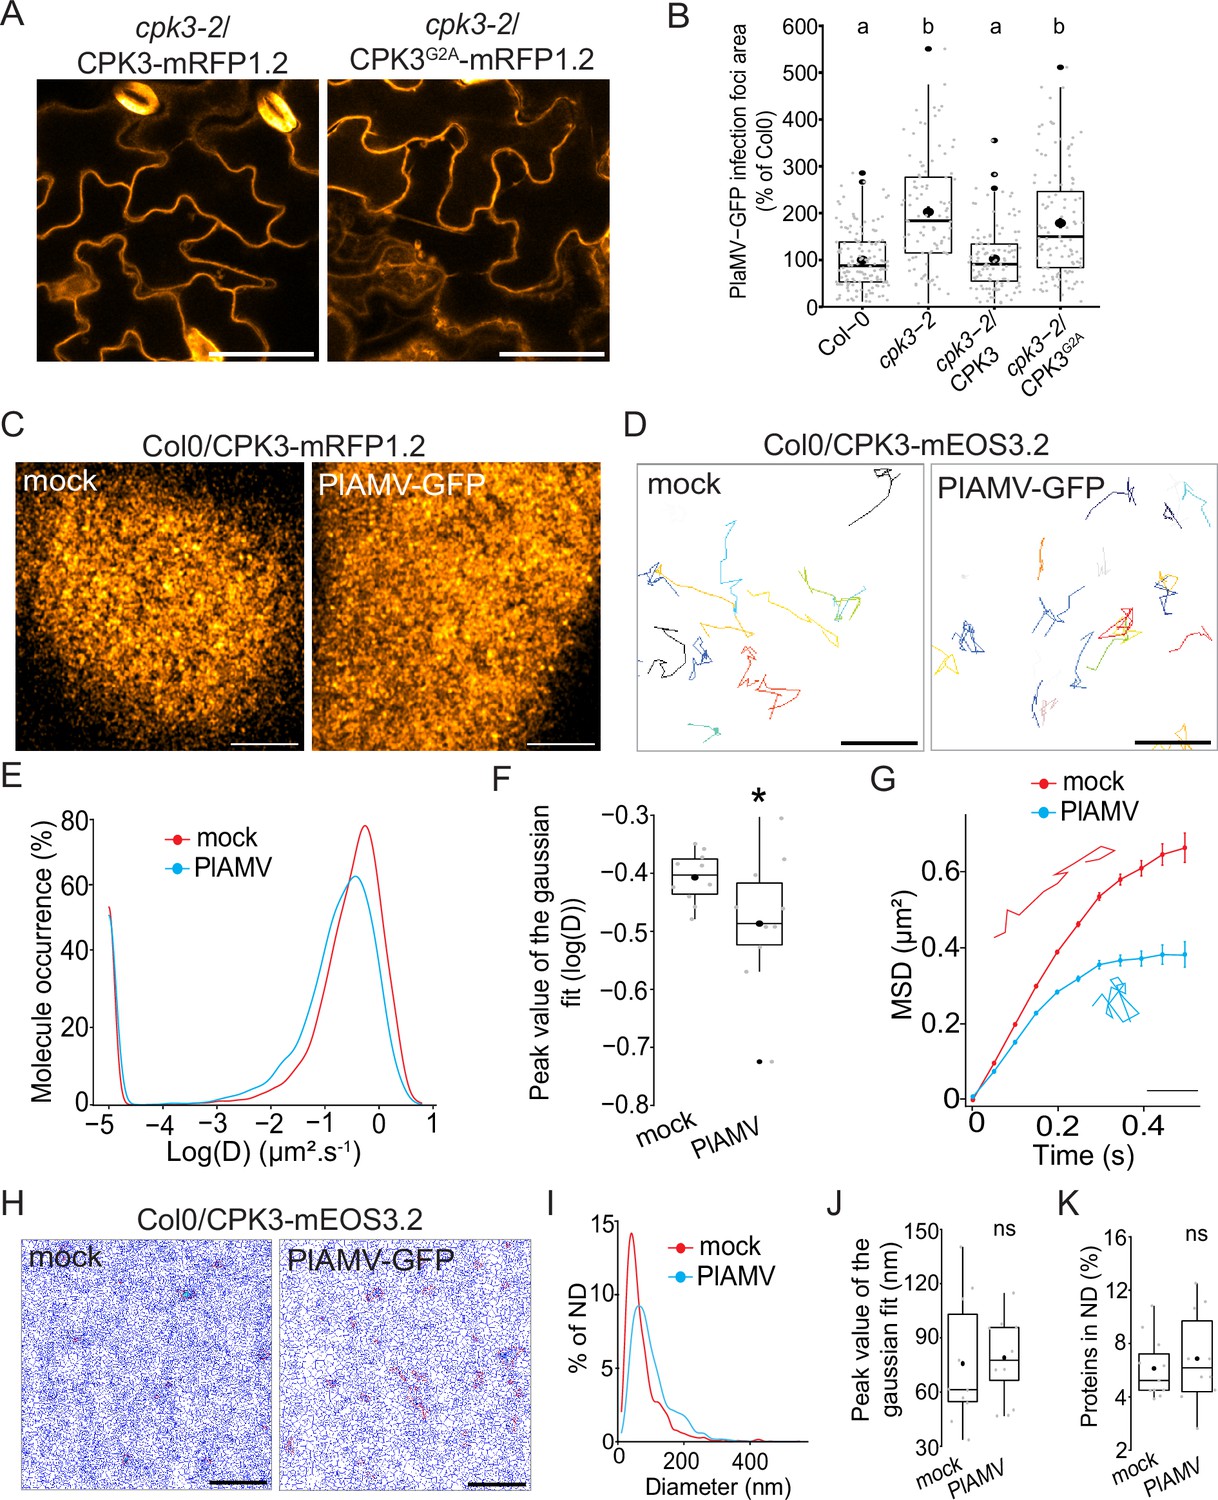
Calcium-dependent protein kinase 3 (CPK3) diffusion decreases upon plantago asiatica mosaic virus (PlAMV) infection in Arabidopsis thaliana.
(A) Confocal images of the secant view of A. thaliana epidermal cells of the cpk3-2/CPK3-mRFP1.2 or cpk3-2/ProUbi10:CPK3G2A-mRFP1.2. Scale bar = 5 µm. (B) Box plots of the mean area of PlAMV-GFP infection foci in cpk3-2 and complemented lines cpk3-2/ProUbi10:CPK3-mRFP1.2 and cpk3-2/ProUbi10:CPK3G2A-mRFP1.2. Three independent biological repeats were performed, with at least 32 foci per experiment and per genotype. Significant differences were revealed using a one-way ANOVA followed by a Tukey’s multiple comparison test. Letters are used to discriminate between statistically different conditions (p<0.0001). (C) Confocal images of the surface view of A. thaliana epidermal cells of the Col-0/ProUbi10:CPK3-mRFP1.2, infiltrated either with free GFP (‘mock’) or PlAMV-GFP. Scale bar = 5 µm. (D) Representative trajectories of Col-0/CPK3-mEOS3.2 infiltrated either with free GFP (‘mock’) or PlAMV-GFP; Scale bar = 2 µm. (E) Distribution of the diffusion coefficient (D), represented as log(D) for Col-0/ProUbi10:CPK3-mEOS3.2 5 d after infiltration with free GFP (‘mock’) or PlAMV-GFP. Data were acquired from at least 8086 trajectories obtained in at least 16 cells over the course of three independent experiments. (F) Box plot of the mean peak value extracted from the Gaussian fit of log(D) distribution. Significant difference was revealed using a Mann-Whitney test. *p<0.05. (G) Mean square displacement (MSD) over time of Col-0/ProUbi10:CPK3-mEOS3.2 5 d after infiltration with free GFP (‘mock’) or PlAMV-GFP. Representative trajectories extracted from (D) illustrate each curve. Scale bar = 1 µm. Data were acquired from at least 16 cells over the course of three independent experiments. (H) Voronoi tessellation illustration of Col-0/ProUbi10:CPK3-mEOS3.2 5 d after infiltration with free GFP (‘mock’) or PlAMV-GFP. ND are circled in red. Scale bar = 2 µm. (I) Distribution of the ND diameter of Col-0/ProUbi10:CPK3-mEOS3.2 5 d after infiltration with free GFP (‘mock’) or PlAMV-GFP. (J) Box plot representing the mean peak value of nanodomains (ND) diameter extracted from the Gaussian fit of (I). No significant differences were revealed using a Mann-Whitney test. (K) Boxplot of the proportion of Col-0/ProUbi10:CPK3-mEOS3.2 detections found in ND 5 d after infiltration with free GFP (‘mock’) or PlAMV-GFP. No significant differences were revealed using a Mann-Whitney test.
-
Figure 2—source data 1
related to Figure 2B.
- https://cdn.elifesciences.org/articles/90309/elife-90309-fig2-data1-v1.xlsx
-
Figure 2—source data 2
related to Figure 2E.
- https://cdn.elifesciences.org/articles/90309/elife-90309-fig2-data2-v1.xlsx
-
Figure 2—source data 3
related to Figure 2F.
- https://cdn.elifesciences.org/articles/90309/elife-90309-fig2-data3-v1.xlsx
-
Figure 2—source data 4
related to Figure 2G.
- https://cdn.elifesciences.org/articles/90309/elife-90309-fig2-data4-v1.xlsx
-
Figure 2—source data 5
related to Figure 2I.
- https://cdn.elifesciences.org/articles/90309/elife-90309-fig2-data5-v1.xlsx
-
Figure 2—source data 6
related to Figure 2J.
- https://cdn.elifesciences.org/articles/90309/elife-90309-fig2-data6-v1.xlsx
-
Figure 2—source data 7
related to Figure 2K.
- https://cdn.elifesciences.org/articles/90309/elife-90309-fig2-data7-v1.xlsx
Figure 2—figure supplement 1
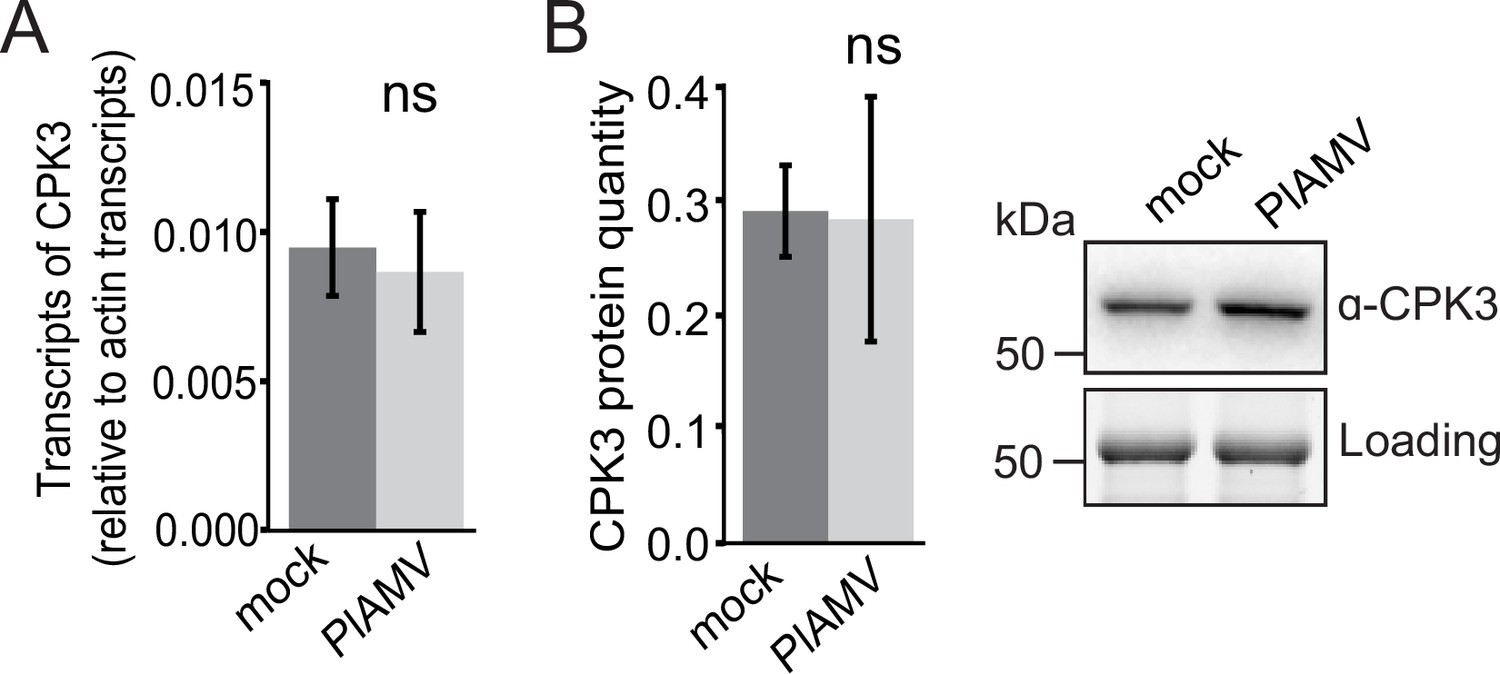
Calcium-dependent protein kinase 3 (CPK3) transcript and protein levels are not modified upon viral infection.
(A) Transcript levels of CPK3 in leaves infiltrated with either free GFP or PlAMV-GFP and harvested 7 d after infection. Three independent experiments were performed with three independent plants for each condition per experiment. Transcript levels were normalized to actin transcripts. No significant difference could be deciphered using a Mann-Whitney test. (B) Left panel: CPK3 protein levels were determined by quantification of western-blot signal of Col-0 plants infiltrated with free GFP (‘mock’) or PlAMV-GFP blotted with an anti-CPK3-specific antibody. Three independent assays were performed. No difference could be deciphered using a Mann-Whitney test. Right panel: representative western blot. Protein loading was monitored by stain-free staining.
-
Figure 2—figure supplement 1—source data 1
Related to Figure 2—figure supplement 1A.
- https://cdn.elifesciences.org/articles/90309/elife-90309-fig2-figsupp1-data1-v1.csv
-
Figure 2—figure supplement 1—source data 2
Original files for western blot analysis displayed in Figure 2—figure supplement 1.
- https://cdn.elifesciences.org/articles/90309/elife-90309-fig2-figsupp1-data2-v1.zip
-
Figure 2—figure supplement 1—source data 3
Original files for western blot analysis displayed in Figure 2—figure supplement 1.
- https://cdn.elifesciences.org/articles/90309/elife-90309-fig2-figsupp1-data3-v1.zip
Figure 2—figure supplement 2

Calcium-dependent protein kinase 3 (CPK3) does not accumulate at plasmodesmata during plantago asiatica mosaic virus (PlAMV) infection.
Confocal images of the secant view of A. thaliana epidermal cells of the cpk3-2/CPK3-mRFP1.2 stained with aniline blue 5 d after infiltration with free GFP (‘mock’) or PlAMV-GFP. Scale bar = 5 µm.
Figure 2—video 1
Example of an spt-PALM stream of Col-0/CPK3-mEOS3.2.
Figure 3 with 3 supplements
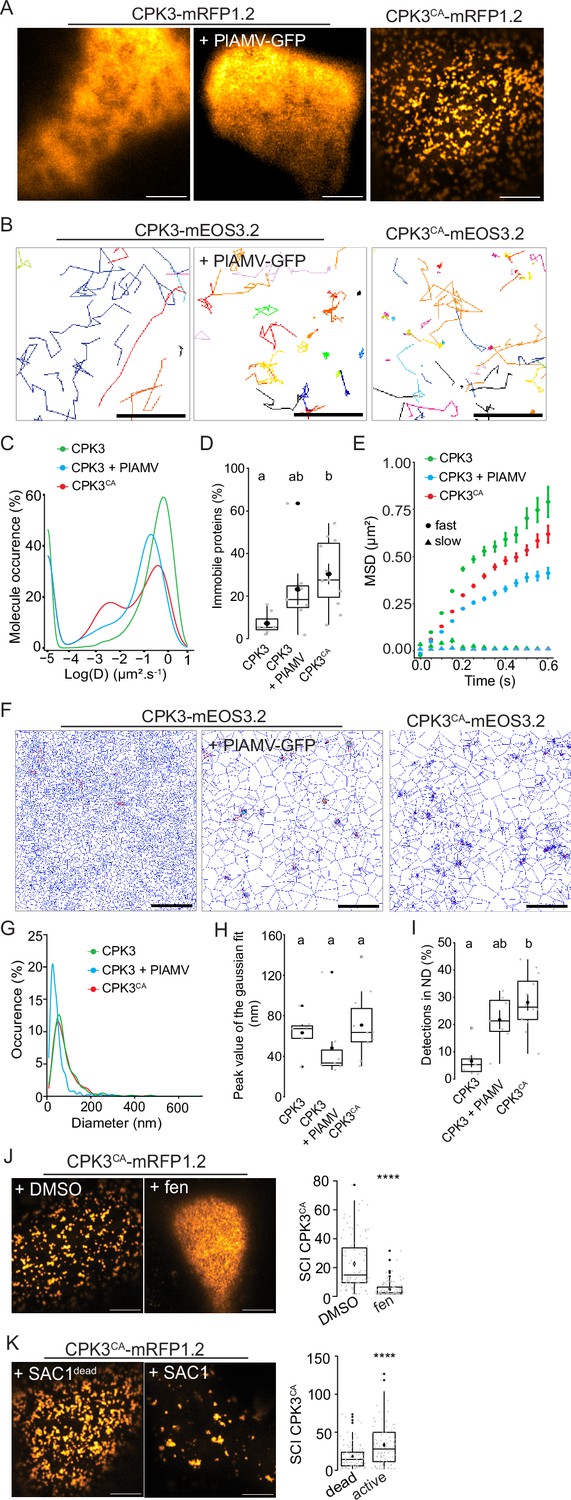
Plantago asiatica mosaic virus (PlAMV)-induced activation of calcium-dependent protein kinase 3 (CPK3) in N. benthamiana induces its confinement and clustering in plasma membrane (PM) domains.
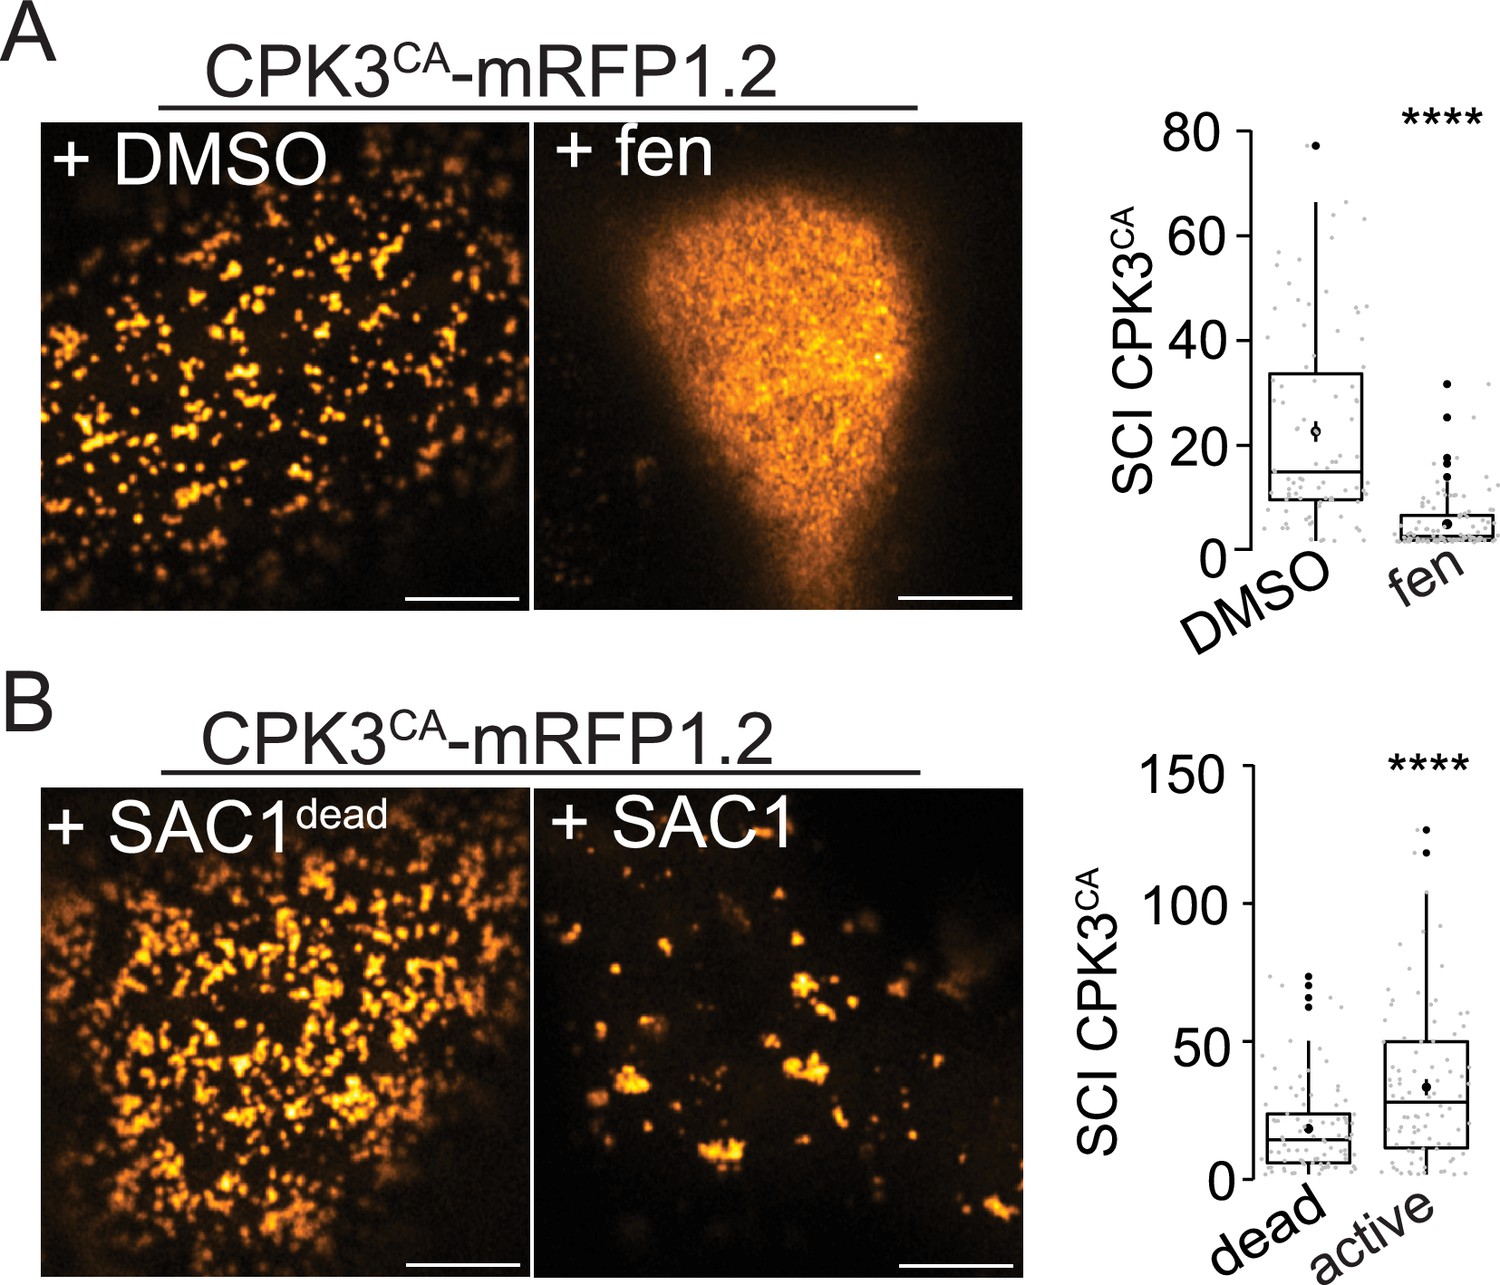
(A) Confocal images of the surface view of N. benthamiana epidermal cells transiently expressing ProUbi10:CPK3-mRFP1.2, ProUbi10:CPK3-mRFP1.2+PlAMV GFP or ProUbi10:CPK3CA-mRFP1.2. Scale bar = 5 µm. (B) Representative trajectories of ProUbi10:CPK3-mEOS3.2, ProUbi10:CPK3.2-mEOS3.2+PlAMV and ProUbi10:CPK3CA-mEOS3.2. Scale bar = 2 µm. (C) Distribution of the diffusion coefficient (D), represented as log(D) for ProUbi10:CPK3-mEOS3.2, ProUbi10:CPK3-mEOS3.2+PlAMV GFP and ProUbi10:CPK3CA-mEOS3.2. Data were acquired from at least 6144 trajectories obtained in at least 15 cells over the course of three independent experiments. (D) Box plots of the fraction of immobile proteins (log(D)p<0.005). (E) Mean square displacement (MSD) over time of fast (circle) or slow (triangle) diffusing ProUbi10:CPK3-mEOS3.2, ProUbi10:CPK3-mEOS3.2+PlAMV GFP, ProUbi10:CPK3CA-mEOS3.2. Standard error is displayed from three independent experiments. (F) Voronoï tessellation illustration of ProUbi10:CPK3-mEOS3.2, ProUbi10:CPK3-mEOS3.2+PlAMV GFP and ProUbi10:CPK3CA-mEOS3.2. ND are circled in red. Scale bar = 2 µm. (G) Distribution of the ND diameter of ProUbi10:CPK3-mEOS3.2, ProUbi10:CPK3-mEOS3.2+PlAMV GFP and ProUbi10:CPK3CA-mEOS3.2. (H) Box plot representing the mean peak value of ND diameter extracted from the Gaussian fit of (G). No significant differences were revealed using a Kruskal-Wallis followed by a Dunn’s multiple comparison test.(I) Boxplot of the proportion of detections found in ND of ProUbi10:CPK3-mEOS3.2, ProUbi10:CPK3-mEOS3.2+PlAMV GFP and ProUbi10:CPK3CA-mEOS3.2. Significant differences were revealed using a Kruskal-Wallis followed by a Dunn’s multiple comparison test. Letters are used to discriminate between statistically different conditions (p<0.005). (J) Left: Confocal images of the surface view of N. benthamiana epidermal cells transiently expressing ProUbi10:CPK3CA-mRFP1.2 and infiltrated with either DMSO or 50 µg/mL fenpropimorph. Scale bar = 5 µm; Right: Box plot of the mean spatial clustering index (SCI) of CPK3CA. At least three experiments were performed, with at least 10 cells per experiment; statistical significance was determined using a Student t-test, ****:p<0.0001. (K) Left: Confocal images of the surface view of N. benthamiana epidermal cells transiently co-expressing ProUbi10:CPK3CA-mRFP1.2 with active or dead SAC1, mutated for its phosphatase activity. Scale bar = 5 µm; Right: Box plot of the mean SCI of CPK3CA. At least three experiments were performed, with at least 10 cells per experiment; statistical significance was determined using a Student t-test, ****p<0.0001.
-
Figure 3—source data 1
Related to Figure 3C.
- https://cdn.elifesciences.org/articles/90309/elife-90309-fig3-data1-v1.xlsx
-
Figure 3—source data 2
Related to Figure 3D and E.
- https://cdn.elifesciences.org/articles/90309/elife-90309-fig3-data2-v1.xlsx
-
Figure 3—source data 3
Related to Figure 3G.
- https://cdn.elifesciences.org/articles/90309/elife-90309-fig3-data3-v1.csv
-
Figure 3—source data 4
Related to Figure 3H.
- https://cdn.elifesciences.org/articles/90309/elife-90309-fig3-data4-v1.csv
-
Figure 3—source data 5
Related to Figure 3I.
- https://cdn.elifesciences.org/articles/90309/elife-90309-fig3-data5-v1.csv
-
Figure 3—source data 6
Related to Figure 3J.
- https://cdn.elifesciences.org/articles/90309/elife-90309-fig3-data6-v1.csv
-
Figure 3—source data 7
Related to Figure 3K.
- https://cdn.elifesciences.org/articles/90309/elife-90309-fig3-data7-v1.csv
Figure 3—figure supplement 1

Calcium-dependent protein kinase 3 (CPK3) and CPK3CA display a similar subcellular localization.
Confocal images of the secant view of N. benthamiana epidermal cells transiently expressing ProUbi10:CPK3-mRFP1.2 or ProUbi10:CPK3CA-mRFP1.2. Scale bar = 5 µm.
Figure 3—figure supplement 2
Calcium-dependent protein kinase 3 (CPK3) and CPK3CA display a similar subcellular localization.
Figure 3—video 1
Example of an spt-PALM stream of CPK3-mEOS3.2 transiently expressed in N. benthamiana.
Figure 4 with 5 supplements
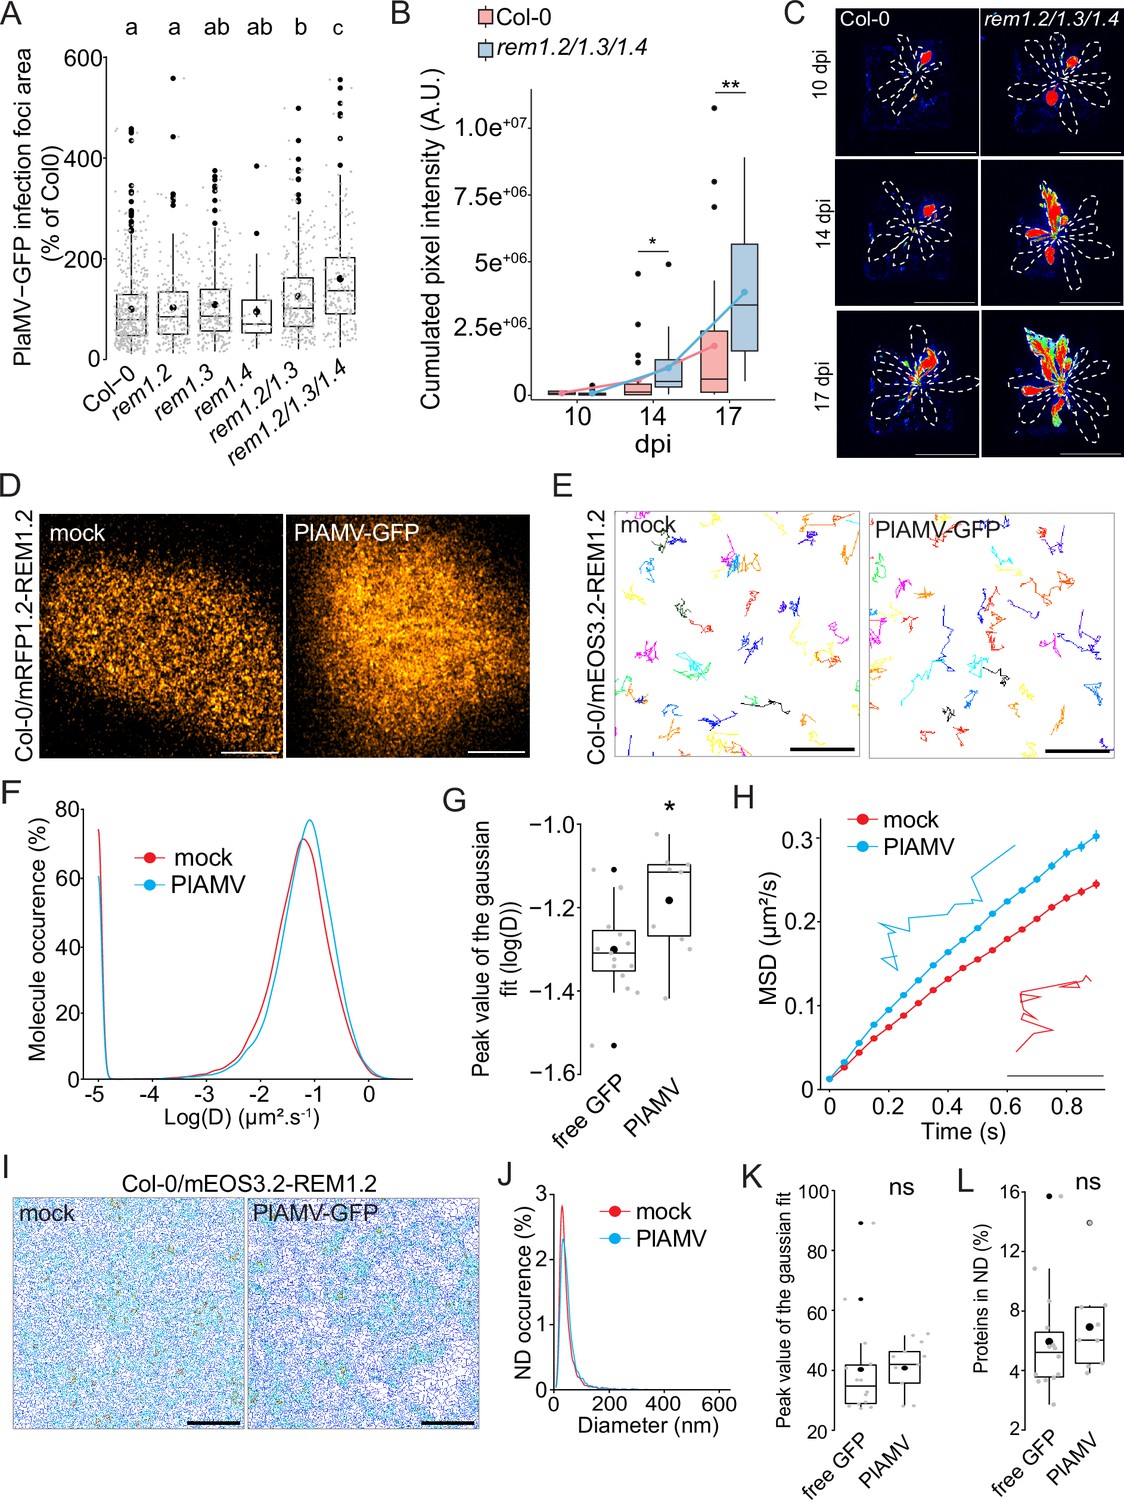
Group 1 REMORIN (REM) hampers plantago asiatica mosaic virus (PlAMV)-GFP cell-to-cell propagation and REM1.2 diffusion increases upon infection.
(A) Box plots of the mean area of PlAMV-GFP infection foci in rem1.2, rem1.3, rem1.4 single mutants along with rem1.2 rem1.3 double mutant and rem1.2 rem1.3 rem1.4 triple mutant. Three independent biological repeats were performed, with at least 36 foci per experiment and per genotype. Significant differences were revealed using a one-way ANOVA followed by a Tukey’s multiple comparison test. Letters are used to discriminate between statistically different conditions (p<0.05). (B) Box plots of the mean cumulated intensity measured in infected leaves in Col-0 and rem1.2 rem1.3 rem1.4 during systemic viral propagation. Two independent experiments were conducted. Statistical significance of the difference between Col-0 and rem1.2 rem1.3 rem1.4 at each time point was assessed using a Mann-Whitney test. *p<0.05, **p<0.01. (C) Representative images of A. thaliana plants infected with PlAMV-GFP and imaged with a CCD Camera from 10 to 17 dpi. Systemic leaves are circled with a white dotted line. Multicolored scale is used to enhance contrast and ranges from blue (low intensity) to red (high intensity). Scale bar = 4 cm. (D) Confocal images of the surface view of A. thaliana epidermal cells of the Col-0/ProUbi10:mRFP1.2-REM1.2, infiltrated either with free GFP (‘mock’) or PlAMV-GFP. Scale bar = 5 µm (E) Representative trajectories of Col-0/ProUbi10:mEOS3.2-REM1.2 5 d after infiltration with free GFP (‘mock’) or PlAMV-GFP. Scale bar = 2 µm. (F) Distribution of the diffusion coefficient (D), represented as log(D) for Col-0/ProUbi10:mEOS3.2-REM1.2 5 d after infiltration with free GFP (‘mock’) or PlAMV-GFP. Data were acquired from at least 28638 trajectories obtained from at least 16 cells over the course of three independent experiments. (G) Box plot of the mean peak value extracted from the Gaussian fit of log(D) distribution. Significant difference was revealed using a Mann-Whitney test. *p<0.05. (H) Mean square displacement (MSD) over time of Col-0/ProUbi10:mEOS3.2-REM1.2 infiltrated either with free GFP (‘mock’) or PlAMV-GFP. Representative trajectories extracted from (E) illustrate each curve. Scale bar = 1 µm. (I) Voronoi tessellation illustration of Col-0/ProUbi10:mEOS3.2-REM1.2 5 d after infiltration with free GFP (‘mock’) or PlAMV-GFP. ND are circled in red. Scale bar = 2 µm (J) Distribution of the nanodomains (ND) diameter of Col-0/ProUbi10:mEOS3.2-REM1.2 5 d after infiltration with free GFP (‘mock’) or PlAMV-GFP. (K) Box plot representing the mean peak value of ND diameter extracted from the Gaussian fit of (J). No significant difference was revealed using a Mann-Whitney test. (L) Boxplot of the proportion of Col-0/ProUbi10:mEOS3.2-REM1.2 detections found in ND 5 d after infiltration with free GFP (‘mock’) or PlAMV-GFP. No significant difference was revealed using a Mann-Whitney test.
-
Figure 4—source data 1
Related to Figure 4A.
- https://cdn.elifesciences.org/articles/90309/elife-90309-fig4-data1-v1.xlsx
-
Figure 4—source data 2
Related to Figure 4B.
- https://cdn.elifesciences.org/articles/90309/elife-90309-fig4-data2-v1.csv
-
Figure 4—source data 3
Related to Figure 4F.
- https://cdn.elifesciences.org/articles/90309/elife-90309-fig4-data3-v1.csv
-
Figure 4—source data 4
Related to Figure 4G.
- https://cdn.elifesciences.org/articles/90309/elife-90309-fig4-data4-v1.csv
-
Figure 4—source data 5
Related to Figure 4H.
- https://cdn.elifesciences.org/articles/90309/elife-90309-fig4-data5-v1.csv
-
Figure 4—source data 6
Related to Figure 4J.
- https://cdn.elifesciences.org/articles/90309/elife-90309-fig4-data6-v1.csv
-
Figure 4—source data 7
Related to Figure 4K.
- https://cdn.elifesciences.org/articles/90309/elife-90309-fig4-data7-v1.csv
-
Figure 4—source data 8
Related to Figure 4L.
- https://cdn.elifesciences.org/articles/90309/elife-90309-fig4-data8-v1.csv
Figure 4—figure supplement 1
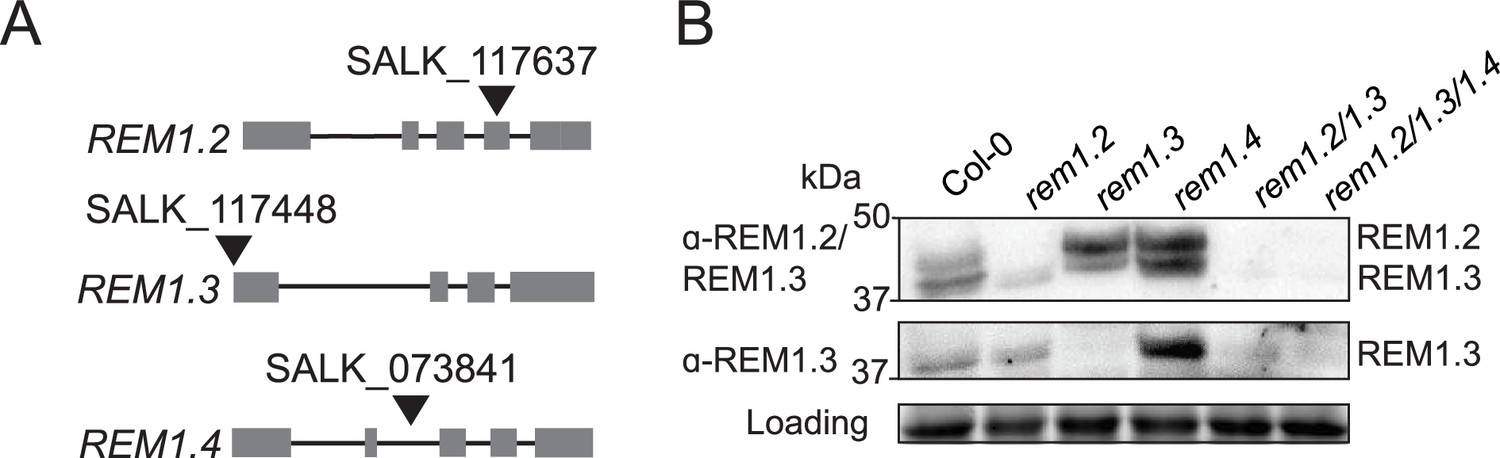
Group 1 REMORIN (REM) single, double, and triple knock-out lines.
(A) Positions of the T-DNA insertions of the single mutants used in this study for viral propagation and crossing. For rem1.2, the T-DNA is inserted in an exon, for rem1.3 in the promoter, and for rem1.4 in an intron. Boxes represent exons while black lines represent introns. (B) Western blots of Col-0, rem1.2, rem1.3, rem1.4 single mutants, rem1.2 rem1.3 double mutant and rem1.2 rem1.3 rem1.4 triple mutant, with antibodies raised against REM1.2/1.3 (upper panel) or specifically against REM1.3 (middle panel). Protein loading was monitored by stain-free staining.
-
Figure 4—figure supplement 1—source data 1
Original files for western blot analysis displayed in Figure 4—figure supplement 1.
- https://cdn.elifesciences.org/articles/90309/elife-90309-fig4-figsupp1-data1-v1.zip
-
Figure 4—figure supplement 1—source data 2
PDF file containing original western blots for Figure 4—figure supplement 1, indicating the relevant bands and tested conditions.
- https://cdn.elifesciences.org/articles/90309/elife-90309-fig4-figsupp1-data2-v1.zip
Figure 4—figure supplement 2
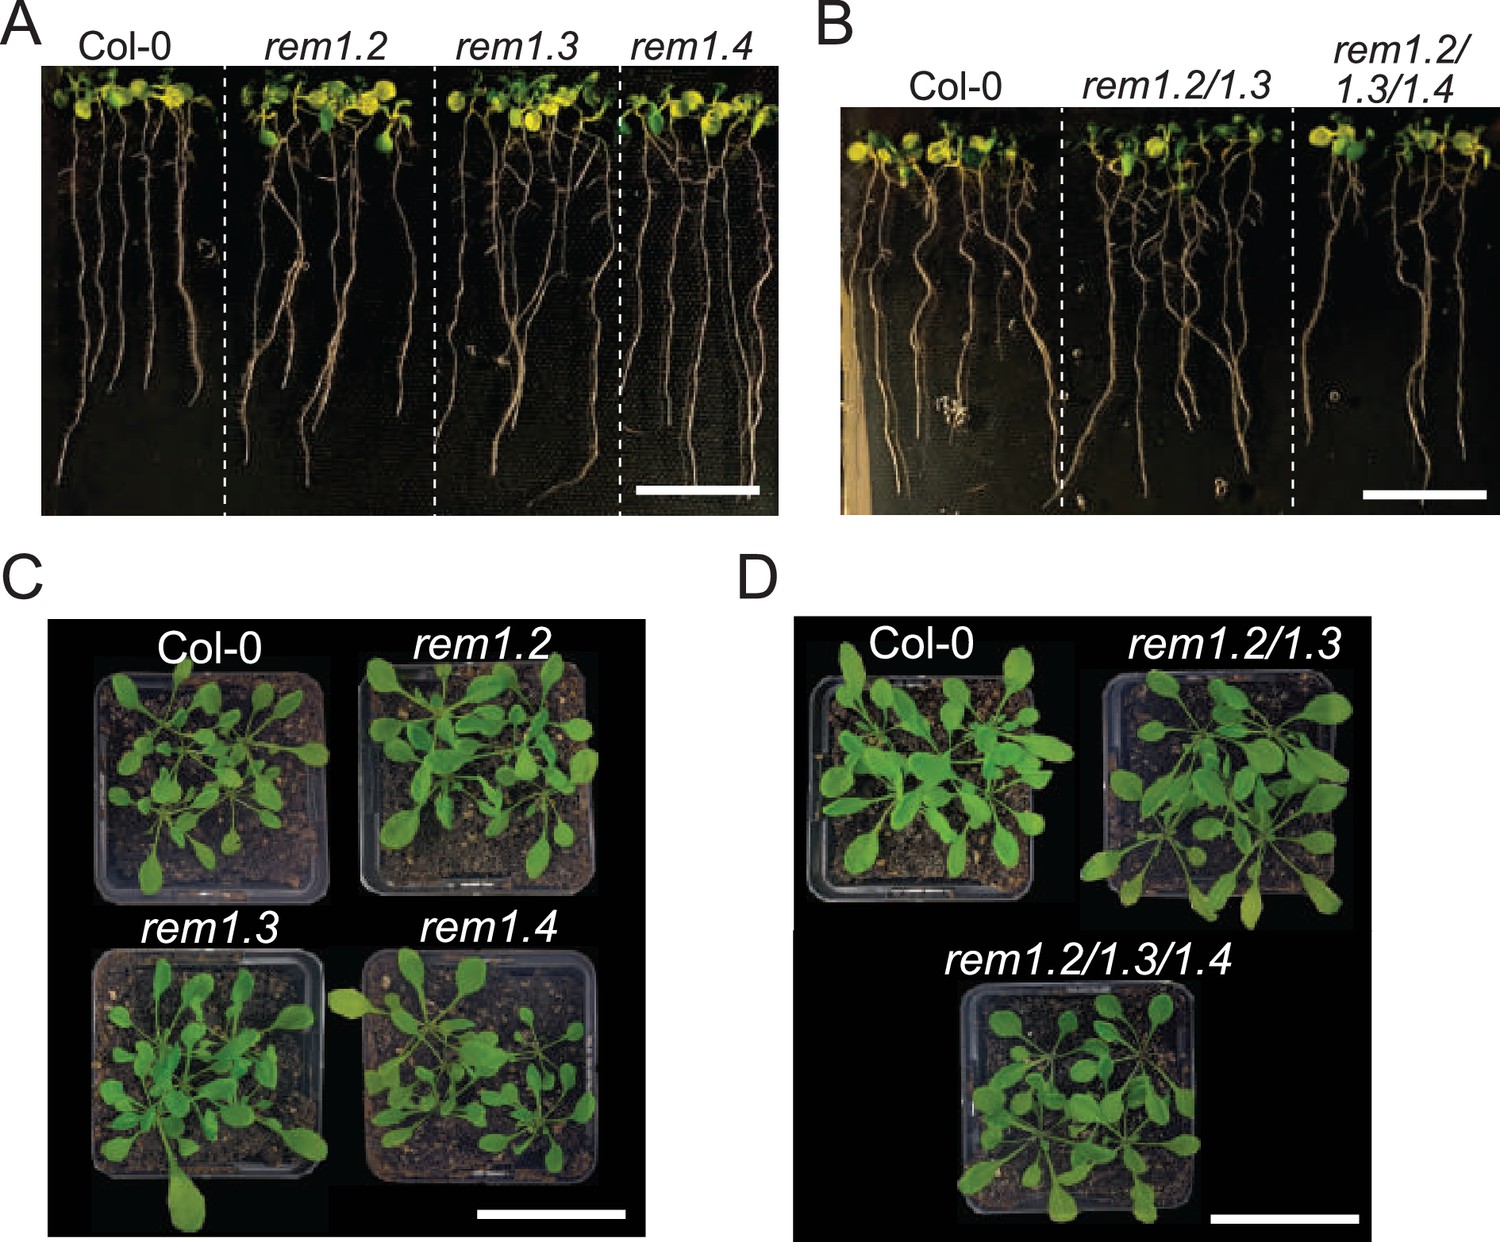
Group 1 REMORINs (REMs) single and multiple knock-out lines do not display any obvious developmental phenotype.
(A) 7-d-old seedlings of Col-0, rem1.2, rem1.3 and rem1.4 single mutants. Neither of the single mutants showed developmental defects. All seedlings were grown on the same plate. Scale bar = 2 cm. (B) 7-d-old seedlings of Col-0, rem1.2 rem1.3 double and rem1.2 rem1.3 rem1.4 triple mutants. rem1.2 rem1.3 nor rem1.2 rem1.3 rem1.4 showed obvious developmental defects. All seedlings were grown on the same plate. Scale bar = 2 cm. (C) 3-wk-old plants of Col-0, rem1.2, rem1.3 and rem1.4 single mutants. Plants were grown together in the same conditions. Scale bar = 5 cm. (D) 3-wk-old plants of Col-0, rem1.2 rem1.3 double and rem1.2 rem1.3 rem1.4 triple mutants. Plants were grown together in the same conditions. Scale bar = 5 cm.
Figure 4—figure supplement 3
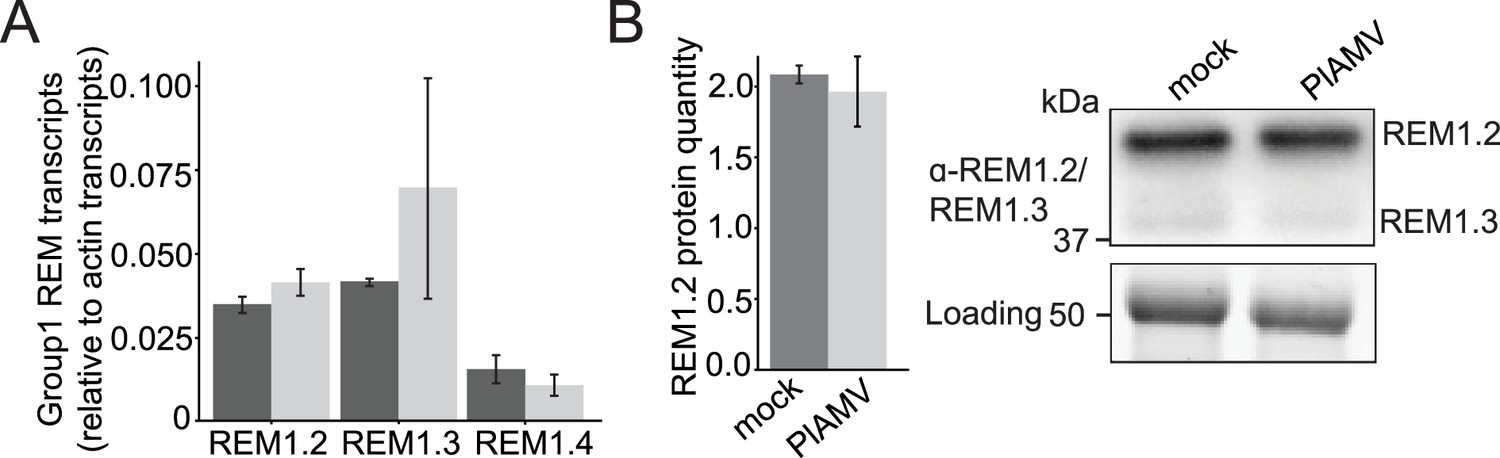
Group 1 REMORINs (REMs) transcript and protein levels are not modified during a plantago asiatica mosaic virus (PlAMV) infection.
(A) Transcript levels of REM1.2, REM1.3, and REM1.4 in leaves infiltrated with either free GFP (dark gray) or PlAMV-GFP (light gray) and harvested 7 d after infection. Three independent experiments were performed, with three independent plants for each condition per experiment. Transcript levels were normalized to housekeeping genes. Statistical significance was determined using a Mann-Whitney test. No significant difference could be deciphered. (B) Left panel: REM1.2 protein levels were determined by quantification of western-blot signals from three independent assays, performed with antibodies raised against REM1.2/1.3. No significant difference could be deciphered using a Mann-Whitney test. Right panel: representative western blot of REM1.2/1.3. Protein loading was monitored by stain-free staining.
-
Figure 4—figure supplement 3—source data 1
Related to Figure 4—figure supplement 3A.
- https://cdn.elifesciences.org/articles/90309/elife-90309-fig4-figsupp3-data1-v1.csv
-
Figure 4—figure supplement 3—source data 2
Original files for western blot analysis displayed in Figure 4—figure supplement 3.
- https://cdn.elifesciences.org/articles/90309/elife-90309-fig4-figsupp3-data2-v1.zip
-
Figure 4—figure supplement 3—source data 3
PDF file containing original western blots for Figure 4—figure supplement 3, indicating the relevant bands and tested conditions.
- https://cdn.elifesciences.org/articles/90309/elife-90309-fig4-figsupp3-data3-v1.zip
Figure 4—figure supplement 4

REM1.2 does not accumulate at plasmodesmata during plantago asiatica mosaic virus (PlAMV) infection.
Confocal images of the secant view of A. thaliana epidermal cells of the rem1.2/mRFP1.2-REM1.2 stained with aniline blue 5 d after infiltration with free RFP (‘mock’) or PlAMV-mCherry Scale bar = 5 µm.
Figure 4—video 1
Example of an spt-PALM stream of Col-0/mEOS3.2-REM1.2.
Figure 5 with 6 supplements
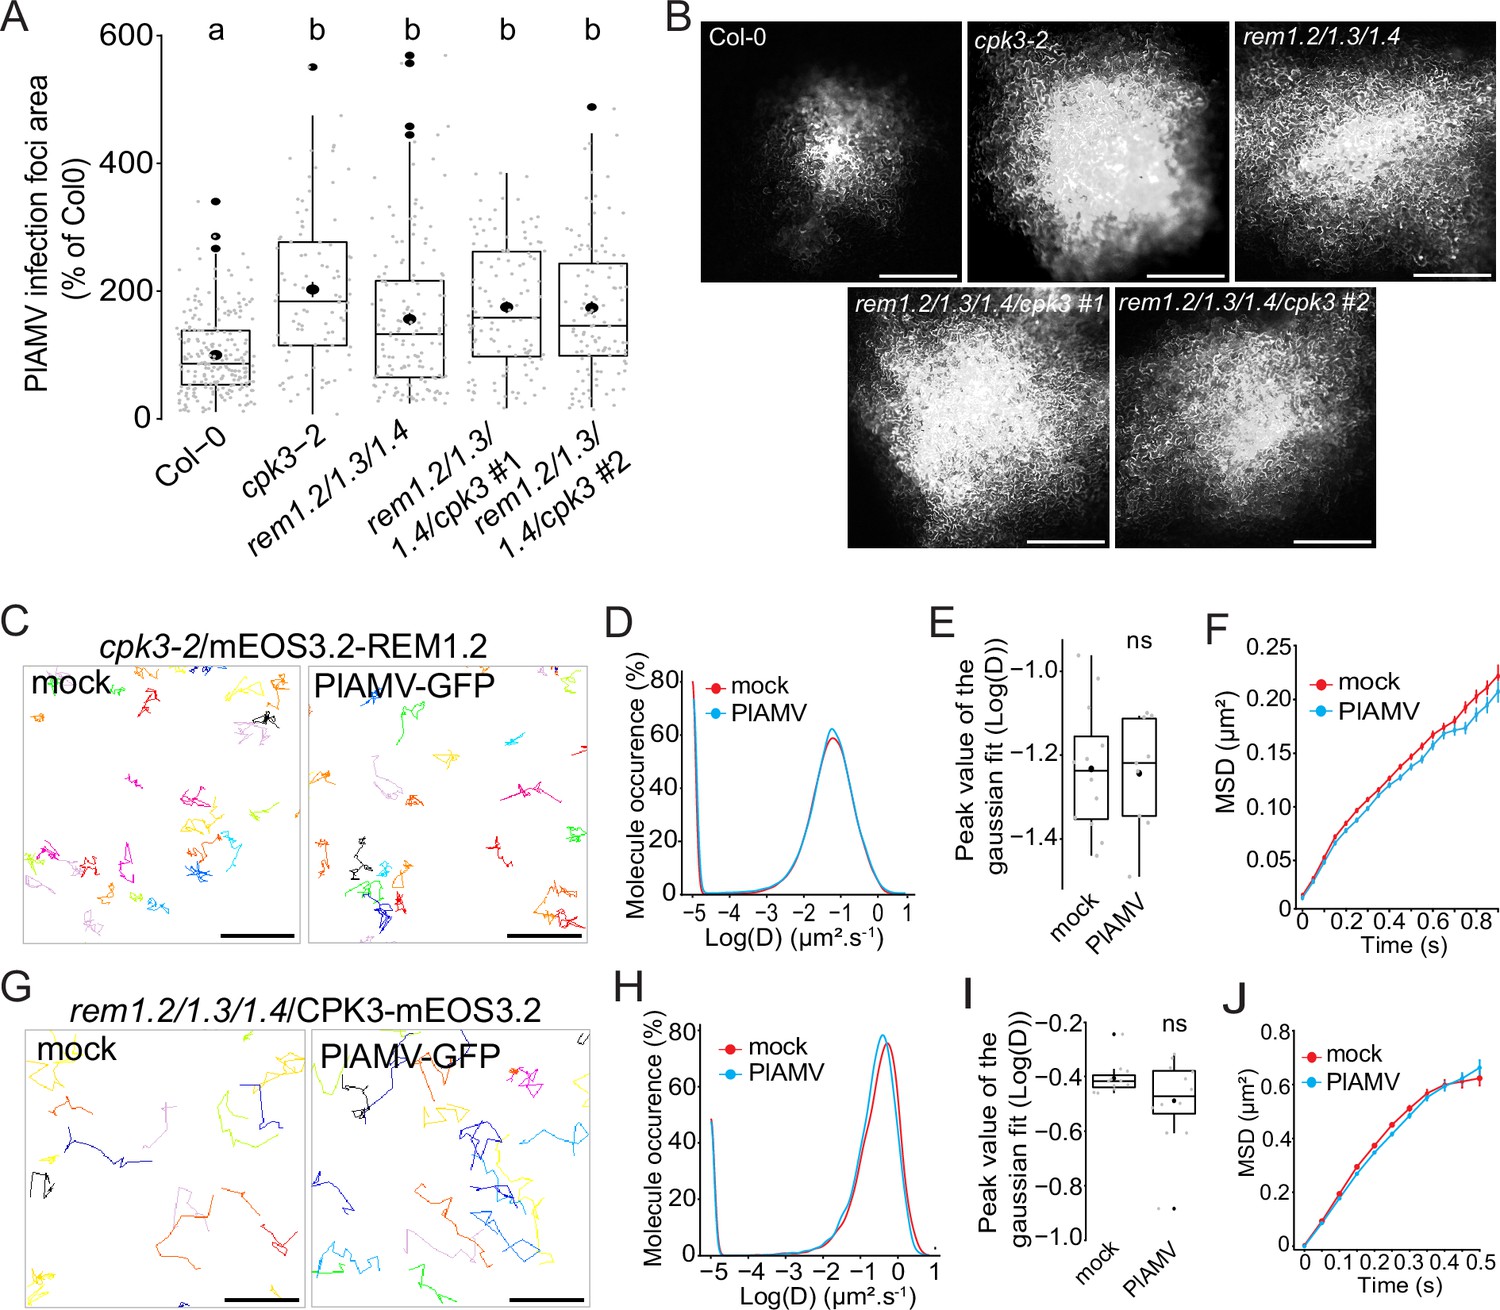
Group 1 REMORINs (REMs) and calcium-dependent protein kinase 3 (CPK3) are in the same functional pathway and regulate each other plasma membrane (PM) diffusion upon plantago asiatica mosaic virus (PlAMV) infection.
(A) Box plots of the mean area of PlAMV-GFP infection foci in cpk3-2, rem1.2 rem1.3 rem1.4 triple mutant and rem1.2 rem1.3 rem1.4/cpk3 #1 and #2 quadruple mutants. Three independent biological repeats were performed, with at least 23 foci per experiment and per genotype. Significant differences were revealed using a one-way ANOVA followed by a Tukey’s multiple comparison test. Letters are used to discriminate between statistically different conditions (p<0.0001). (B) Representative images of PlAMV-GFP infection foci at 5 dpi in the different mutant backgrounds. Scale bar = 500 µm.(C) Representative trajectories of cpk3-2/ProUbi10:mEOS3.2-REM1.2 5 d after infiltration with either free GFP (‘mock’) or PlAMV-GFP. Scale bar = 2 µm. (D) Distribution of the diffusion coefficient (D), represented as log(D) for cpk3-2/ProUbi10:mEOS3.2-REM1.2 5 d after infiltration with either free GFP (‘mock’) or PlAMV-GFP. Data were acquired from at least 20462 trajectories obtained from at least 11 cells over the course of three independent experiments. (E) Box plot representing the mean peak value extracted from the Gaussian fit of the distribution of the diffusion coefficient (D) represented in (D). No significant difference was revealed using a Mann-Whitney test. (F) Mean square displacement (MSD) over time of cpk3-2/ProUbi10:mEOS3.2-REM1.2 5 d after infiltration with free GFP (‘mock’) or PlAMV-GFP. (G) Representative trajectories of rem1.2 rem1.3 rem1.4/ProUbi10:CPK3-mEOS3.2 5 d after infiltration with free GFP (‘mock’) or PlAMV-GFP. Scale bar = 2 µm. (H) Distribution of the diffusion coefficient (D), represented as log(D) for rem1.2 rem1.3 rem1.4/ProUbi10:CPK3-mEOS3.2 5 d after infiltration with free GFP (‘mock’) or PlAMV-GFP. Data were acquired from at least 11724 trajectories obtained from at least 10 cells over the course of three independent experiments. (I) Box plot representing the mean peak value extracted from the Gaussian fit of the distribution of the diffusion coefficient (D) represented in (H). No significant difference was revealed using a Mann-Whitney test. (J) Mean square displacement (MSD) over time of rem1.2 rem1.3 rem1.4/ProUbi10:CPK3-mEOS3.2 5 d after infiltration with free GFP (‘mock’) or PlAMV-GFP.
-
Figure 5—source data 1
Related to Figure 5A.
- https://cdn.elifesciences.org/articles/90309/elife-90309-fig5-data1-v1.csv
-
Figure 5—source data 2
Related to Figure 5D.
- https://cdn.elifesciences.org/articles/90309/elife-90309-fig5-data2-v1.csv
-
Figure 5—source data 3
Related to Figure 5E.
- https://cdn.elifesciences.org/articles/90309/elife-90309-fig5-data3-v1.csv
-
Figure 5—source data 4
Related to Figure 5F.
- https://cdn.elifesciences.org/articles/90309/elife-90309-fig5-data4-v1.csv
-
Figure 5—source data 5
Related to Figure 5H.
- https://cdn.elifesciences.org/articles/90309/elife-90309-fig5-data5-v1.csv
-
Figure 5—source data 6
Related to Figure 5I.
- https://cdn.elifesciences.org/articles/90309/elife-90309-fig5-data6-v1.csv
-
Figure 5—source data 7
Related to Figure 5J.
- https://cdn.elifesciences.org/articles/90309/elife-90309-fig5-data7-v1.csv
Figure 5—figure supplement 1
CRISPR-mediated knock-out of cpk3 in rem1.2 rem1.3 rem1.4 background.
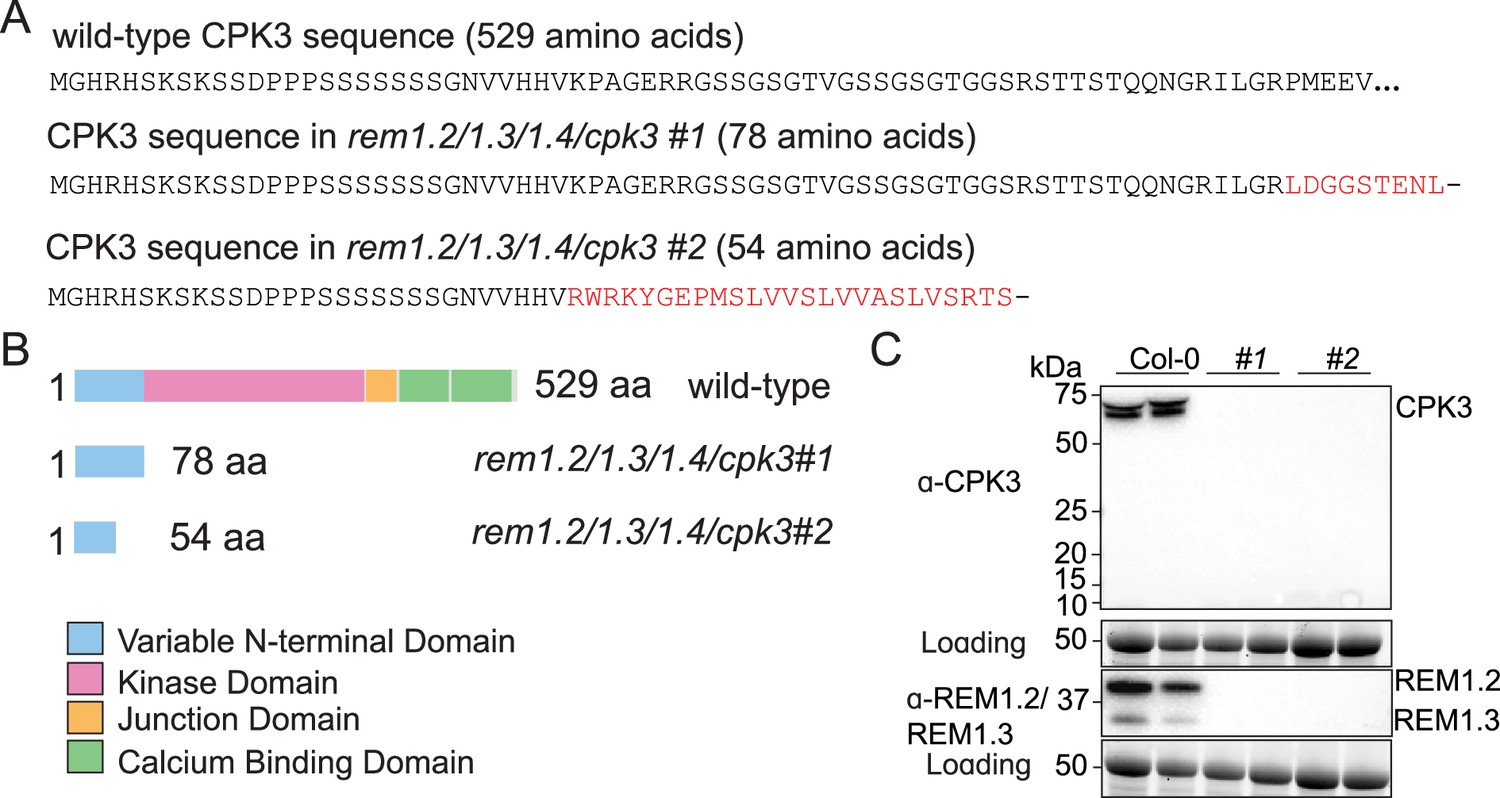
(A) Sequences of wild-type calcium-dependent protein kinase 3 (CPK3) along with the CRISPR-generated mutants in rem1.2 rem1.3 rem1.4 background. In rem1.2 rem1.3 rem1.4 cpk3 #1, an insertion of one adenosine at position 209 bp induced a frameshift leading to an early stop codon at position 234–236 bp (235–237 bp after insertion). In rem1.2 rem1.3 rem1.4/cpk3 #2, a deletion of 121 nucleotides at position 88–208 bp induced a frameshift leading to an early stop codon at position 284–286 bp (163–165 bp after deletion). As a result, the CRISPR mutations led to a truncated CPK3 protein of 78 aa and 54 aa, in rem1.2 rem1.3 rem1.4 cpk3 #1 and rem1.2 rem1.3 rem1.4 cpk3 #2, respectively. (B) Schematic representation of the amino-acid sequence of wild-type and truncated CPK3. The mutations in the CRISPR-generated lines resulted in proteins deprived of the kinase domain, the junction domain, and the calcium-binding domain. (C) Western blots of Col-0 WT and the two CRISPR lines rem1.2 rem1.3 rem1.4 cpk3 #1 and rem1.2 rem1.3 rem1.4 cpk3 #2 using anti-REM1.2/1.3 and anti-CPK3 antibodies. Protein loading was monitored by stain-free staining.
-
Figure 5—figure supplement 1—source data 1
Original files for western blot analysis displayed in Figure 5—figure supplement 1.
- https://cdn.elifesciences.org/articles/90309/elife-90309-fig5-figsupp1-data1-v1.zip
-
Figure 5—figure supplement 1—source data 2
PDF file containing original western blots for Figure 5—figure supplement 1, indicating the relevant bands and tested conditions.
- https://cdn.elifesciences.org/articles/90309/elife-90309-fig5-figsupp1-data2-v1.zip
Figure 5—figure supplement 2
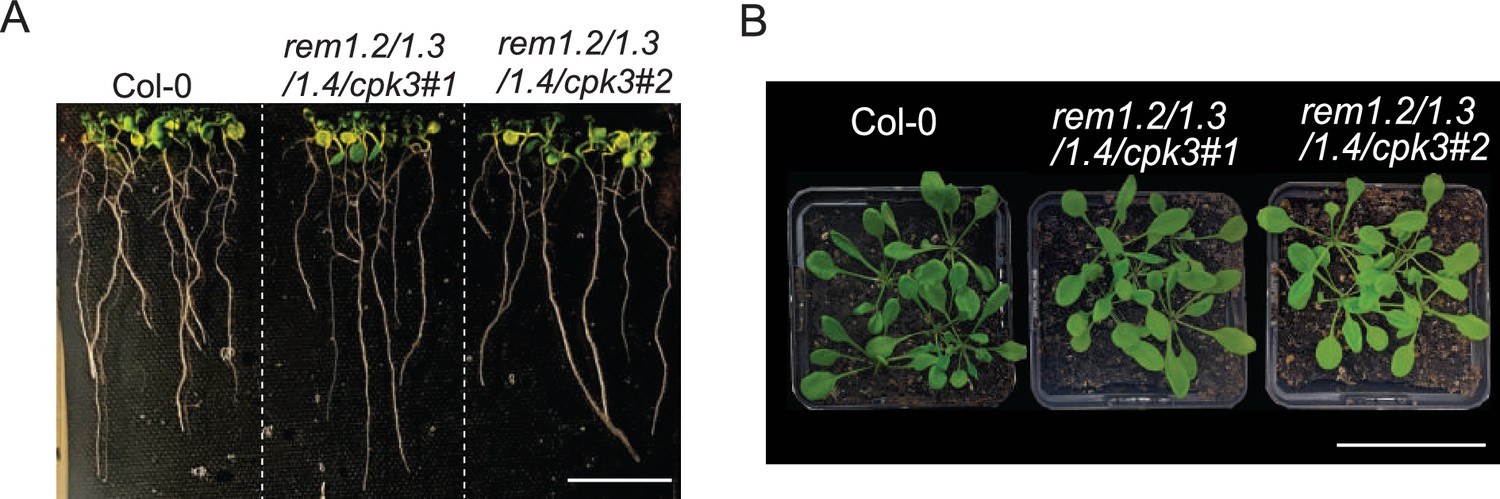
rem1.2 rem1.3 rem1.4 cpk3 quadruple knock-out lines do not display any obvious developmental phenotype.
(A) In vitro growth of 7-d-old seedlings of Col-0, rem1.2 rem1.3 rem1.4 cpk3 #1 and rem1.2 rem1.3 rem1.4 cpk3 #2. All seedlings were grown on the same plate. Scale bar = 2 cm. (B) Growth on soil of 3-wk-old plants of Col-0, rem1.2 rem1.3 rem1.4 cpk3 #1 and rem1.2 rem1.3 rem1.4 cpk3 #2. Plants were grown together under the same conditions. Scale bar = 5 cm.
Figure 5—figure supplement 3
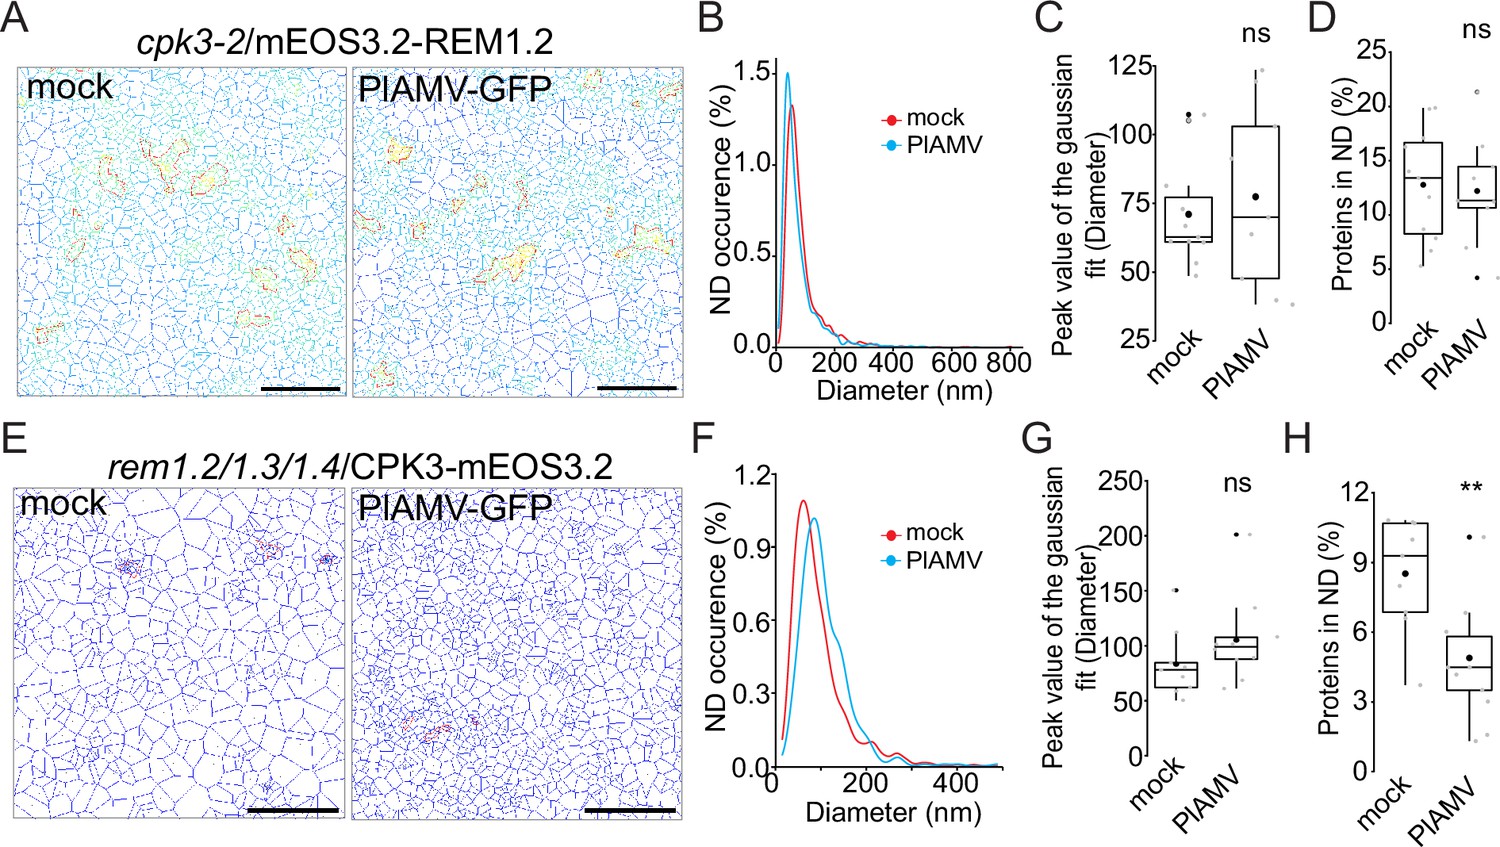
calcium-dependent protein kinase 3 (CPK3) and group1 REMORIN (REM) role in each other plasma membrane (PM) nano-organization during plantago asiatica mosaic virus (PlAMV) infection.
(A) Voronoi tessellation illustration of cpk3-2/ProUbi10:mEOS3.2-REM1.2 5 d after infiltration with free GFP (‘mock’) or PlAMV-GFP. Nanodomains (ND) are circled in red. Scale bar = 2 µm. (B) Distribution of the ND diameter of cpk3-2/ProUbi10:mEOS3.2-REM1.2 5 d after infiltration with free GFP (‘mock’) or PlAMV-GFP. (C) Box plot representing the mean peak value extracted from the Gaussian fit of the panel B. No significant difference was revealed using a Mann-Whitney test. (D) Box plot of the proportion of cpk3-2/ProUbi10:mEOS3.2-REM1.2 detections found in ND 5 d after infiltration with free GFP (‘mock’) or PlAMV-GFP. No significant difference was revealed using a Mann-Whitney test. (E) Voronoi tessellation illustration of rem1.2 rem1.3 rem1.4/ProUbi10:CPK3-mEOS3.2 5 d after infiltration with free GFP (‘mock’) or PlAMV-GFP. ND are circled in red. Scale bar = 2 µm. (F) Distribution of the ND diameter of rem1.2 rem1.3 rem1.4/ProUbi10:CPK3-mEOS3.2 5 d after infiltration with free GFP (‘mock’) or PlAMV-GFP. (G) Box plot representing the mean peak value extracted from the Gaussian fit of the panel F. No significant difference was revealed using a Mann-Whitney test. (H) Boxplot of the proportion of rem1.2 rem1.3 rem1.4/ProUbi10:CPK3-mEOS3.2 detections found in ND 5 d after infiltration with free GFP (‘mock’) or PlAMV-GFP. Significant difference was revealed using a Mann-Whitney test, **p<0.001.
-
Figure 5—figure supplement 3—source data 1
Related to Figure 5—figure supplement 3B.
- https://cdn.elifesciences.org/articles/90309/elife-90309-fig5-figsupp3-data1-v1.csv
-
Figure 5—figure supplement 3—source data 2
Related to Figure 5—figure supplement 3C.
- https://cdn.elifesciences.org/articles/90309/elife-90309-fig5-figsupp3-data2-v1.csv
-
Figure 5—figure supplement 3—source data 3
Related to Figure 5—figure supplement 3D.
- https://cdn.elifesciences.org/articles/90309/elife-90309-fig5-figsupp3-data3-v1.csv
-
Figure 5—figure supplement 3—source data 4
Related to Figure 5—figure supplement 3F.
- https://cdn.elifesciences.org/articles/90309/elife-90309-fig5-figsupp3-data4-v1.csv
-
Figure 5—figure supplement 3—source data 5
Related to Figure 5—figure supplement 3G.
- https://cdn.elifesciences.org/articles/90309/elife-90309-fig5-figsupp3-data5-v1.csv
-
Figure 5—figure supplement 3—source data 6
Related to Figure 5—figure supplement 3H.
- https://cdn.elifesciences.org/articles/90309/elife-90309-fig5-figsupp3-data6-v1.csv
Figure 5—figure supplement 4

REM1.2 diffusion is increased upon co-expression with CPK3CA but not with CPK3CA-G2A.
(A) Representative trajectories of ProUbi10:mEOS3.2-REM1.2 2 d after infiltration or co-infiltration with ProUbi10:CPK3CA-mRFP1.2 or ProUbi10:CPK3CA-G2A-mRFP1.2 in N. benthamiana leaves. Scale bar = 2 µm (B) Box plot of the mean peak value extracted from the Gaussian fit of log(D) distribution. Significant difference was revealed using a Mann-Whitney test. Different letters indicate statistical differences (p<0.01).
-
Figure 5—figure supplement 4—source data 1
Related to Figure 5—figure supplement 4B.
- https://cdn.elifesciences.org/articles/90309/elife-90309-fig5-figsupp4-data1-v1.csv
Figure 5—figure supplement 5
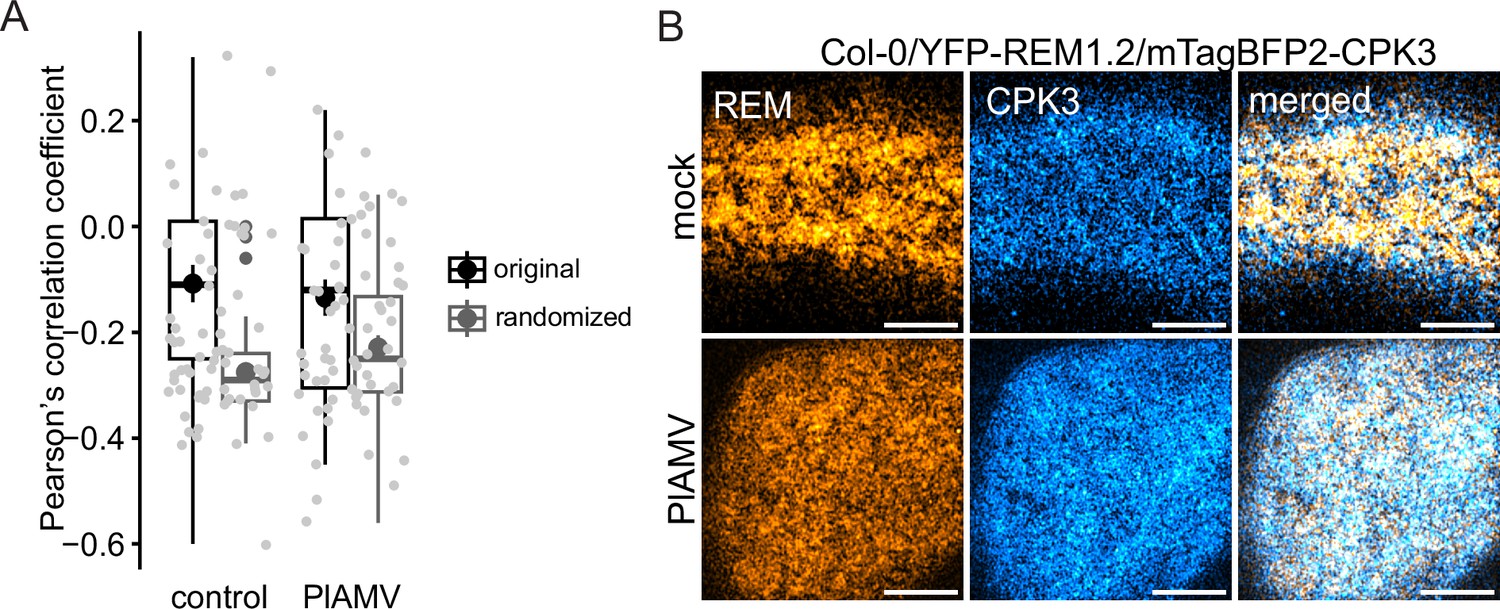
Plantago asiatica mosaic virus (PlAMV) infection does not modify calcium-dependent protein kinase 3 (CPK3) and group1 REMORIN (REM) colocalization coefficient.
(A) Box plot of Pearson’s correlation coefficient between ProREM1.2:YFP-REM1.2 and ProUbi10:mTagBFP2-CPK3 5 d after infiltration of Col-0/ProREM1.2:YFP-REM1.2/ProUbi10:mTagBFP2-CPK3 with free RFP (‘mock’) or PlAMV-RFP. No significant difference could be deciphered using a Student t-test. The colocalization analysis was repeated upon 90° rotation of the mTagBFP2 channel (‘randomized’). (B) Representative confocal images of the surface view of A. thaliana epidermal cells of Col-0 /ProREM1.2:YFP-REM1.2/ProUbi10:mTagBFP2-CPK3. Scale bar = 5 µm.
Figure 5—video 1
Example of an spt-PALM stream of mEOS3.2-REM1.2 transiently expressed in N. benthamiana.
Additional files
-
Supplementary file 1
Primers used in this study.
- https://cdn.elifesciences.org/articles/90309/elife-90309-supp1-v1.docx
-
MDAR checklist
- https://cdn.elifesciences.org/articles/90309/elife-90309-mdarchecklist1-v1.docx
Download links
A two-part list of links to download the article, or parts of the article, in various formats.
Downloads (link to download the article as PDF)
Open citations (links to open the citations from this article in various online reference manager services)
Cite this article (links to download the citations from this article in formats compatible with various reference manager tools)
Interdependence of plasma membrane nanoscale dynamics of a kinase and its cognate substrate underlies Arabidopsis response to viral infection
eLife 12:RP90309.
https://doi.org/10.7554/eLife.90309.3


