Atypical local and global biological motion perception in children with attention deficit hyperactivity disorder
- Peking University Sixth Hospital, Peking University Institute of Mental Health, National Clinical Research Center for Mental Disorders (Peking University Sixth Hospital), NHC Key Laboratory of Mental Health (Peking University), China
- State Key Laboratory of Brain and Cognitive Science, Institute of Psychology, Chinese Academy of Sciences, China
- Department of Psychology, University of Chinese Academy of Sciences, China
Figures
Figure 1
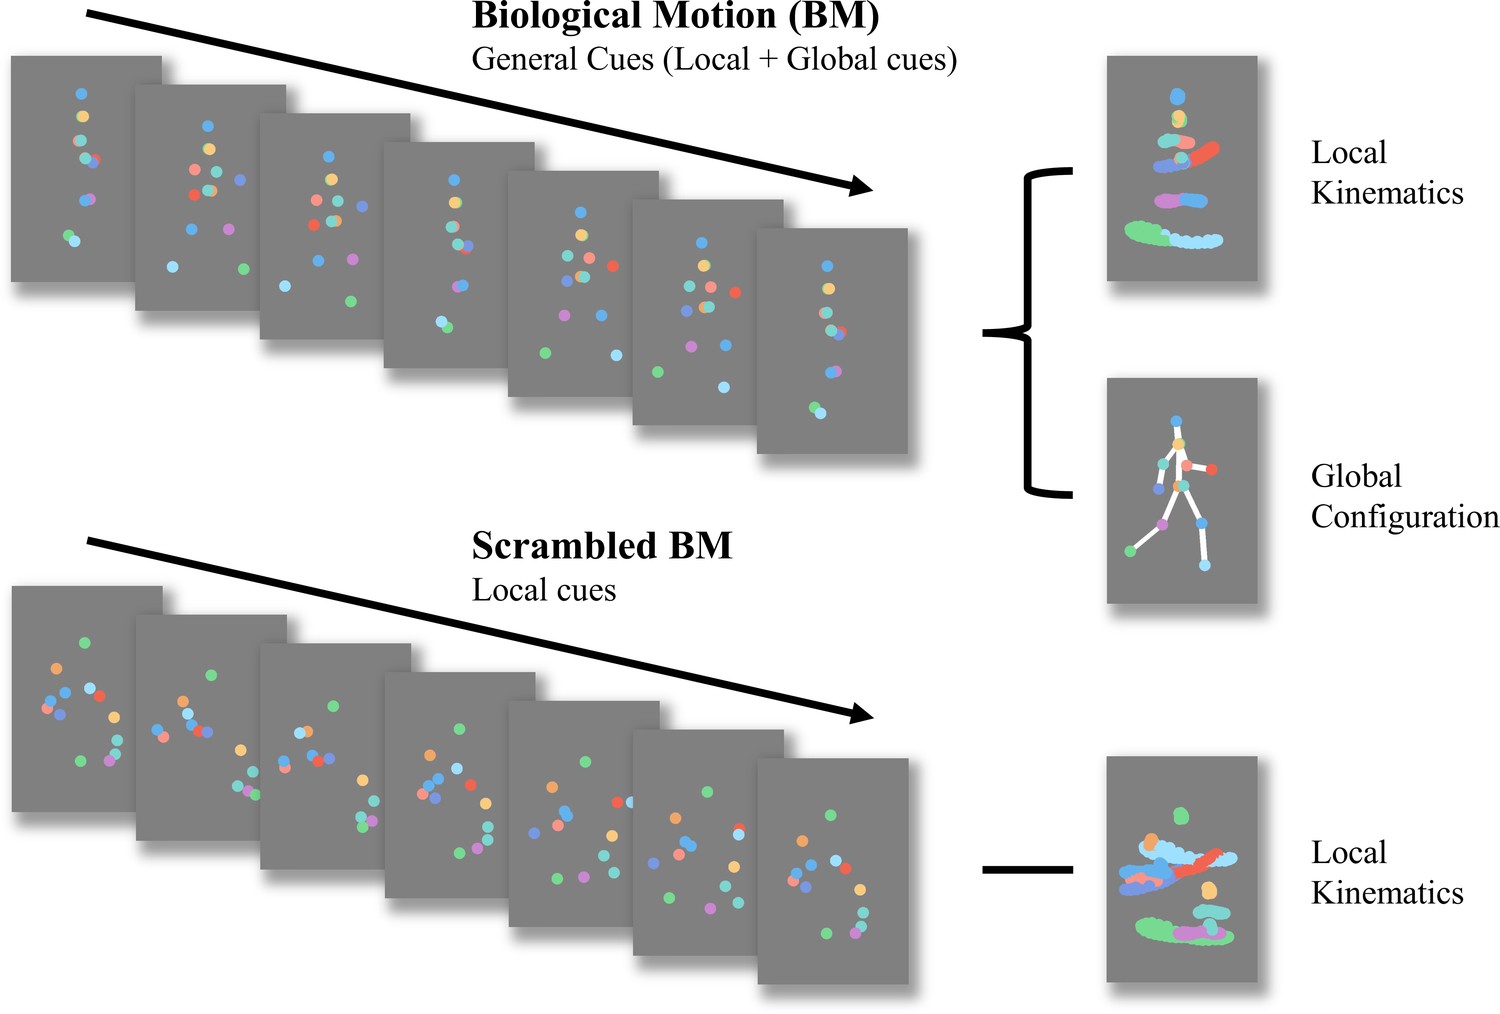
Schematic representation of biological motion (BM) and scrambled BM sequence.
Intact walker contains information of local kinematics and global configuration. Local kinematics refers to the motion tracks of each critical joint illustrated by the chromatic dot. Global configuration is composed of the relative locations of each joint. In the scrambled BM sequence, global configuration cues have been removed, but local kinematics have been retained. (Figure reconstructed from Wang et al., 2018).
Figure 2
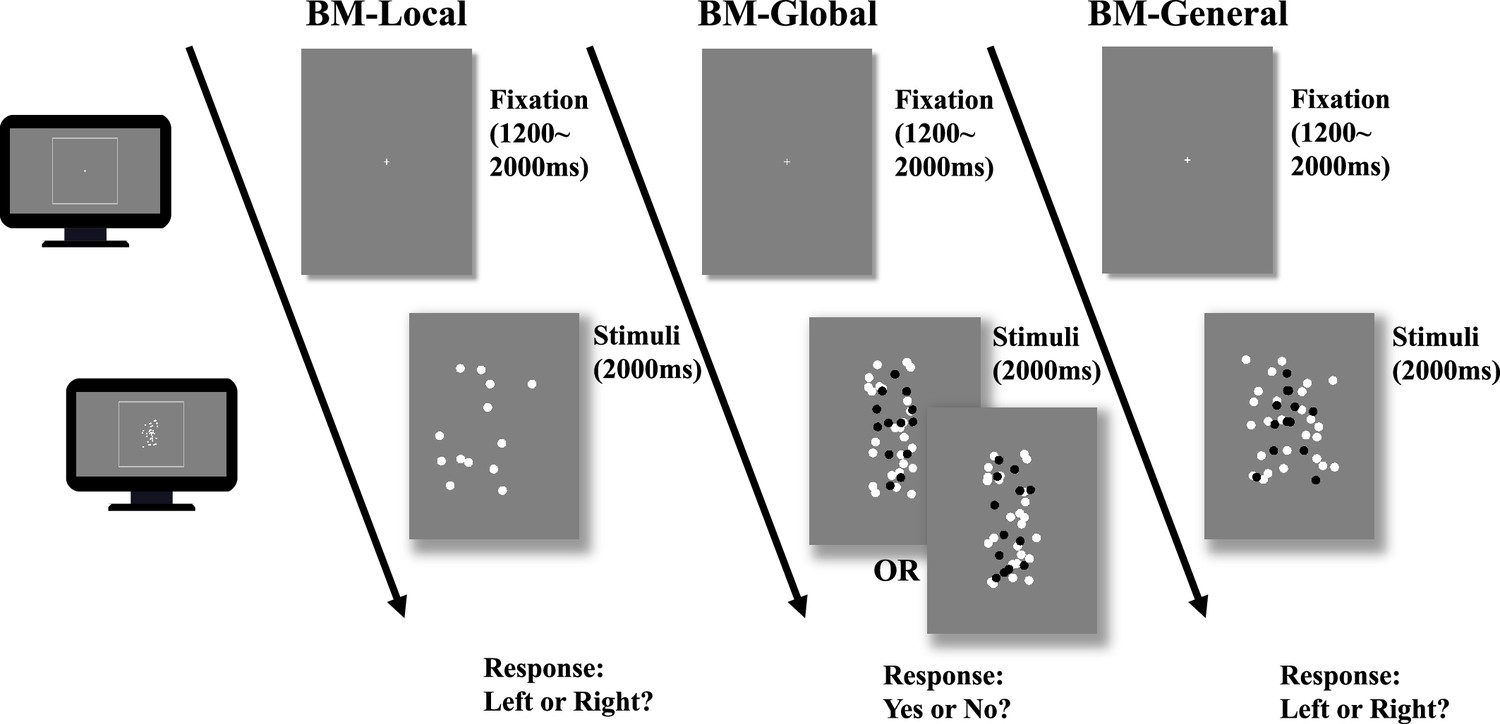
Illustration of the trial sequence.
In biological motion (BM)-Local, a monitor displayed scrambled BM sequences. Participants only judged the facing direction of the scrambled walker using local BM cues. In BM-Global, each trial only showed an intact or scrambled walker (black dots in the figure) embedded within a mask containing local BM cues. Because the two conditions contained the same local cues that were also present in the mask, the participant must rely on global BM cues to determine whether an intact walker was present in the mask. The figure shows one of five possible directions the intact walker could face (i.e. facing participants). In BM-General, the stimuli sequence consisted of an intact walker (black dots) and a mask containing similar target local cues, and children judged the direction the walker was facing using general BM cues (local +global). Dots in the figure are rendered in black for better illustration but were displayed in white in the actual experiments.
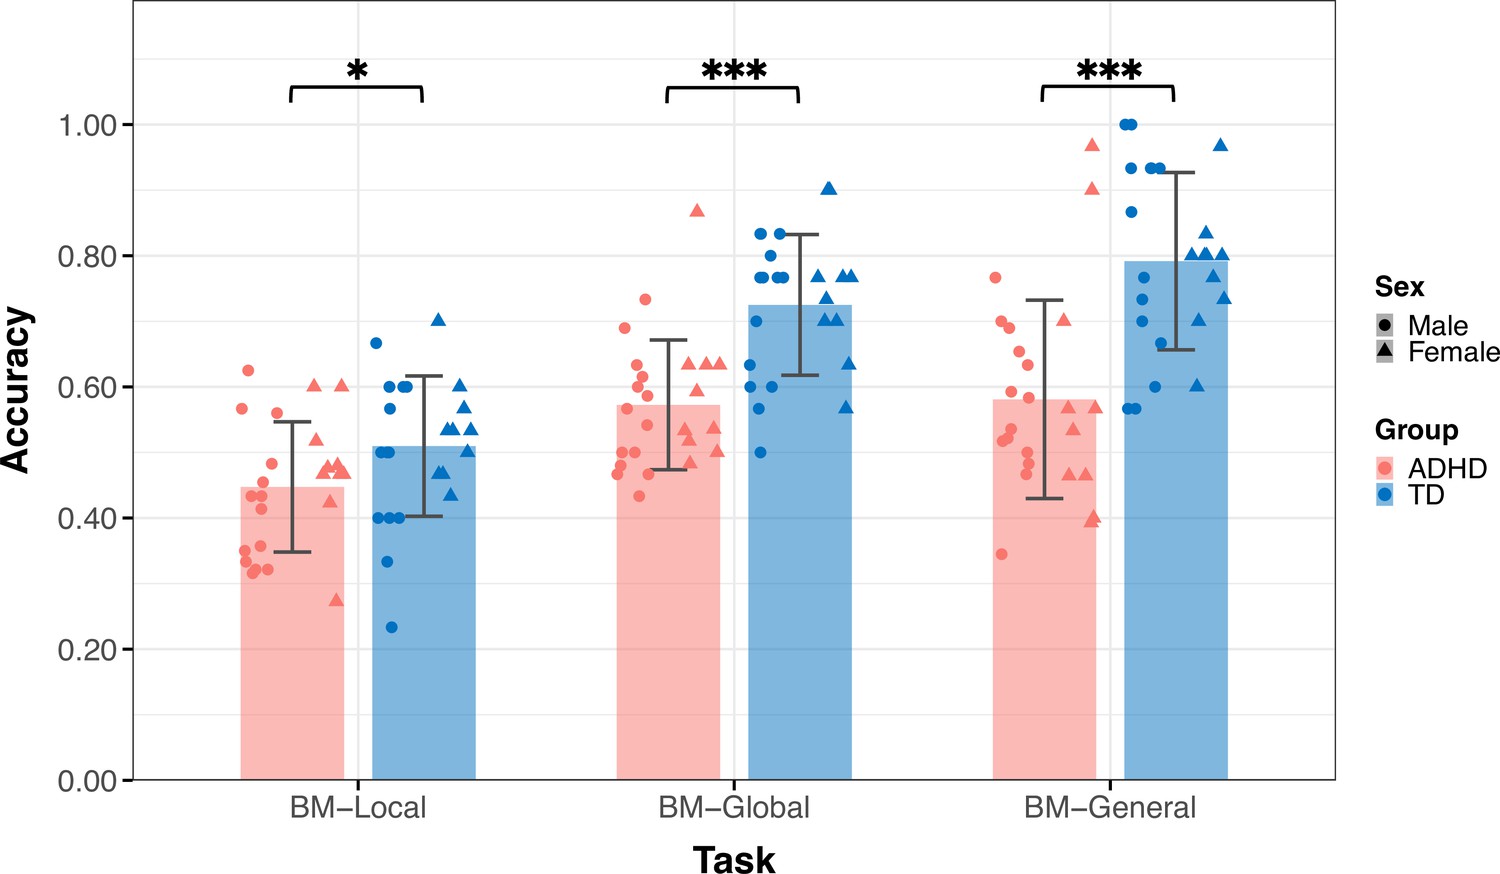
Figure 3
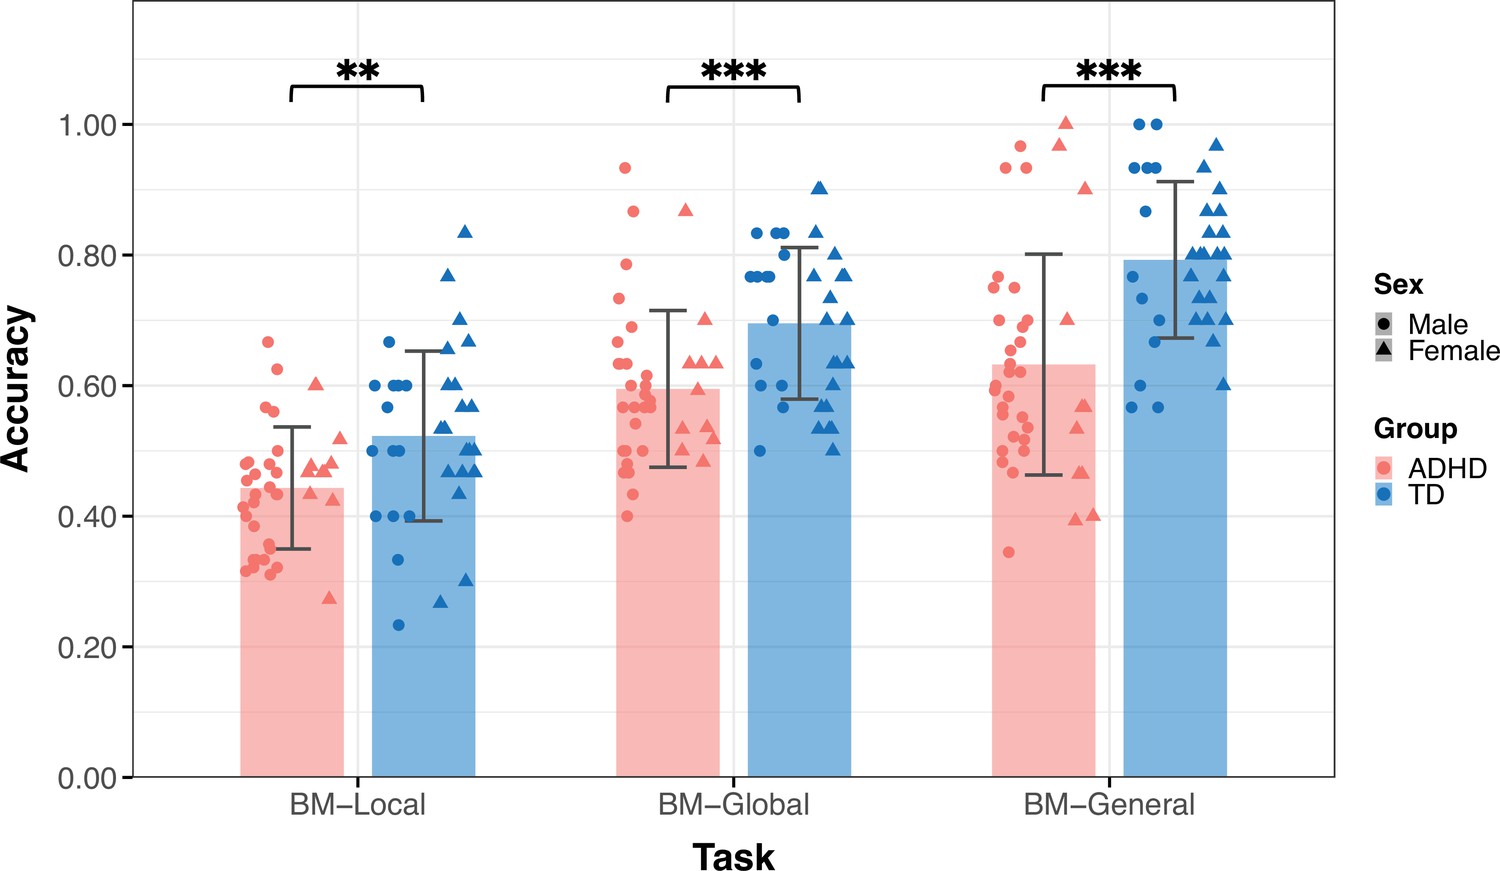
The mean accuracy of the three tasks.
Typically developing (TD) children had higher accuracies than children with attention deficit hyperactivity disorder (ADHD) in the three tasks in Experiment 1. Error bars show standard deviations. TD group: n = 36, ADHD group: n = 39; two-sample t-tests; **p<0.01, ***p<0.001.
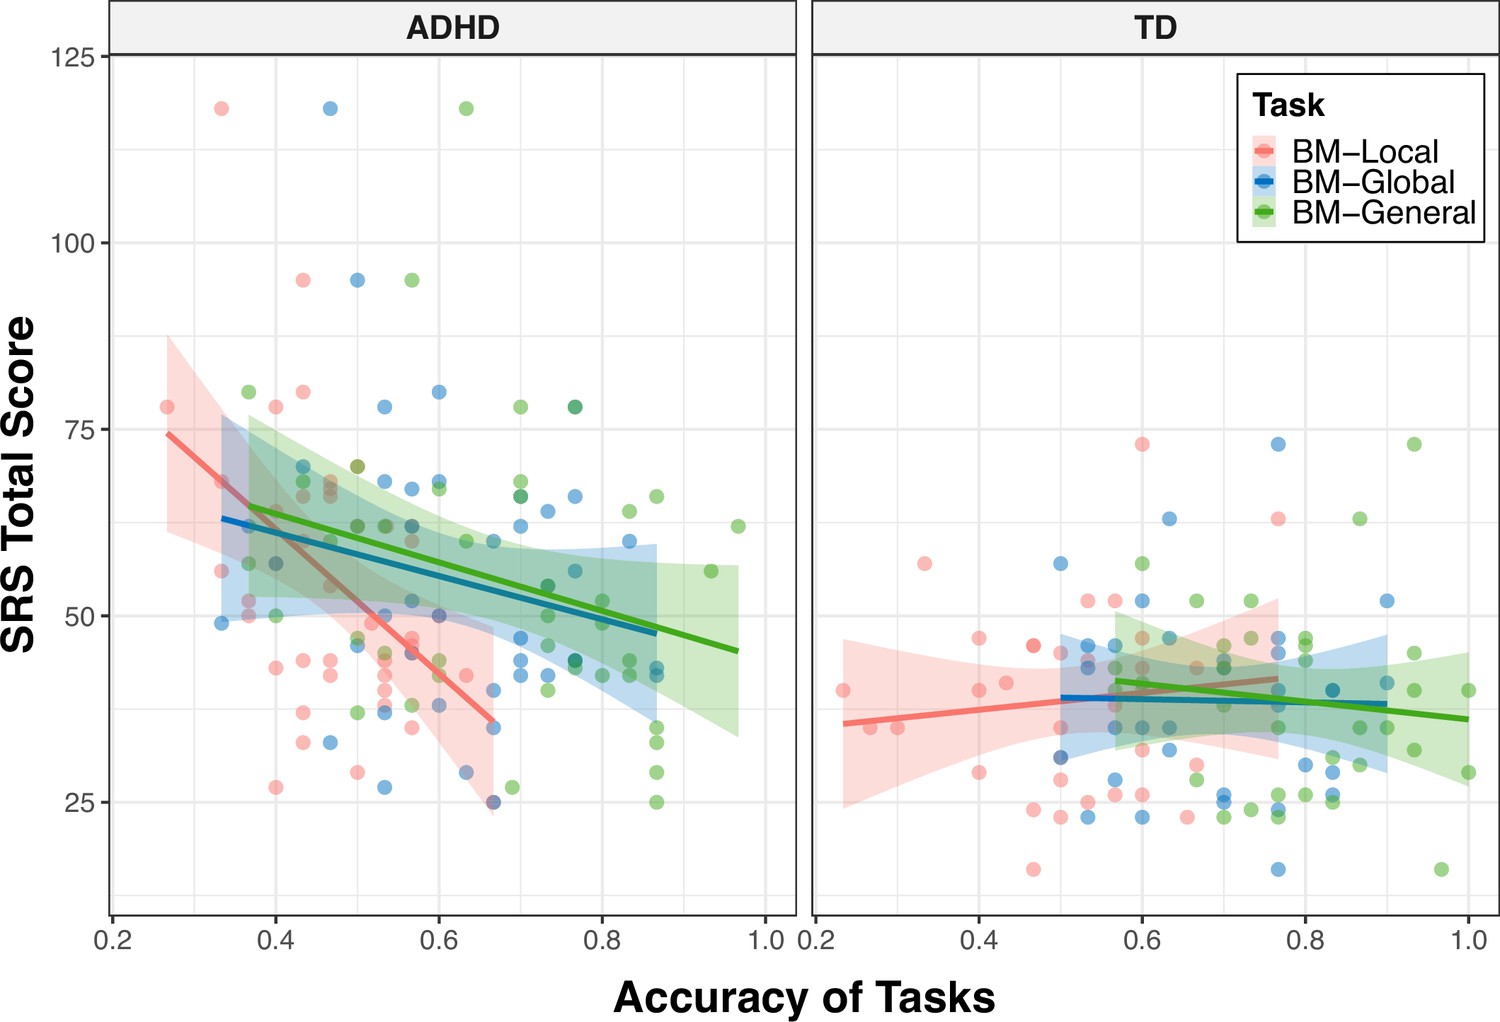
Figure 4
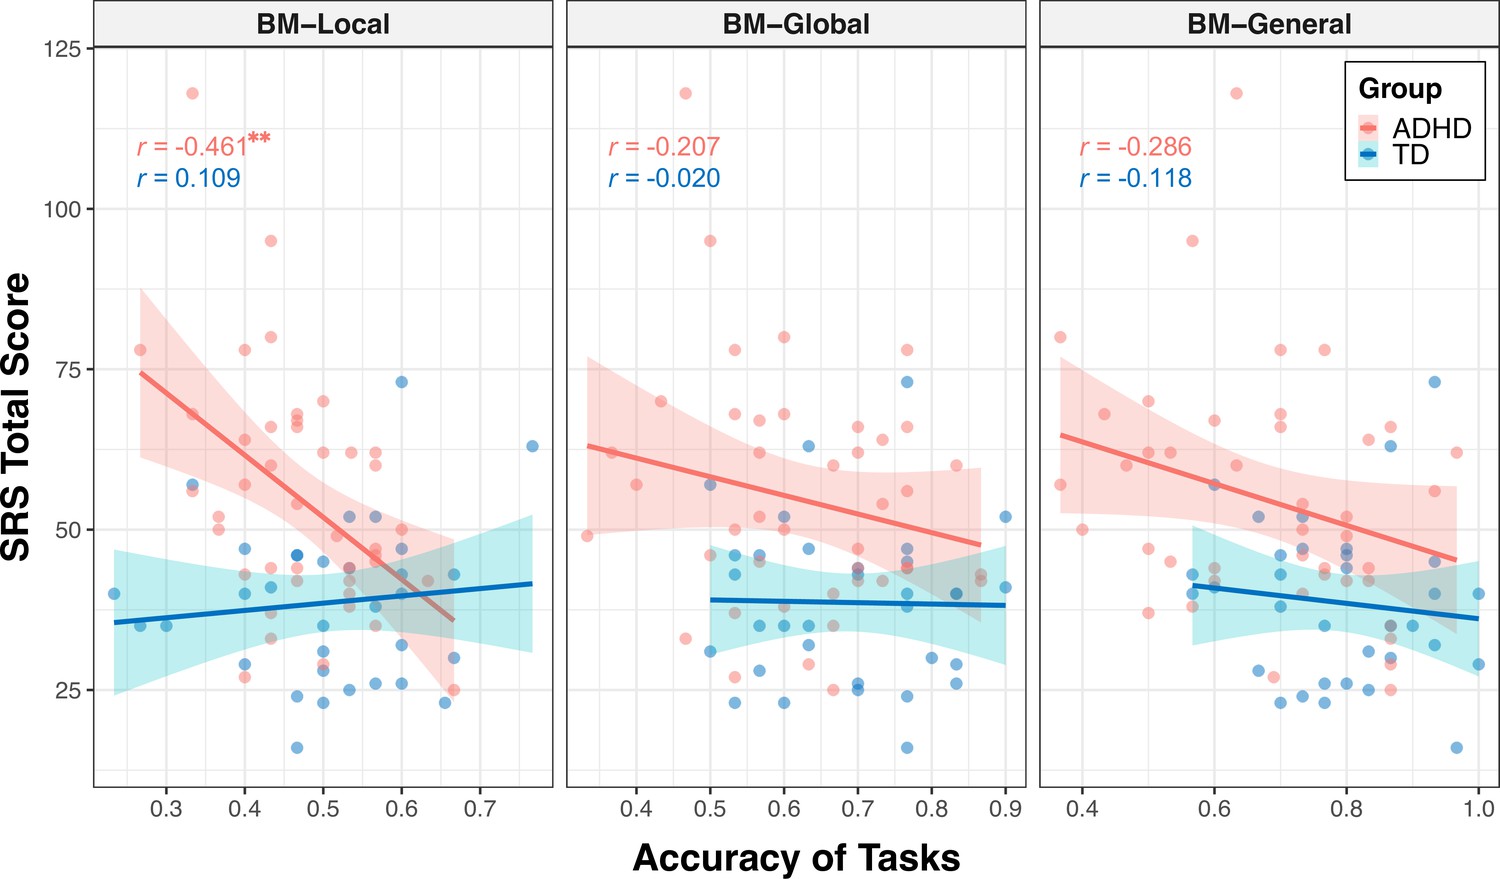
Correlations between response accuracies and social responsiveness scale (SRS) total score.
The ability to process local cues is significantly correlated with the SRS total score in the attention deficit hyperactivity disorder (ADHD) group. The shading represents the 95% confidence interval. **FDR-corrected p<0.01.
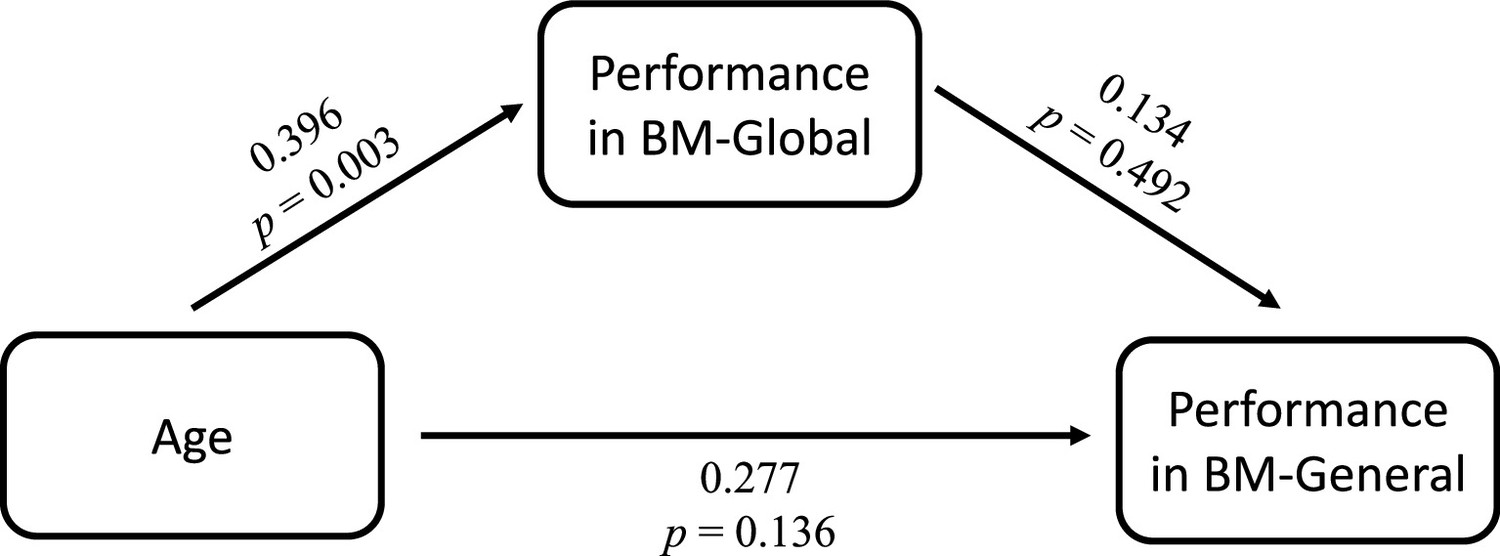
Figure 5 with 1 supplement
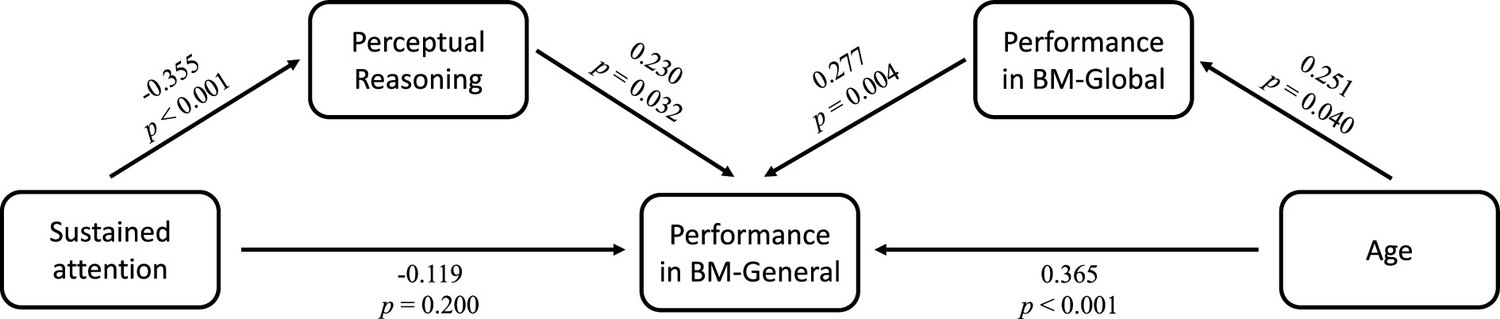
Factors influencing biological motion (BM) perception in attention deficit hyperactivity disorder (ADHD) children.
Post hoc path analysis confirmed that the effect of sustained attention on performance in BM-General was entirely mediated by Perceptual Reasoning, and the ability of global BM processing partly mediated the effect of age on performance in BM-General.
Figure 5—figure supplement 1
Factors influencing biological motion (BM) perception in typically developing (TD) children.
No statistically significant mediator effect was found in path analysis.
Appendix 1—figure 1
The mean accuracy of the three tasks (subsampled balanced data).
Typically developing (TD) children had higher accuracies than children with attention deficit hyperactivity disorder (ADHD) in three tasks in Experiment 1. Error bars show standard deviations. TD group: n = 24, ADHD group: n = 24; two-sample t-tests; *p<0.05; ***p<0.001.
Appendix 2—figure 1
Correlations between the response accuracies and social responsiveness scale (SRS) total score.
The shading represents the 95% confidence interval.
Appendix 2—figure 2
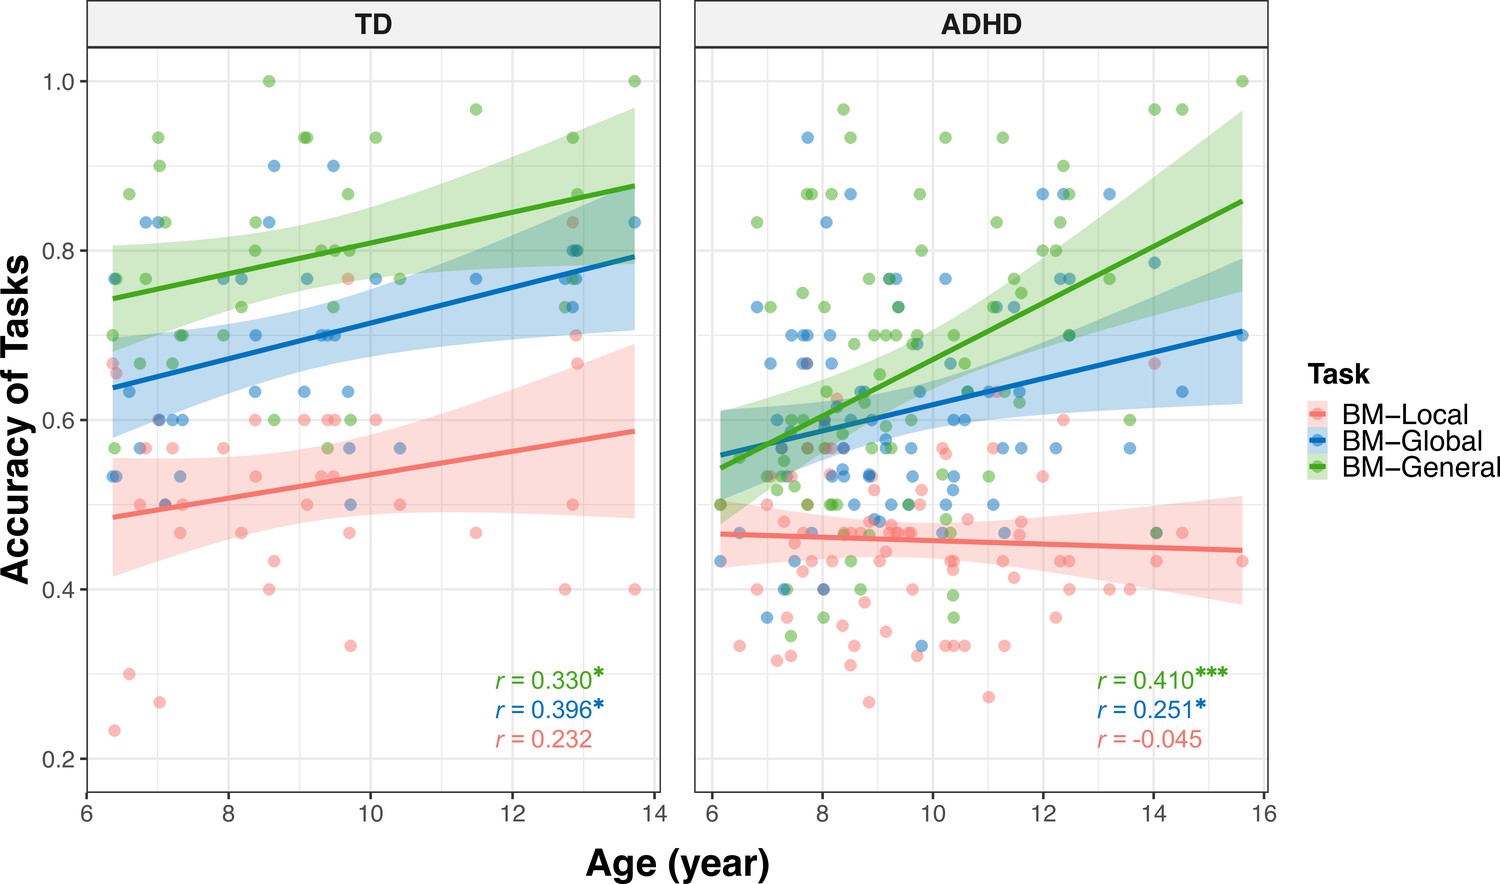
Correlations between the response accuracies and age (showed by group).
The shading represents the 95% confidence interval. * non-corrected p<0.05, *** non-corrected p<0.001.
Appendix 2—figure 3
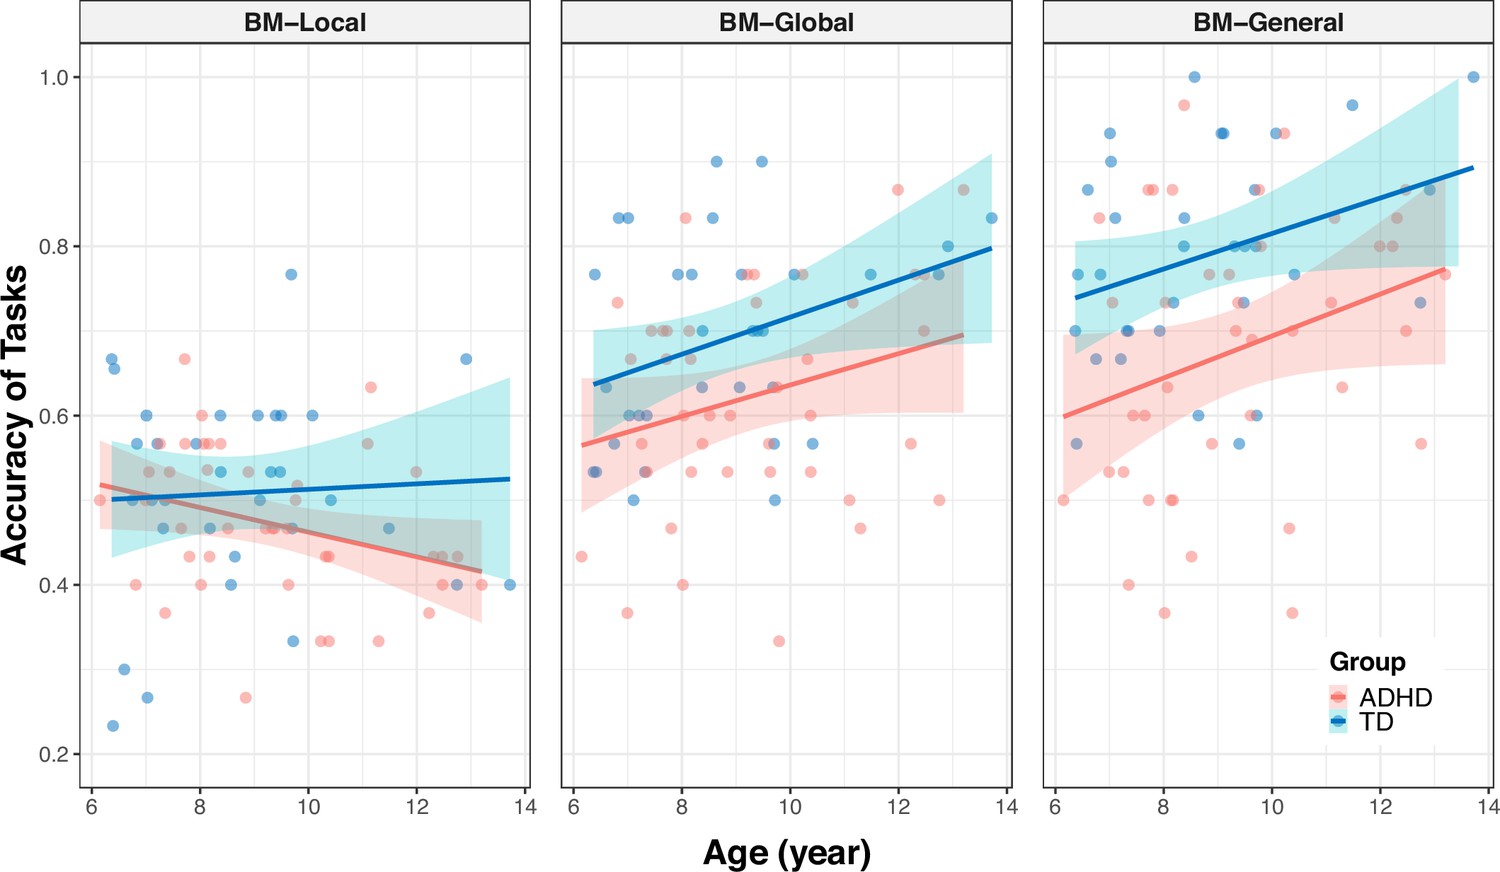
Correlations between the response accuracies and age (showed by task).
The shading represents the 95% confidence interval.
Videos
Video 1
An intact walker without a mask.
The dots in the video are rendered in chromatic colors for better illustration and displayed in white in the actual experiments.
Video 2
An example of biological motion (BM)-Local (a scrambled walker without a mask).
The chromatic dots in this video correspond to the major joints of the intact walker in Video 1 and are displayed in white in the actual experiments.
Video 3
An example of biological motion (BM)-Global (an intact or scrambled walker with a mask).
The chromatic dots in this video correspond to the major joints of the intact walker in Video 1 and are displayed in white in the actual experiments.
Video 4
Intact walkers facing five directions in biological motion (BM)-Global.
The dots in this video are rendered in black for better illustration and displayed in white in the actual experiments.
Video 5
The example of biological motion (BM)-General (an intact walker with a mask).
The chromatic dots in this video correspond to the major joints of the intact walker in Video 1 and are displayed in white in the actual experiments.
Tables
Table 1
Demographic characteristics of typically developing (TD) and attention deficit hyperactivity disorder (ADHD) groups.
| Experiment 1 | p-value | Experiment 2 | p-value | |||
|---|---|---|---|---|---|---|
| TD | ADHD | TD | ADHD | |||
| Sample | 36 | 39 | 33 | 42 | ||
| Age (years) | 9.09±2.18 | 9.88±2.23 | 0.126 | 8.75±1.94 | 9.34±1.89 | 0.191 |
| Sex ratio (% male) | 38.89% | 71.79% | 0.004 | 42.42% | 64.28% | 0.059 |
Table 2
The correlation between the ability of local biological motion (BM) processing and the subdimensions of social responsiveness scale (SRS) in attention deficit hyperactivity disorder (ADHD) children.
| Correlation coefficient (r) | FDR-corrected p-value | |
|---|---|---|
| Social awareness | -0.333 | 0.039 |
| Social cognition | -0.416 | 0.020 |
| Social communication | -0.381 | 0.022 |
| Social motivation | -0.406 | 0.020 |
| Autistic mannerisms | -0.245 | 0.117 |
Table 3
Coefficients and summaries of models a-f.
| Model | Predictor | Standardised coefficient | 95% confidence interval | T statistic | p-value | R square | Std. error of the estimate* |
|---|---|---|---|---|---|---|---|
| Model a | No significant variable | — | — | — | — | — | — |
| Model b | age | 0.251 | [0.033, 0.469] | 2.289 | 0.025 | 0.063 | 0.974 |
| Model c | age | 0.365 | [0.172, 0.559] | 3.759 | <0.001 | 0.339 | 0.829 |
| Perceptual Reasoning | 0.271 | [0.082, 0.459] | 2.862 | 0.005 | |||
| ACCBM-Global | 0.290 | [0.097, 0.484] | 2.987 | 0.004 | |||
| Model d | No significant variable | — | — | — | — | — | — |
| Model e | age | 0.396 | [0.076, 0.716] | 2.515 | 0.017 | 0.157 | 0.932 |
| Model f | age | 0.330 | [0.001, 0.659] | 2.039 | 0.049 | 0.109 | 0.958 |
-
*
Std. error of the estimate is the standard deviation of the error term, and is the square root of the Mean Square Residual (or Error).
Appendix 2—table 1
Coefficients and summaries of models for the relationship between social responsiveness scale (SRS) total score and biological motion (BM) processing.
| Model | Predictor | Standardised coefficient | 95% confidence interval | T statistic | p-value | R square | Std. error of the estimate* |
|---|---|---|---|---|---|---|---|
| Model 1†: SRS = β0 + β1 * ACCBM-Local + β2 * D + β3 * (ACCBM-Local * D) | ACCBM-Local | 0.066 | [–0.190, 0.322] | 0.513 | 0.609 | 0.328 | 0.837 |
| D | 0.821 | [0.427, 1.215] | 4.151 | <0.001 | |||
| ACCBM-Local * D | –0.629 | [-1.030,–0.228] | –3.127 | 0.003 | |||
| Model 2†: SRS = β0 + β1 * ACCBM-Global + β2 * D + β3 * (ACCBM-Global * D) | ACCBM-Global | –0.015 | [–0.360, 0.329] | –0.090 | 0.929 | 0.226 | 0.898 |
| D | 0.845 | [0.413, 1.277] | 3.898 | <0.001 | |||
| ACCBM-Global * D | –0.195 | [–0.636, 0.246] | –0.881 | 0.381 | |||
| Model 3†: SRS = β0 + β1 * ACCBM-General + β2 * D + β3 * (ACCBM-General * D) | ACCBM-General | –0.104 | [–0.498, 0.290] | –0.526 | 0.600 | 0.251 | 0.883 |
| D | 0.765 | [0.318, 1.212] | 3.411 | 0.001 | |||
| ACCBM-General * D | –0.179 | [–0.653, 0.296] | –0.751 | 0.455 | |||
| Model 4 ‡: SRSADHD = β0 + β1 * ACC + β2 * D1 + β3 * D2 + β4 * (ACC * D1) + β5 * (ACC * D2) | ACC | –0.828 | [-1.357,–0.299] | –3.098 | 0.002 | 0.112 | 0.961 |
| D1 | 0.683 | [0.100, 1.267] | 2.317 | 0.022 | |||
| D2 | 0.785 | [0.185, 1.386] | 2.589 | 0.011 | |||
| ACC * D1 | 0.580 | [–0.057, 1.216] | 1.803 | 0.074 | |||
| ACC * D2 | 0.550 | [–0.052, 1.152] | 1.808 | 0.073 | |||
-
*
Std. error of the estimate is the standard deviation of the error term, and is the square root of the Mean Square Residual (or Error).
-
†
The variable D was a dummy variable (TD group: D=0, ADHD group: D=1, i.e. TD group as a reference).
-
‡
The variable D1 and D2 were dummy variables (BM-Local: D1=0, D2=0; BM-Global: D1=1, D2=0; BM-General: D1=0, D2=1, i.e. BM-Local as a reference).
Appendix 2—table 2
Coefficients and summaries of models for the relationship between age and biological motion (BM) processing.
| Model | Predictor | Standardised coefficient | 95% confidence interval | T statistic | p- value | R square | Std. error of the estimate* |
|---|---|---|---|---|---|---|---|
| Model 5†: ACCADHD = β0 + β1 * age + β2 * D1 + β3 * D2 + β4 * (age * D1) + β5 * (age * D2) | age | –0.027 | [–0.203, 0.150] | –0.296 | 0.768 | 0.373 | 0.801 |
| D1 | 0.977 | [0.728, 1.227] | 7.722 | 0.000 | |||
| D2 | 1.269 | [1.019, 1.518] | 10.023 | 0.000 | |||
| age * D1 | 0.228 | [–0.022, 0.478] | 1.800 | 0.073 | |||
| age * D2 | 0.462 | [0.212, 0.712] | 3.639 | <0.001 | |||
| Model 6†: ACCTD = β0 + β1 * age + β2 * D1 + β3 * D2 + β4 * (age * D1) + β5 * (age * D2) | age | 0.181 | [–0.055, 0.418] | 1.521 | 0.131 | 0.517 | 0.712 |
| D1 | 1.046 | [0.714, 1.379] | 6.236 | <0.001 | |||
| D2 | 1.636 | [1.303, 1.969] | 9.751 | <0.001 | |||
| age * D1 | 0.095 | [–0.240, 0.429] | 0.562 | 0.575 | |||
| age * D2 | 0.056 | [–0.278, 0.391] | 0.333 | 0.739 | |||
| Model 7 ‡: ACCBM-Local = β0 + β1 * age + β2 * D + β3 * (age * D) | age | 0.266 | [–0.042, 0.575] | 1.709 | 0.090 | 0.100 | 0.961 |
| D | –0.631 | [-1.016,–0.245] | –3.242 | 0.002 | |||
| age * D | –0.306 | [–0.684, 0.073] | –1.600 | 0.112 | |||
| Model 8 ‡: ACCBM-Global = β0 + β1 * age + β2 * D + β3 * (age * D) | age | 0.342 | [0.046, 0.638] | 2.290 | 0.024 | 0.172 | 0.922 |
| D | –0.723 | [-1.093,–0.353] | –3.874 | <0.001 | |||
| age * D | –0.091 | [–0.454, 0.272] | –0.496 | 0.621 | |||
| Model 9 ‡: ACCBM-General = β0 + β1 * age + β2 * D + β3 * (age * D) | age | 0.229 | [–0.047, 0.505] | 1.643 | 0.103 | 0.280 | 0.860 |
| D | –0.884 | [-1.229,–0.540] | –5.081 | <0.001 | |||
| age * D | 0.192 | [–0.146, 0.531] | 1.126 | 0.263 | |||
-
*
Std. error of the estimate is the standard deviation of the error term, and is the square root of the Mean Square Residual (or Error).
-
†
The variable D1 and D2 were dummy variables (BM-Local: D1=0, D2=0; BM-Global: D1=1, D2=0; BM-General: D1=0, D2=1, i.e. BM-Local as a reference).
-
‡
The variable D was a dummy variable (TD group: D=0, ADHD group: D=1, i.e. TD group as a reference).
Additional files
Download links
A two-part list of links to download the article, or parts of the article, in various formats.
Downloads (link to download the article as PDF)
Open citations (links to open the citations from this article in various online reference manager services)
Cite this article (links to download the citations from this article in formats compatible with various reference manager tools)
Atypical local and global biological motion perception in children with attention deficit hyperactivity disorder
eLife 12:RP90313.
https://doi.org/10.7554/eLife.90313.5


