Large-scale characterization of cocaine addiction-like behaviors reveals that escalation of intake, aversion-resistant responding, and breaking-points are highly correlated measures of the same construct
- Department of Psychiatry, University of California, San Diego, United States
- Department of Neuroscience, The Scripps Research Institute, La Jolla, United States
- Institut de Neurosciences de la Timone, Aix-Marseille Université, France
- Institute for Genomic Medicine, University of California, San Diego, United States
- Department of Internal Medicine, Section on Molecular Medicine, Wake Forest University School of Medicine, United States
Figures
Figure 1 with 1 supplement
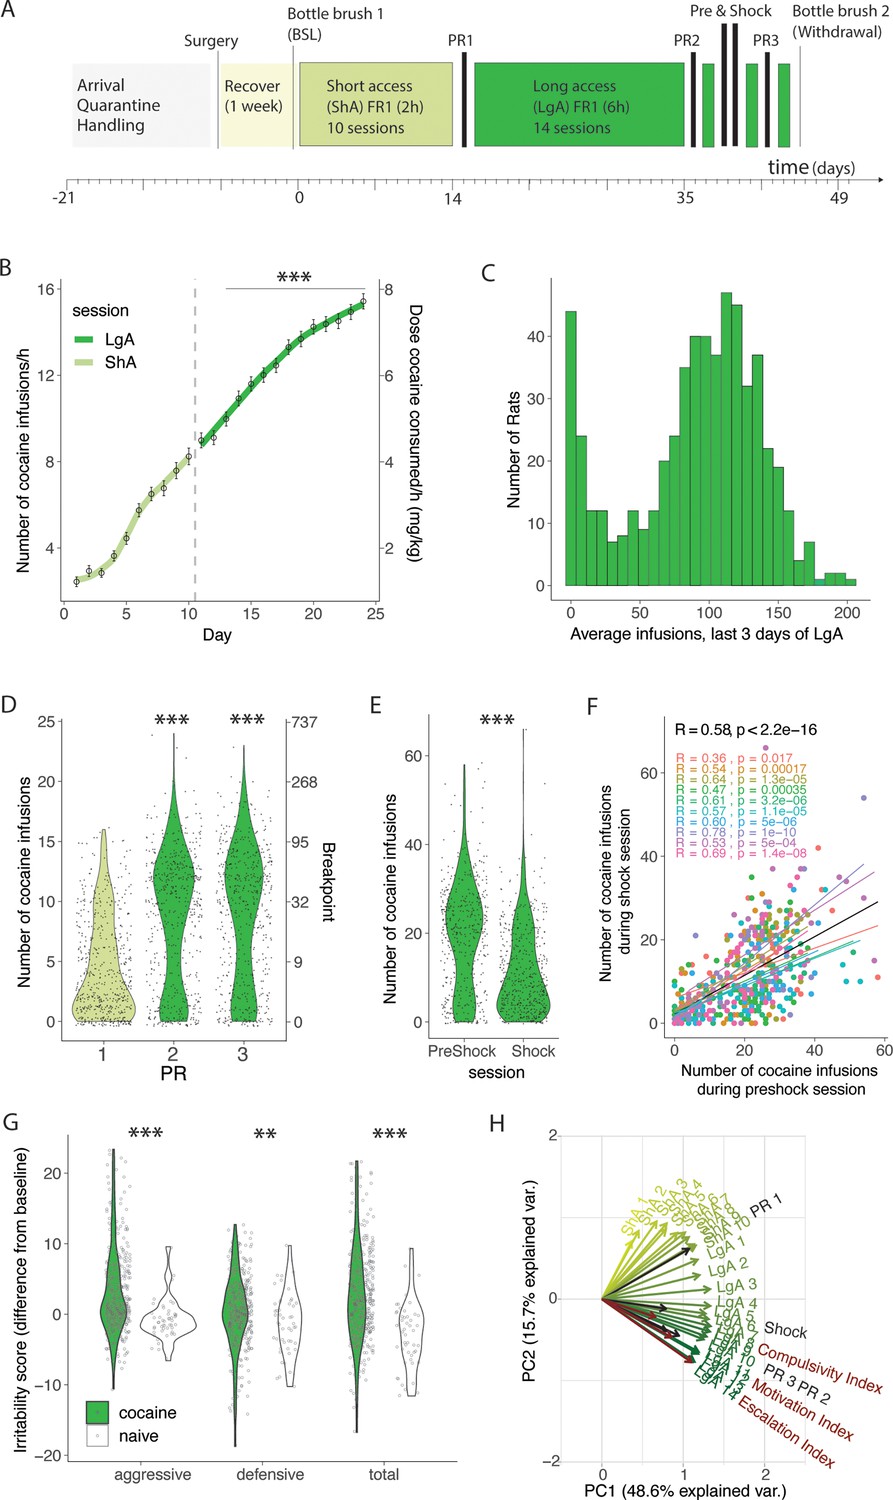
Individual differences in addiction behaviors in heterogeneous stock (HS) rats following intravenous cocaine self-administration.
(A) Timeline of the behavioral paradigms. (B) Number of cocaine infusions in the first hour of cocaine self-administration during short (2 hr, short access: ShA) and long (6 hr, long access: LgA) access (N=567, *** p<0.0001 vs the first LgA session). (C) Average number of daily infusions for the last 3 days of LgA (N=567). (D) Violin plot of the number of cocaine infusions under progressive ratio (PR) tested after ShA (1) and LgA, before (2) and after (3) the Shock session (N=560, *** p<0.0001). (E) Number of infusions despite footshock after LgA compared to a 1 hr preshock session (N=466, *** p<0.0001). (F) Correlation of responding during the shock and preschock session is reproduced in each of the 10 color-coded cohorts (N=466, p<0.0001). (G) Difference in irritability scores after LgA and at baseline (N=380 + 49 naive, behavior ***p<0.0001, **p<0.001 vs naive) (H) Principal component analysis of cocaine infusions over all sessions ShA1-10, LgA1-14, PR1-3, Shock with escalation, motivation, and compulsivity indices.
-
Figure 1—source data 1
Raw data utilized for generating Figure 1.
‘Rat info Raw data’ tab contains the raw data table with all data analyzed, other tabs have the data split per panel in the figure as indicated. (B) Number of cocaine infusions per hour of cocaine self-administration during short (2 hr, short access: ShA) and long (6 hr, long access: LgA) access (N=567). (C) Average number of daily infusions for the last 3 days of LgA (N=567). (D) Number of cocaine infusions under progressive ratio (PR) tested after ShA (1) and LgA, before (2) and after (3) the Shock session (N=560). (E, F) Number of infusions despite footshock after LgA compared to a 1 h preshock session (N=466), with cohort number for correlation analysis. (G) Difference in irritability scores after LgA and at baseline (irritability) per type (aggressive, defensive, or total) and group (cocaine or naïve) (N=380 + 49 naïve). (H) Data for all sessions ShA1-10, LgA1-14, PR1-3, Shock with escalation, motivation, and compulsivity indices for principal component analysis (PCA).
- https://cdn.elifesciences.org/articles/90422/elife-90422-fig1-data1-v1.xlsx
Figure 1—figure supplement 1
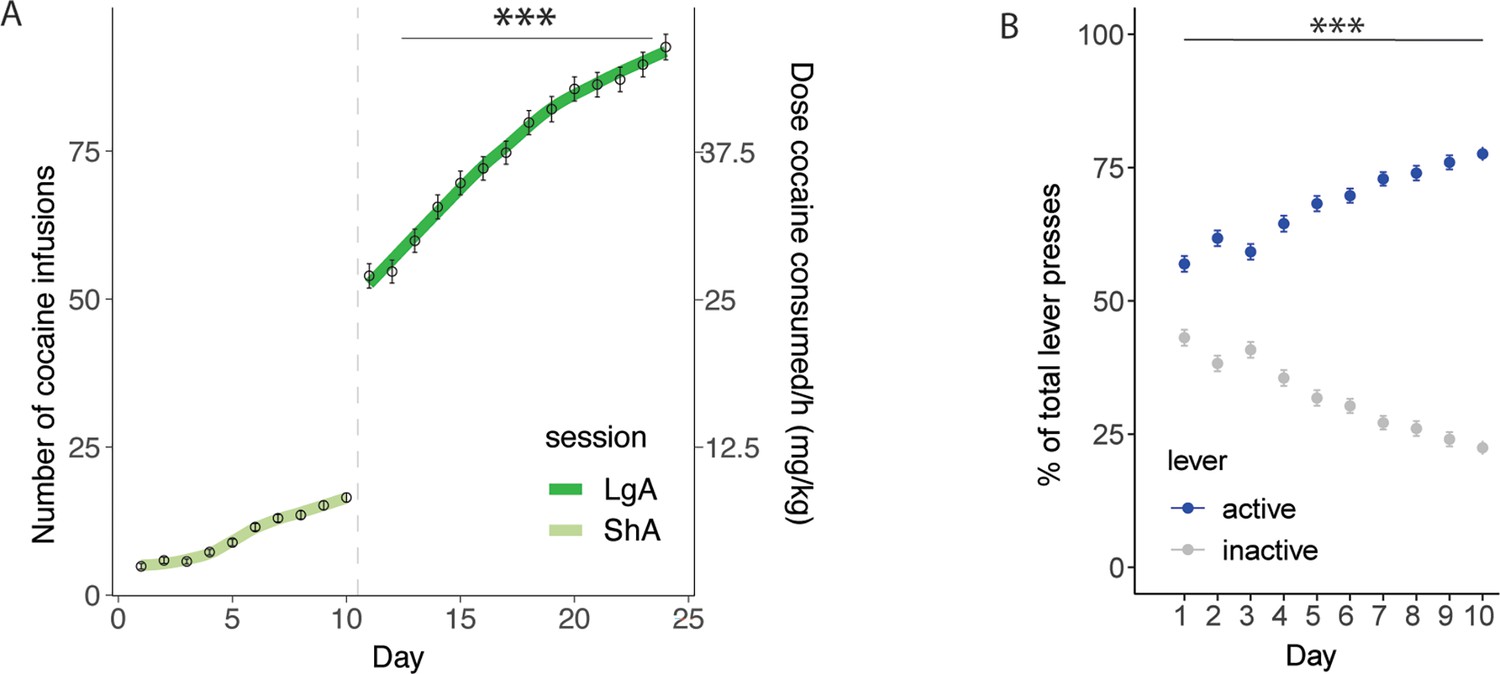
Additional representations of the intake and lever presses are associated with Figure 1B.
(A) Total number of cocaine infusions during short (2 hr, short access: ShA) and long (6 hr, long access: LgA) access. (B) Percent of active or inactive lever presses of the total presses during short access is significantly different in every session. Mixed effects analysis shows a significant interaction between the levers and days (F(9, 2620)=55.57, p<0.0001), the Bonferroni corrected post-hoc pairwise comparison between the percentages of both levers was significantly different on every day (***p<0.0001).
-
Figure 1—figure supplement 1—source data 1
Raw data utilized for generating Figure 1—figure supplement 1.
(A) Total number of cocaine infusions during short (2 hr, short access: ShA) and long (6 hr, long access: LgA) access. (B) Mean, standard deviation (sd), and standard error (se) of percent of active or inactive lever presses of the total presses during short access.
- https://cdn.elifesciences.org/articles/90422/elife-90422-fig1-figsupp1-data1-v1.xlsx
Figure 2
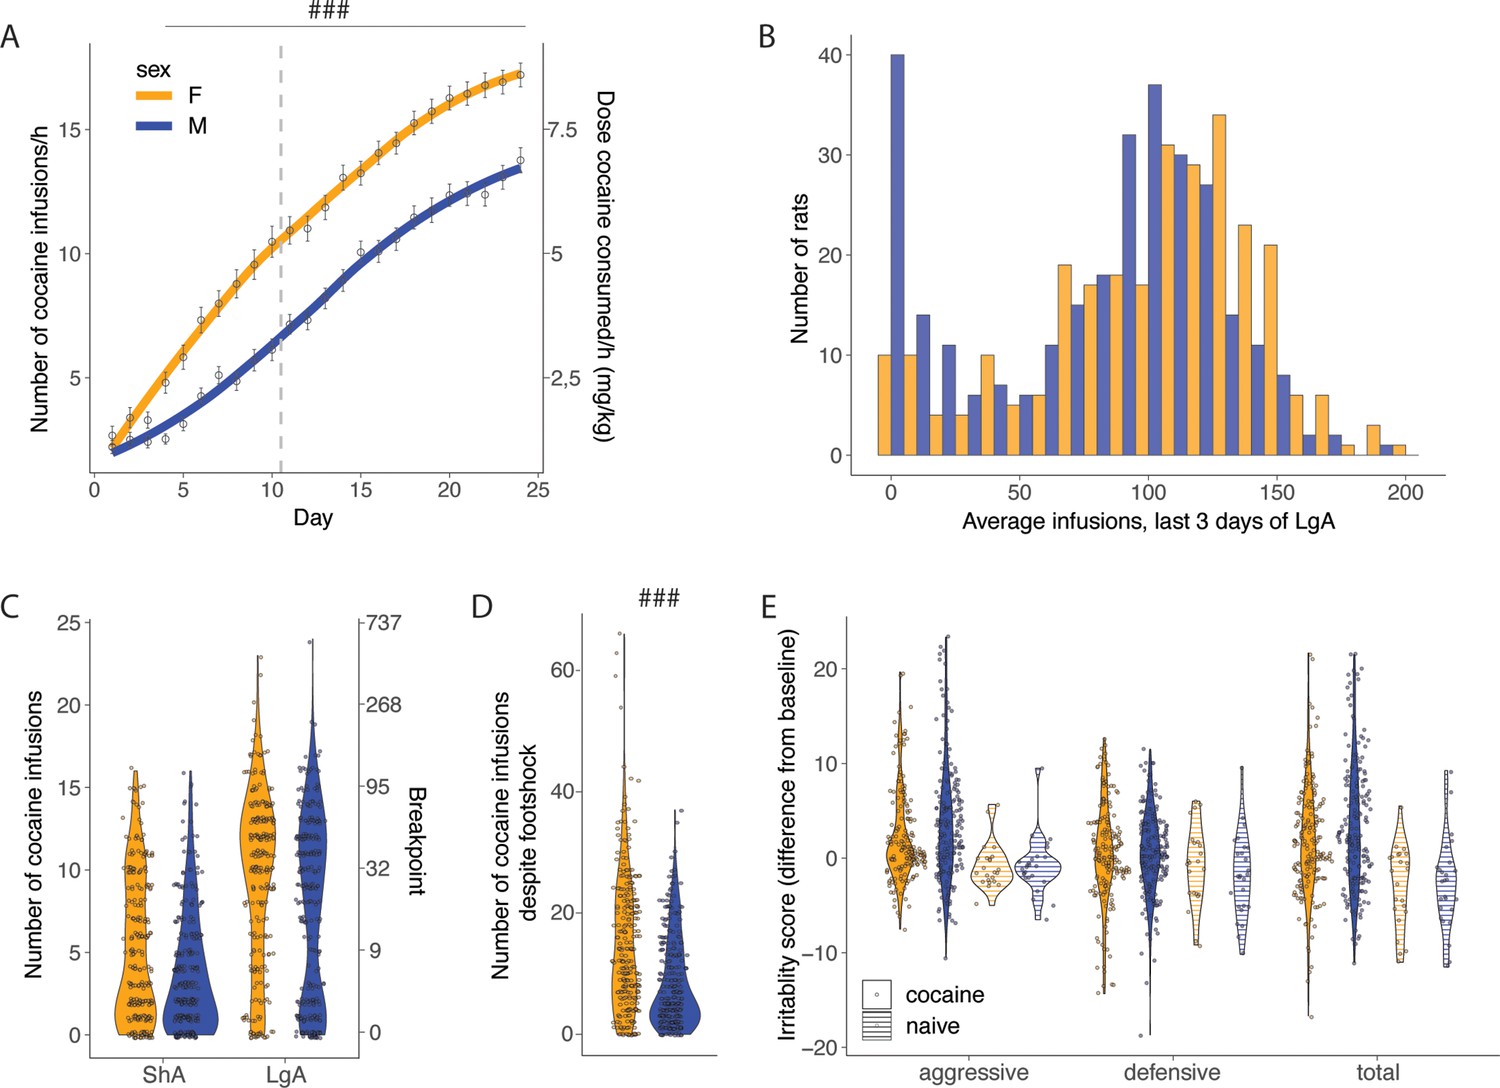
Sex differences in addiction-like behaviors.
(A) Cocaine infusions during short (2 hr, short access: ShA) and long (6 hr, long access: LgA) access of cocaine self-administration (N=275 F and 292 M, ###p<0.0001 vs males) (B) Average number of daily infusions for the last 3 days of LgA in male and female rats. (C) Violin plot of a number of cocaine infusions under progressive ratio (PR) test after ShA and LgA (N=273 F and 291 M). (D) Number of infusions despite footshock after LgA (N=275 F and 292 M, ###p<0.0001). (E) Increase in irritability-like behavior in males and females after LgA compared to naive rats, no significant sex differences were detected (N=186 F+194 M+23 naive F+26 naive M).
-
Figure 2—source data 1
Raw data utilized for generating Figure 2.
Groups split by sex. ‘Rat info Raw data’ tab contains the raw data table with all data analyzed, other tabs have the data split per panel in the figure as indicated. (A) Number of cocaine infusions per hour of cocaine self-administration during short (2 hr, short access: ShA) and long (6 hr, long access: LgA) access, per sex (N=275 F and 292 M). (B) Average number of daily infusions for the last 3 days of LgA. (C) Number of cocaine infusions under progressive ratio (PR) tested after ShA or LgA (period). (D) Number of infusions despite footshock after LgA. (E) Difference in irritability scores after LgA and at baseline (irritability) per type (aggressive, defensive, or total) and group (cocaine or naïve) (N=380 + 49 naïve).
- https://cdn.elifesciences.org/articles/90422/elife-90422-fig2-data1-v1.xlsx
Figure 3 with 1 supplement
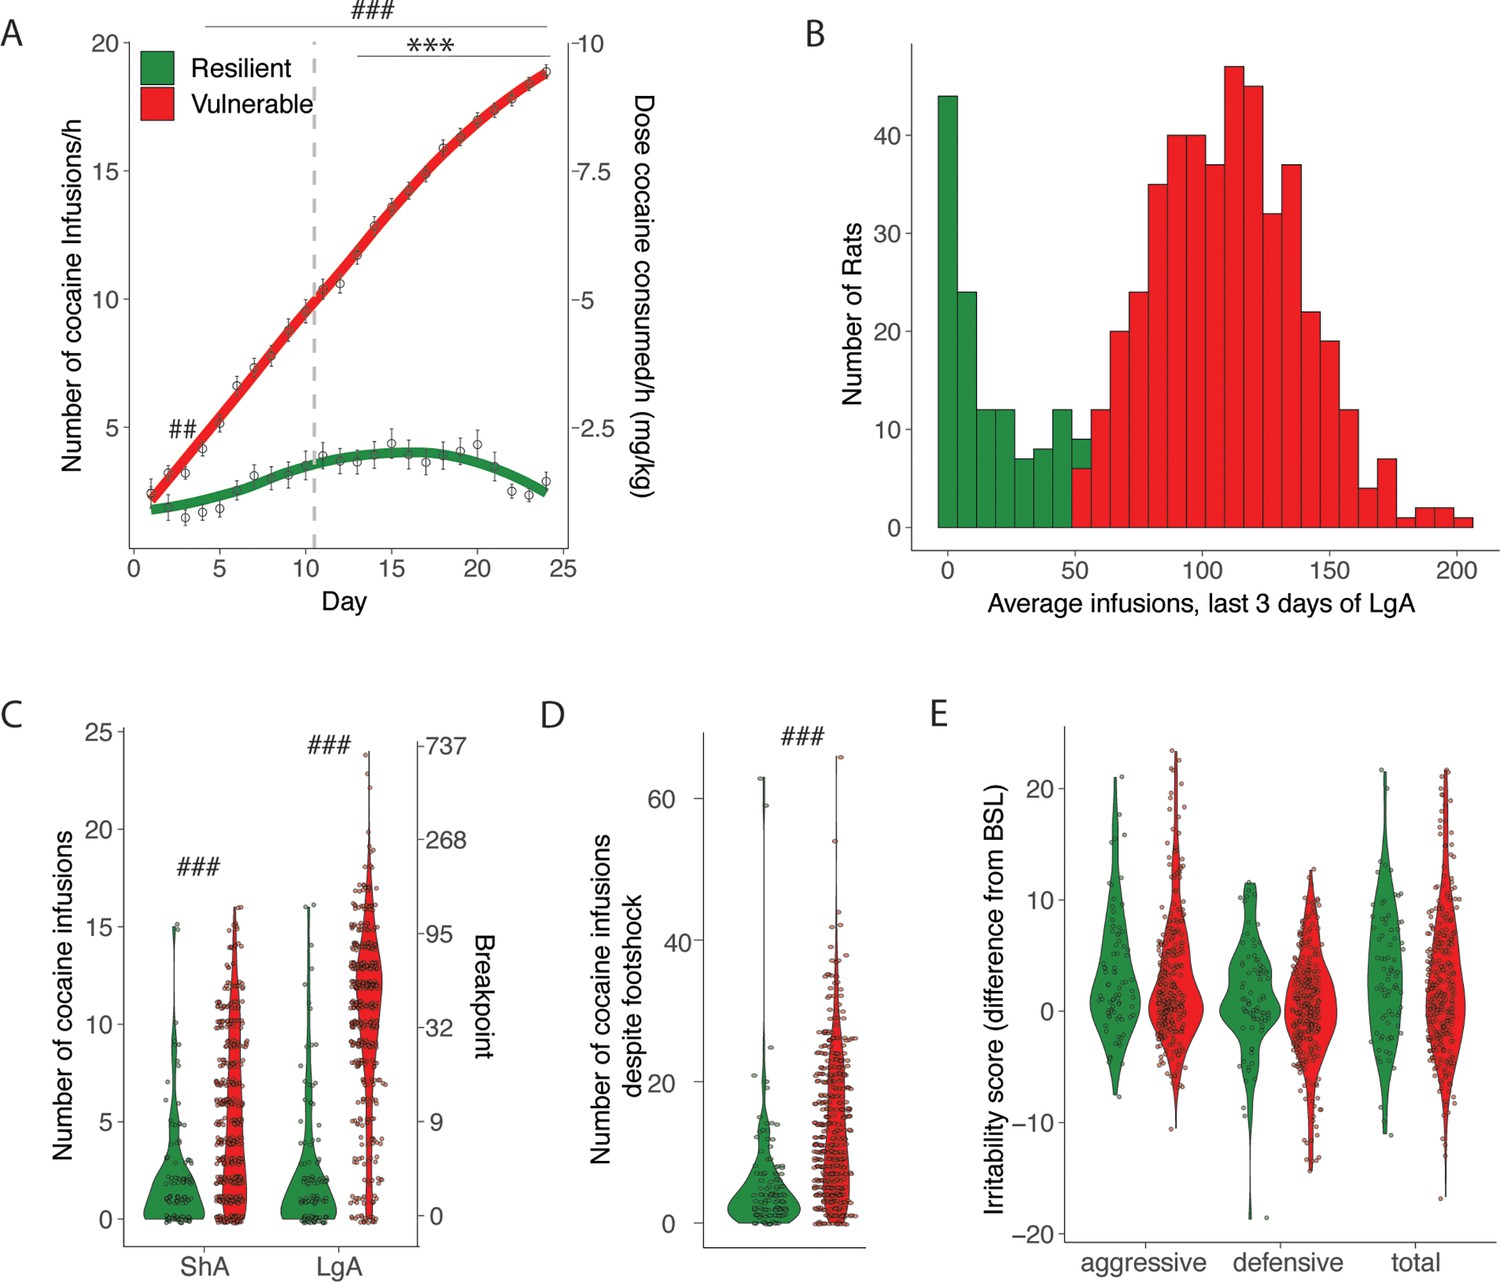
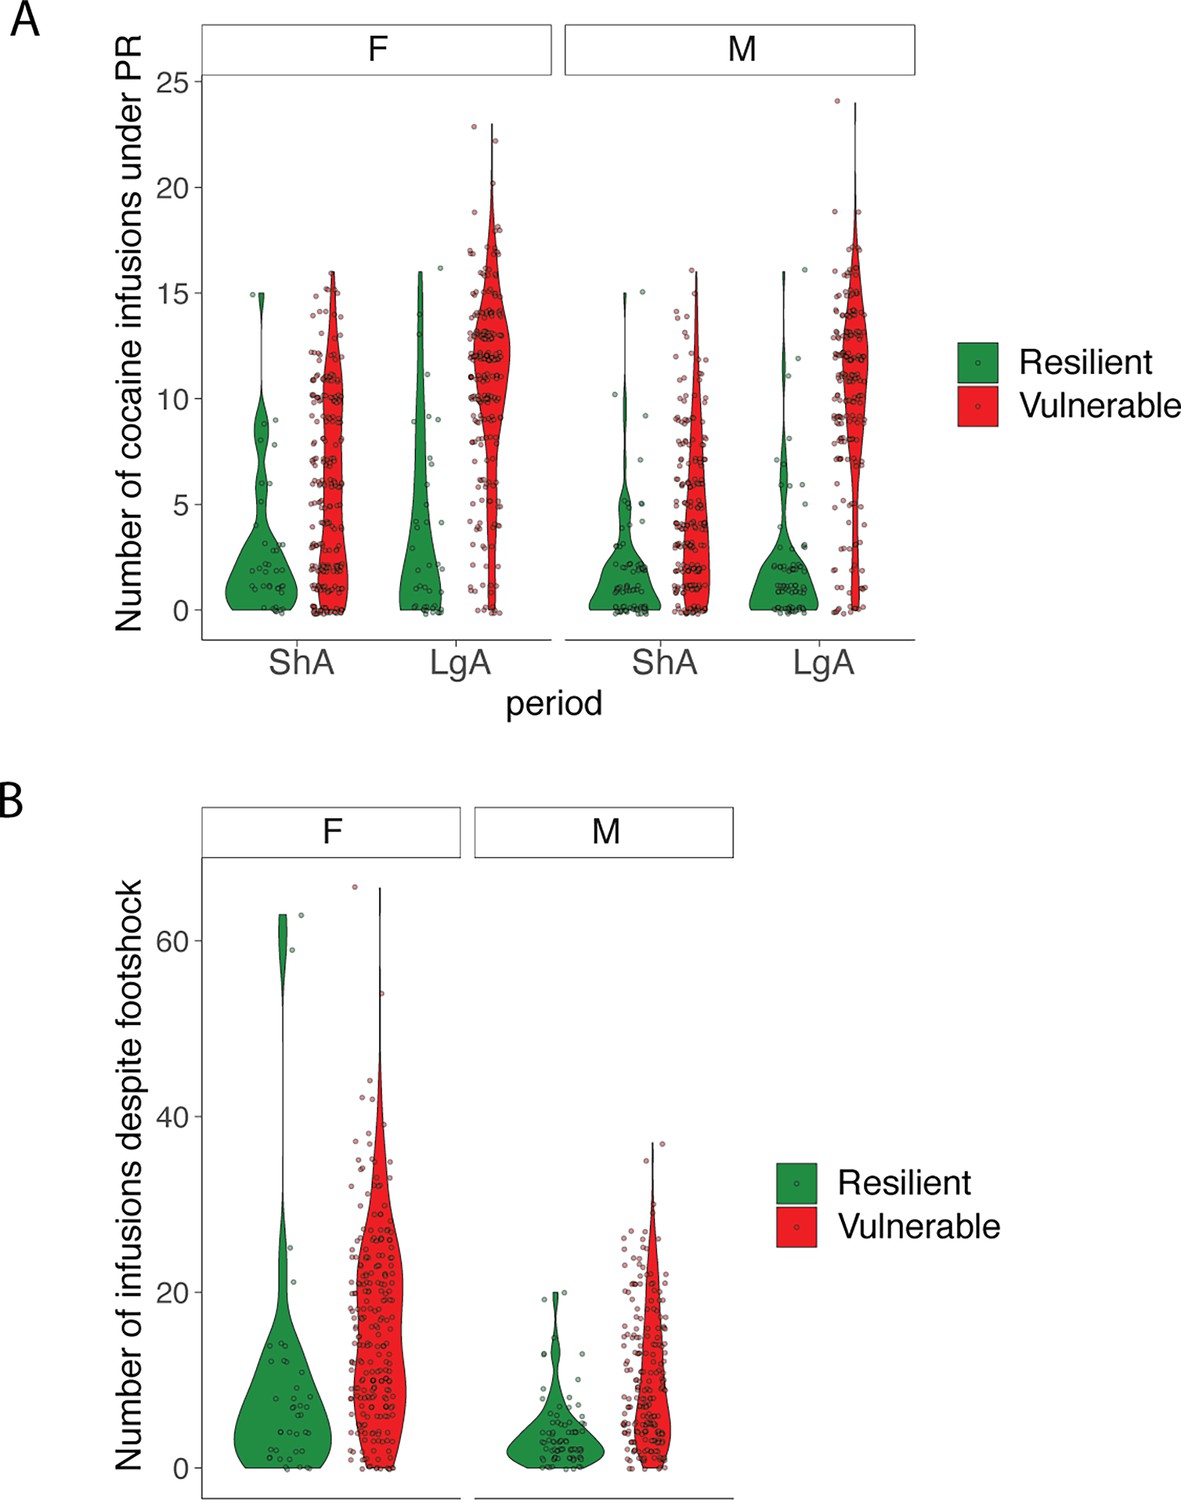
Addiction-like behaviors in resilient and vulnerable heterogeneous stock (HS) rats.
(A) Number of cocaine infusions during short (2 hr, short access: ShA) and long (6 hr, long access: LgA) access of cocaine self-administration in resilient and vulnerable animals (N=122 resilient and 445 vulnerable, ***p<0.001 vs LgA day 1, ###p<0.0001, ##p<0.001 vs resilient. (B) Average number of infusions over the last 3 days for the individual animals). (C) Number of cocaine infusions under progressive ratio (PR) at the end of ShA and LgA (### p<0.0001 vs resilient). (D) Number of infusions despite footshock after LgA (###p<0.0001 vs resilient). (E) Irritability scores after LgA (N=79 resilient, 301 vulnerable).
-
Figure 3—source data 1
Raw data utilized for generating Figure 3.
Groups are split by resilient and vulnerable animals. ‘Rat info Raw data’ tab contains the raw data table with all data analyzed, other tabs have the data split per panel in the figure as indicated. (A) Number of cocaine infusions per hour of cocaine self-administration during short (2 hr, short access: ShA) and long (6 hr, long access: LgA) access, split by resilient and vulnerable animals (N=122 resilient and 445 vulnerable). (B) Average number of daily infusions for the last 3 days of LgA, by vulnerability. (C) Number of cocaine infusions under progressive ratio (PR) tested after ShA or LgA (period). (D) Number of infusions despite footshock after LgA. (E) Difference in irritability scores after LgA and at baseline (irritability) per type (aggressive, defensive, or total) and group (cocaine or naïve).
- https://cdn.elifesciences.org/articles/90422/elife-90422-fig3-data1-v1.xlsx
Figure 3—figure supplement 1
Sex-specific analysis of motivation and compulsivity in vulnerable and resilient rats.
Motivation (A) and compulsivity (B) for the vulnerable and resilient populations split by sex.
-
Figure 3—figure supplement 1—source data 1
Raw data utilized for generating Figure 3—figure supplement 1.
Motivation (A) and compulsivity (B) by the vulnerable and resilient populations and by sex.
- https://cdn.elifesciences.org/articles/90422/elife-90422-fig3-figsupp1-data1-v1.xlsx
Figure 4 with 1 supplement
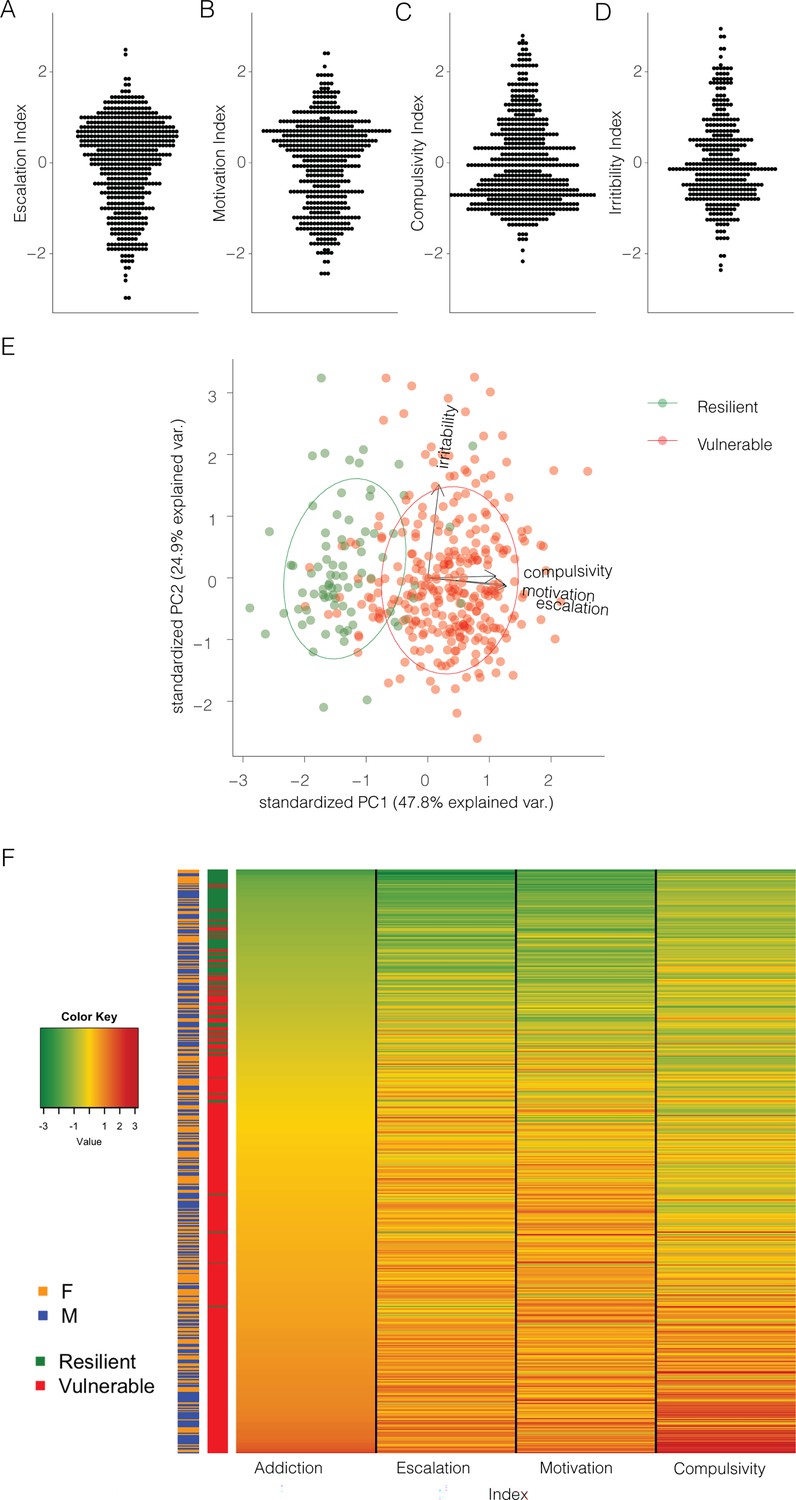
Normalizing and combining addiction-like behaviors into an addiction index.
(A) Z-score for escalation (N=566), (B) motivation (N=512), (C) compulsivity (N=567), and (D) irritability-like behavior (N=380) in the whole population. (E) Representation of the individual rats (N=377), resilient (green), or vulnerable (red) along the two first principal components, based on escalation, motivation, compulsivity, and irritability z-scores. (F) Representation of the addiction index for the individual rats with the constituting individual z-scores and their identification as resilient or vulnerable and male or female (N=511).
-
Figure 4—source data 1
Raw data utilized for generating Figure 4.
(A) Z-score for escalation (N=566), (B) motivation (N=512), (C) compulsivity (N=567), and (D) irritability-like behavior (N=380) in the whole population. (E) Combination of A-D and split on vulnerability for PCA analysis with labeling. (F) Combination of A-D, the addiction index and split on vulnerability.
- https://cdn.elifesciences.org/articles/90422/elife-90422-fig4-data1-v1.xlsx
Figure 4—figure supplement 1
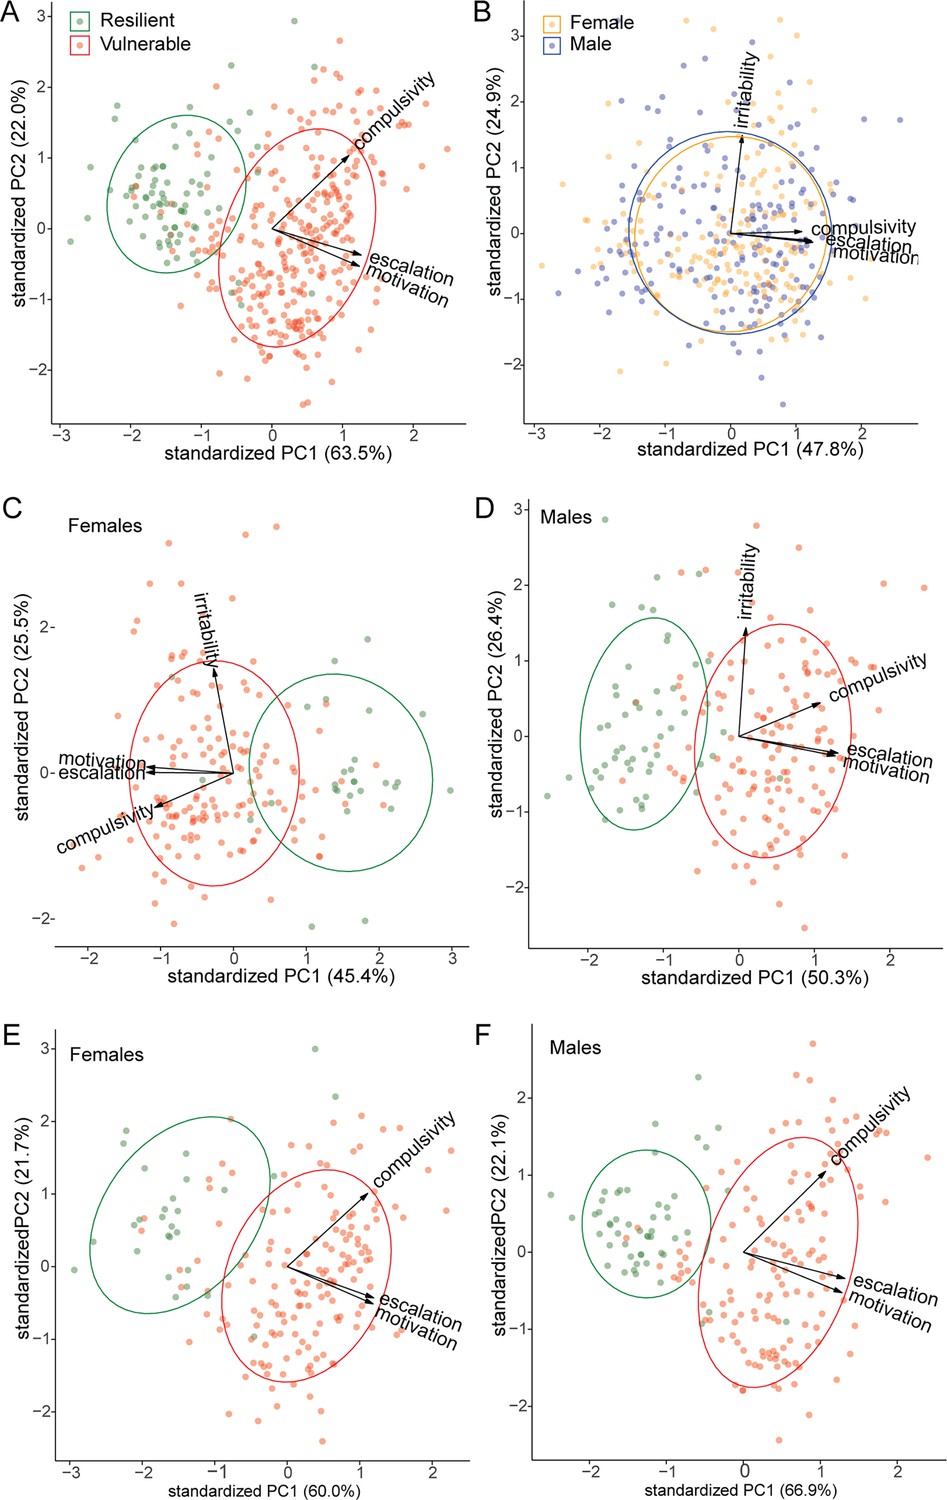
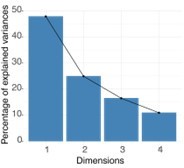
Additional principal component analysis (PCA) analysis with the representation of the individual rats (N=377) along the first two principal components.
(A) Rerun the PCA from Figure 4E without irritability shows escalation, motivation, and compulsivity loading onto the first PC that explains a significant portion of the variance. (B) The same PCA as in Figure 4E, but with the data colored according to sex [female (yellow) or male (blue)], showed no sex differences. (C, D) Same PCA as in Figure 4E but run on females (D) or males (D) only. (E, F) Rerun the PCA from Figure 4E without irritability on females (E) or males (F) only.
-
Figure 4—figure supplement 1—source data 1
Raw data utilized for generating Figure 4—figure supplement 1.
Principal component analysis (PCA) analyses are split by panel.
- https://cdn.elifesciences.org/articles/90422/elife-90422-fig4-figsupp1-data1-v1.xlsx
Figure 5
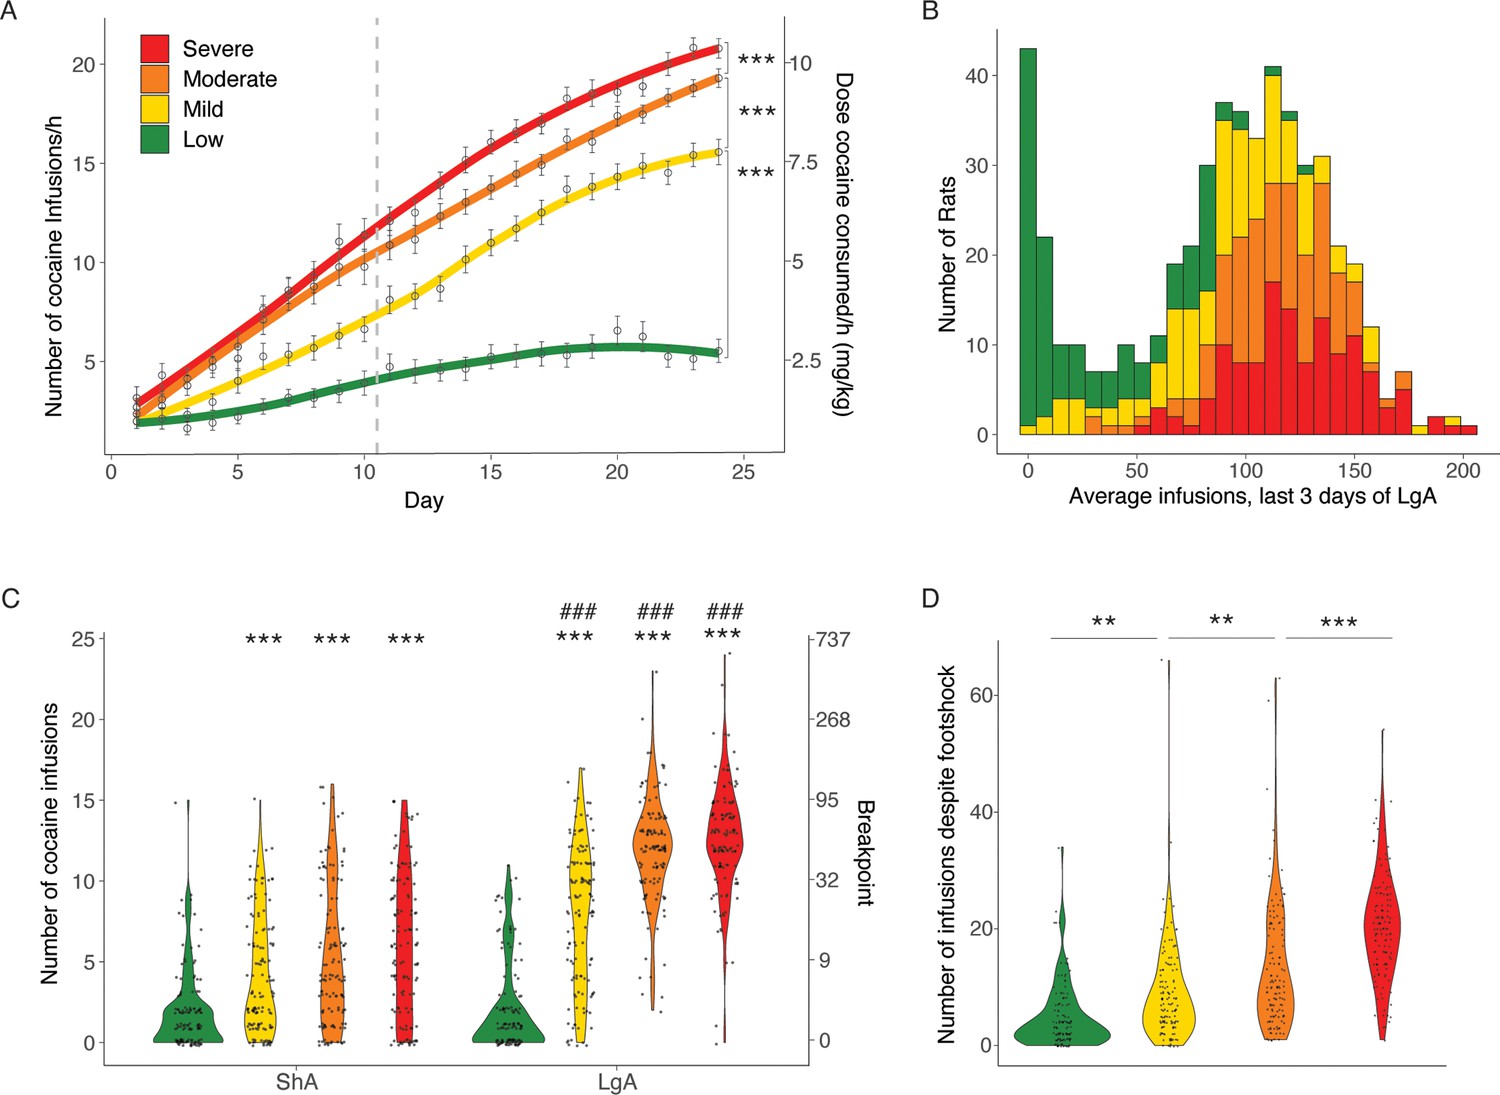
Different degrees of vulnerability to cocaine addictive behaviors.
(A) Cocaine infusions during short (2 hr, short access: ShA) and long (6 hr, long access: LgA) access of cocaine self-administration (N=128 Low + 128 Mild + 127 Moderate + 128 Severe; ***p<0.0001). (B) Average number of cocaine infusions over the last 3 days for the individual animals in the low, mild moderate, and severe vulnerable groups. (C) Number of cocaine infusions under progressive ratio (PR) test at the end of the ShA and LgA phases (***p<0.0001 vs low, ###p<0.0001 vs ShA) (D) Number of infusions despite footshock after LgA for the resilient and vulnerable groups (**p<0.001 and ***p<0.0001).
-
Figure 5—source data 1
Raw data utilized for generating Figure 5.
Groups split by addiction index. ‘Rat info Raw data’ tab contains the raw data table with all data analyzed, other tabs have the data split per panel in the figure as indicated. (A) Number of cocaine infusions per hour of cocaine self-administration during short (2 hr, short access: ShA) and long (6 hr, long access: LgA) access, quartered by addiction index (N=128 Low + 128 Mild + 127 Moderate + 128 Severe). (B) Average number of daily infusions for the last 3 days of LgA. (C) Number of cocaine infusions under progressive ratio (PR) tested after ShA or LgA (period). (D) Number of infusions despite footshock after LgA.
- https://cdn.elifesciences.org/articles/90422/elife-90422-fig5-data1-v1.xlsx
Author response image 1
Tables
Author response table 1
| PC1 | PC2 | |
|---|---|---|
| Escalation Index | 0.605 | -0.089 |
| Motivation Index | 0.594 | -0.071 |
| Compulsivity Index | 0.524 | 0.020 |
| Irritability Index | 0.086 | 0.993 |
Additional files
Download links
A two-part list of links to download the article, or parts of the article, in various formats.
Downloads (link to download the article as PDF)
Open citations (links to open the citations from this article in various online reference manager services)
Cite this article (links to download the citations from this article in formats compatible with various reference manager tools)
Large-scale characterization of cocaine addiction-like behaviors reveals that escalation of intake, aversion-resistant responding, and breaking-points are highly correlated measures of the same construct
eLife 12:RP90422.
https://doi.org/10.7554/eLife.90422.3


