Heterogeneous presynaptic receptive fields contribute to directional tuning in starburst amacrine cells
- Department of Physiology and Biophysics, University of Colorado School of Medicine, United States
Figures
Figure 1
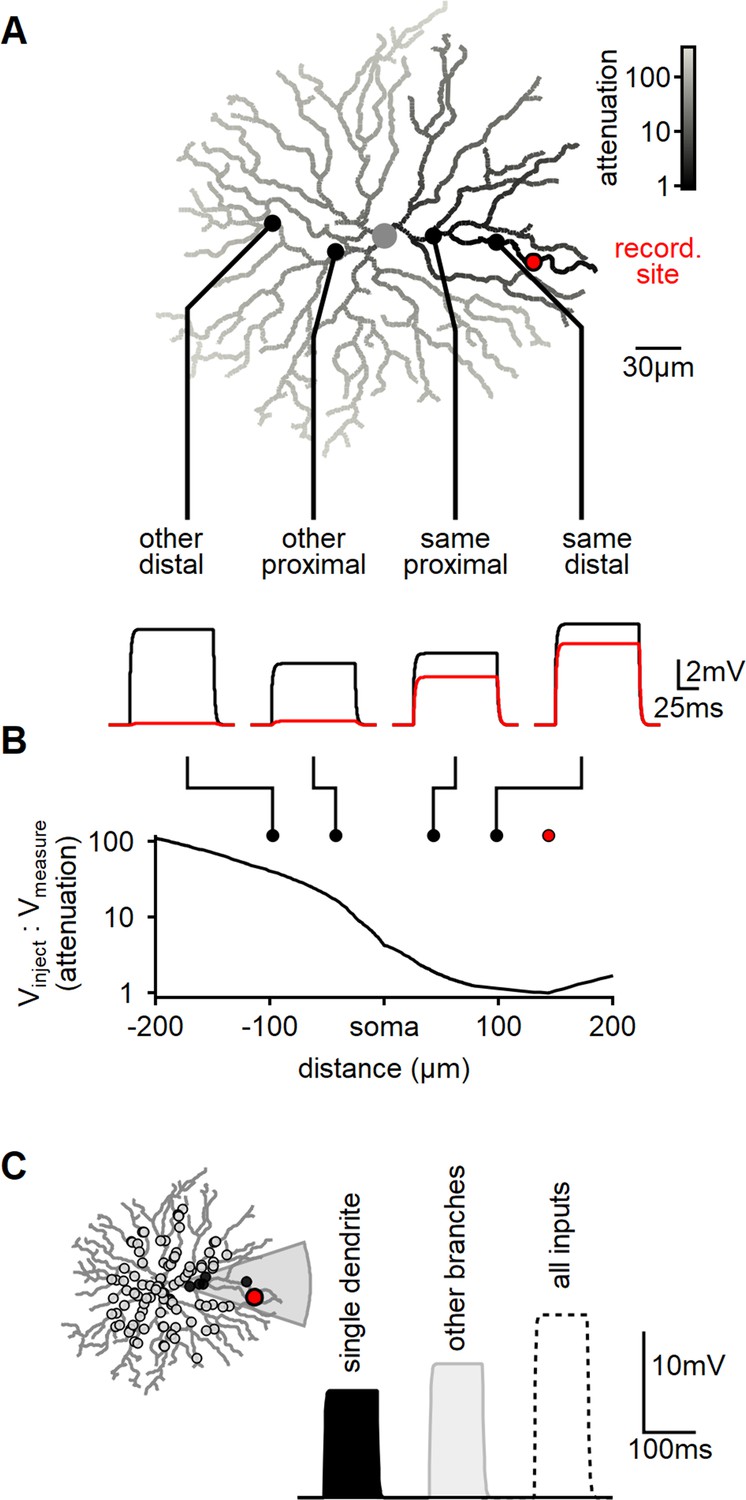
Modeling reveals substantial dendritic crosstalk in starburst amacrine cells (SACs) despite significant voltage attenuation.
(A) Reconstructed morphology of a mouse SAC, with dendrites color-coded based on voltage attenuation toward the recording site (indicated in red). The bottom panel displays example voltage responses to a 100-ms-long current pulse injected at one of four positions denoted by circles. The black and red traces represent the potentials at the injection and recording sites, respectively. (B) Analysis of signal attenuation in SAC dendrites relative to the recording site marked in panel (A), as a function of distance from the soma (negative values indicate positions on the opposite side of the dendritic tree). (C) Comparison of peak depolarization resulting from synaptic stimulation of the recorded branch (labeled as ’single dendrite'; stimulated area shaded in gray) with the impact of driving synapses on other dendritic sites excluding the target branch (right, light gray). The combined activation of all inputs is shown for reference (dotted).
Figure 2 with 2 supplements
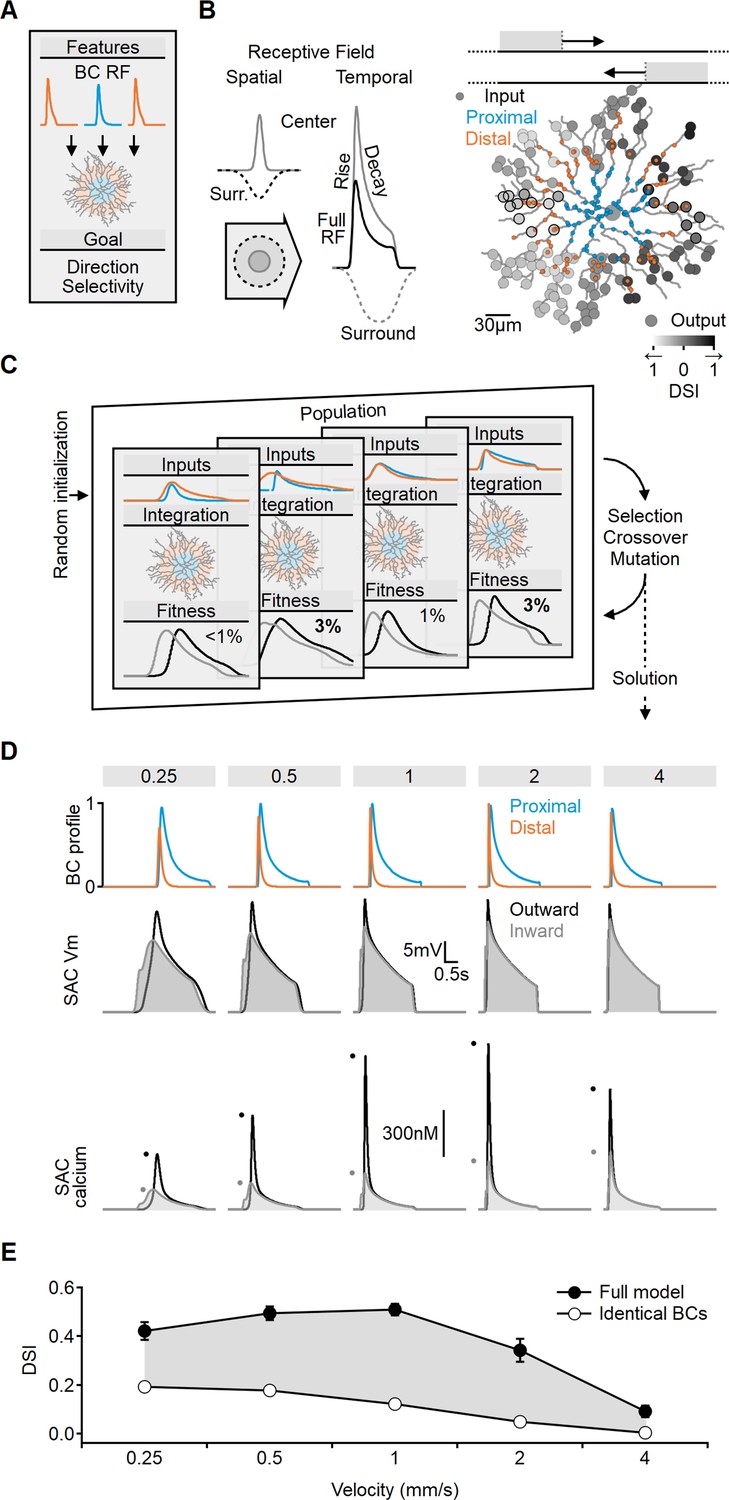
Evolutionary algorithm-based model enhances directional voltage responses in starburst amacrine cells (SACs), reproducing key features of the space-time model.
(A, B) Schematic representation of the bipolar–SAC circuit model. (B, Left) demonstrates the spatial components of the bipolar RF center (gray) and surround (dashed) components. The spatiotemporal receptive field (RF) components were convolved with horizontally moving bar stimuli (B, center) to generate the inputs for the multicompartmental SAC model (B, right). Two distinct bipolar groups, each with a unique RF formulation, innervated the proximal and more distal SAC dendrites. (B, right) Simulated SAC outputs are color-coded by their direction selectivity index (DSI) levels. The degree of postsynaptic direction selectivity was measured within 30 µm from the horizontal axis (these outputs are highlighted with black strokes). (C) The evolutionary algorithm training process involved iterative selection and mutation steps. Each generation included candidate solutions for bipolar RF templates (top row) that were integrated into SAC dendrites (middle row) and ranked based on the directionality and amplitude of calcium signals (bottom row). The best solutions underwent mutation and were propagated to the next generation. (D) Example response dynamics of the proximal (blue) and distal (orange) bipolar cells (BCs) (top), representative voltage (middle), and calcium (bottom) signals recorded from a SAC dendrite (location as in Figure 1). Dots represent peak response amplitudes in inward (gray) and outward (black) stimulation directions. The model was trained on five velocities (top, units: mm/s). (E) Mean (± SD) directional tuning achieved by the model (solid circles, n = 15). Open circles represent the optimal DSI in a bipolar–SAC model with an identical formulation of proximal and distal BCs. In this scenario, direction selectivity is mediated by voltage filtering in SAC dendrites.
Figure 2—figure supplement 1

Example evolution of the directional tuning in a bipolar–starburst amacrine cell (bipolar–SAC)model.
Direction selectivity index (DSI) measured from the best-performing model obtained through evolutionary algorithm training.
Figure 2—figure supplement 2
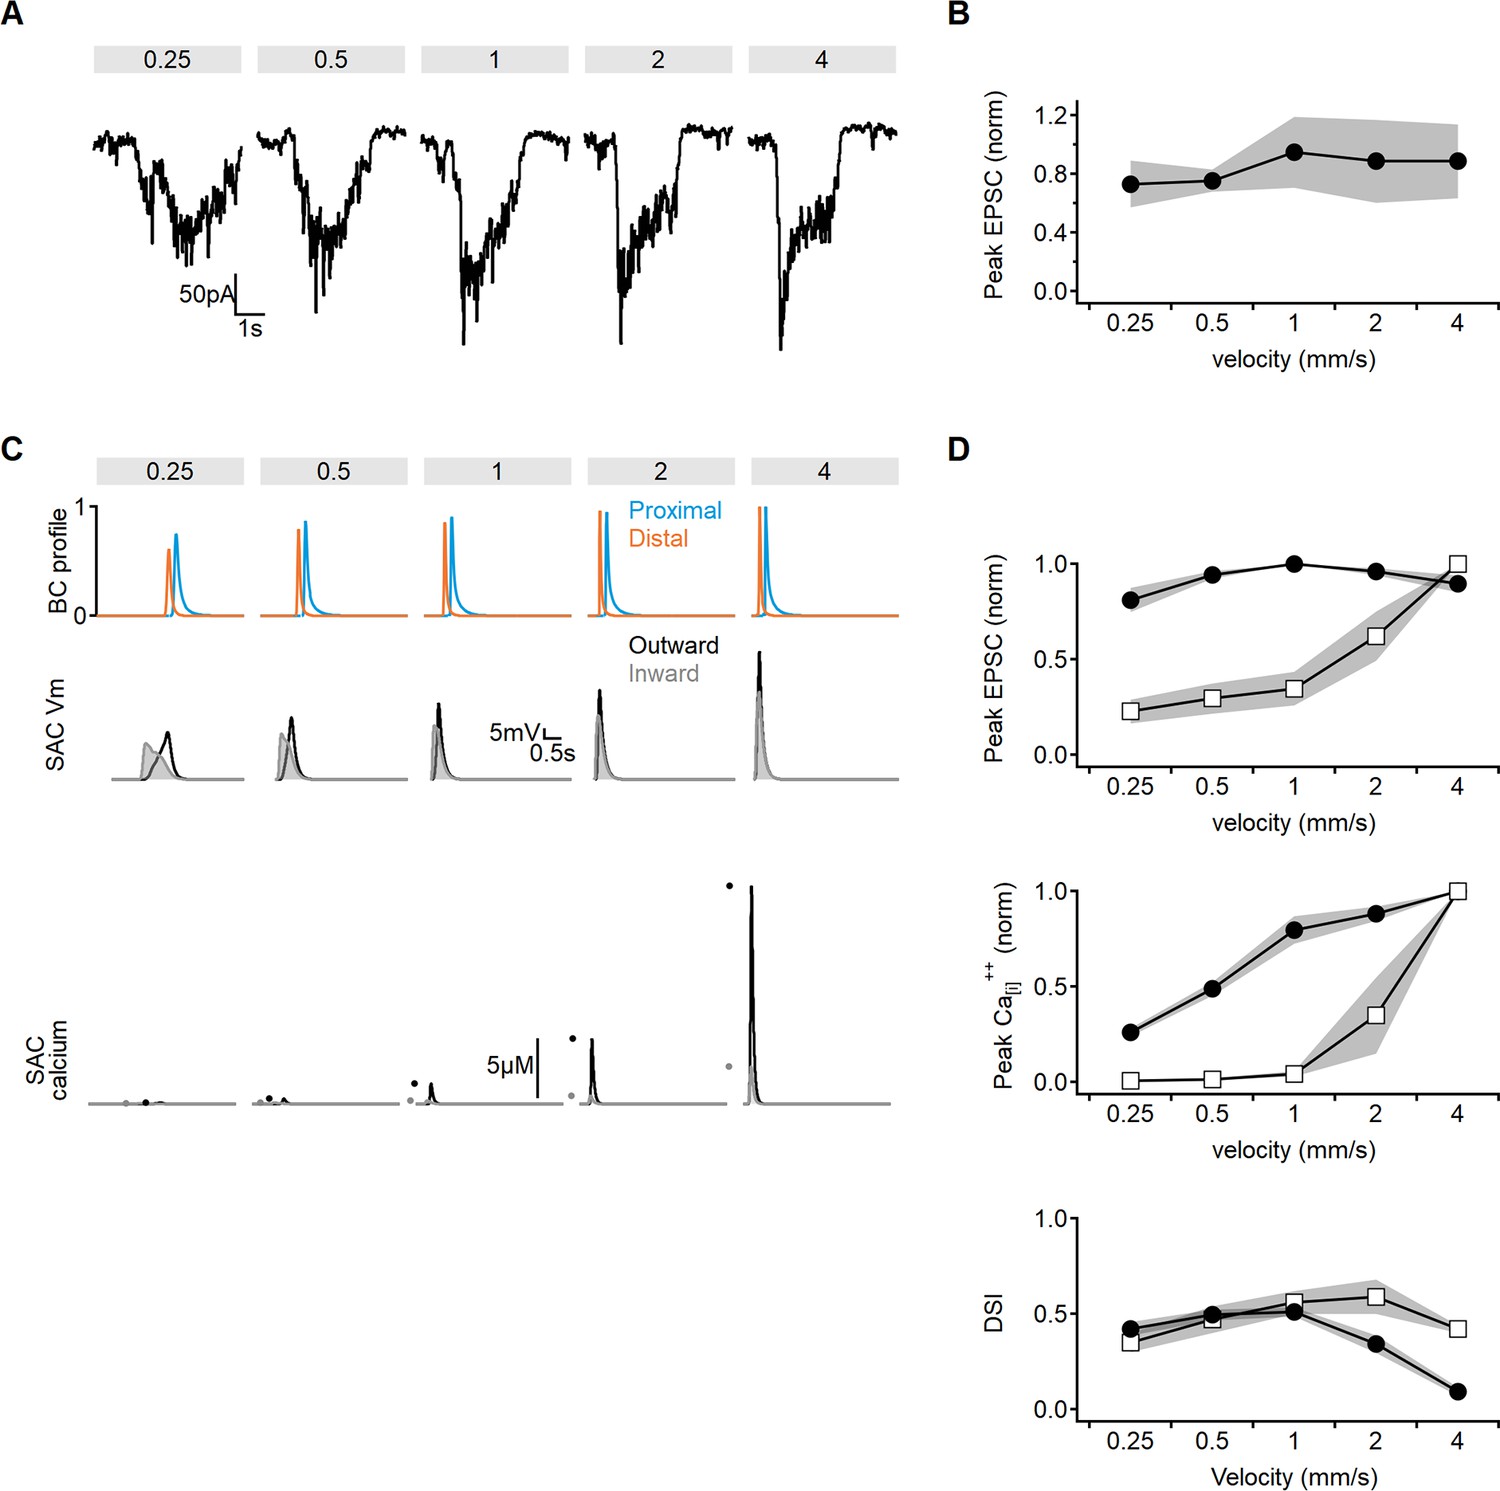
Limitations of model training on direction selectivity index (DSI) alone.
(A, B) Tuning curves of experimentally recorded excitatory inputs in starburst amacrine cells (SACs). (A) Representative excitatory postsynaptic current (EPSC) profile, obtained by averaging three responses from the same cell. (B) The normalized peak EPSC amplitudes (shaded areas – SD, n = 4). (C) Example profiles of presynaptic bipolar release (top), corresponding voltages (middle), and calcium responses (bottom) in SAC dendrite from models trained to maximize the DSI values. (D) Comparison of the peak somatic currents (top), dendritic calcium levels (middle), and DSI (bottom) as a function of stimulus velocity in model formulation presented in Figure 2 (training objective was large DSI and strong calcium responses, black circles) vs. the model trained on maximizing DSI only (as in C, open squares). The model trained solely on DSI fails to capture the observed velocity profiles of the somatic currents and the reported stability of calcium levels.
Figure 3
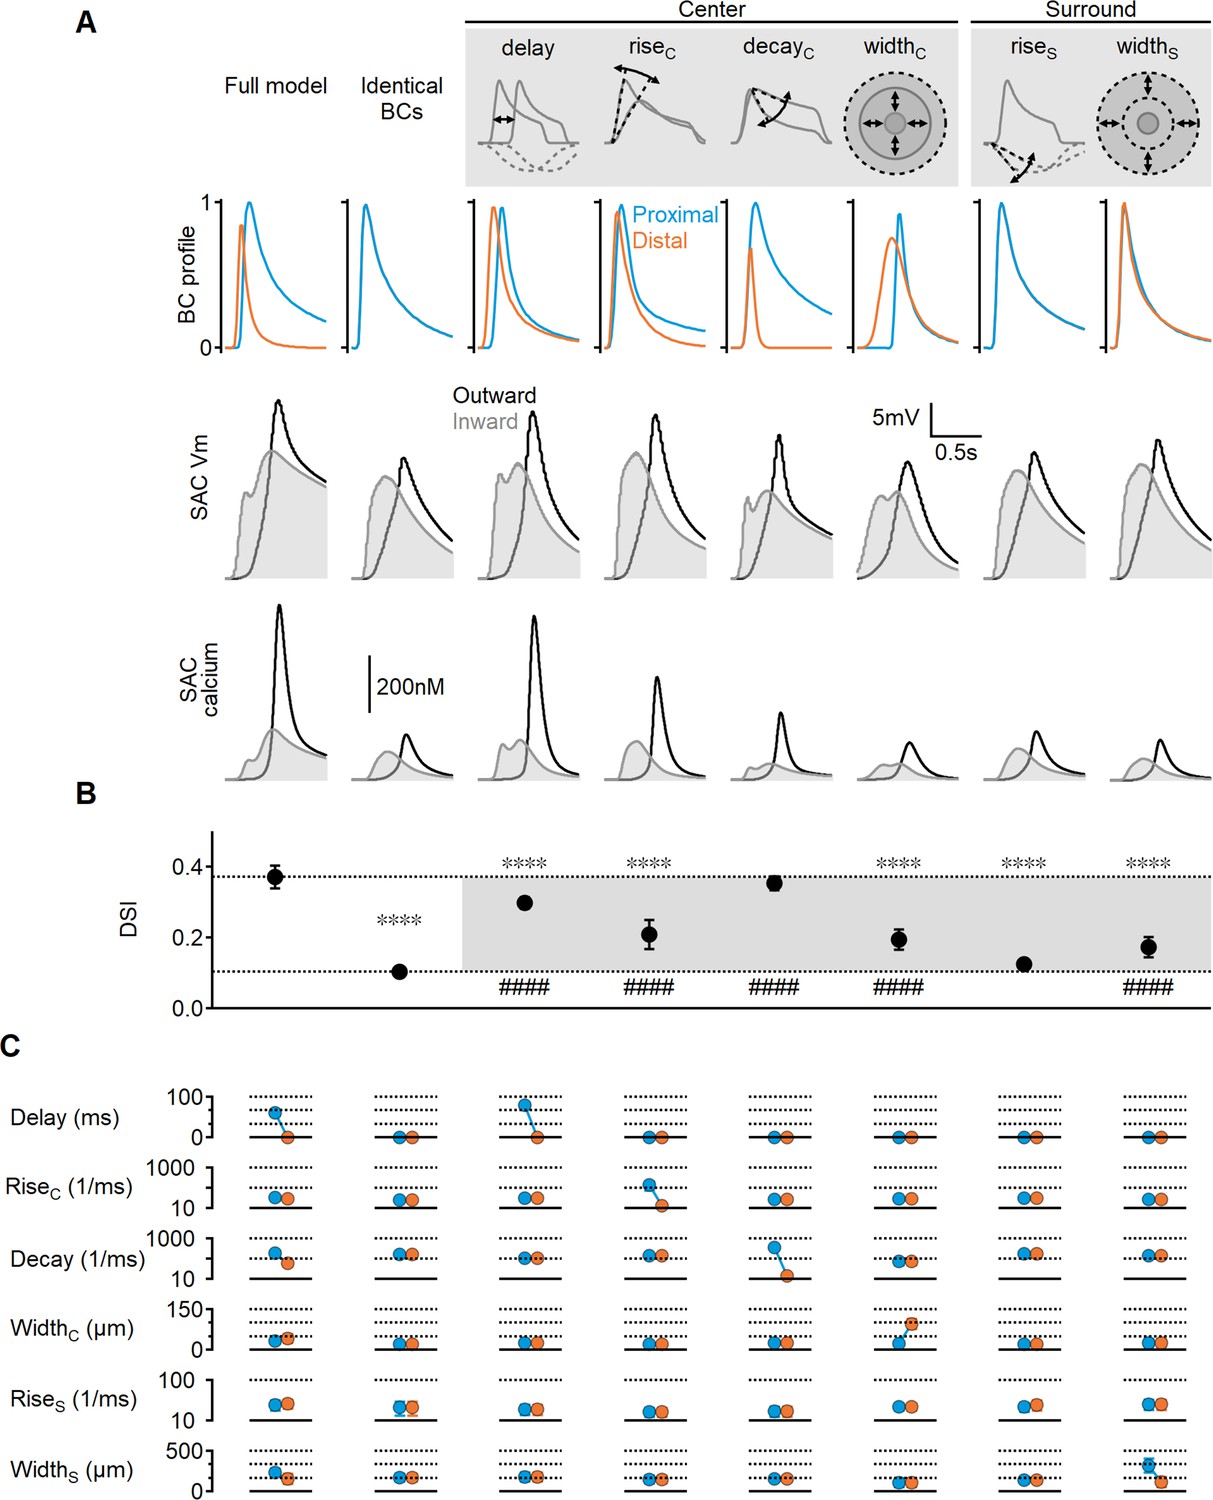
Impact of bipolar cell (BC) receptive field (RF) components on direction selectivity (DS) performance.
(A) Representative responses of bipolar dynamics (top), voltage (middle), and calcium (bottom) in starburst amacrine cell (SAC) dendrites (stimulus speed = 0.5 mm/s) in a model where the proximal and distal bipolar RF formulations differed in a single parameter: response lag ('delay'), rise/decay kinetics, or the spatial extent of RF components. The original, unconstrained configuration and a model with identical RFs are included for comparison. (B, C) Mean (± SD) values of direction selectivity index (B) and the distribution of RF parameters in the proximal/distal presynaptic groups (C) for each scenario (n = 10). Dotted lines in (B) indicate the mean values of the full and identical RFs modes. Rise/decay kinetics are presented on a logarithmic scale. The spatial extent of the center and surround RF components is expressed as the full width at half maximum (FWHM). ∗∗∗∗p<10–6 vs. the full model. ####p<10–6 vs. the identical RF model (ANOVA followed by Tukey’s test).
Figure 4
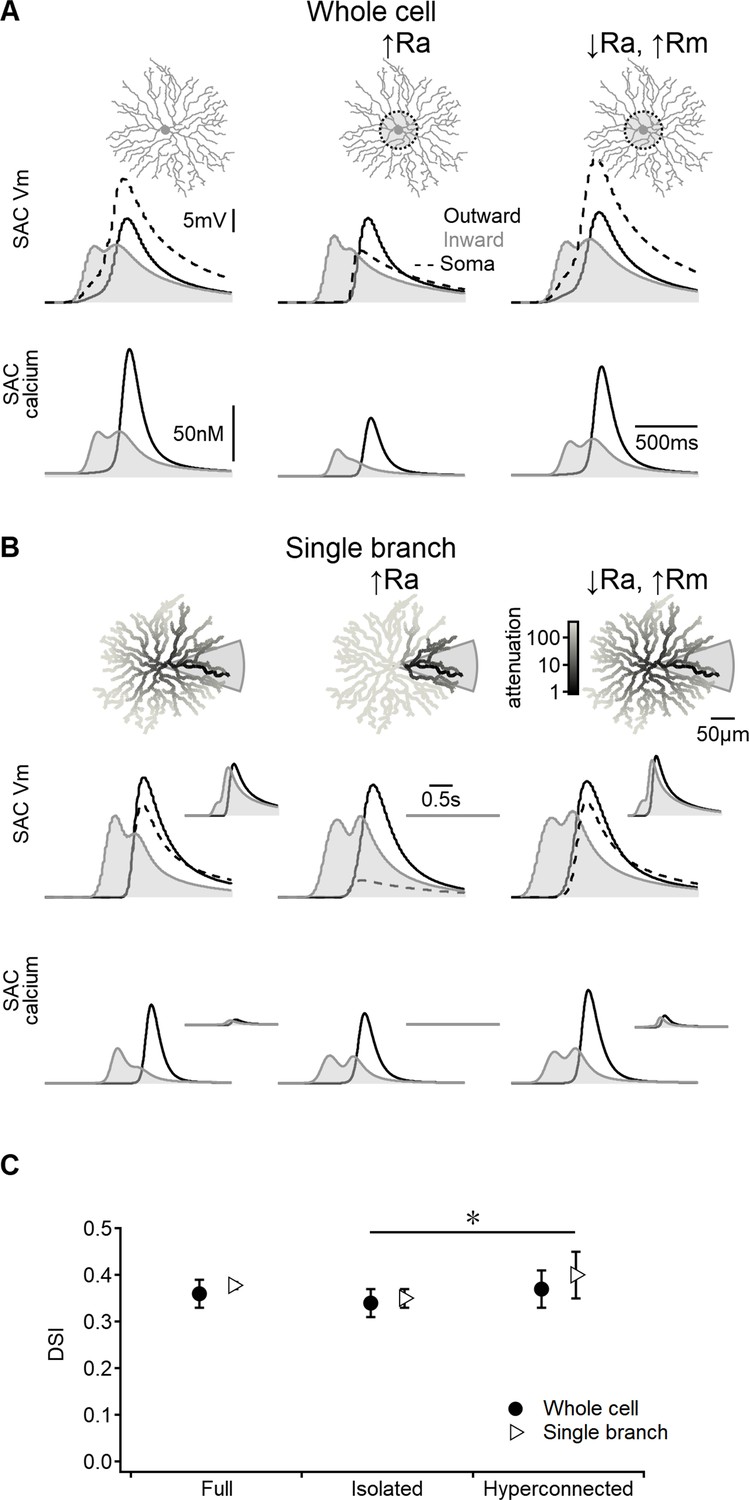
Direction selectivity (DS) in the space-time wiring model is independent of dendritic isolation.
(A) Representative voltage profiles and dendritic calcium signals in the original model (left), starburst amacrine cell (SAC) with reduced inter-dendritic interactions due to elevated internal resistance in the perisomatic area (middle), and a ‘hyperconnected’ SAC model with low signal attenuation in the dendritic tree (right). (B) Similar to panel (A) but for models evolved to enhance DS signals in a single stimulated branch. The cell morphology is color-coded based on voltage attenuation from a distal release site of the stimulated dendrite. Insets show voltage and calcium signals recorded on the opposite side of the cell. (C) Summary of directional tuning observed with different levels of compartmentalization, suggesting a minimal impact of isolation on SAC performance. ∗p=0.01 (ANOVA followed by Tukey’s test).
Figure 5
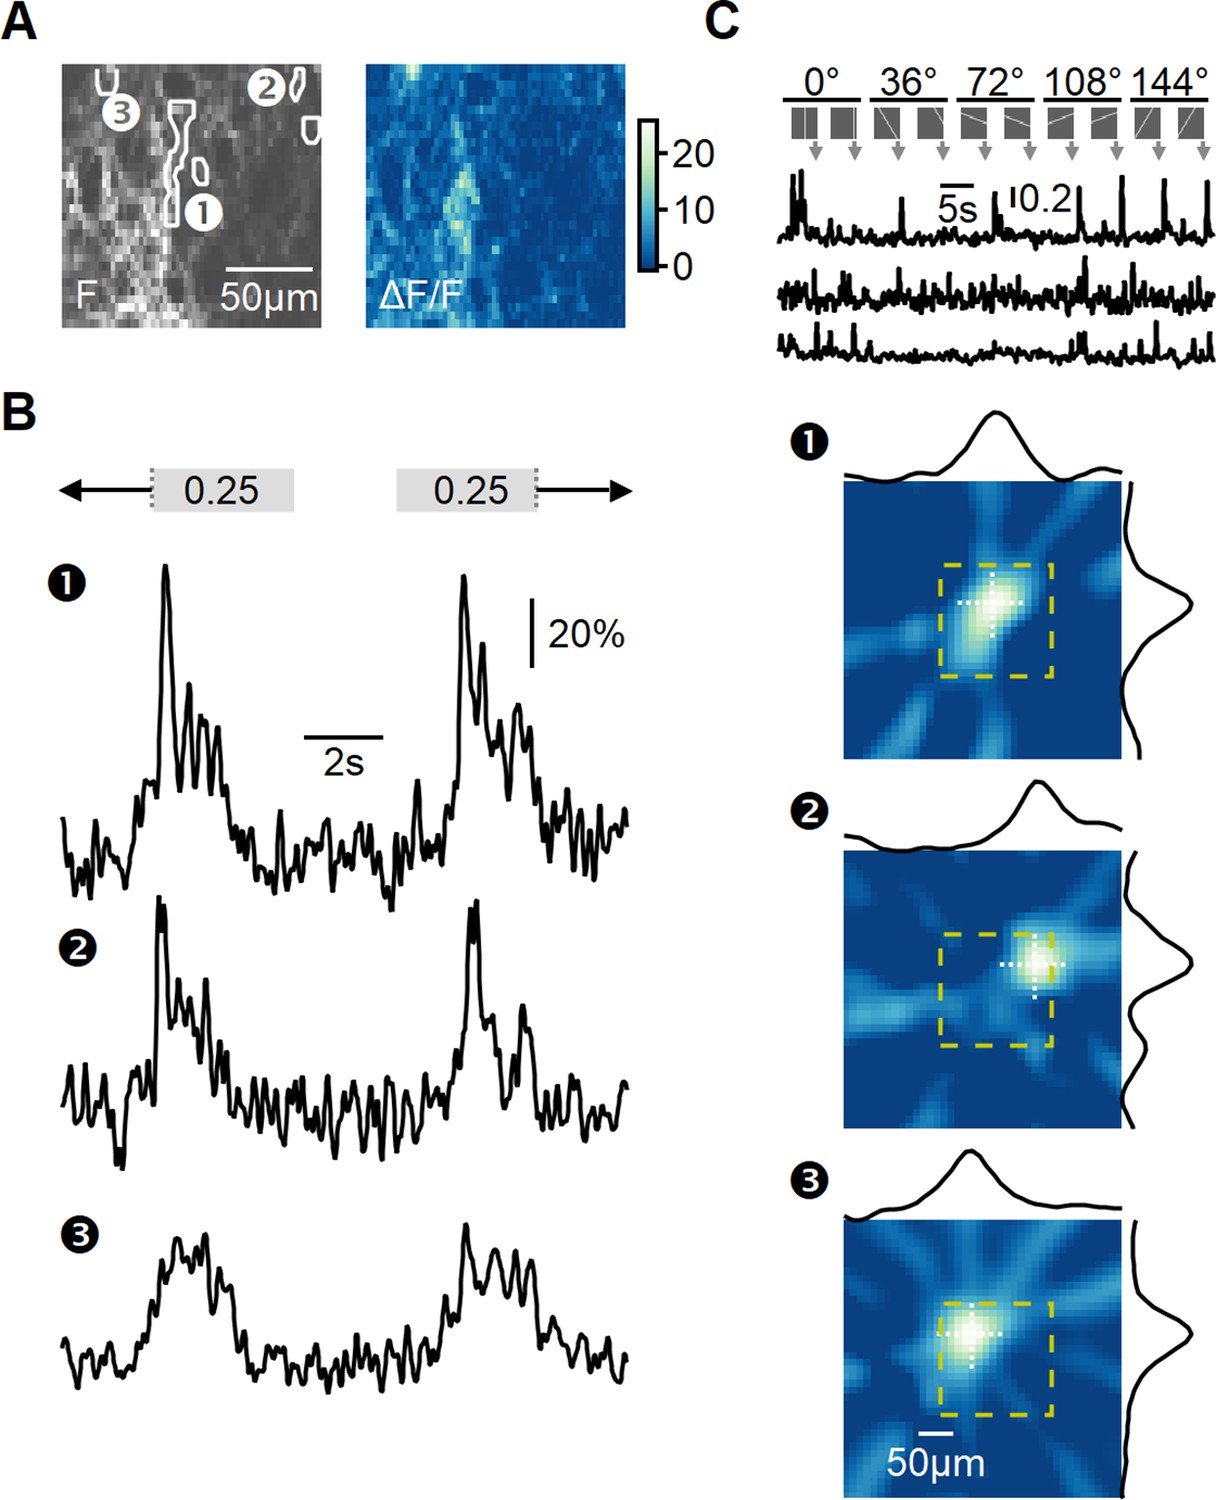
Recording of glutamatergic drive to starburst amacrine cells (SACs) during full-field motion.
(A) Two-photon image of one example field of view (FOV) displaying the average iGluSnFR fluorescence (left) and the processed dF/F signals (right). Floxed iGluSnFR expression was induced using AAVs in ChAT-Cre mice. (B) Responses from the regions of interest (ROIs) indicated in panel (A) to horizontally moving bars (speed = 0.25 mm/s). (C) Receptive field (RF) mapping using the filtered back-projection technique. Top: changes in fluorescence from three example ROIs in response to bars flashed at 32 different spatial positions and 5 orientations. Bottom: reconstructed spatial RFs. The yellow square represents the estimated extent of the two-photon FOV shown in panel (A). The black curves represent the x and y RF profiles measured at the center of mass (indicated by white dotted lines).
Figure 6 with 3 supplements
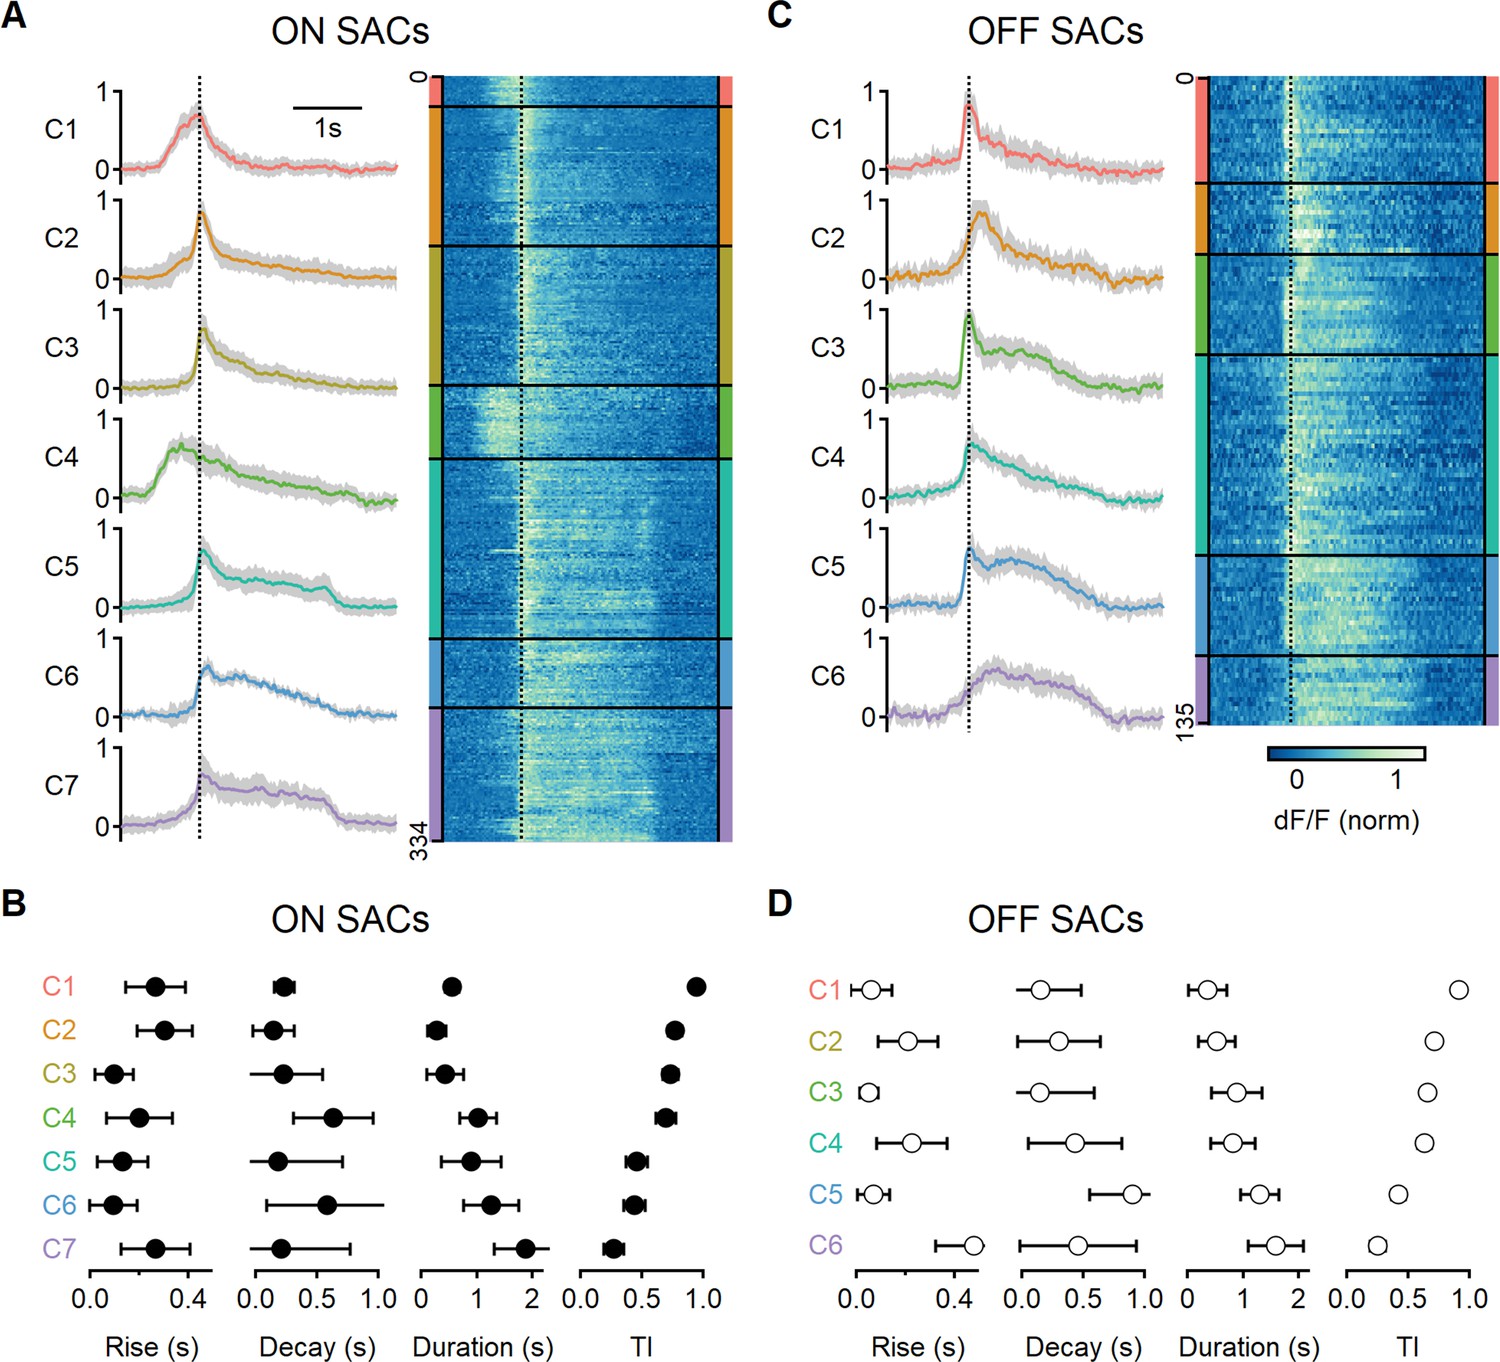
Diversity of glutamatergic responses to motion in ON- and OFF-SAC populations.
(A, C) Left: the average glutamate signals in functional clusters determined from regions of interest (ROI) responses to motion (speed = 0.5 mm/s, color-coded by cluster identity). Shaded areas mark the standard deviation. The dotted line indicates the time of peak response of cluster C1. Right: heatmaps of the responses from individual ROIs. (B, D) Mean (± SD) waveform characteristics measured from individual ROIs in each cluster. TI, transiency index. Clusters are sorted based on their transiency. SAC, starburst amacrine cells.
Figure 6—figure supplement 1
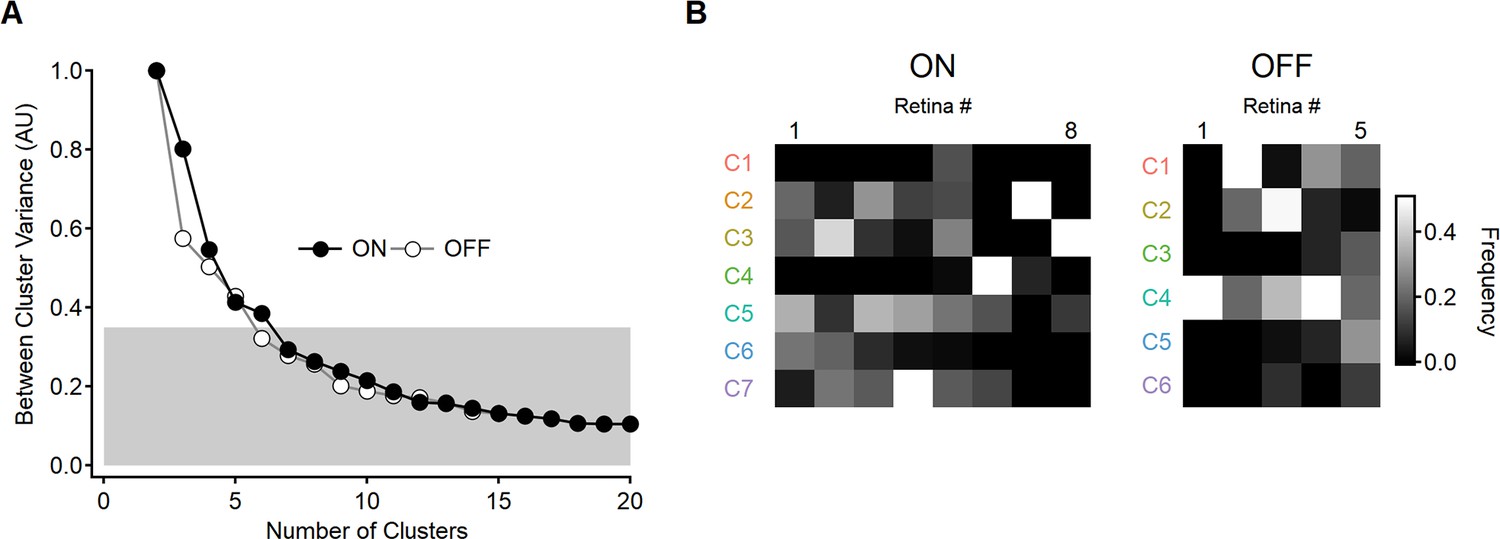
Determining the optimal number of functional clusters for the ON- and OFF-SAC populations.
(A) The variance between input clusters computed based on the shapes of motion responses in individual regions of interest (ROI) as the function of the number of clusters. The metric was normalized to the levels observed with two clusters. The number of clusters was selected as the threshold required to cross e–1 (~36%) of unexplained variance. (B) The prevalence of the functional clusters across recordings. Color coding indicates the relative frequency of the functional clusters observed within each retina preparation.SACs, starburst amacrine cells.
Figure 6—figure supplement 2
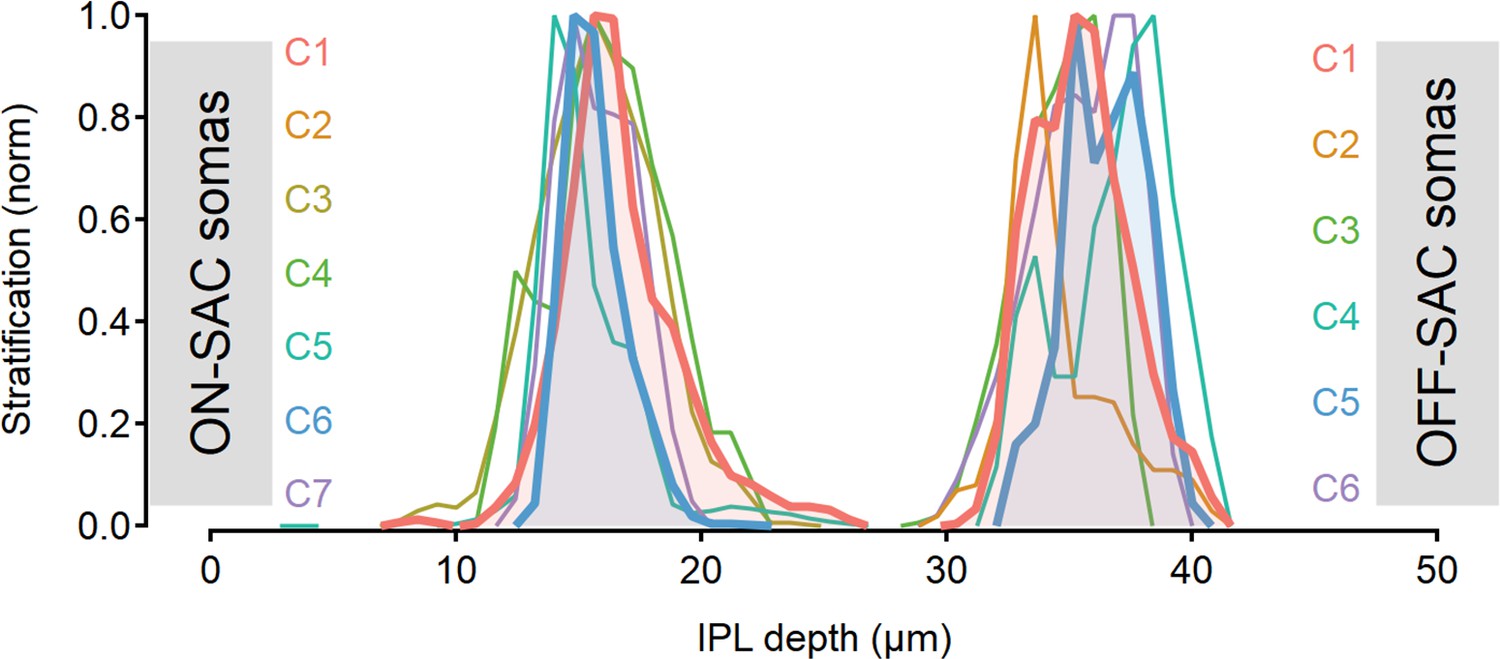
Stratification profile of the functional clusters detected from motion responses in ON- and OFF-SACs.
Functional clusters whose combination was found to lead to the strongest postsynaptic direction selectivity (DS) are highlighted in bold and shaded for emphasis. SACs, starburst amacrine cells.
Figure 6—figure supplement 3
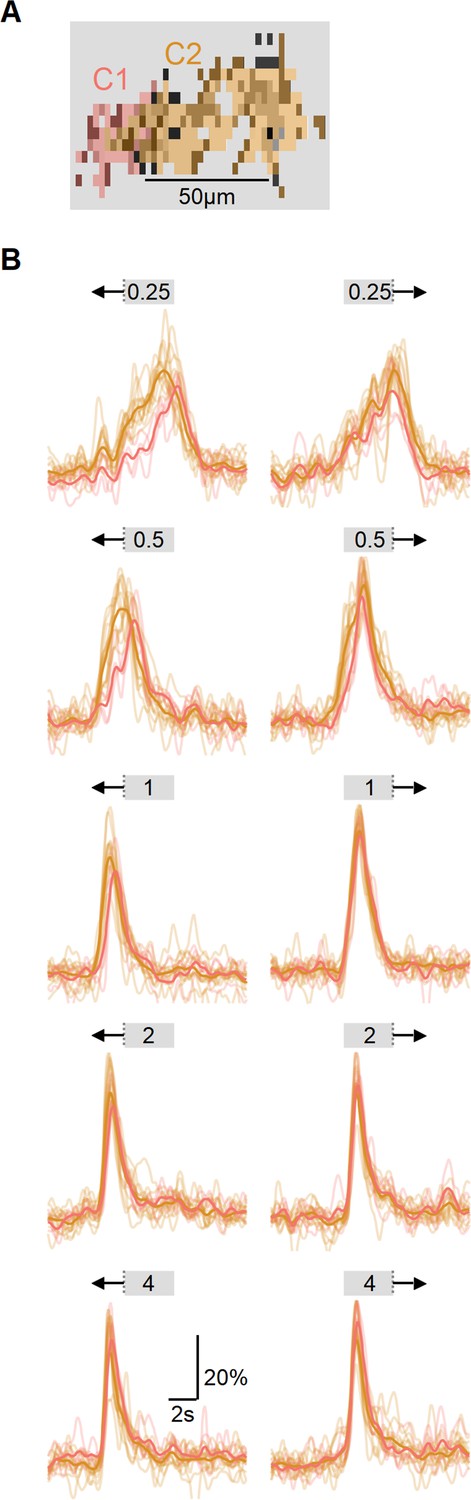
Comparison of response onset from different functional clusters.
(A) A single field of view recorded in ON-SAC dendrites expressing iGluSnFR. Each region of interest (ROI) is color-coded based on its functional cluster identity, displayed in grayscale. (B) Changes in fluorescence for different stimuli speeds (from 0.25 mm/s to 4 mm/s) and directions. Color coding indicates functional cluster; bold traces – average responses across all ROIs belonging to the same cluster. The onset of ON-C2 responses was earlier in both directions. This effect is particularly pronounced at slower velocities. SACs, starburst amacrine cells.
Figure 7 with 2 supplements
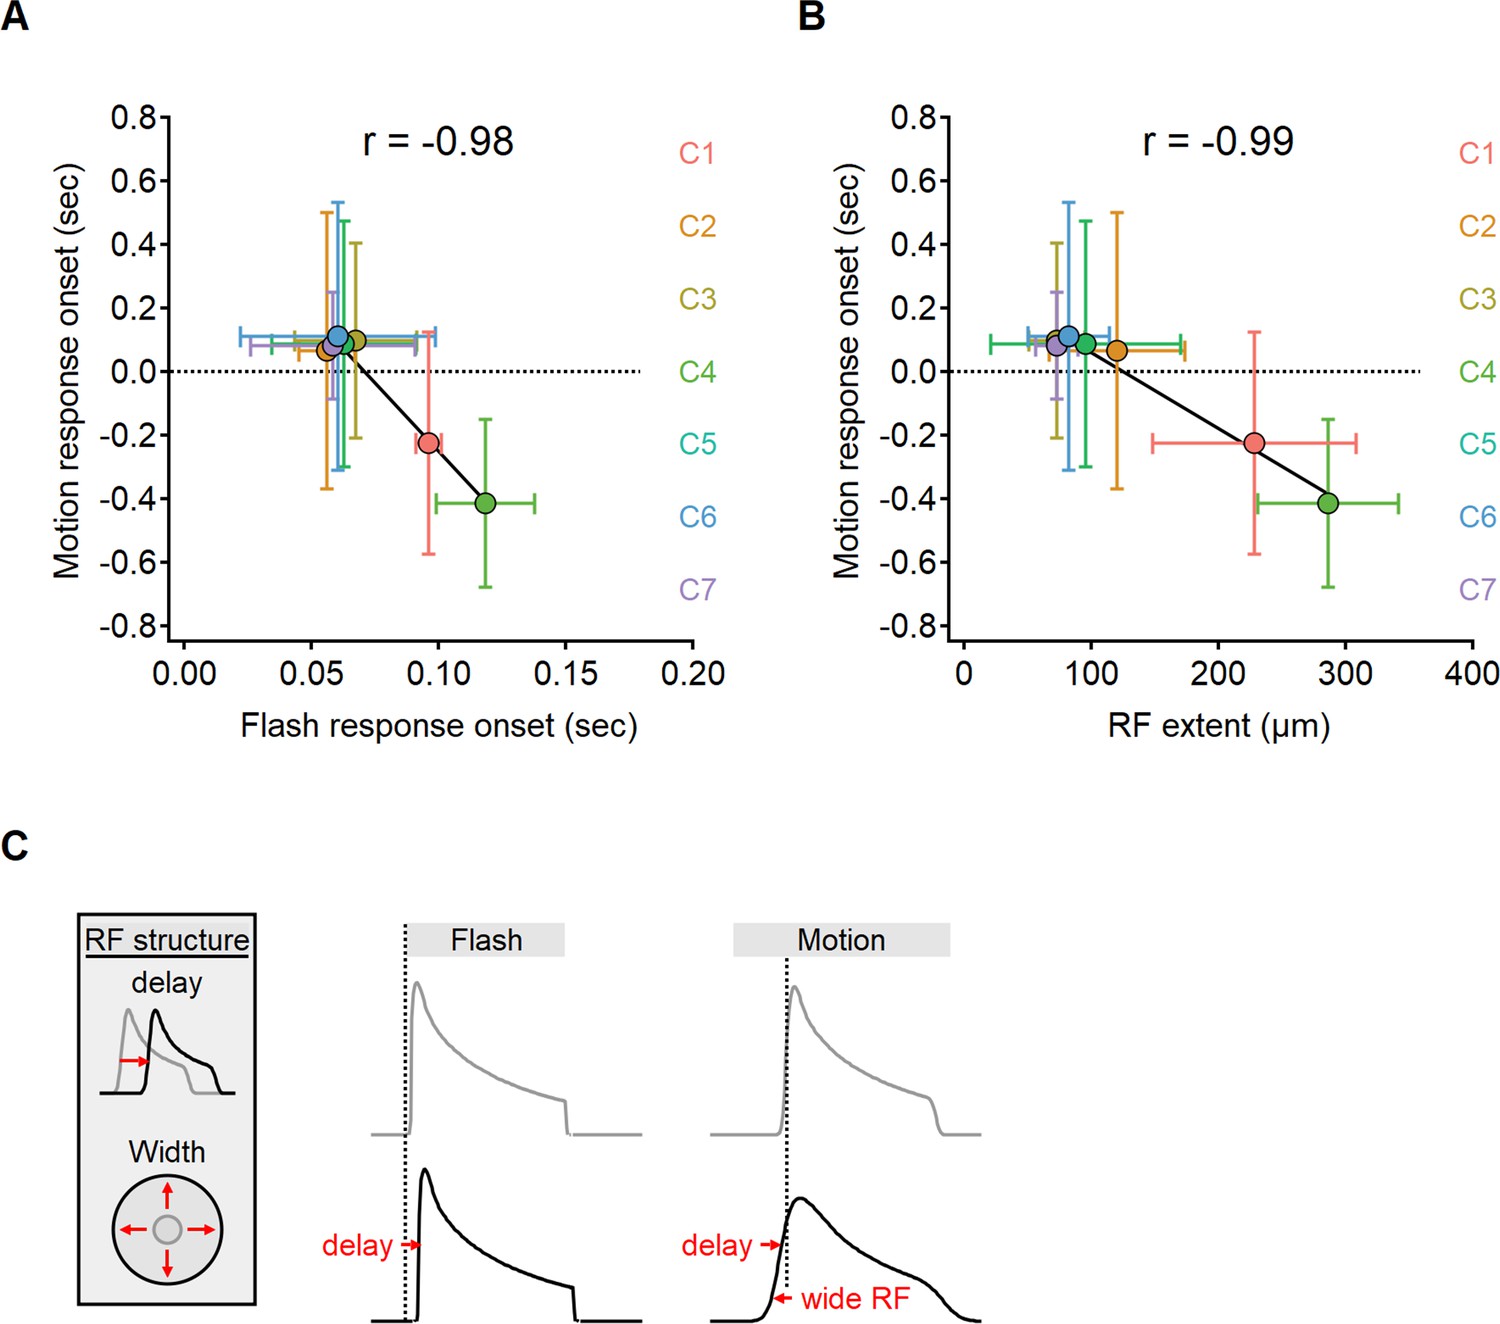
The onset of motion responses depends on the extent of the receptive field (RF) and not on response lag measured with static stimuli.
(A, B) Correlation between the onset of motion responses and the static response lag (A), and RF width (B) color-coded by functional cluster identity. Clusters with the longest lags have wide RFs and earliest responses to motion. (C) Illustration of the interaction between two mechanisms contributing to the time of response onset. Cells with prolonged visual processing delay will respond later to the presentation of a static stimulus (black). When moving bars are presented, response timing depends on the processing time lag, the size of the RF, and stimulus velocity.
Figure 7—figure supplement 1
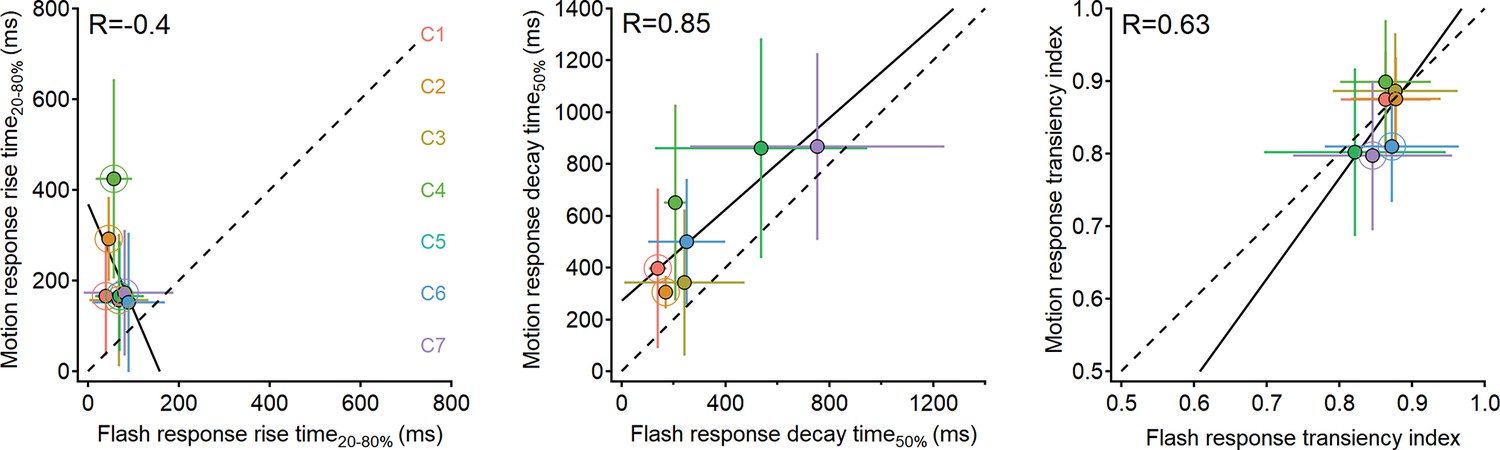
Comparison of response dynamics to moving bars and stationary flashes.
Waveform parameters measured from responses recorded in ON-SAC regions of interest (ROIs) to moving bars (speed = 0.5 mm/s) plotted as the function of the dynamics in responses to full-field flashes. Black lines represent linear fits. R is the Pearson correlation coefficient. Clusters with significantly different parameters (p<0.05, paired t-test followed by Bonferroni correction for multiple comparisons) are highlighted with larger circles. Error bars represent SD. SACs, starburst amacrine cells.
Figure 7—figure supplement 2
Example receptive field (RF) shape and responses to moving and static stimuli with full-field and masked stimulation.
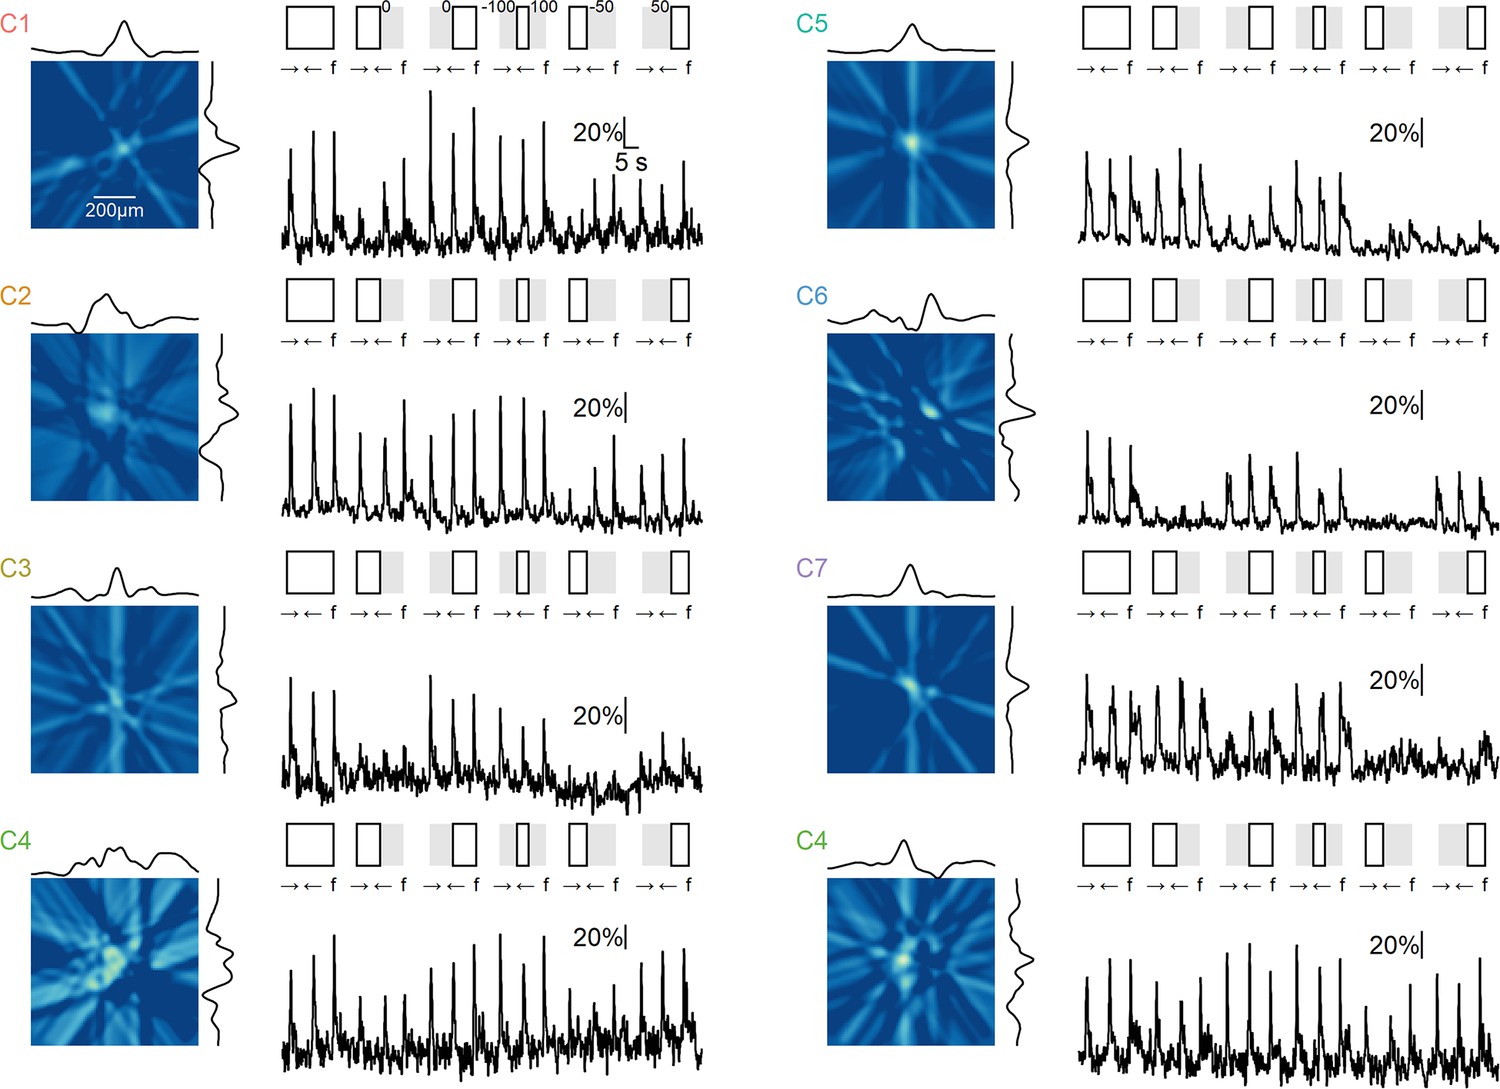
For each ON cluster, the left plot displays a representative RF shape obtained using the filter back-projection technique. The black curves represent the x and y RF profiles measured at the center of mass. On the right, the responses in the same region of interest (ROI) are shown for a series of stimuli consisting of rightward and leftward motion (speed = 0.5 mm/s) and flashes ('f', duration = 2 s) under the following conditions (illustrated schematically at the top): full-field stimulation, masks over the right/left halves of the visual arena, stimuli confined to a region extending 100 µm from the horizontal center of the arena, and right/left masks with edges 50 µm from the horizontal center of the arena. Two examples are shown for the ON-C4 cluster. The responses to flashes generally align with the spatial extent of the RF as determined using the filtered back-projection technique. Note the asymmetry in motion responses near edges.
Figure 8 with 1 supplement
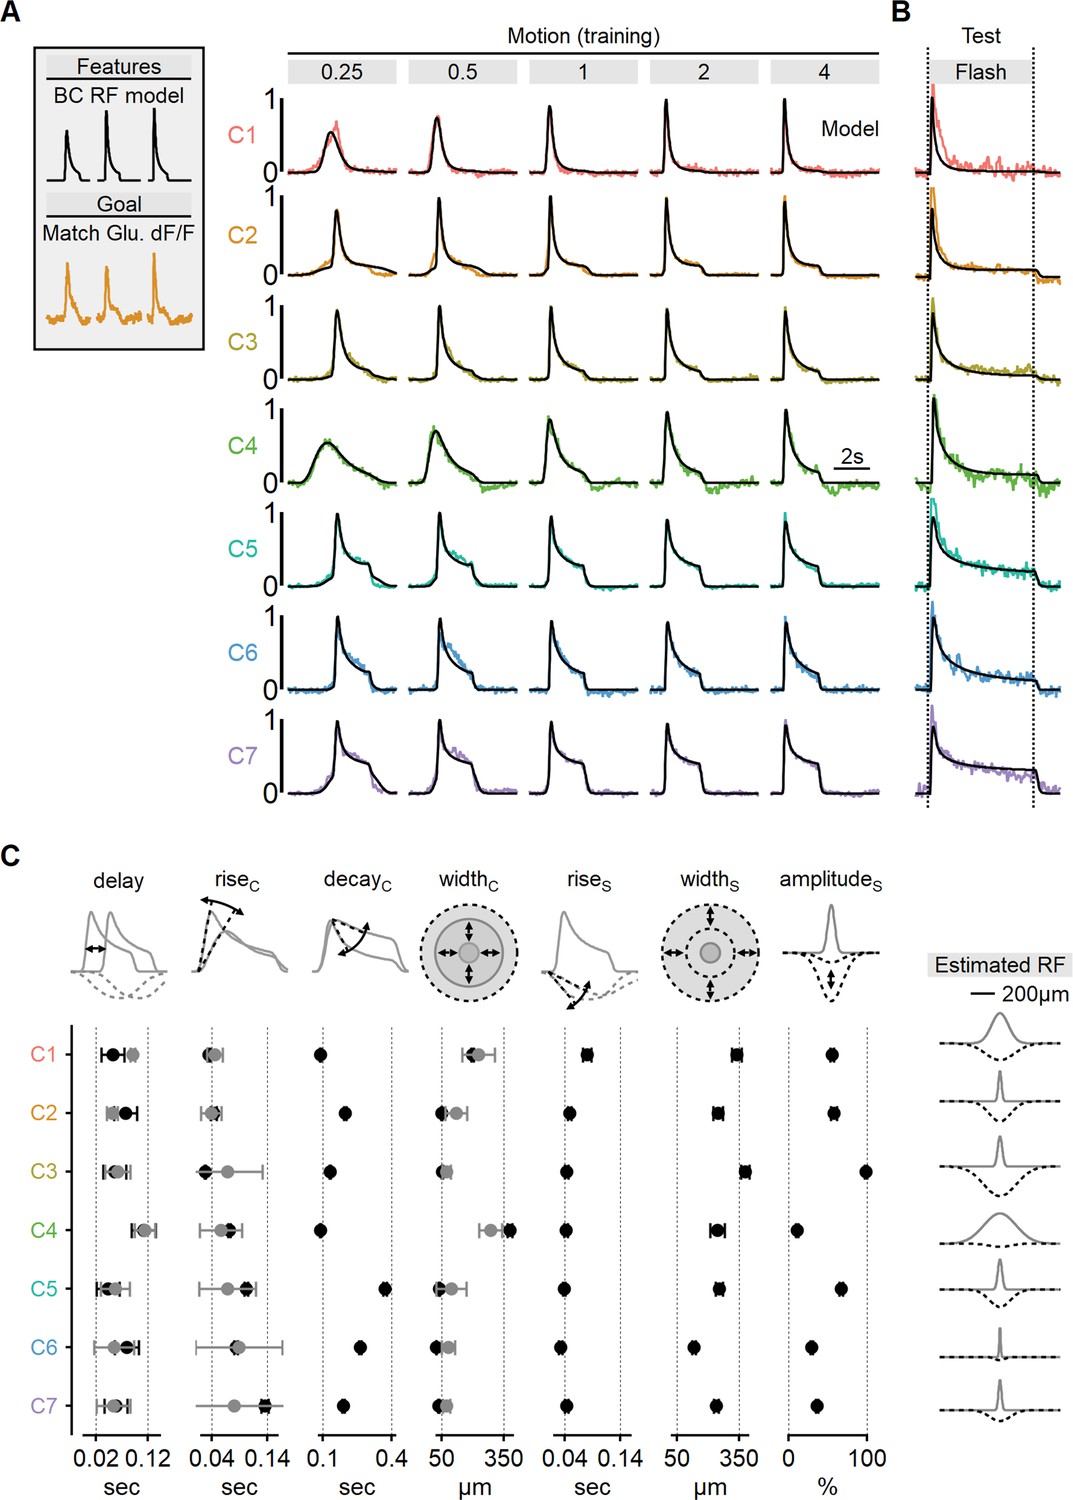
Estimated receptive field (RF) properties from presynaptic responses to motion.
(A) Center-surround RF model was trained using an evolutionary algorithm to match experimentally recorded waveforms in ON-SACs. Experimental data is color-coded as in Figure 6. The output of the seven models is shown in black. (B) Comparison between experimentally recorded responses to 4-s-long full-field flashes and the predictions of the models (black). (C) Mean (± SD) RF properties measured from each of the models (n = 10 repeats for each cluster) are shown in black. The corresponding parameters determined experimentally are shown in gray. Delay and rise time were measured from flash responses, and the full width at half maximum (FWHM) of the center was analyzed from RF maps. The right panel illustrates the predicted spatial extent of the center (gray) and surround (dotted black) RF components in each functional cluster. SACs, starburst amacrine cells.
Figure 8—figure supplement 1

Estimated receptive field (RF) properties from presynaptic responses to motion in OFF-SACs.
Figure 9 with 1 supplement
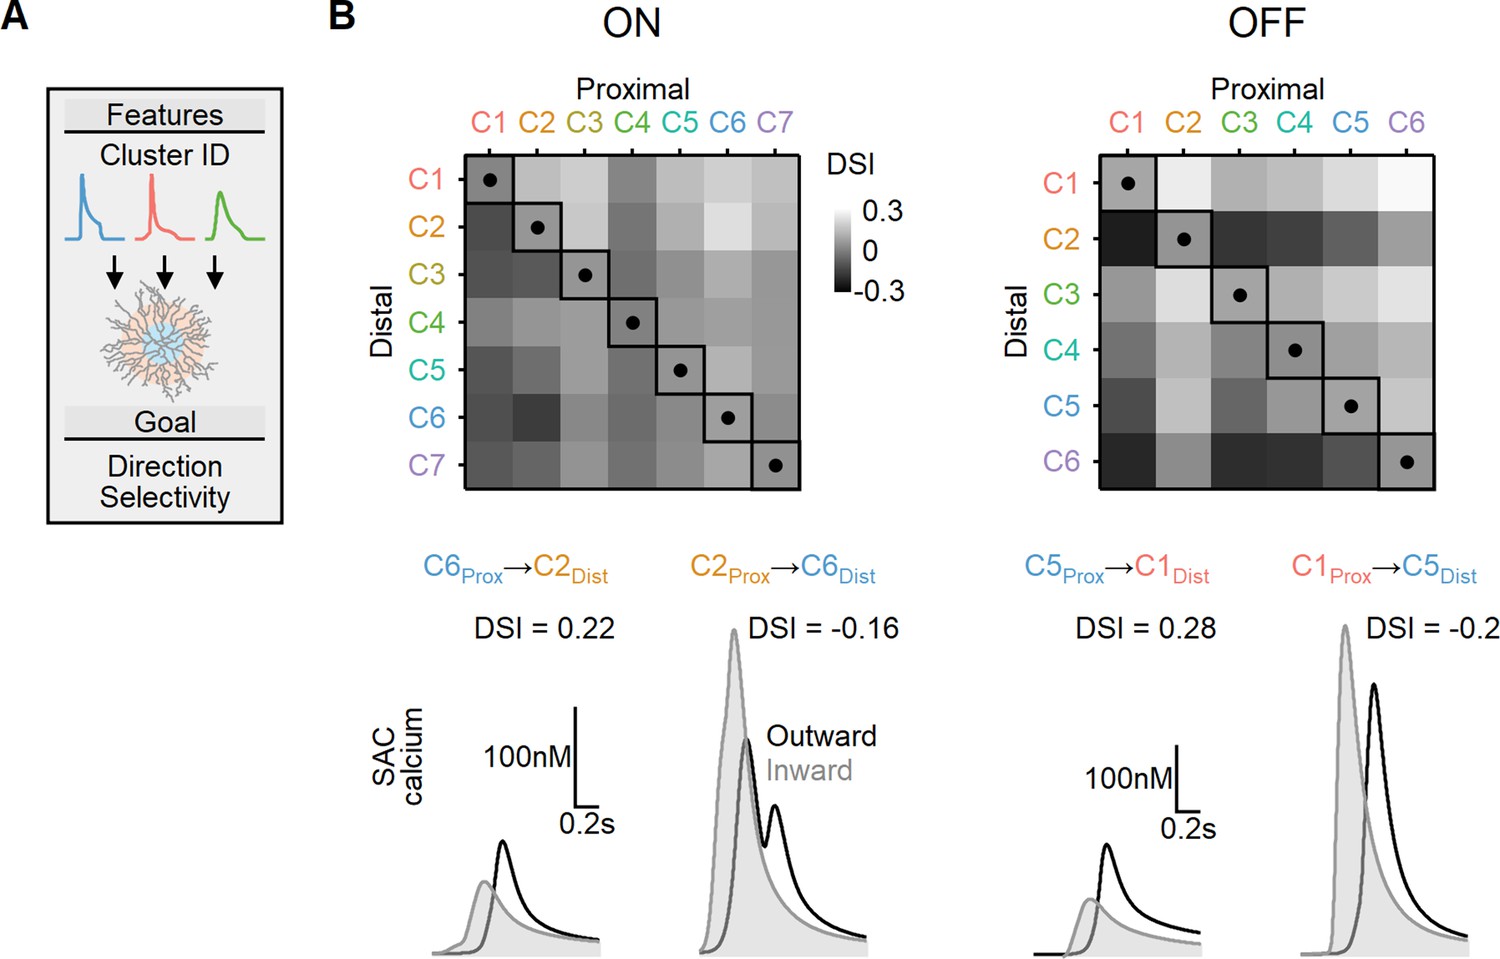
Directional tuning in bipolar–starburst amacrine cell (SAC) models with experimentally recorded excitatory waveforms segregated into proximal-distal regions.
(A) Schematic representation of the evolutionary algorithm employed to maximize direction selectivity (DS) by utilizing deconvolved waveforms from experimentally recorded clusters as the input. (B) Top: DS achieved by the models when various combinations of input waveforms are targeted toward the proximal and distal SAC dendrites. Squares and dots represent cases where the waveforms are identical for all bipolar cells. Bottom: representative calcium signals obtained from the best (left) and worst (right) combinations of input waveforms.
Figure 9—figure supplement 1

Correlation between directional tuning and postsynaptic passive and active parameters.
Directional tuning of each proximal-distal pair shown in Figure 9 as a function of membrane conductance (reciprocal of membrane resistance, left), axial resistance (middle), and the voltage-gated calcium conductance (right) measured in the optimal model. Lines, linear fits. Higher direction selectivity (DS) levels were associated with a leakier membrane and lower internal resistance in starburst amacrine cells (SACs). These parameters have opposite effects on dendritic isolation.
Figure 10
Optimal direction selectivity (DS) with experimentally recorded excitatory waveforms.
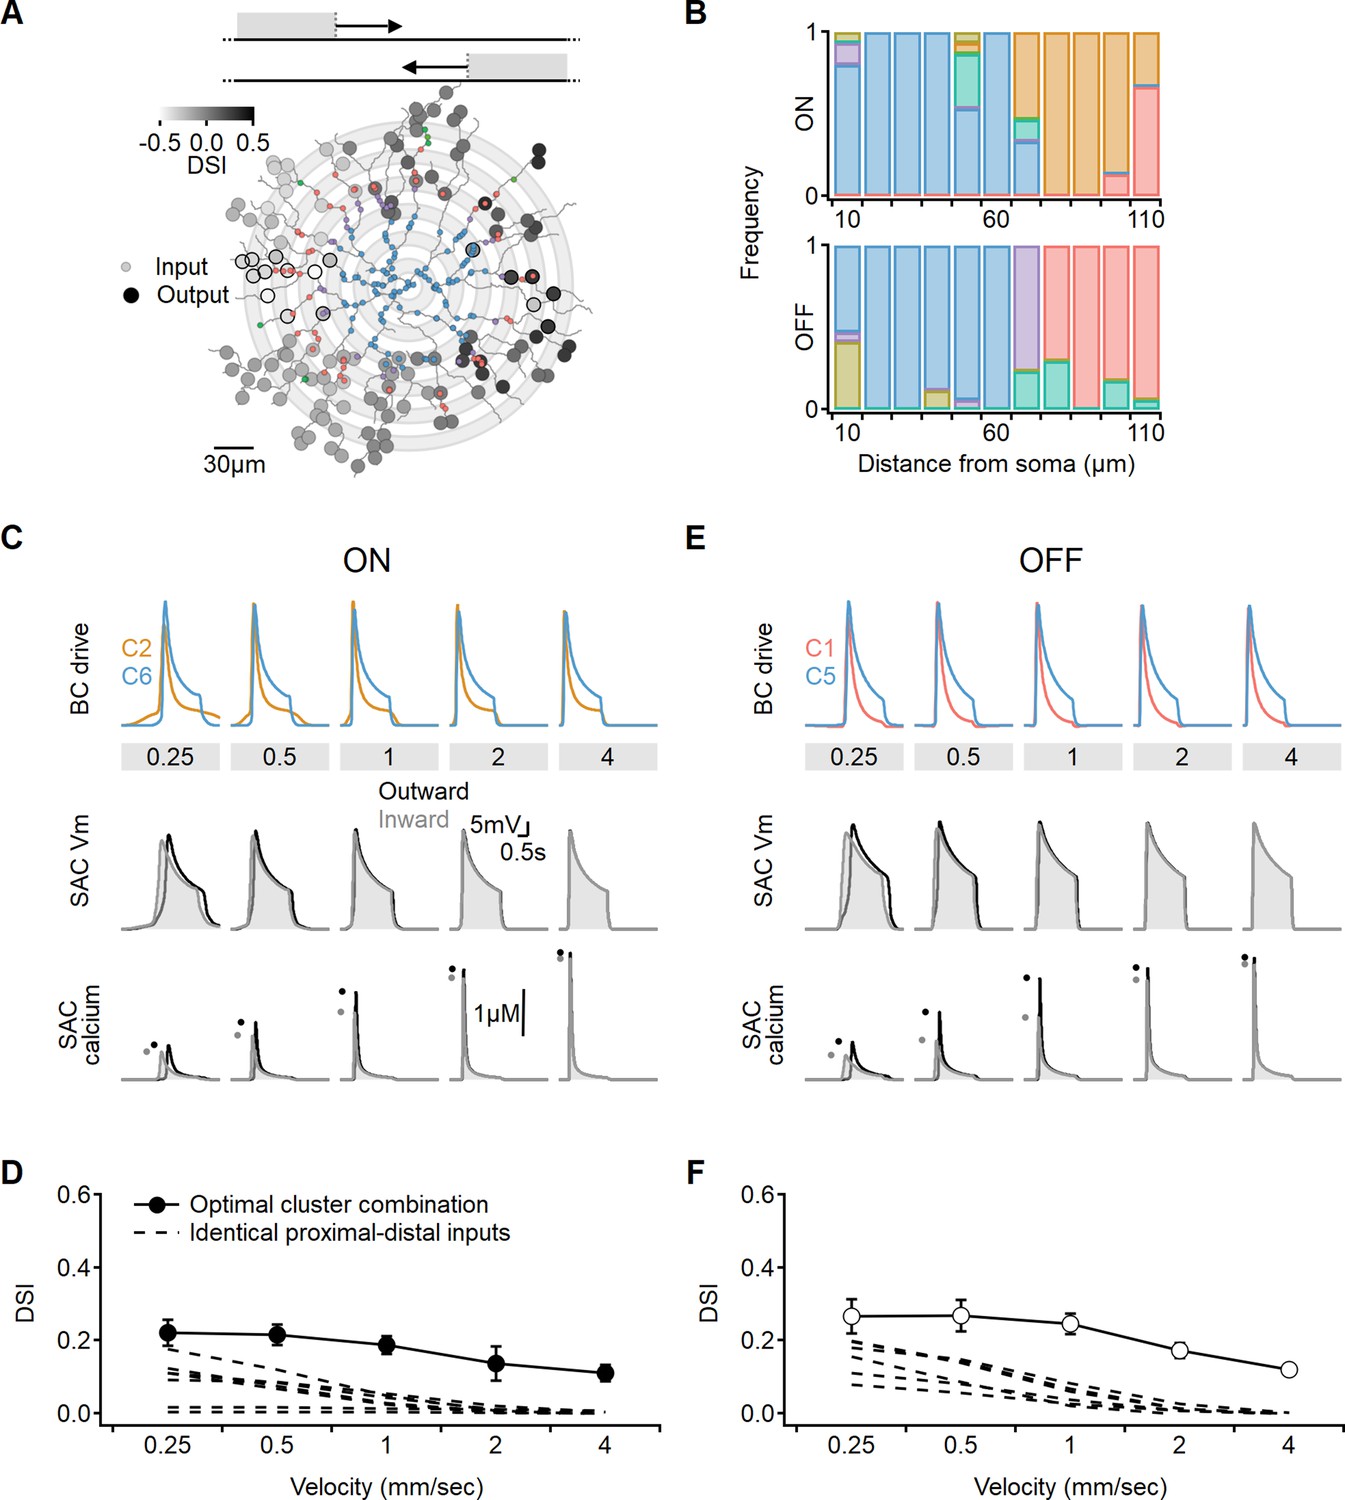
Investigation of directional performance in a multicompartmental bipolar-SAC model innervated by experimentally-recorde functional clusters. (A) Illustration of an example solution superimposed on SAC morphology. The distribution of BC inputs was symmetrical along the soma-dendritic axis based on their distance from the soma (small circles and grey annuli). Deconvolved waveforms from one of the experimentally recorded clusters were applied to all synapses within each bin. Output synapses are indicated with large circles and color coded by the DSI. The degree of postsynaptic direction selectivity was measured within 30 µm from the horizontal axis (these outputs are highlighted with black strokes). (B) The spatial distribution of functional clusters producing optimal directional signals across 15 model runs. Input color coding in (A) and (B) as in Figure 6. (C) Top: overlay of the velocity tuning dynamics for ON-C2 and ON-C6, representing the most commonly observed proximal and distal clusters. Middle and bottom: voltage and calcium signals in a SAC dendrite generated by one of the evolved models. Dots indicate peak response amplitudes in inward (grey) and outward (black) stimulation directions. (D) Directional tuning as a function of stimulus velocity, with the solid curve representing the mean (± SD) results obtained from the model. Dotted, velocity tuning calculated from simulations with SAC innervation by a single functional cluster (see Figure 9). ‘Space-time wiring’ improves directional selectivity over a wide range of stimulation velocities. (E-F) as in (C-D), but for OFF-SACs.
Figure 11 with 1 supplement
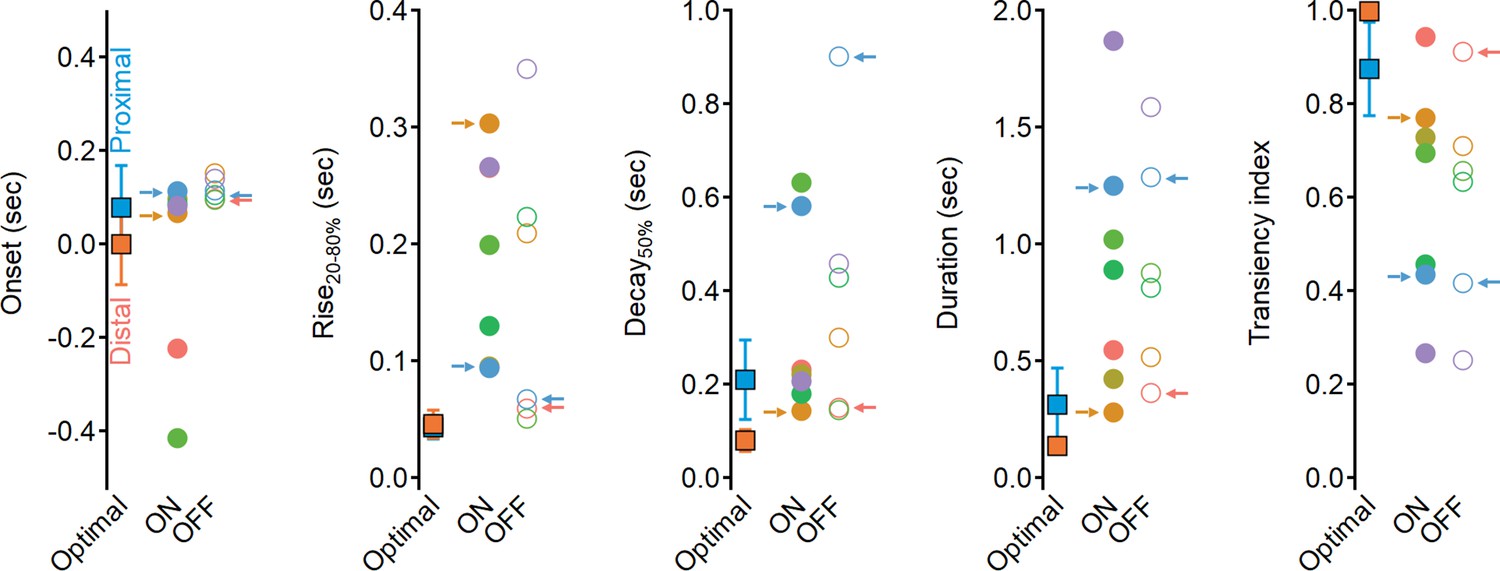
Dynamics of glutamate release onto starburst amacrine cells (SACs) are sluggish and more sustained compared to the optimal excitatory drive produced in synthetic model.
Waveform parameters, measured for synthetic receptive field (RFs) driving optimal direction selectivity (squares) and for experimentally determined functional clusters (filled circles – ON, open circles – OFF). Color coding as in Figure 6. Clusters identified as best contributors for the Hassenstein–Reichardt correlator (proximal: ON-C2 and OFF-C1; distal: ON-C6 and OFF-C5) are marked with arrows.
Figure 11—figure supplement 1
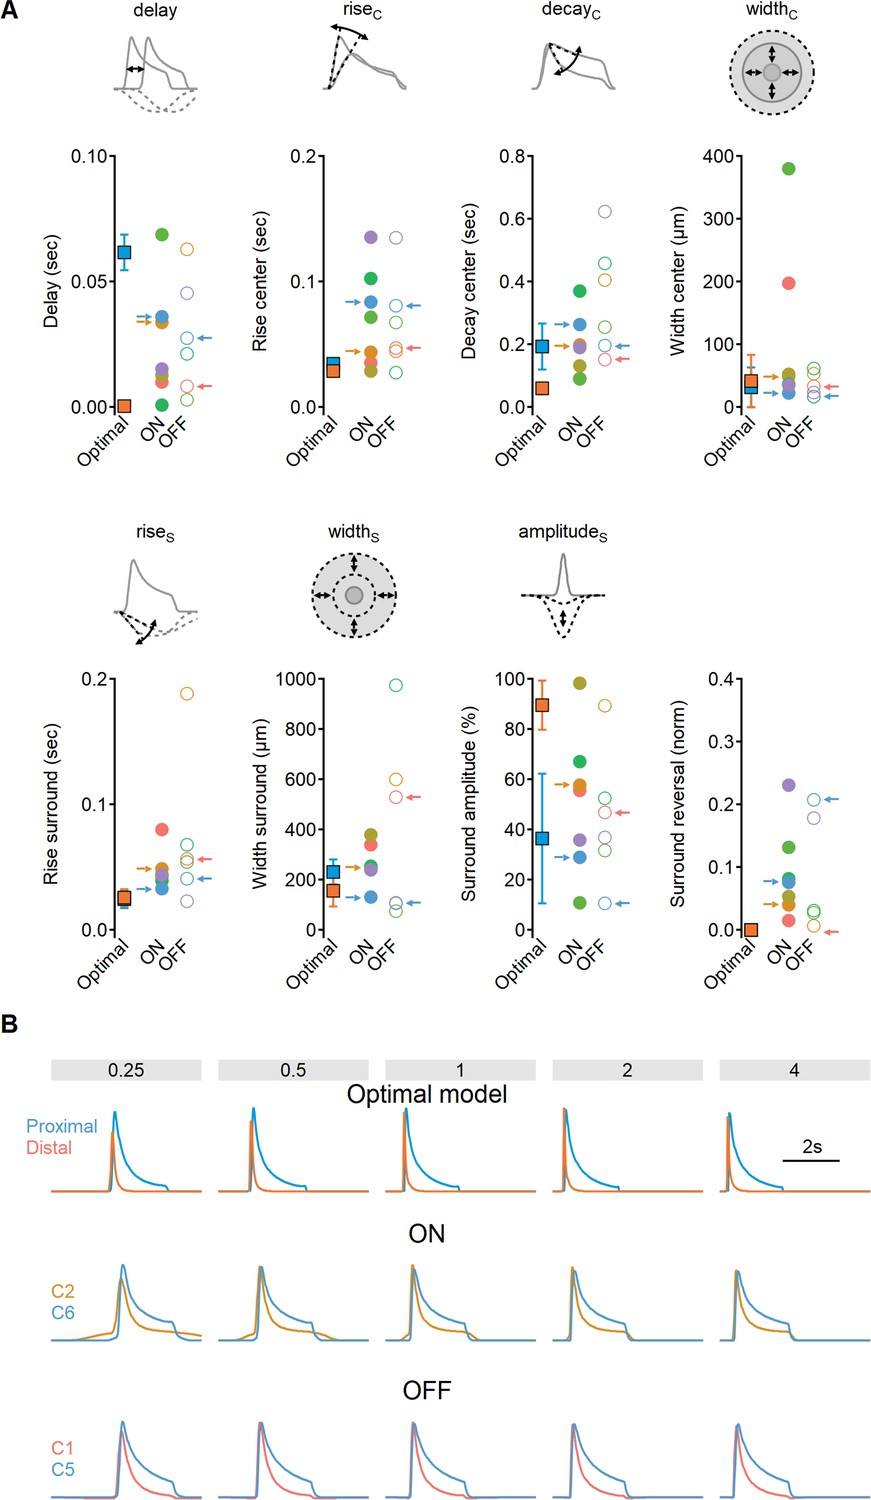
Comparison of receptive field (RF) structure between experimentally determined clusters and the synthetic model mediating optimal directional sensitivity.
(A) The mean (± SD) values measured for RF synthetic and experimental components. Data presented as in Figure 11. (B) Comparison of response waveforms as a function of stimulus velocities produced by optimal synthetic model (top, same data as in Figure 2) and experimentally recorded glutamate signals (middle, bottom, same data as in Figure 10).
Additional files
Download links
A two-part list of links to download the article, or parts of the article, in various formats.
Downloads (link to download the article as PDF)
Open citations (links to open the citations from this article in various online reference manager services)
Cite this article (links to download the citations from this article in formats compatible with various reference manager tools)
Heterogeneous presynaptic receptive fields contribute to directional tuning in starburst amacrine cells
eLife 12:RP90456.
https://doi.org/10.7554/eLife.90456.3


