Discovering non-additive heritability using additive GWAS summary statistics
- Center for Computational Molecular Biology, Brown University, United States
- Department of Ecology and Evolutionary Biology, Brown University, United States
- Department of Integrative Biology, The University of Texas at Austin, United States
- Department of Population Health, The University of Texas at Austin, United States
- Institute for Computational and Experimental Research in Mathematics, Brown University, United States
- Department of Biostatistics, Brown University, United States
- Data Science Institute, Brown University, United States
- Microsoft, United States
Figures
Figure 1 with 5 supplements
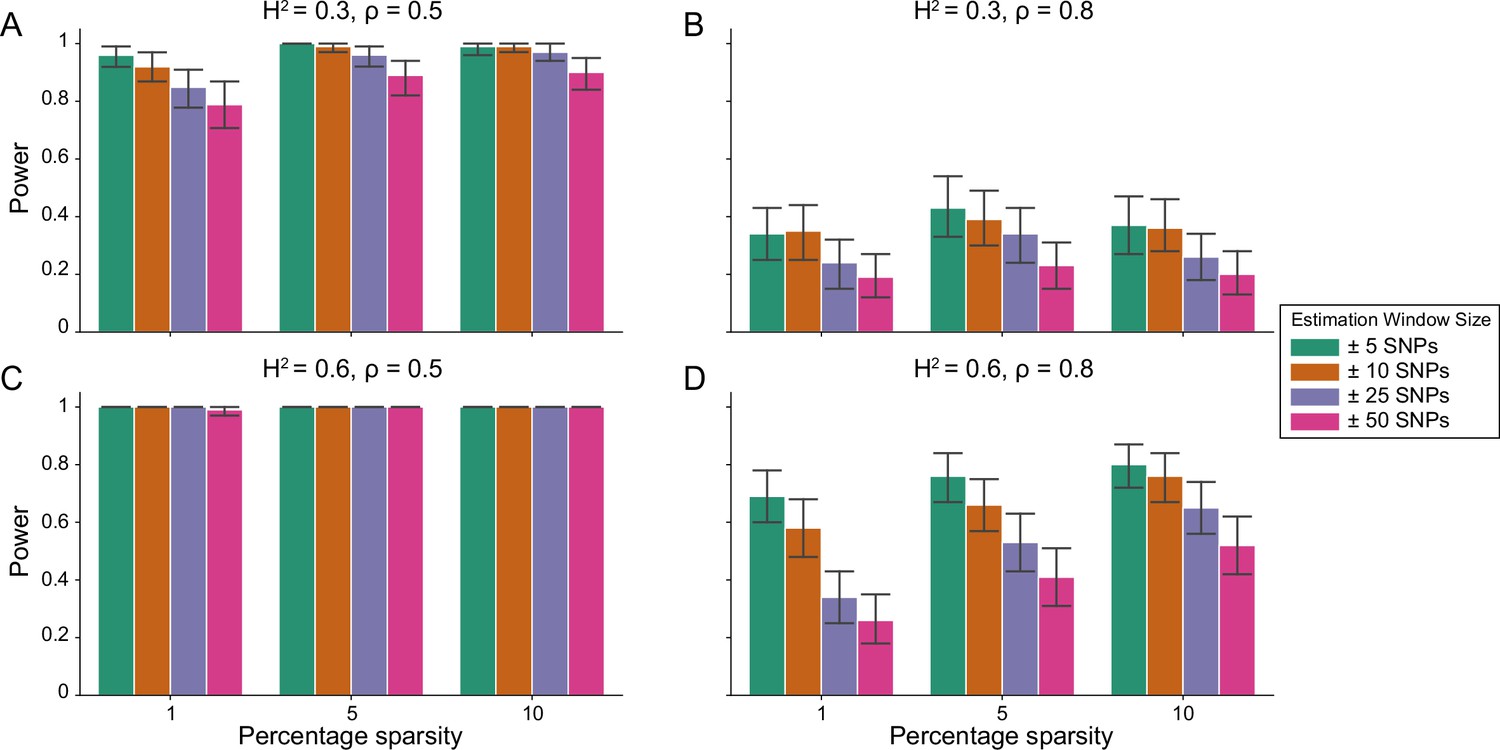
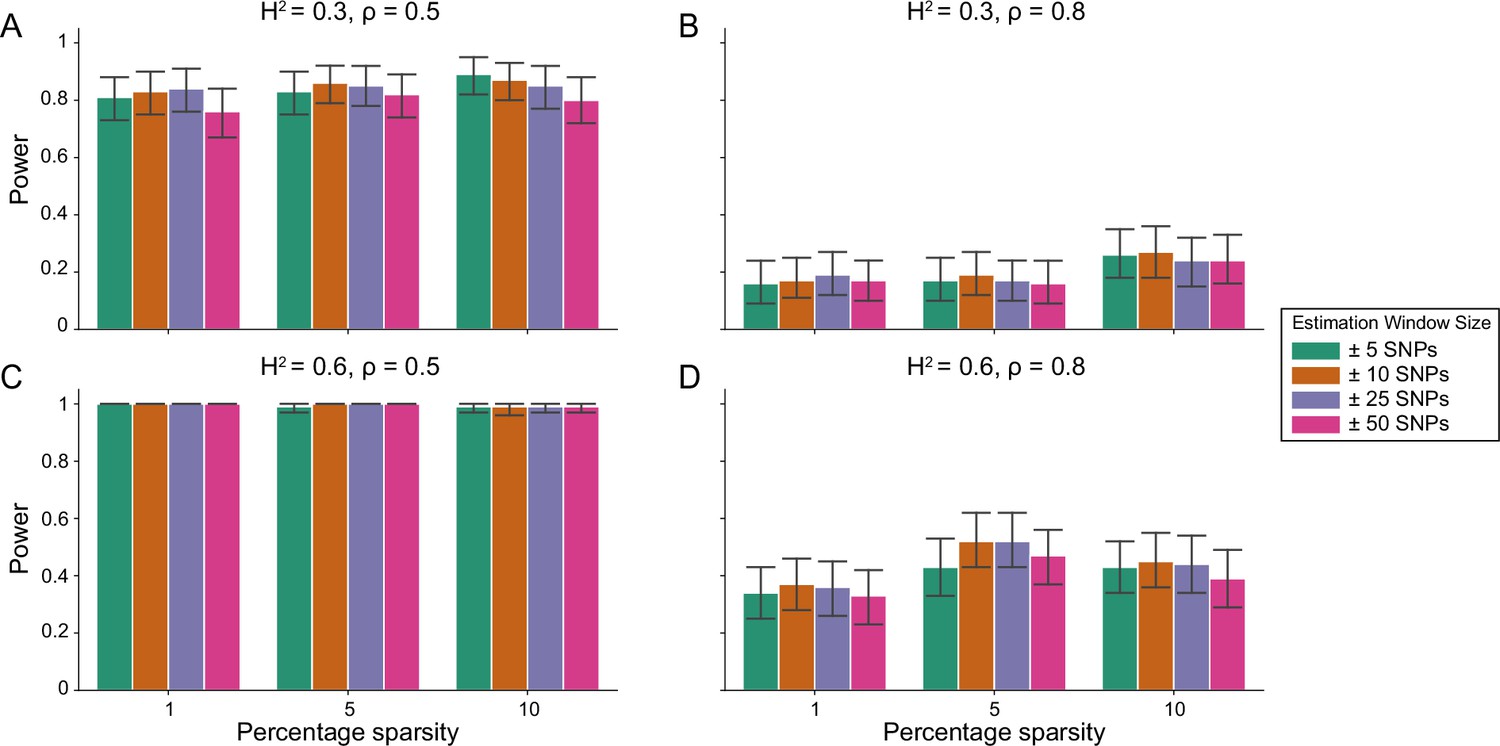
Power of the i-LDSC framework to detect tagged pairwise genetic interaction effects on simulated data.
Synthetic trait architecture was simulated using real genotype data from individuals of self-identified European ancestry in the UK Biobank. All SNPs were considered to have at least an additive effect (i.e. creating a polygenic trait architecture). Next, we randomly select two groups of interacting variants and divide them into two groups. The group #1 SNPs are chosen to be 1%, 5%, and 10% of the total number of SNPs genome-wide (see the x-axis in each panel). These interact with the group #2 SNPs which are selected to be variants within a ± 10 kilobase (kb) window around each SNP in group #1. Coefficients for additive and interaction effects were simulated with no minor allele frequency dependency (see Materials and methods). Panels (A) and (B) are results with simulations using a heritability , while panels (C) and (D) were generated with . We also varied the proportion of heritability contributed by additive effects to (A, C) and (B, D) , respectively. Here, we are blind to the parameter settings used in generative model and run i-LDSC while computing the cis-interaction LD scores using different estimating windows of ± 5 (green), ± 10 (orange), ± 25 (purple), and ± 50 (pink) SNPs. Results are based on 100 simulations per parameter combination and the horizontal bars represent standard errors. Generally, the performance of i-LDSC increases with larger heritability and lower proportions of additive variation. Note that LDSC is not shown here because it does not search for tagged interaction effects in summary statistics.
Figure 1—figure supplement 1
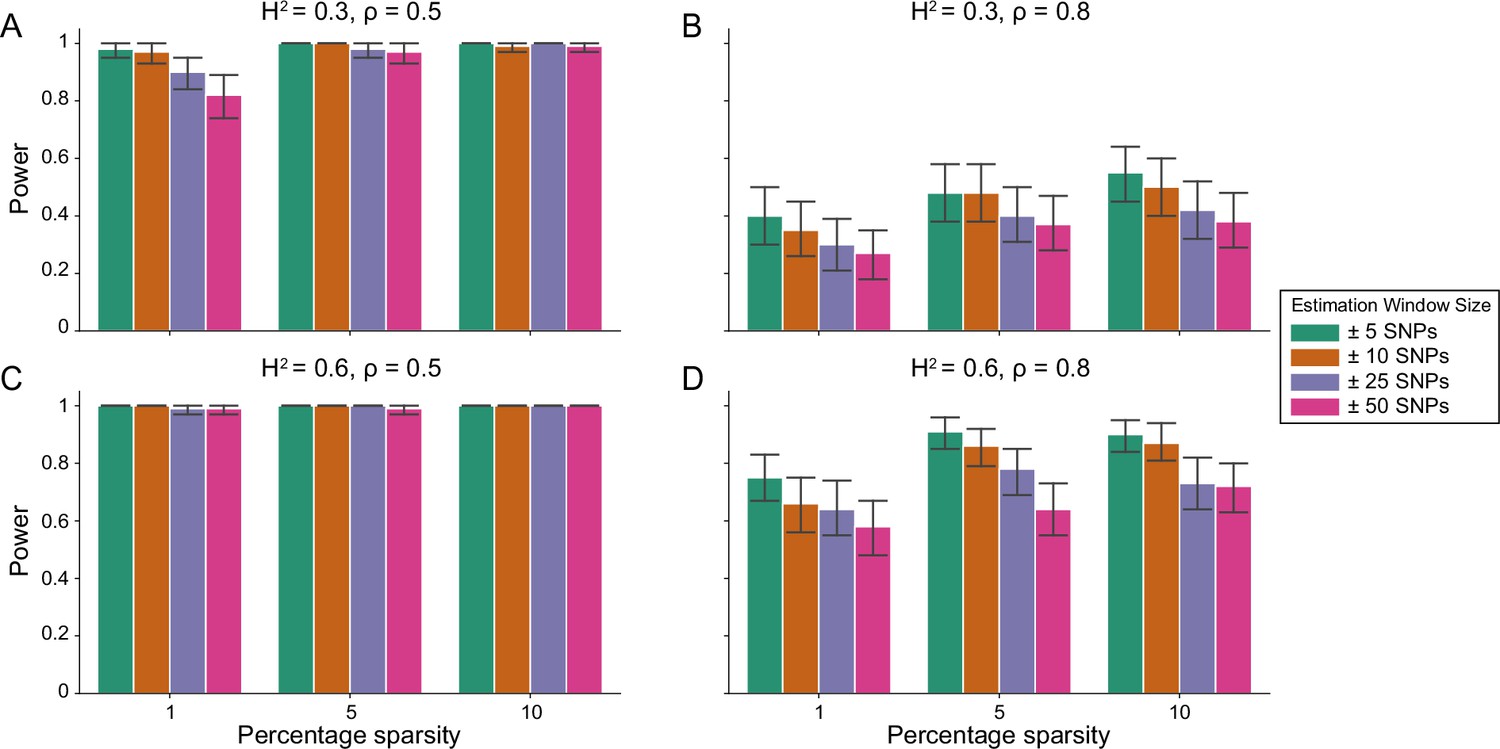
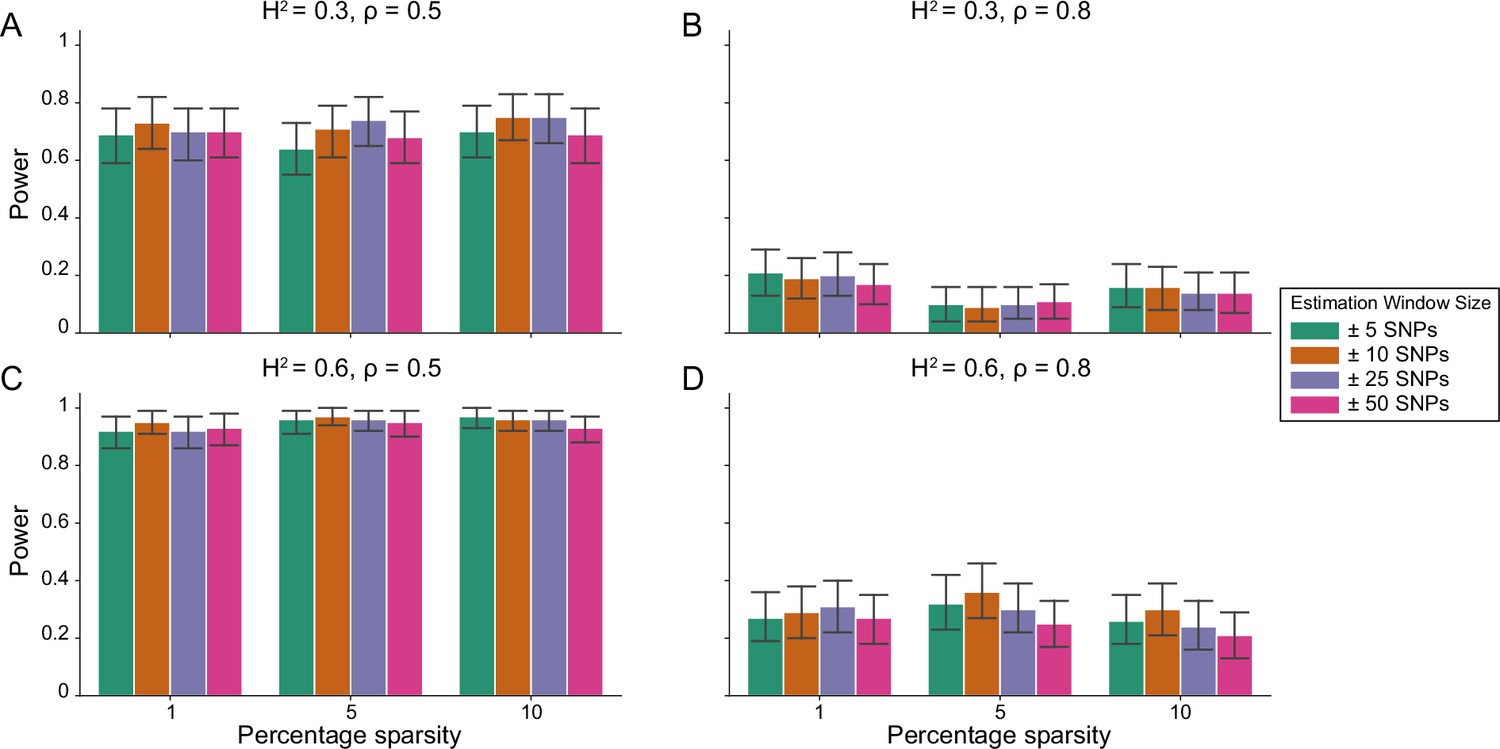
Power calculations for the i-LDSC framework to detect tagged pairwise genetic interaction effects on simulated data using a ± 10 kilobase (kb) window to generate cis-interactions around a focal SNP with a moderate minor allele frequency dependency for effect sizes.
Synthetic trait architecture was simulated using real genotype data from individuals of self-identified European ancestry in the UK Biobank. All SNPs were considered to have at least an additive effect (i.e. creating a polygenic trait architecture). Next, we randomly select two groups of interacting variants and divide them into two groups. The group #1 SNPs are chosen to be 1%, 5%, and 10% of the total number of SNPs genome-wide (see the x-axis in each panel). These interact with the group #2 SNPs which are selected to be variants within a ± 10 kilobase (kb) window around each SNP in group #1. Coefficients for additive and interaction effects were simulated with minor allele frequency dependency (see Materials and methods). Panels (A) and (B) are results of simulations where the total heritability explained by additive SNP effects and cis-interaction effects is , while panels (C) and (D) were generated with . We also varied the proportion of phenotypic variation explained by additive SNP effects to (A, C) and (B, D) , respectively. Here, we are blind to the parameter settings used in generative model and run i-LDSC while computing the cis-interaction LD scores using different estimation windows of ± 5 (green), ± 10 (orange), ± 25 (purple), and ± 50 (pink) SNPs. Results are based on 100 simulations per parameter combination and the horizontal black bars represent standard errors.
Figure 1—figure supplement 2
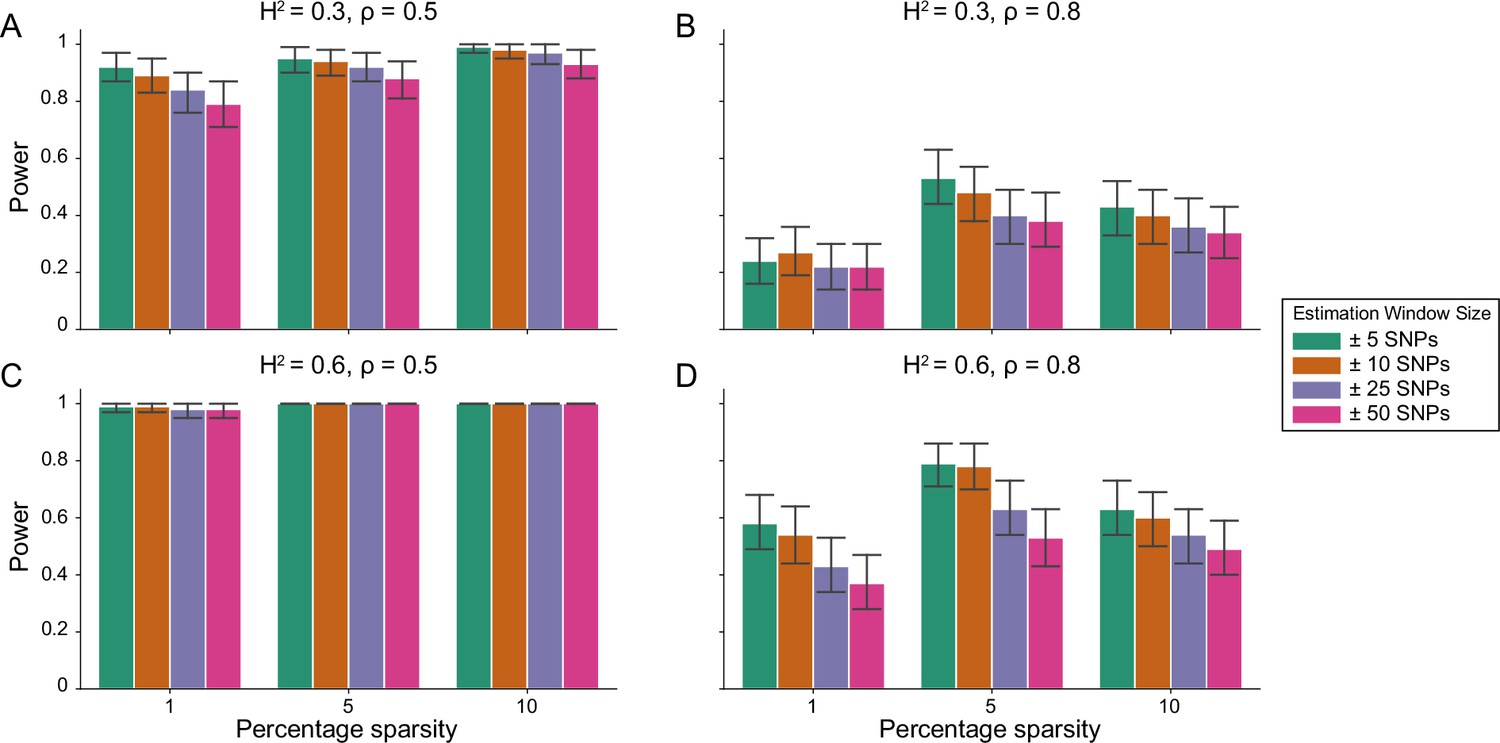
Power calculations for the i-LDSC framework to detect tagged pairwise genetic interaction effects on simulated data using a ± 10 kilobase (kb) window to generate cis-interactions around a focal SNP with a strong minor allele frequency dependency for effect sizes.
Synthetic trait architecture was simulated using real genotype data from individuals of self-identified European ancestry in the UK Biobank. All SNPs were considered to have at least an additive effect (i.e. creating a polygenic trait architecture). Next, we randomly select two groups of interacting variants and divide them into two groups. The group #1 SNPs are chosen to be 1%, 5%, and 10% of the total number of SNPs genome-wide (see the x-axis in each panel). These interact with the group #2 SNPs which are selected to be variants within a ± 10 kilobase (kb) window around each SNP in group #1. Coefficients for additive and interaction effects were simulated with minor allele frequency dependency (see Materials and methods). Panels (A) and (B) are results of simulations where the total heritability explained by additive SNP effects and cis-interaction effects is , while panels (C) and (D) were generated with . We also varied the proportion of phenotypic variation explained by additive SNP effects to (A, C) and (B, D) , respectively. Here, we are blind to the parameter settings used in generative model and run i-LDSC while computing the cis-interaction LD scores using different estimation windows of ± 5 (green), ± 10 (orange), ± 25 (purple), and ± 50 (pink) SNPs. Results are based on 100 simulations per parameter combination and the horizontal black bars represent standard errors.
Figure 1—figure supplement 3
Power calculations for the i-LDSC framework to detect tagged pairwise genetic interaction effects on simulated data using a ± 10 kilobase (kb) window to generate cis-interactions around a focal SNP with no minor allele frequency dependency for effect sizes.
Synthetic trait architecture was simulated using real genotype data from individuals of self-identified European ancestry in the UK Biobank. All SNPs were considered to have at least an additive effect (i.e. creating a polygenic trait architecture). Next, we randomly select two groups of interacting variants and divide them into two groups. The group #1 SNPs are chosen to be 1%, 5%, and 10% of the total number of SNPs genome-wide (see the x-axis in each panel). These interact with the group #2 SNPs which are selected to be variants within a ± 10 kilobase (kb) window around each SNP in group #1. Coefficients for additive and interaction effects were simulated with minor allele frequency dependency (see Materials and methods). Panels (A) and (B) are results of simulations where the total heritability explained by additive SNP effects and cis-interaction effects is , while panels (C) and (D) were generated with . We also varied the proportion of phenotypic variation explained by additive SNP effects to (A, C) and (B, D) , respectively. Here, we are blind to the parameter settings used in generative model and run i-LDSC while computing the cis-interaction LD scores using different estimation windows of ± 5 (green), ± 10 (orange), ± 25 (purple), and ± 50 (pink) SNPs. Results are based on 100 simulations per parameter combination and the horizontal black bars represent standard errors.
Figure 1—figure supplement 4
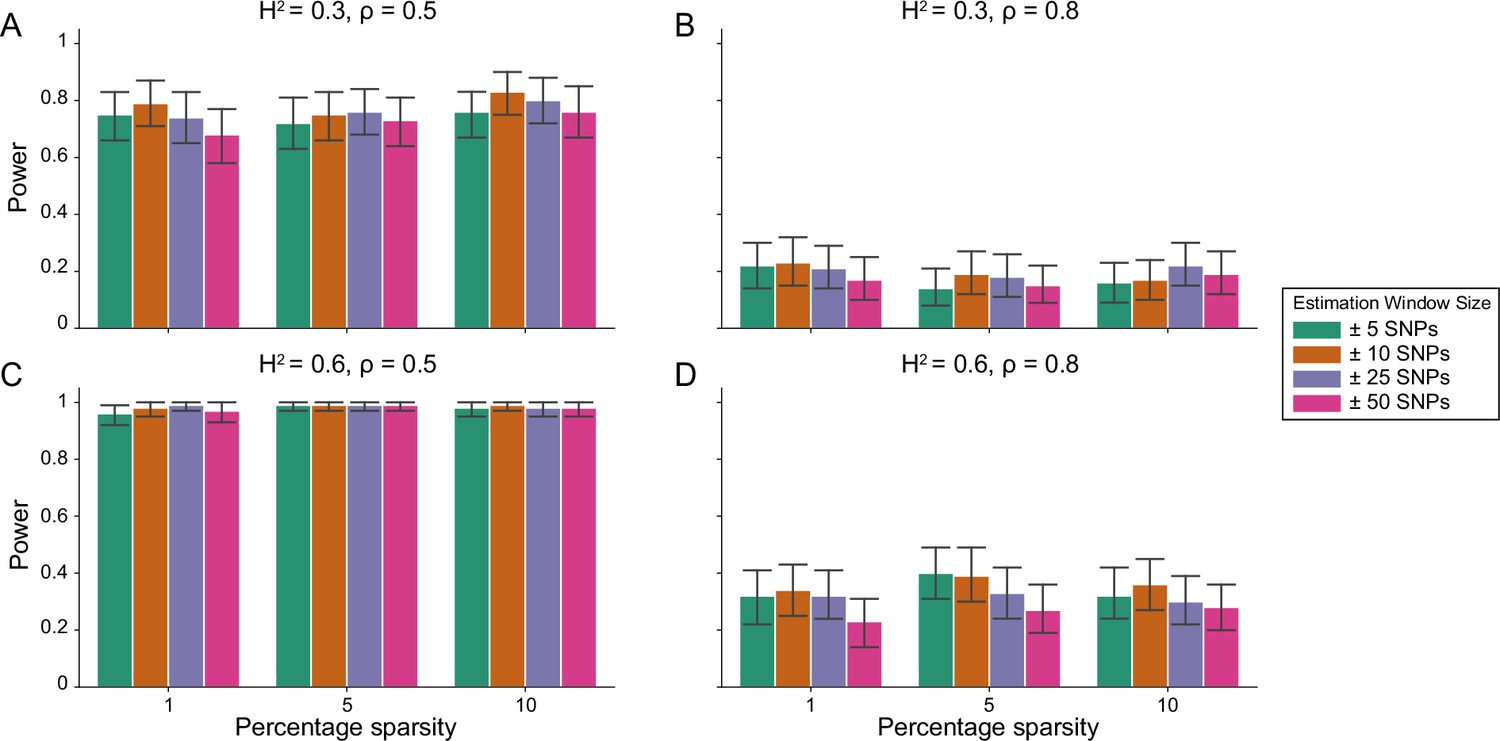
Power calculations for the i-LDSC framework to detect tagged pairwise genetic interaction effects on simulated data using a ± 100 kilobase (kb) window to generate cis-interactions around a focal SNP with a moderate minor allele frequency dependency for effect sizes.
Synthetic trait architecture was simulated using real genotype data from individuals of self-identified European ancestry in the UK Biobank. All SNPs were considered to have at least an additive effect (i.e. creating a polygenic trait architecture). Next, we randomly select two groups of interacting variants and divide them into two groups. The group #1 SNPs are chosen to be 1%, 5%, and 10% of the total number of SNPs genome-wide (see the x-axis in each panel). These interact with the group #2 SNPs which are selected to be variants within a ± 10 kilobase (kb) window around each SNP in group #1. Coefficients for additive and interaction effects were simulated with minor allele frequency dependency (see Materials and methods). Panels (A) and (B) are results of simulations where the total heritability explained by additive SNP effects and cis-interaction effects is , while panels (C) and (D) were generated with . We also varied the proportion of phenotypic variation explained by additive SNP effects to (A, C) and (B, D) , respectively. Here, we are blind to the parameter settings used in generative model and run i-LDSC while computing the cis-interaction LD scores using different estimation windows of ± 5 (green), ± 10 (orange), ± 25 (purple), and ± 50 (pink) SNPs. Results are based on 100 simulations per parameter combination and the horizontal black bars represent standard errors.
Figure 1—figure supplement 5
Power calculations for the i-LDSC framework to detect tagged pairwise genetic interaction effects on simulated data using a ± 100 kilobase (kb) window to generate cis-interactions around a focal SNP with a strong minor allele frequency dependency for effect sizes.
Synthetic trait architecture was simulated using real genotype data from individuals of self-identified European ancestry in the UK Biobank. All SNPs were considered to have at least an additive effect (i.e. creating a polygenic trait architecture). Next, we randomly select two groups of interacting variants and divide them into two groups. The group #1 SNPs are chosen to be 1%, 5%, and 10% of the total number of SNPs genome-wide (see the x-axis in each panel). These interact with the group #2 SNPs which are selected to be variants within a ± 10 kilobase (kb) window around each SNP in group #1. Coefficients for additive and interaction effects were simulated with minor allele frequency dependency (see Materials and methods). Panels (A) and (B) are results of simulations where the total heritability explained by additive SNP effects and cis-interaction effects is , while panels (C) and (D) were generated with . We also varied the proportion of phenotypic variation explained by additive SNP effects to (A, C) and (B, D) , respectively. Here, we are blind to the parameter settings used in generative model and run i-LDSC while computing the cis-interaction LD scores using different estimation windows of ± 5 (green), ± 10 (orange), ± 25 (purple), and ± 50 (pink) SNPs. Results are based on 100 simulations per parameter combination and the horizontal black bars represent standard errors.
Figure 2 with 2 supplements
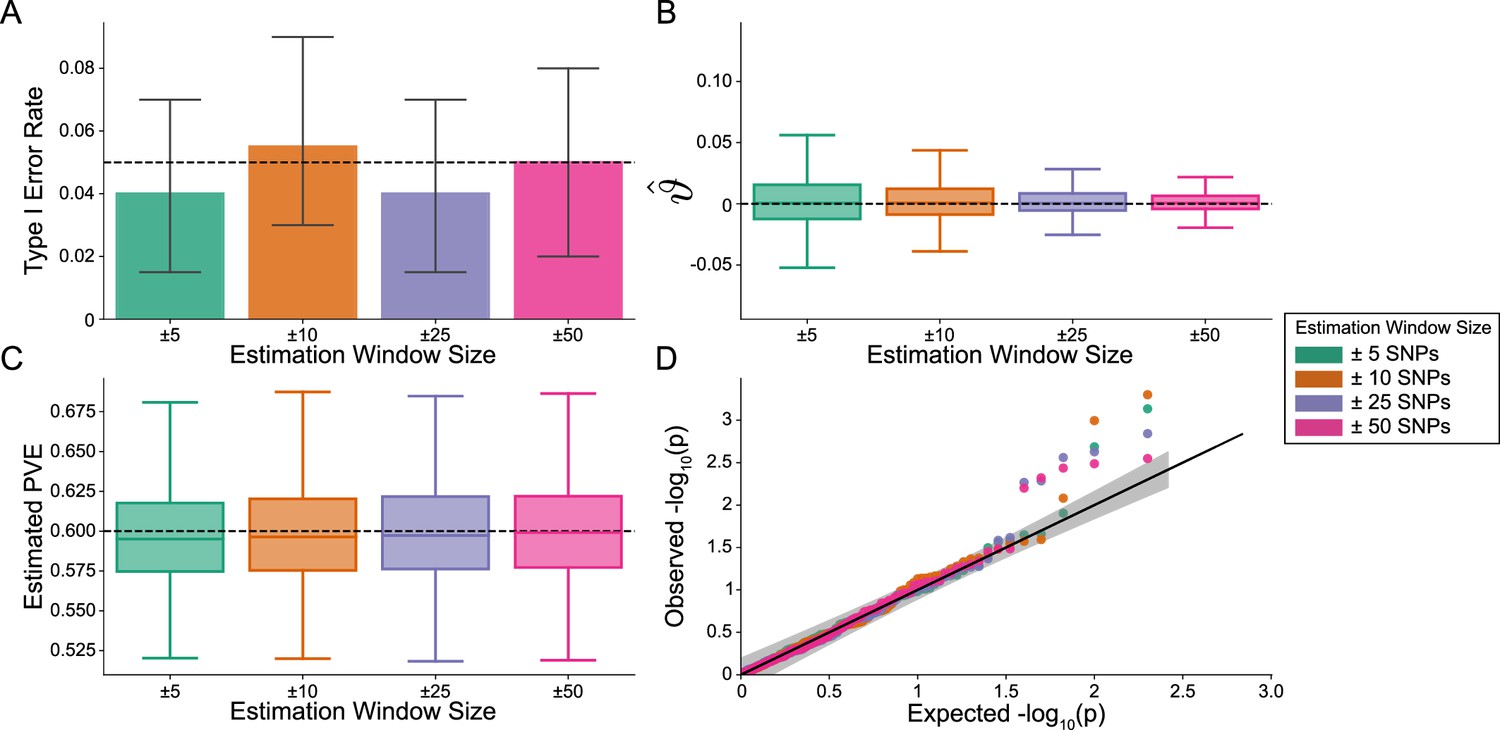
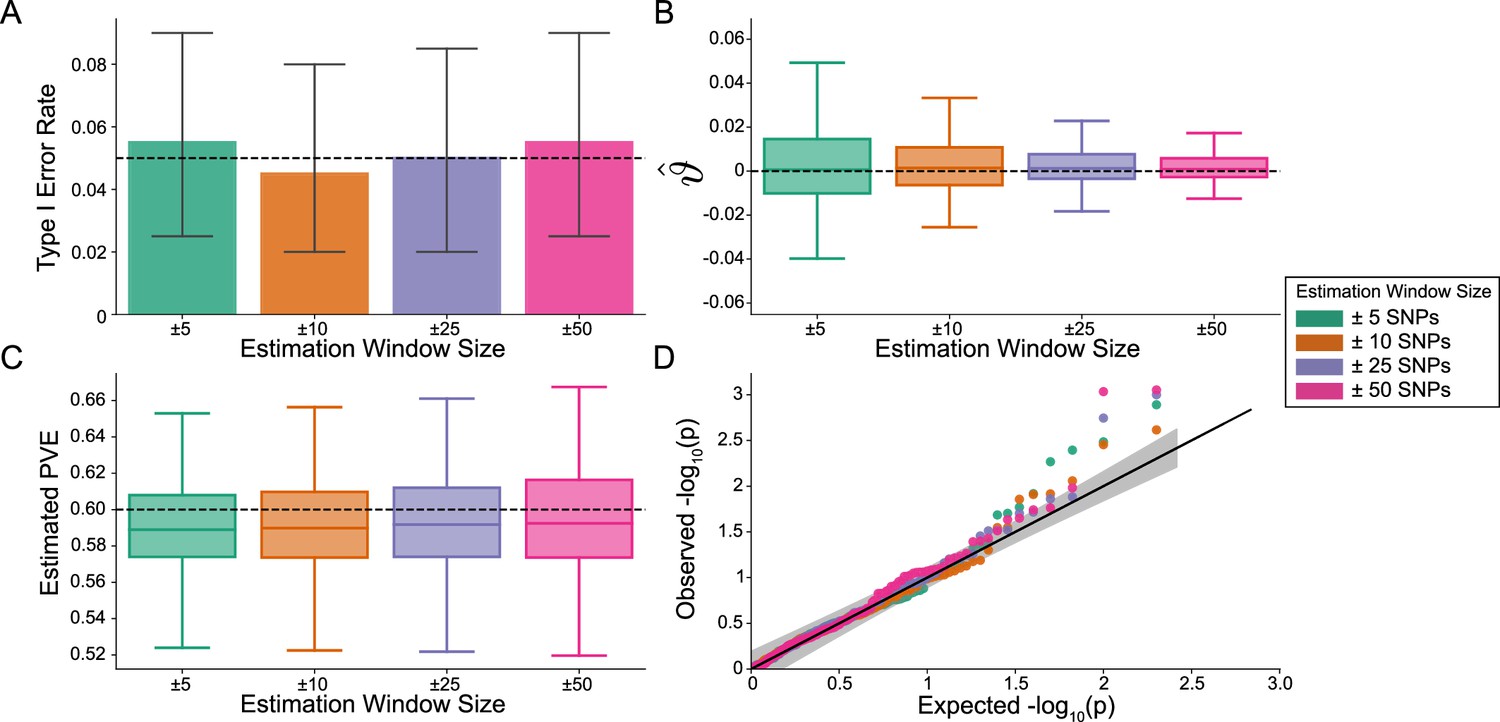
The i-LDSC framework is well-calibrated under the null hypothesis and does not identify evidence of tagged non-additive effects when polygenic traits are generated by only additive effects.
In these simulations, synthetic trait architecture is made up of only additive genetic variation (i.e. ). Coefficients for additive and interaction effects were simulated with no minor allele frequency dependency (see Materials and methods). Here, we are blind to the parameter settings used in generative model and run i-LDSC while computing the cis-interaction LD scores using different estimating windows of ± 5 (green), ± 10 (orange), ± 25 (purple), and ± 50 (pink) SNPs. (A) Mean type I error rate using the i-LDSC framework across an array of estimation window sizes for the cis-interaction LD scores. This is determined by assessing the p-value of the cis-interaction coefficient () in the i-LDSC regression model and checking whether p < 0.05. (B) Estimates of the cis-interaction coefficient (). Since traits were simulated with only additive effects, these estimates should be centered around zero. (C) Estimates of the proportions of phenotypic variance explained (PVE) by genetic effects (i.e. estimated heritability) where the true additive variance is set to . (D) QQ-plot of the p-values for the cis-interaction coefficient () in i-LDSC. Results are based on 100 simulations per parameter combination and the horizontal bars represent standard errors.
Figure 2—figure supplement 1
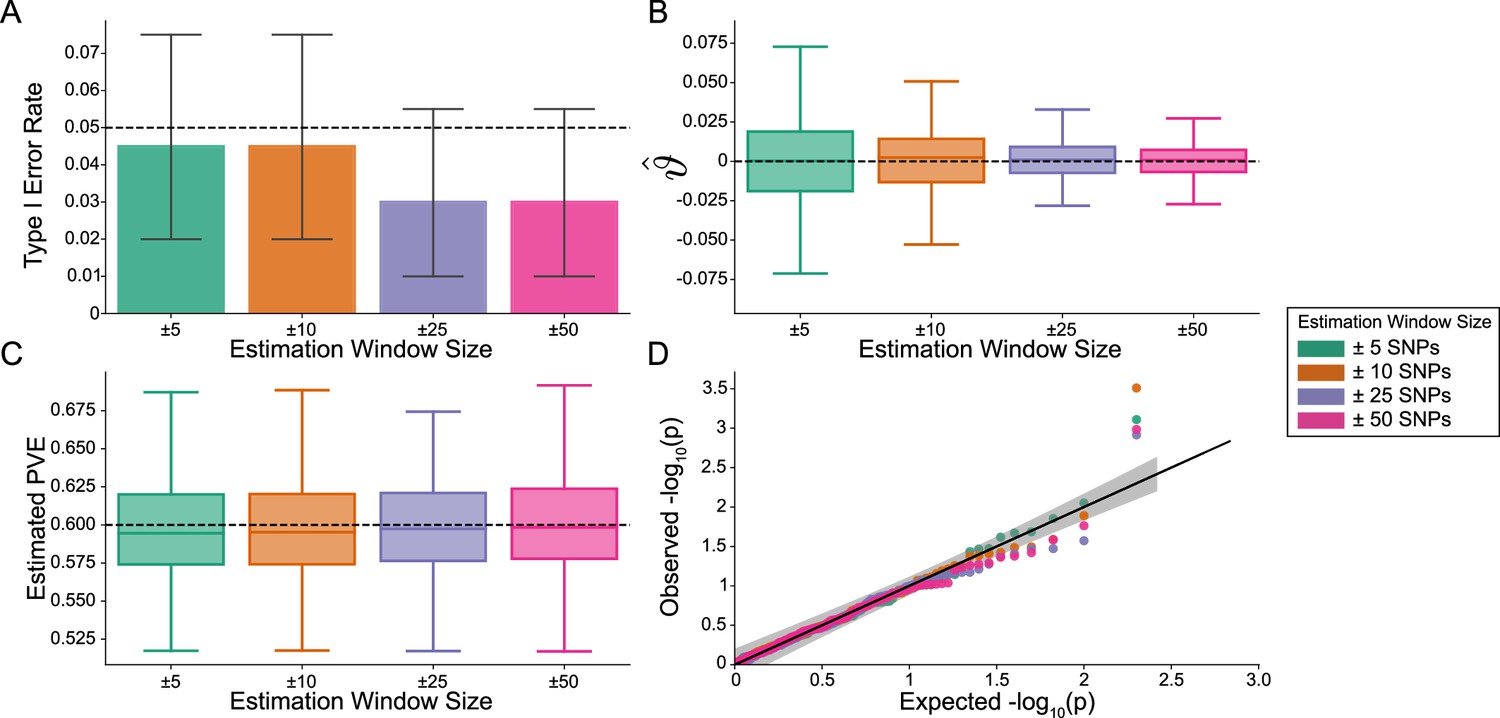
The i-LDSC framework is well-calibrated under the null hypothesis and does not identify evidence of tagged non-additive effects when polygenic traits are generated by only additive effects and a moderate minor allele frequency dependency for effect sizes.
In these simulations, synthetic trait architecture is made up of only additive genetic variation (i.e. ). Coefficients for additive and interaction effects were simulated with minor allele frequency dependency (see Materials and methods). Here, we are blind to the parameter settings used in generative model and run i-LDSC while computing the cis-interaction LD scores using different estimation windows of ± 5 (green), ± 10 (orange), ± 25 (purple), and ± 50 (pink) SNPs. (A) Mean type I error rate using the i-LDSC framework across an array of estimation window sizes for the cis-interaction LD scores. This is determined by assessing the p-value of the cis-interaction coefficient () in the i-LDSC regression model and checking whether p < 0.05. (B) Estimates of the cis-interaction coefficient (). Since traits were simulated with only additive effects, these estimates should be centered around zero. (C) Estimates of the proportions of phenotypic variance explained (PVE) by genetic effects (i.e. estimated heritability) where the true additive variance is set to . (D) QQ-plot of the p-values for the cis-interaction coefficient () in i-LDSC. Results are based on 100 simulations per parameter combination and the horizontal black bars represent standard errors.
Figure 2—figure supplement 2
The i-LDSC framework is well-calibrated under the null hypothesis and does not identify evidence of tagged non-additive effects when polygenic traits are generated by only additive effects and a strong minor allele frequency dependency for effect sizes.
In these simulations, synthetic trait architecture is made up of only additive genetic variation (i.e. ). Coefficients for additive and interaction effects were simulated with minor allele frequency dependency (see Materials and methods). Here, we are blind to the parameter settings used in generative model and run i-LDSC while computing the cis-interaction LD scores using different estimation windows of ± 5 (green), ± 10 (orange), ± 25 (purple), and ± 50 (pink) SNPs. (A) Mean type I error rate using the i-LDSC framework across an array of estimation window sizes for the cis-interaction LD scores. This is determined by assessing the p-value of the cis-interaction coefficient () in the i-LDSC regression model and checking whether p < 0.05. (B) Estimates of the cis-interaction coefficient (). Since traits were simulated with only additive effects, these estimates should be centered around zero. (C) Estimates of the proportions of phenotypic variance explained (PVE) by genetic effects (i.e. estimated heritability) where the true additive variance is set to . (D) QQ-plot of the p-values for the cis-interaction coefficient () in i-LDSC. Results are based on 100 simulations per parameter combination and the horizontal black bars represent standard errors.
Figure 3 with 13 supplements

i-LDSC robustly and accurately estimates the proportions of phenotypic variance explained (PVE) by genetic effects (i.e. estimated heritability) in simulations in polygenic traits, compared to LDSC, due to our accounting for interaction effects tagged in additive GWAS summary statistics.
Synthetic trait architecture was simulated using real genotype data from individuals of self-identified European ancestry in the UK Biobank (Materials and Methods). All SNPs were considered to have at least an additive effect (i.e. creating a polygenic trait architecture). Next, we randomly select two groups of interacting variants and divide them into two groups. The group #1 SNPs are chosen to be 10% of the total number of SNPs genome-wide. These interact with the group #2 SNPs which are selected to be variants within a ± 100 kilobase (kb) window around each SNP in group #1. Coefficients for additive and interaction effects were simulated with no minor allele frequency dependency (see Materials and methods). Here, we assume a heritability (A) or (B) (marked by the black dotted lines, respectively), and we vary the proportion contributed by additive effects with . The grey dotted lines represent the total contribution of additive effects in the generative model for the synthetic traits (. i-LDSC outperforms LDSC in recovering heritability across each scenario. Results are based on 100 simulations per parameter combination.
Figure 3—figure supplement 1

i-LDSC robustly and accurately estimates the proportions of phenotypic variance explained (PVE) by genetic effects in polygenic traits by accounting for interaction effects tagged by GWAS summary statistics.
Synthetic trait architecture was simulated using real genotype data from individuals of self-identified European ancestry in the UK Biobank. All SNPs were considered to have at least an additive effect (i.e. creating a polygenic trait architecture). Next, we randomly select two groups of interacting variants and divide them into two groups. The group #1 SNPs are chosen to be 10% of the total number of SNPs genome-wide. These interact with the group #2 SNPs which are selected to be variants within a ± 100 kilobase (kb) window around each SNP in group #1. Coefficients for additive and cis-interaction effects were simulated with no minor allele frequency dependency (see Materials and methods). Here, we assume a total heritability explained by additive SNP and cis-interaction effects is (A) or (B) (marked by the black dotted lines, respectively), and we vary the proportion contributed by additive effects with . The grey dotted line represents the total contribution of additive effects in the generative model for the synthetic traits (. We run i-LDSC while computing the cis-interaction LD scores using different estimating windows of ± 5, ± 10, ± 25, and ± 50 SNPs, respectively. These results help motivate the selection of scores calculated using a ± 50 SNP window in our empirical analyses. Results are based on 100 simulations per parameter combination.
Figure 3—figure supplement 2
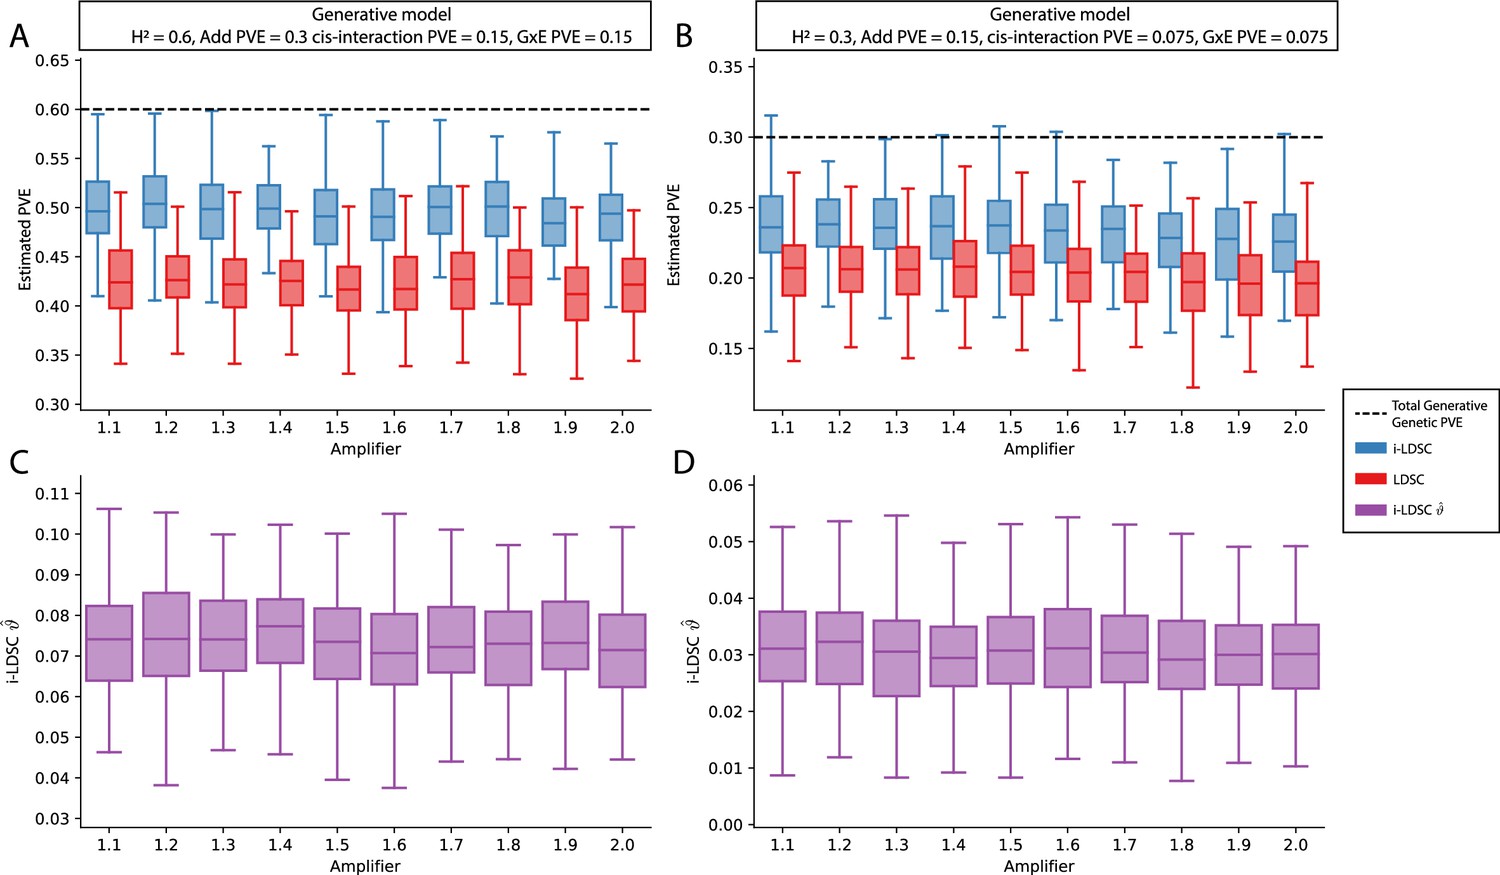
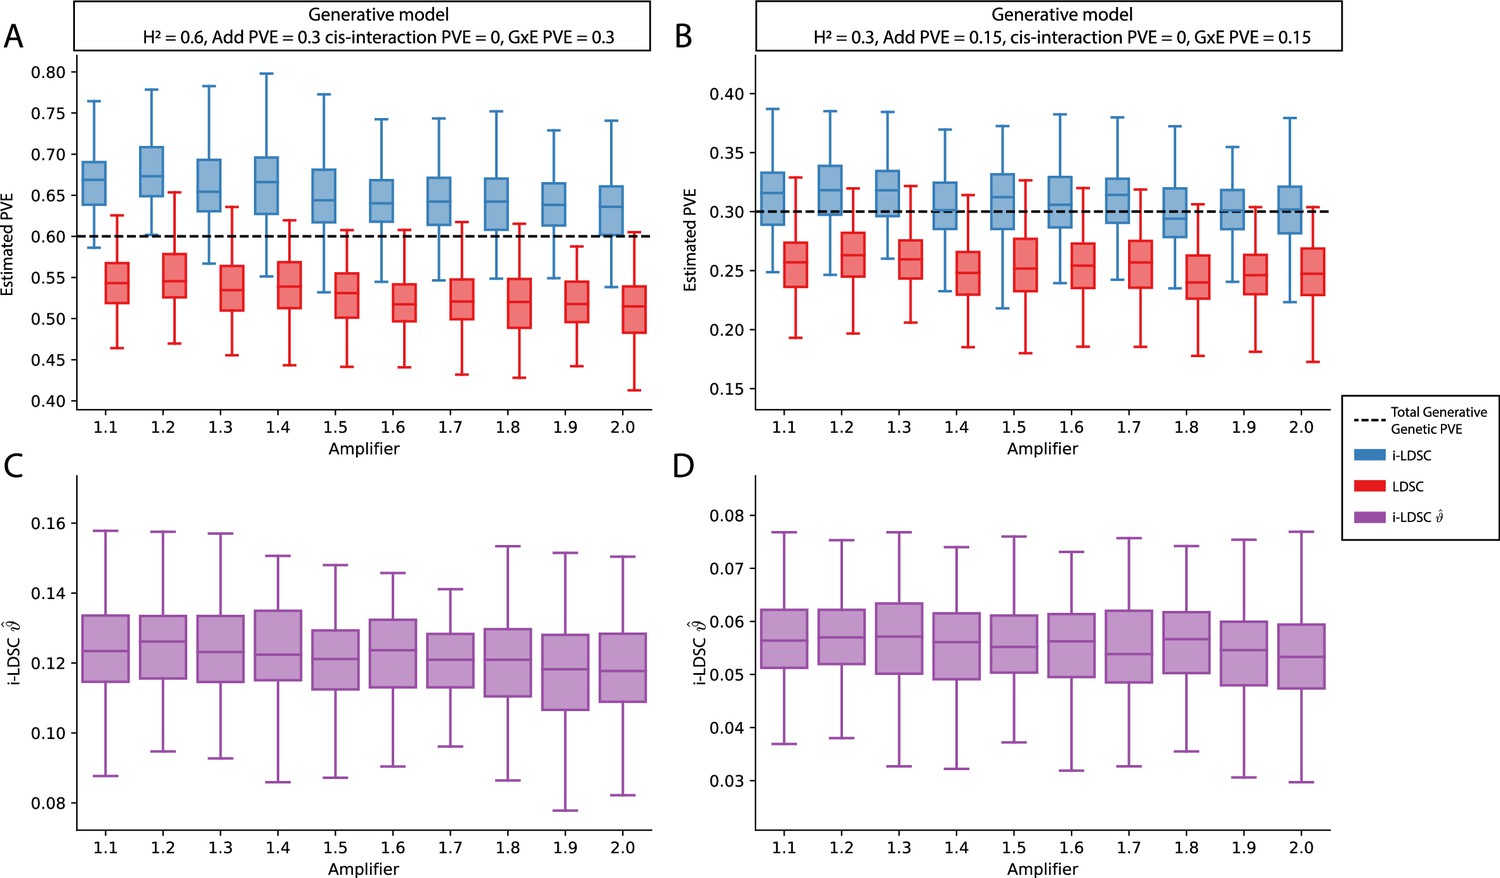
Performance of LDSC and i-LDSC on simulated polygenic traits with architectures that are determined by additive, cis-interaction, and gene-by-environment (G×E) effects.
Synthetic trait architecture was simulated using real genotype data from individuals of self-identified European ancestry in the UK Biobank. All SNPs were considered to have at least an additive effect (i.e. creating a polygenic trait architecture). Next, we randomly select two groups of interacting variants and divide them into two groups. The group #1 SNPs are chosen to be 10% of the total number of SNPs genome-wide. These interact with the group #2 SNPs which are selected to be variants within a ± 100 kilobase (kb) window around each SNP in group #1. G×E effects were simulated using an amplification model (Zhu et al., 2023 ; see Materials and methods) where we split the sample population in half to emulate two subsets of individuals coming from different environments. We randomly draw variant effect sizes for the first environment from a standard Gaussian distribution. Then effect sizes for the second environment are set to be the product of the effect sizes in from with first environment with an amplifier (see the x-axis in each panel). Both the cis-interaction and G×E effects were set to explain a quarter of the total phenotypic variation and the remaining half was explained by additive SNP effects. Panels (A) and (B) show estimates of the proportions of phenotypic variance explained (PVE) by genetic effects (i.e. estimated heritability) from LDSC and i-LDSC, respectively. Panels (C) and (D) show i-LDSC estimates of the phenotypic variation explained by tagged non-additive genetic effects using the cis-interaction LD score (i.e. estimates of ). We assume the total heritability explained by all genetic effects to be (A, C) and (B, D) . Results are based on 100 simulations per parameter combination.
Figure 3—figure supplement 3
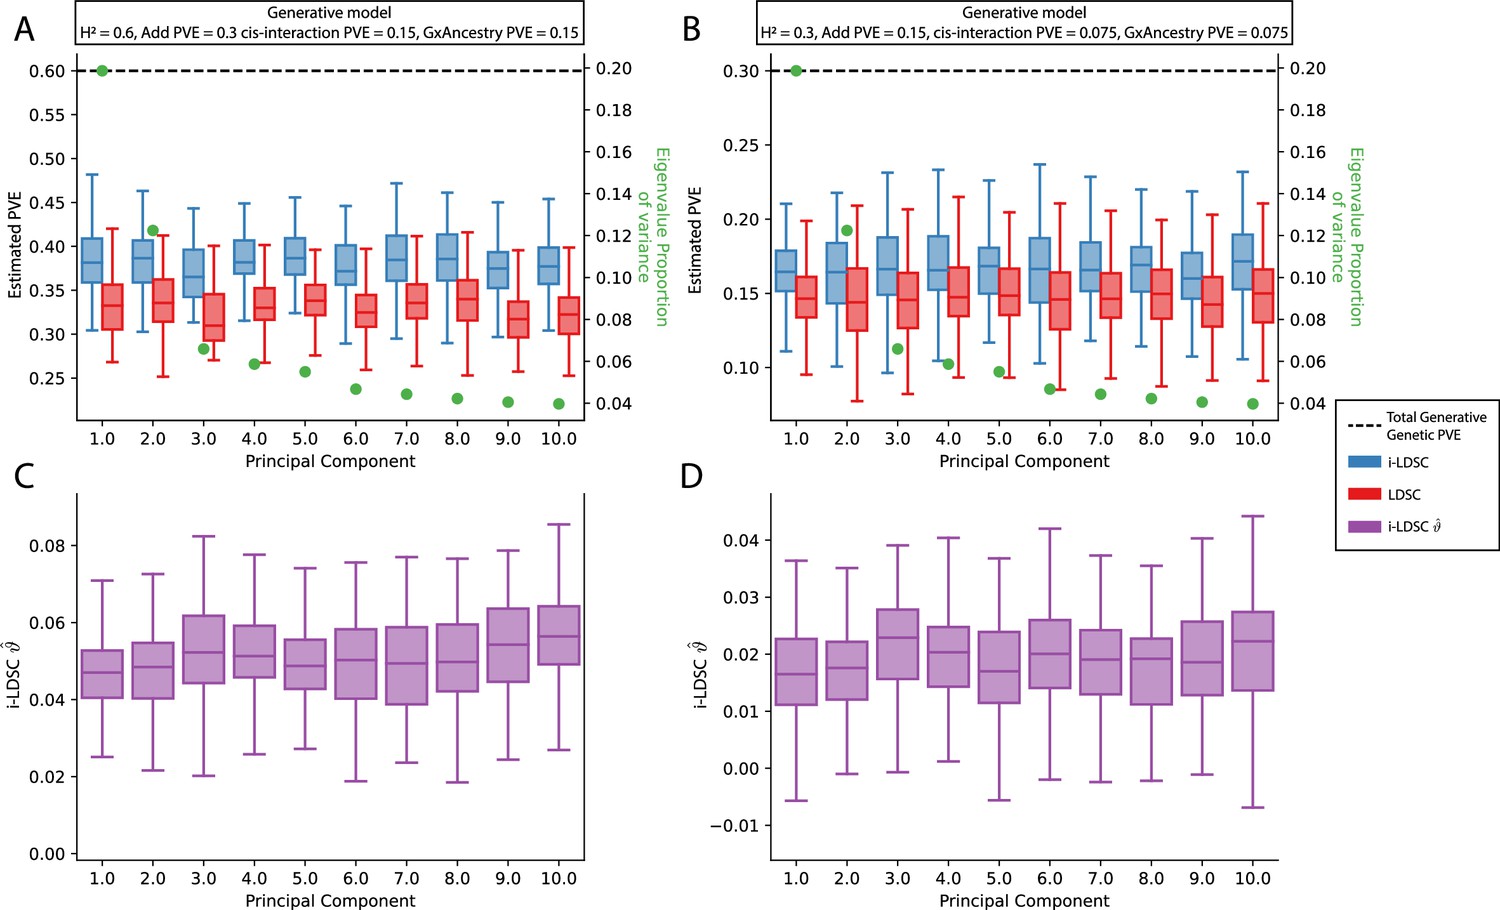
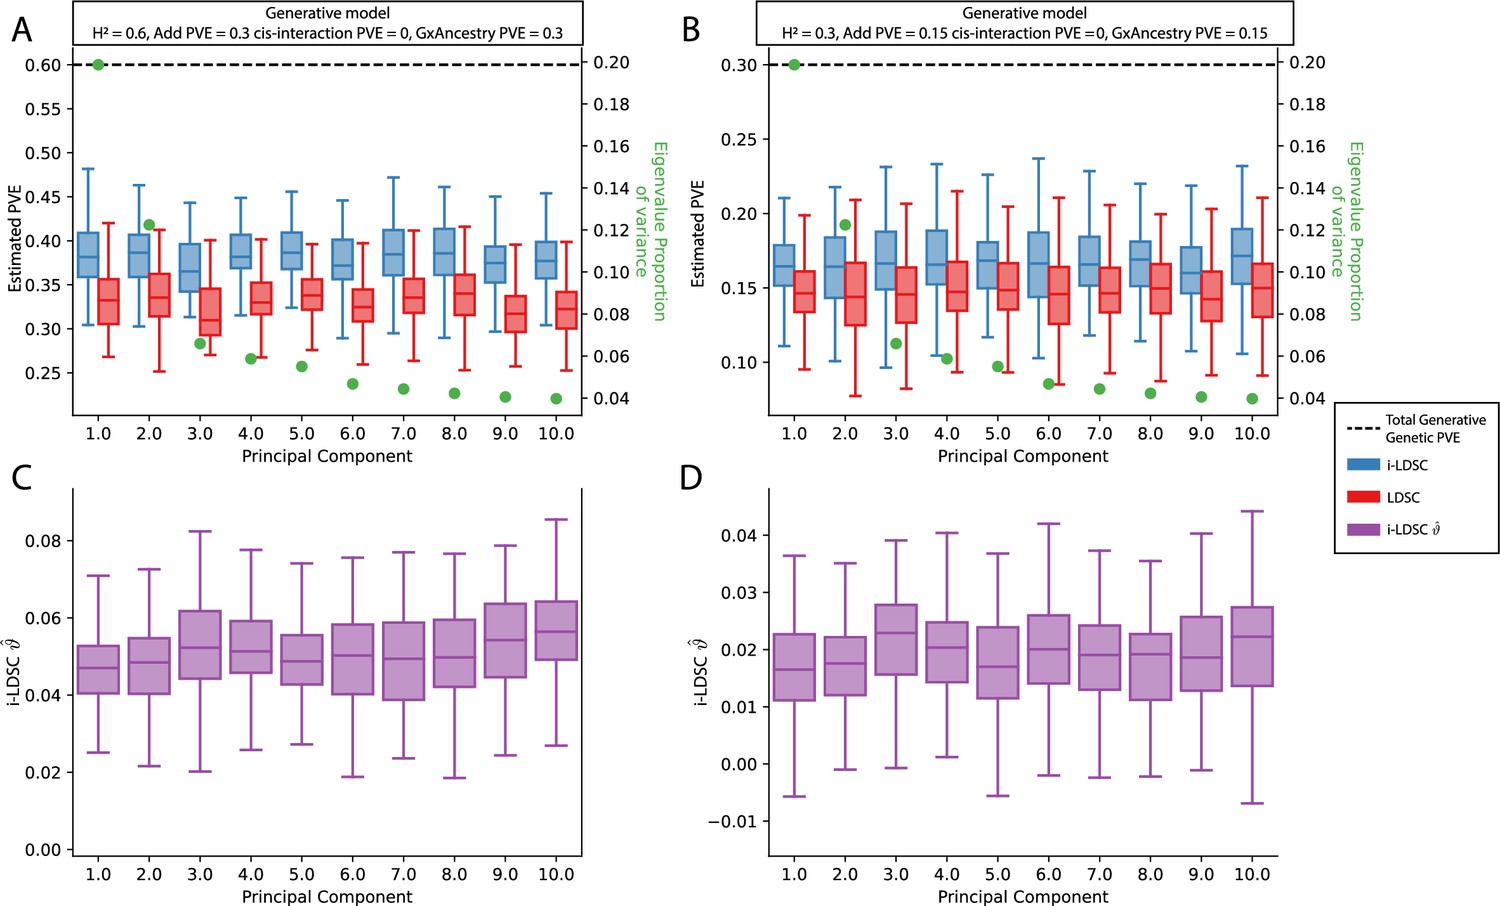
Performance of LDSC and i-LDSC on simulated polygenic traits with architectures that are determined by additive, cis-interaction, and gene-by-ancestry (G×Ancestry) effects with principal components (PCs) included in the GWAS model to correct for additional structure.
Synthetic trait architecture was simulated using real genotype data from individuals of self-identified European ancestry in the UK Biobank. All SNPs were considered to have at least an additive effect (i.e. creating a polygenic trait architecture). Next, we randomly select two groups of interacting variants and divide them into two groups. The group #1 SNPs are chosen to be 10% of the total number of SNPs genome-wide. These interact with the group #2 SNPs which are selected to be variants within a ± 100 kilobase (kb) window around each SNP in group #1. G×Ancestry effects were simulated as the product of individual genotypes and the SNP loadings for each of the first 10 PCs (see the x-axis in each panel). Both the cis-interaction and G×Ancestry effects were set to explain a quarter of the total phenotypic variation and the remaining half was explained by additive SNP effects. The proportion of genotypic variance explained by each PC is shown in green. Panels (A) and (B) show estimates of the proportions of phenotypic variance explained (PVE) by genetic effects (i.e. estimated heritability) from LDSC and i-LDSC, respectively. Panels (C) and (D) show i-LDSC estimates of the phenotypic variation explained by tagged non-additive genetic effects using the cis-interaction LD score (i.e. estimates of ). We assume the total heritability explained by all genetic effects to be (A, C) and (B, D) . Results are based on 100 simulations per parameter combination.
Figure 3—figure supplement 4
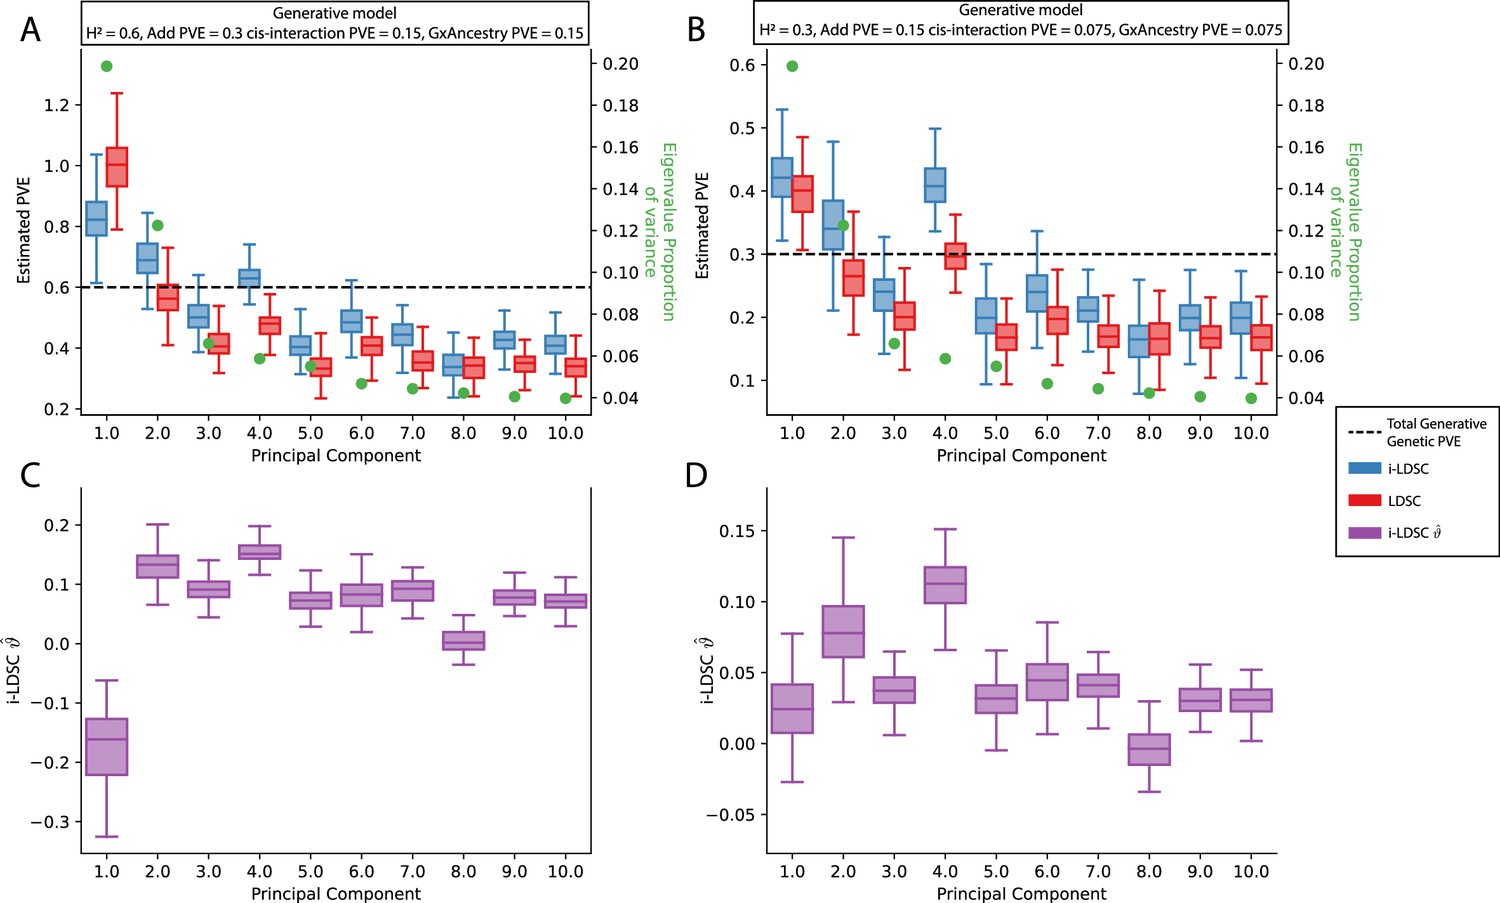
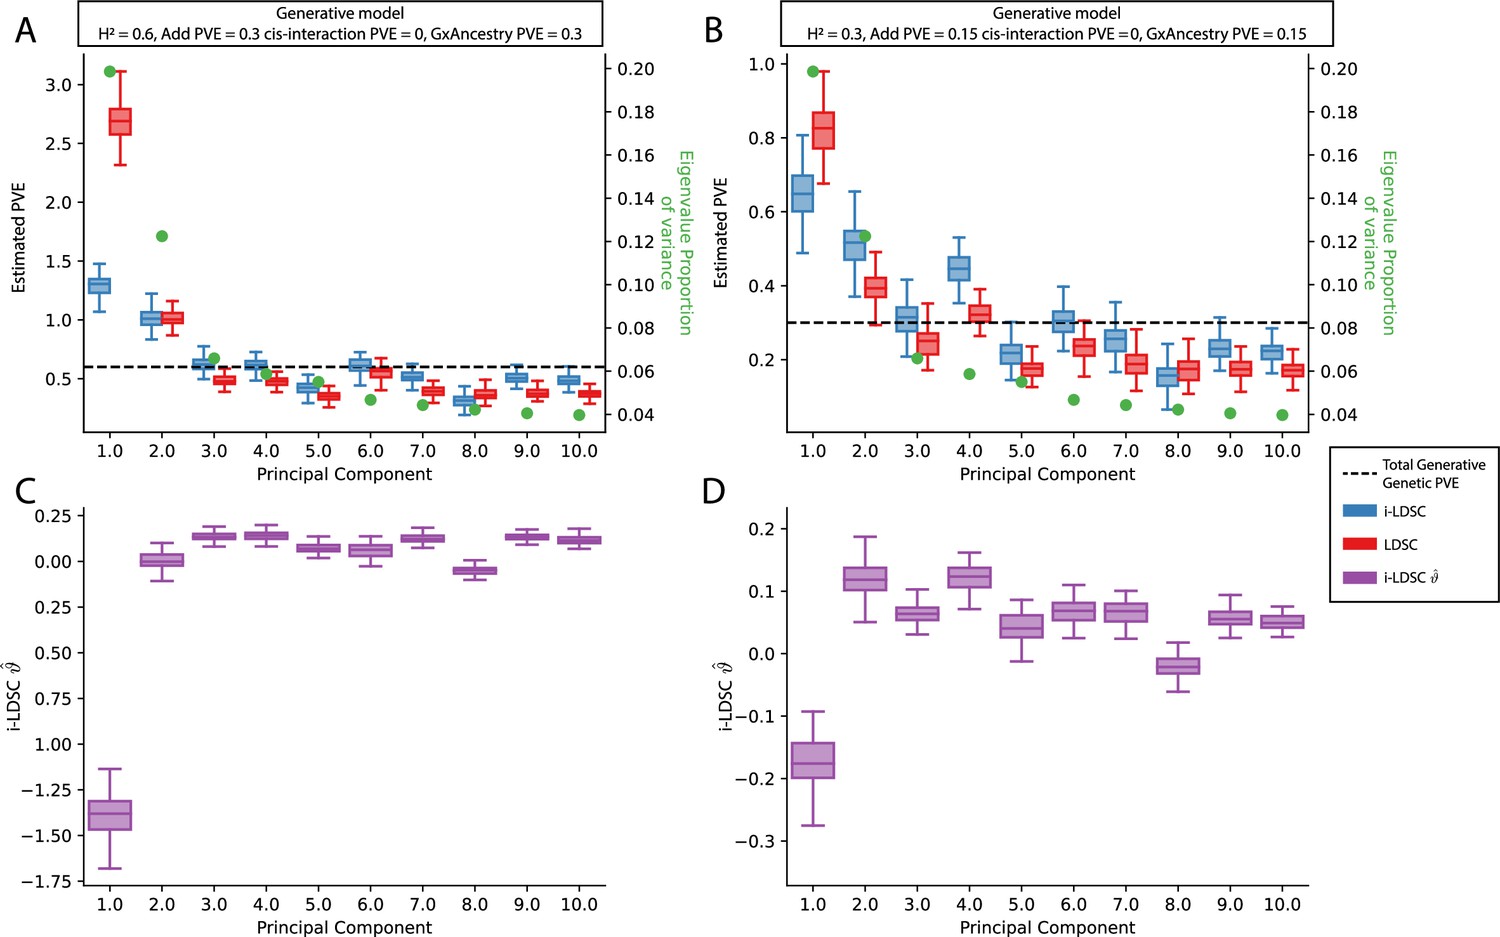
Performance of LDSC and i-LDSC on simulated polygenic traits with architectures that are determined by additive, cis-interaction, and gene-by-ancestry (G×Ancestry) effects without correcting for the additional structure in the GWAS analysis.
Synthetic trait architecture was simulated using real genotype data from individuals of self-identified European ancestry in the UK Biobank. All SNPs were considered to have at least an additive effect (i.e. creating a polygenic trait architecture). Next, we randomly select two groups of interacting variants and divide them into two groups. The group #1 SNPs are chosen to be 10% of the total number of SNPs genome-wide. These interact with the group #2 SNPs which are selected to be variants within a ± 100 kilobase (kb) window around each SNP in group #1. G×Ancestry effects were simulated as the product of individual genotypes and the SNP loadings for each of the first 10 PCs (see the x-axis in each panel). Both the cis-interaction and G×Ancestry effects were set to explain a quarter of the total phenotypic variation and the remaining half was explained by additive SNP effects. The proportion of genotypic variance explained by each PC is shown in green. Panels (A) and (B) show estimates of the proportions of phenotypic variance explained (PVE) by genetic effects (i.e. estimated heritability) from LDSC and i-LDSC, respectively. Panels (C) and (D) show i-LDSC estimates of the phenotypic variation explained by tagged non-additive genetic effects using the cis-interaction LD score (i.e. estimates of ). We assume the total heritability explained by all genetic effects to be (A, C) and (B, D) . Results are based on 100 simulations per parameter combination.
Figure 3—figure supplement 5
Performance of LDSC and i-LDSC on simulated polygenic traits with architectures that are determined by only additive and gene-by-environment (G×E) effects.
Synthetic trait architecture was simulated using real genotype data from individuals of self-identified European ancestry in the UK Biobank. All SNPs were considered to have at least an additive effect (i.e. creating a polygenic trait architecture). G×E effects were simulated using an amplification model65 (see Materials and methods) where we split the sample population in half to emulate two subsets of individuals coming from different environments. We randomly draw variant effect sizes for the first environment from a standard Gaussian distribution. Then effect sizes for the second environment are set to be the product of the effect sizes in from with first environment with an amplifier (see the x-axis in each panel). Additive and G×E effects were set to explain half of the phenotypic variation. Note that unlike results depicted in Figure 3—figure supplement 2, there are no cis-interaction effects that affect trait architecture. Here, panels (A) and (B) show estimates of the proportions of phenotypic variance explained (PVE) by genetic effects (i.e. estimated heritability) from LDSC and i-LDSC, respectively. Panels (C) and (D) show i-LDSC estimates of the phenotypic variation explained by tagged non-additive genetic effects using the cis-interaction LD score (i.e. estimates of ). We assume the total heritability explained by all genetic effects to be (A, C) and (B, D) . Results are based on 100 simulations per parameter combination.
Figure 3—figure supplement 6
Performance of LDSC and i-LDSC on simulated polygenic traits with architectures that are determined by only additive and gene-by-ancestry (G×Ancestry) effects with principal components (PCs) included in the GWAS model to correct for additional structure.
Synthetic trait architecture was simulated using real genotype data from individuals of self-identified European ancestry in the UK Biobank. All SNPs were considered to have at least an additive effect (i.e. creating a polygenic trait architecture). G×Ancestry effects were simulated as the product of individual genotypes and the SNP loadings for each of the first 10 PCs (see the x-axis in each panel). Additive and G×E effects were set to explain half of the phenotypic variation. The proportion of genotypic variance explained by each PC is shown in green. Note that unlike results depicted in Figure 3—figure supplement 3, there are no cis-interaction effects that affect trait architecture. Here, panels (A) and (B) show estimates of the proportions of phenotypic variance explained (PVE) by genetic effects (i.e. estimated heritability) from LDSC and i-LDSC, respectively. Panels (C) and (D) show i-LDSC estimates of the phenotypic variation explained by tagged non-additive genetic effects using the cis-interaction LD score (i.e. estimates of ). We assume the total heritability explained by all genetic effects to be (A, C) and (B, D) . Results are based on 100 simulations per parameter combination.
Figure 3—figure supplement 7
Performance of LDSC and i-LDSC on simulated polygenic traits with architectures that are determined by only additive and gene-by-ancestry (G×Ancestry) effects without correcting for the additional structure in the GWAS analysis.
Synthetic trait architecture was simulated using real genotype data from individuals of self-identified European ancestry in the UK Biobank. All SNPs were considered to have at least an additive effect (i.e. creating a polygenic trait architecture). G×Ancestry effects were simulated as the product of individual genotypes and the SNP loadings for each of the first 10 PCs (see the x-axis in each panel). Additive and G×E effects were set to explain half of the phenotypic variation. The proportion of genotypic variance explained by each PC is shown in green. Note that unlike results depicted in Figure 3—figure supplement 4, there are no cis-interaction effects that affect trait architecture. Here, panels (A) and (B) show estimates of the proportions of phenotypic variance explained (PVE) by genetic effects (i.e. estimated heritability) from LDSC and i-LDSC, respectively. Panels (C) and (D) show i-LDSC estimates of the phenotypic variation explained by tagged non-additive genetic effects using the cis-interaction LD score (i.e., estimates of ). We assume the total heritability explained by all genetic effects to be (A, C) and (B, D) . Results are based on 100 simulations per parameter combination.
Figure 3—figure supplement 8
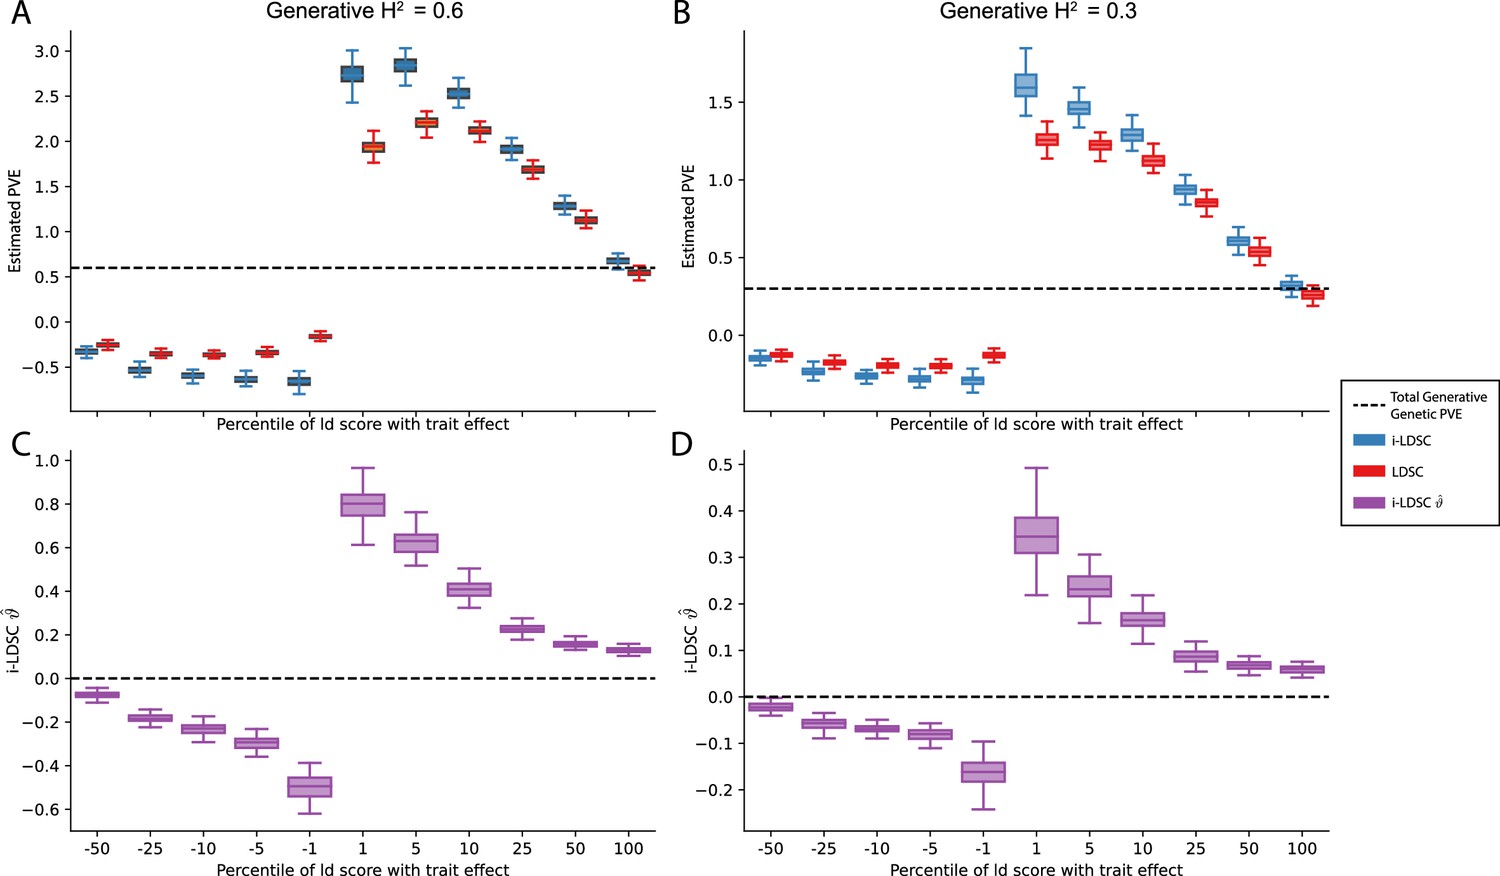
Performance of LDSC and i-LDSC on simulated traits with sparse architectures that are determined by only additive effects.
Synthetic trait architecture was simulated using real genotype data from individuals of self-identified European ancestry in the UK Biobank. Here, traits were generated with solely additive effects where only variants with the top or bottom percentile of LD scores were given nonzero coefficients in the generative model (see the x-axis in each panel). Panels (A) and (B) show estimates of the proportions of phenotypic variance explained (PVE) by genetic effects (i.e. estimated heritability) from LDSC and i-LDSC, respectively. Panels (C) and (D) show i-LDSC estimates of the phenotypic variation explained by tagged non-additive genetic effects using the cis-interaction LD score (i.e. estimates of ). We assume the total heritability explained by all genetic effects to be (A, C) and (B, D) . Results are based on 100 simulations per parameter combination. The overall takeaway is that breaking the assumed relationship between LD scores and chi-squared test statistics (i.e. that they are generally positively correlated) led to unbounded estimates of heritability for both LDSC and i-LDSC in all but the (polygenic) scenario when 100% of SNPs contributed to phenotypic variation.
Figure 3—figure supplement 9
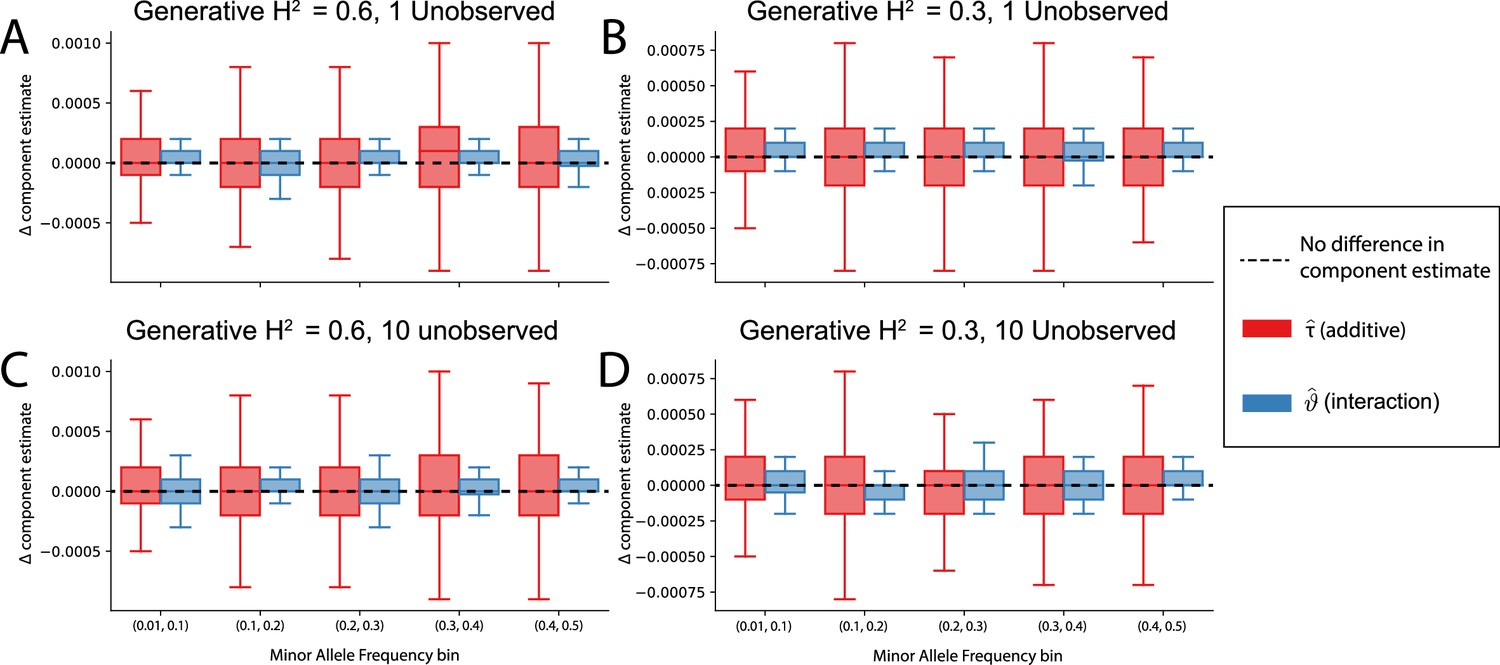
The non-additive component estimates in i-LDSC are robust to unobserved additive effects in a haplotype.
Synthetic trait architectures are simulated such that a substantial proportion of genetic variance is explained by an additive effect that is not directly observed. The goal of these simulations was to assess how these unobserved effects influence the estimation of the non-additive variance component in the i-LDSC model. In each simulation, we generated haplotypes that each contain 5000 variants. Next, we select either (A, B) a single causal variant with only an additive effect or (C, D) a set of ten causal variants with only additive effects. In each case, the causal variants have a MAF that is randomly selected between: (i) (0.01, 0.1), (ii) (0.1, 0.2), (iii) (0.2, 0.3), (iv) (0.3, 0.4), or (v) (0.4, 0.5) as depicted on the x-axis. The corresponding additive effect size for each causal variant across the haplotypes is simulated to be inversely proportional to its MAF (Schoech et al., 2019). On the y-axis, we measure the difference (Δ) between i-LDSC coefficient estimates when every variant is included in the model versus when the haplotype causal variants are omitted for two different trait architectures with broad-sense heritability set to (A, C) and (B, D) . Results are based on 100 simulations per parameter combination.
Figure 3—figure supplement 10
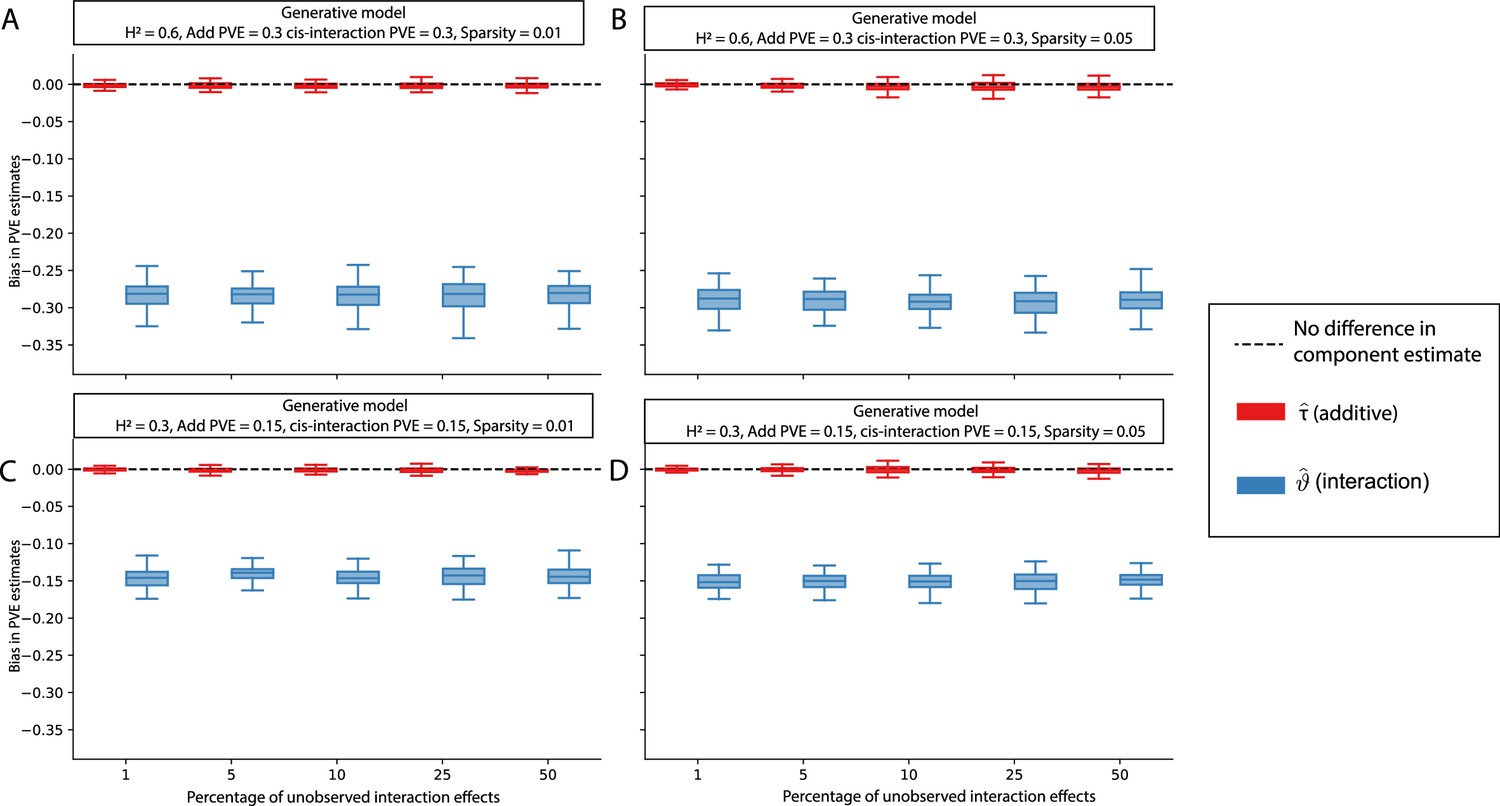
The i-LDSC framework protects against the false discovery of non-additive genetic variance when causal interacting SNPs are unobserved and the proportion of genetic variance explained by additive effects is equal to 0.5.
Synthetic trait architectures are simulated such that a substantial proportion of genetic variance is explained by pairwise genetic interaction effects that are not directly observed. The goal of these simulations was to assess how these unobserved effects influence the estimation of the non-additive variance component in the i-LDSC model. In each simulation, we generated haplotypes that each contain 5000 variants. Every SNP in the genome had at least a small additive effect. The corresponding additive effect size for each variant across the haplotypes is simulated to be inversely proportional to its MAF (Schoech et al., 2019). We then set (A, C) 1% or (B, D) 5% of causal variants in each haplotype to have non-zero interaction effects. On the y-axis, we measure the difference (Δ) between i-LDSC coefficient estimates when every variant is included in the model versus when the specified percentage of variants with pairwise genetic interaction effects are omitted for two different trait architectures with broad-sense heritability set to (A, B) and (C, D) . Results are based on 100 simulations per parameter combination.
Figure 3—figure supplement 11
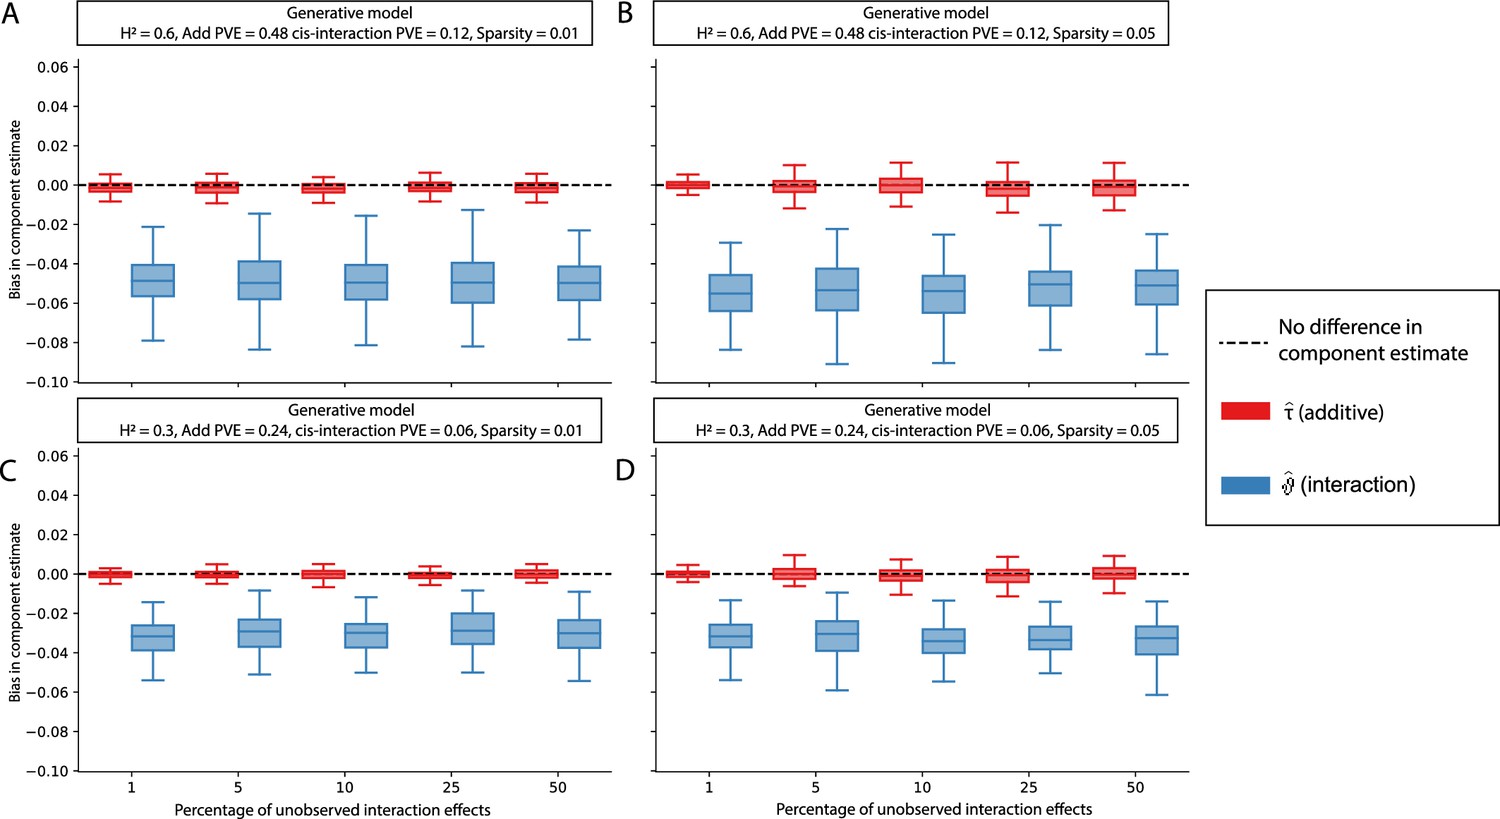
The i-LDSC framework protects against the false discovery of non-additive genetic variance when causal interacting SNPs are unobserved and the proportion of genetic variance explained by additive effects is equal to 0.8.
Synthetic trait architectures are simulated such that a substantial proportion of genetic variance is explained by pairwise genetic interaction effects that are not directly observed. The goal of these simulations was to assess how these unobserved effects influence the estimation of the non-additive variance component in the i-LDSC model. In each simulation, we generated haplotypes that each contain 5000 variants. Every SNP in the genome had at least a small additive effect. The corresponding additive effect size for each variant across the haplotypes is simulated to be inversely proportional to its MAF (Schoech et al., 2019). We then set (A, C) 1% or (B, D) 5% of causal variants in each haplotype to have non-zero interaction effects. On the y-axis, we measure the difference (Δ) between i-LDSC coefficient estimates when every variant is included in the model versus when the specified percentage of variants with pairwise genetic interaction effects are omitted for two different trait architectures with broad-sense heritability set to (A, B) and (C, D) . Results are based on 100 simulations per parameter combination.
Figure 3—figure supplement 12
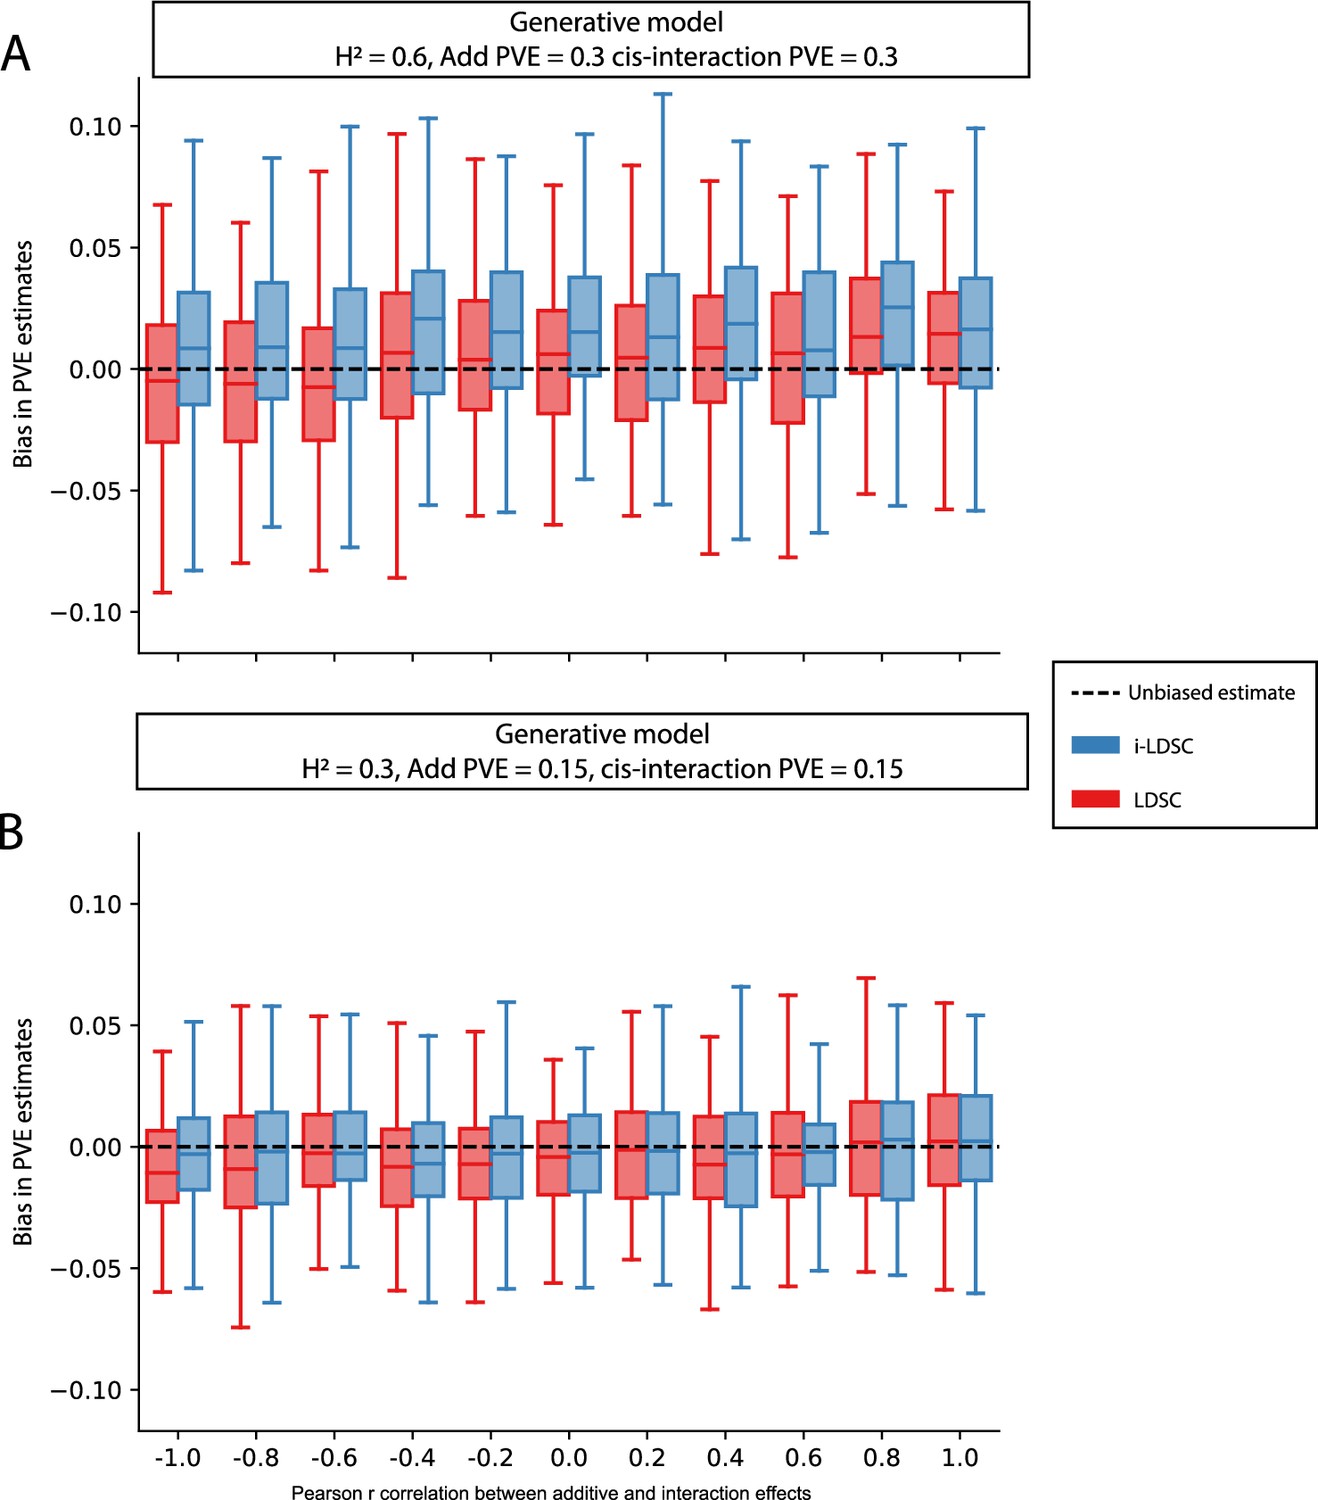
Bias in LDSC and i-LDSC estimates when the additive and interaction effect sizes in the generative model of complex traits are correlated.
To simulate synthetic trait architectures, we first simulated additive effects for each variant to be MAF-dependent (i.e., ). Here, we set the corresponding interaction effect sizes to have a correlation with the additive effect sizes equal to (labeled across the x-axis). On the y-axis, we measure the bias in the LDSC and i-LDSC estimates of phenotypic variance explained (PVE) by genetic effects. In each simulation, we generate traits with an equal proportion of variance explained by additive and interaction effects and a total broad-sense heritability set to (A) and (B) . Results are based on 100 simulations for each parameter value.
Figure 3—figure supplement 13
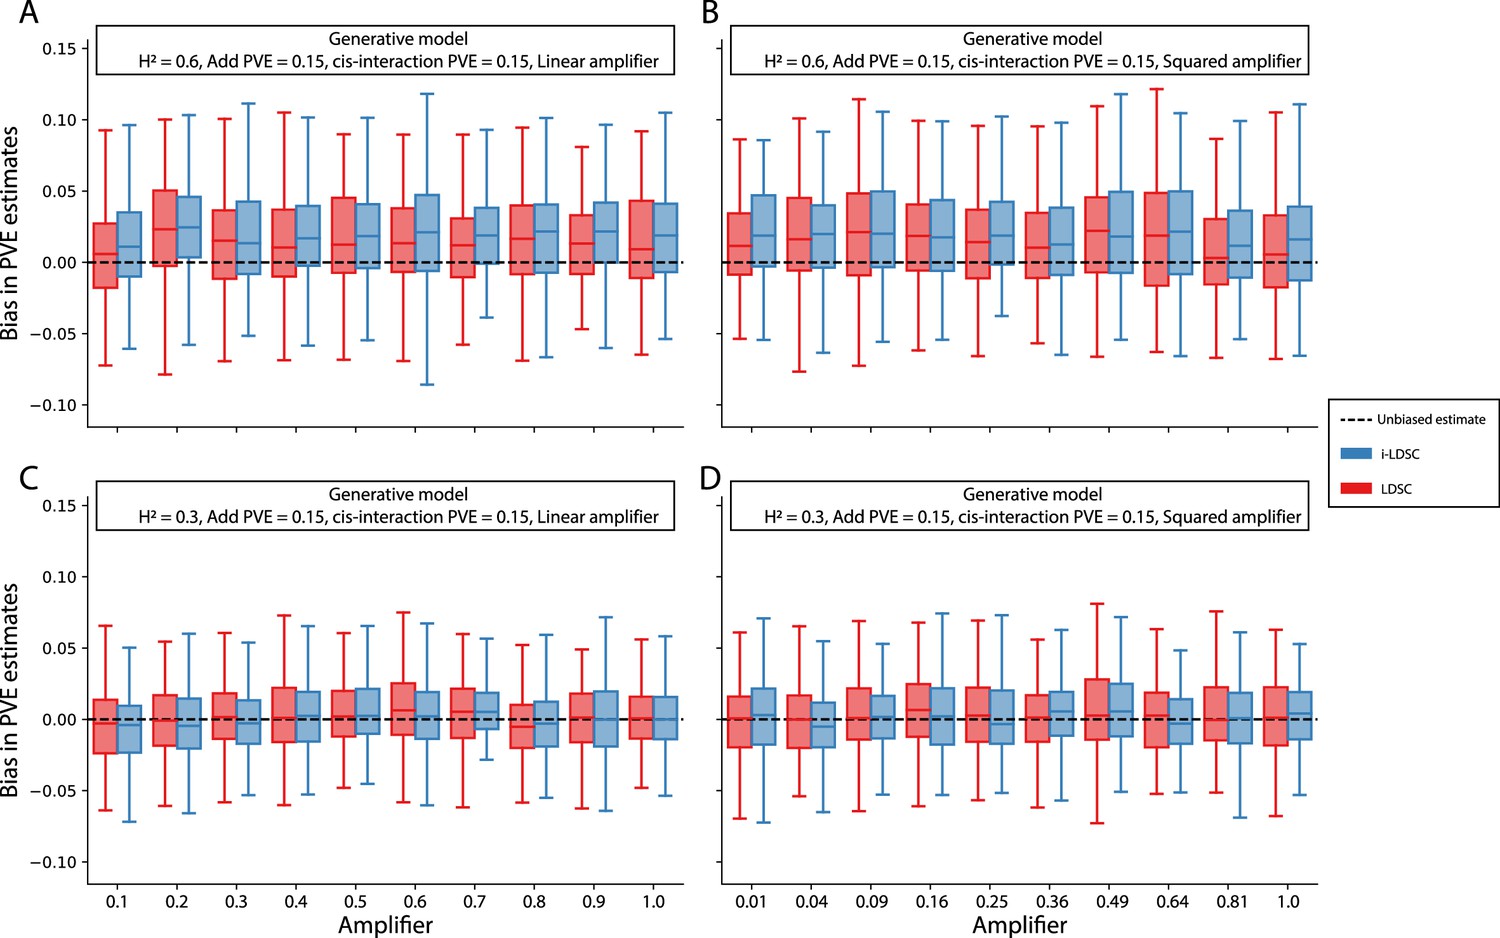
Bias in LDSC and i-LDSC estimates when interaction effect sizes in the generative model of complex traits are a linear or squared function of the the additive effects.
To simulate synthetic trait architectures, we first simulated additive effects for each variant to be MAF-dependent (i.e., ). Here, we set the corresponding interaction effect sizes to be either (A, C) a linear function or (B, D) a squared function of the additive effects with a scaling factor (labeled across the x-axis). On the y-axis, we measure the bias in the LDSC and i-LDSC estimates of the phenotypic variance explained (PVE) by genetic effects. In each simulation, we generate traits with an equal proportion of variance explained by additive and interaction effects and a total broad-sense heritability set to (A, B) and (C, D) . Results are based on 100 simulations for each parameter value.
Figure 4 with 1 supplement
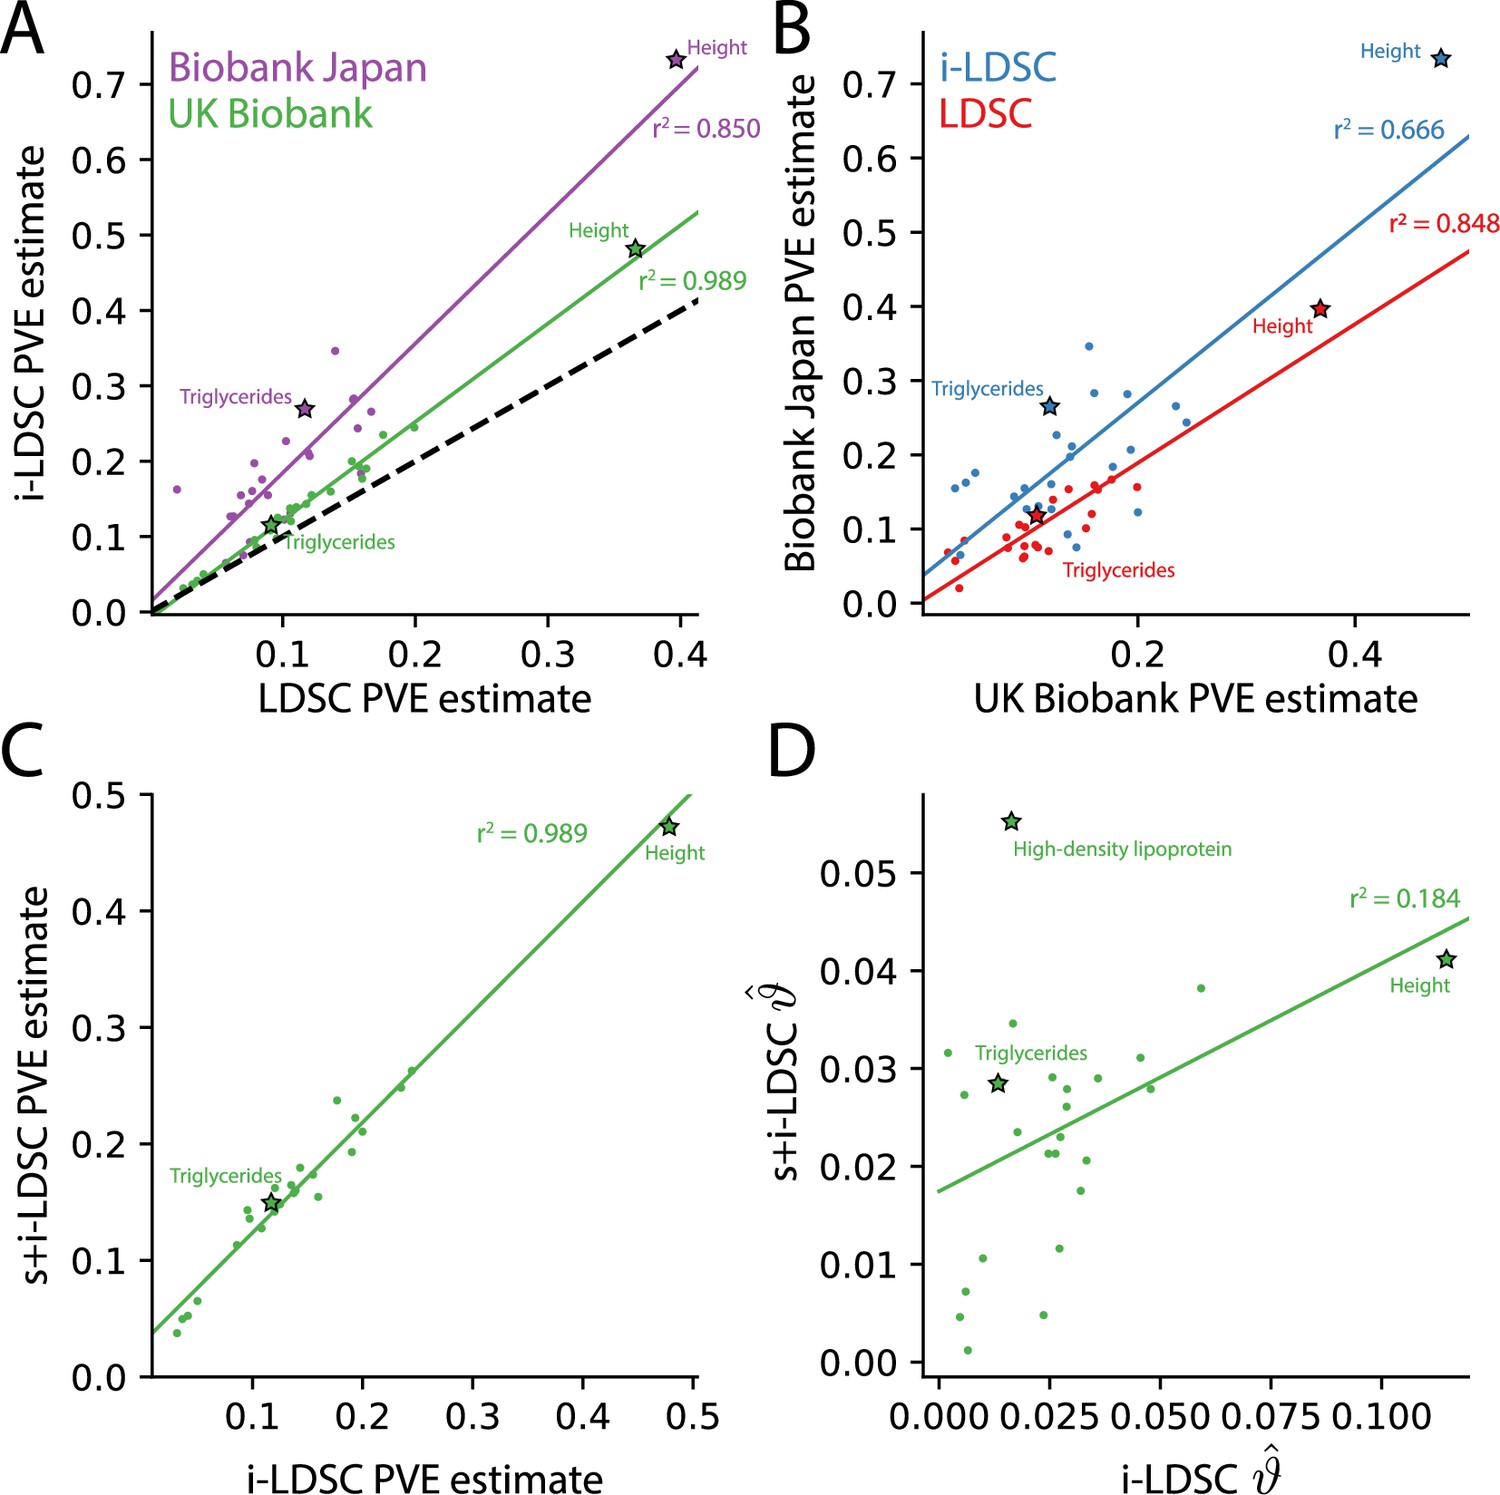
The i-LDSC framework recovers heritability and provides estimates of tagged cis-interactions in GWAS summary statistics () for 25 quantitiative traits in the UK Biobank and BioBank Japan.
(A) In both the UK Biobank (green) and BioBank Japan (purple), estimates of phenotypic variance explained (PVE) by genetic effects from i-LDSC and LDSC are highly correlated for 25 different complex traits. The Spearman correlation coefficient between heritability estimates from LDSC and i-LDSC for the UK Biobank and BioBank Japan are and , respectively. The dotted line represents the values at which estimates from both approaches are the same. (B) PVE estimates from the UK Biobank are better correlated with those from the BioBank Japan across 25 traits using LDSC (Spearman ) than i-LDSC (Spearman ). (C) Both the original and stratified LDSC models recover the same amount of PVE when the cis-interaction LD score is included as an additional component in the UK Biobank analysis (Spearman ). These models are listed as i-LDSC and s+i-LDSC, respectively. For s+i-LDSC, we included 97 functional annotations from Gazal et al. to estimate heritability. (D) Estimates of non-additive variance components in i-LDSC versus s+i-LDSC (Spearmen ). While not statistically significant in the stratified analysis with the additional annotations, the non-additive component still makes nonzero contributions to the PVE estimation for all 25 traits in the UK Biobank (see Tables 1 and 2).
Figure 4—figure supplement 1
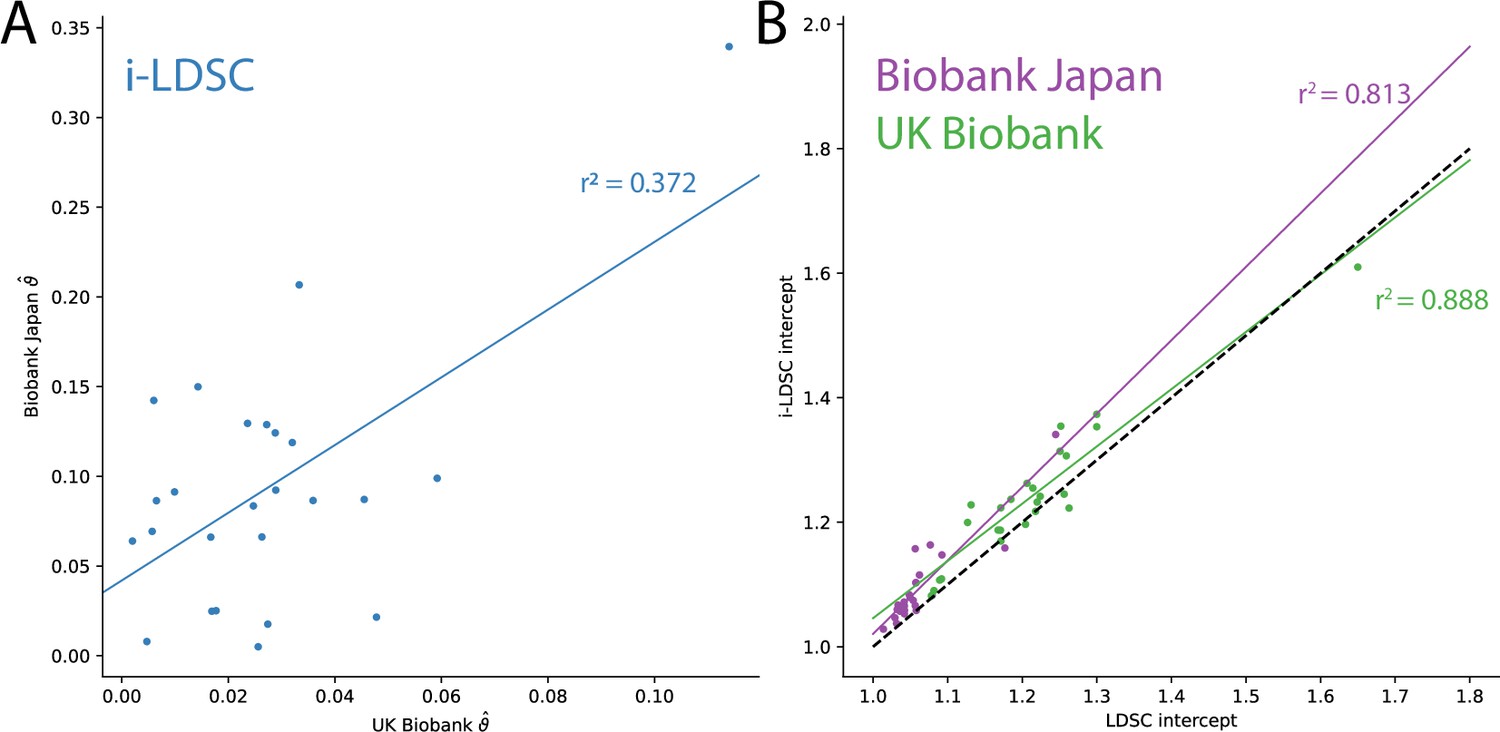
Additional results from applying LDSC and i-LDSC for 25 quantitiative traits in the UK Biobank and BioBank Japan.
(A) i-LDSC estimates of the phenotypic variation explained by tagged non-additive genetic effects using the cis-interaction LD score (i.e., estimates of ) between traits in the UK Biobank and BioBank Japan (Spearman ). (B) Estimates of i-LDSC and LDSC intercept terms for 25 traits analyzed in the UK Biobank and BioBank Japan. Intercept terms using LDSC and i-LDSC are highly correlated in both the UK Biobank (Spearman ) and BioBank Japan (Spearman ). The dotted line represents points for when the two sets of estimates are equal.
Tables
Table 1
i-LDSC heritability estimates and p-values highlighting statistically significant contributions of tagged pairwise genetic interaction effects for 25 traits in the UK Biobank and BioBank Japan.
Here, LDSC heritability estimates are included as a baseline. The difference between the approaches is that the i-LDSC heritability estimates include proportions of phenotypic variation that are explained by tagged non-additive variation (see columns with estimates of ). Note that all 25 traits analyzed in the UK Biobank and 23 of the 25 traits analyzed in BioBank Japan have a statistically significant amount of tagged non-additive genetic effects as detected by the cis-interaction LD score (p < 0.05). The two traits without significant tagged non-additive genetic effects in BioBank Japan were HDL (p = 0.081) and Triglyceride (p = 0.110). These traits are indicated by *. The i-LDSC p-values are related to the estimates of the coefficients which are also displayed in Figure 4.
| Trait | UKB (LDSC) | UKB (i-LDSC) | UKB | UKB p-value | BBJ (LDSC) | BBJ (i-LDSC) | BBJ | BBJ p-value |
|---|---|---|---|---|---|---|---|---|
| Basophil | 0.0250 | 0.0315 | 0.0065 | 1.572× 10⁻¹² | 0.0684 | 0.1548 | 0.0864 | 0.025 |
| BMI | 0.1757 | 0.2349 | 0.0592 | 3.083× 10−84 | 0.1667 | 0.2656 | 0.0989 | 2.438× 10⁻¹⁸ |
| Cholesterol | 0.0954 | 0.0974 | 0.0020 | 1.821× 10⁻¹⁶ | 0.0629 | 0.1268 | 0.0639 | 2.740× 10⁻⁴ |
| CRP | 0.0354 | 0.0414 | 0.0060 | 9.845× 10⁻¹² | 0.0202 | 0.1625 | 0.1423 | 0.020 |
| DBP | 0.0940 | 0.1203 | 0.0263 | 1.118× 10−65 | 0.0605 | 0.1267 | 0.0662 | 1.675× 10⁻⁷ |
| EGFR | 0.1521 | 0.1999 | 0.0478 | 1.187× 10−46 | 0.1010 | 0.1225 | 0.0215 | 4.232× 10⁻⁵ |
| Eosinophil | 0.1055 | 0.1375 | 0.0320 | 1.230× 10⁻¹⁸ | 0.0785 | 0.1973 | 0.1188 | 0.001 |
| HBA1C | 0.0906 | 0.1083 | 0.0177 | 1.578× 10⁻²⁶ | 0.1057 | 0.1308 | 0.0251 | 0.031 |
| HDL* | 0.1599 | 0.1768 | 0.0169 | 9.636× 10−37 | 0.1590 | 0.1838 | 0.0248 | 0.081 |
| Height | 0.3675 | 0.4815 | 0.1140 | 1.038× 10−64 | 0.3941 | 0.7336 | 0.3395 | 7.433× 10⁻³³ |
| Hematocrit | 0.1078 | 0.1352 | 0.0274 | 2.479× 10⁻²⁵ | 0.0752 | 0.0928 | 0.0176 | 3.689× 10⁻⁵ |
| Hemoglobin | 0.1177 | 0.1433 | 0.0256 | 4.284× 10⁻²⁷ | 0.0702 | 0.0752 | 0.0050 | 9.037× 10⁻⁴ |
| LDL | 0.0802 | 0.0859 | 0.0057 | 5.087× 10⁻¹³ | 0.0745 | 0.1438 | 0.0693 | 0.018 |
| Lymphocyte | 0.0402 | 0.0501 | 0.0099 | 4.906× 10⁻¹⁹ | 0.0844 | 0.1757 | 0.0913 | 5.479× 10⁻⁵ |
| MCH | 0.1361 | 0.1597 | 0.0236 | 1.785× 10⁻²⁵ | 0.1536 | 0.2831 | 0.1295 | 1.042× 10⁻⁵ |
| MCHC | 0.0317 | 0.0364 | 0.0047 | 3.730× 10⁻¹² | 0.0571 | 0.0650 | 0.0079 | 0.027 |
| MCV | 0.1630 | 0.1902 | 0.0272 | 1.180× 10⁻²⁹ | 0.1530 | 0.2818 | 0.1288 | 1.042× 10⁻⁵ |
| Monocyte | 0.0788 | 0.0955 | 0.0167 | 5.257× 10⁻¹⁸ | 0.0888 | 0.1549 | 0.0661 | 0.004 |
| Neutrophil | 0.1102 | 0.1391 | 0.0289 | 1.777× 10⁻³³ | 0.1191 | 0.2114 | 0.0923 | 5.050× 10⁻⁵ |
| Platelet | 0.1992 | 0.2447 | 0.0455 | 2.303× 10−37 | 0.1565 | 0.2436 | 0.0871 | 7.724× 10⁻⁹ |
| RBC | 0.1574 | 0.1933 | 0.0359 | 3.292× 10⁻³¹ | 0.1203 | 0.2068 | 0.0865 | 5.972× 10⁻⁸ |
| SBP | 0.0954 | 0.1201 | 0.0247 | 8.660× 10−75 | 0.0769 | 0.1604 | 0.0835 | 9.075× 10⁻¹⁰ |
| Triglycerides* | 0.1061 | 0.1204 | 0.0143 | 1.410× 10⁻²⁶ | 0.1171 | 0.2670 | 0.1499 | 0.110 |
| Urate | 0.1217 | 0.1550 | 0.0333 | 9.642× 10−38 | 0.1395 | 0.3462 | 0.2067 | 0.015 |
| WBC | 0.0962 | 0.1250 | 0.0288 | 9.866× 10⁻³⁴ | 0.1024 | 0.2266 | 0.1242 | 1.346× 10⁻⁸ |
Table 2
Comparison of s-LDSC and i-LDSC estimates of phenotypic variance explained (PVE) by genetic effects for 25 complex traits in the UK Biobank.
Here, we use stratified LD score regression (s-LDSC) to partition heritability across different genomic elements (Finucane et al., 2015). We used 97 functional annotations from Gazal et al. to estimate heritability in 25 traits. We then appended cis-interaction LD scores as an additional annotation to obtain heritability estimates (this method is referred to as s+i-LDSC in the table). p-values for the s+i-LDSC model detailing the contributions of tagged non-additive genetic effects for 25 traits are provided in the last column. Note that, while not statistically significant in this stratified analysis with the additional annotations, the non-additive component still makes nonzero contributions to the PVE estimation for all 25 traits.
| Trait | UKB PVE (s-LDSC) | UKB PVE (s+i-LDSC) | s+i-LDSC p-value |
|---|---|---|---|
| Basophil | 0.0363 | 0.0375 | 0.4728 |
| BMI | 0.2100 | 0.2482 | 0.8126 |
| Cholesterol | 0.1042 | 0.1358 | 0.6202 |
| CRP | 0.0452 | 0.0524 | 0.6483 |
| DBP | 0.1228 | 0.1441 | 0.6125 |
| EGFR | 0.1826 | 0.2105 | 0.8507 |
| Eosinophil | 0.1403 | 0.1578 | 0.1867 |
| HBA1C | 0.1040 | 0.1275 | 0.6917 |
| HDL | 0.1820 | 0.2373 | 0.5754 |
| Height | 0.4315 | 0.4726 | 0.5224 |
| Hematocrit | 0.1416 | 0.1646 | 0.3956 |
| Hemoglobin | 0.1504 | 0.1795 | 0.2299 |
| LDL | 0.0858 | 0.1131 | 0.8812 |
| Lymphocyte | 0.0545 | 0.0651 | 0.1453 |
| MCH | 0.1497 | 0.1545 | 0.0968 |
| MCHC | 0.0450 | 0.0496 | 0.3728 |
| MCV | 0.1814 | 0.1930 | 0.1530 |
| Monocyte | 0.1085 | 0.1431 | 0.5421 |
| Neutrophil | 0.1320 | 0.1599 | 0.2499 |
| Platelet | 0.2317 | 0.2628 | 0.7371 |
| RBC | 0.1933 | 0.2223 | 0.3197 |
| SBP | 0.1206 | 0.1419 | 0.1100 |
| Triglycerides | 0.1335 | 0.1621 | 0.5301 |
| Urate | 0.1530 | 0.1736 | 0.1177 |
| WBC | 0.1221 | 0.1482 | 0.5155 |
Additional files
-
Supplementary file 1
Comparison of LDSC and i-LDSC estimates of the proportion of phenotypic variance explained (PVE) by genetic effects (i.e., estimated heritability) when the true heritability is set to for polygenic traits.
Synthetic trait architecture was simulated using real genotype data from individuals of self-identified European ancestry in the UK Biobank. All SNPs were considered to have at least an additive effect (i.e., creating a polygenic trait architecture). Next, we randomly select two groups of interacting variants and divide them into two groups. The group #1 SNPs are chosen to be 10% of the total number of SNPs genome-wide. These interact with the group #2 SNPs which are selected to be variants within a ± 100 kilobase (kb) window around each SNP in group #1. Coefficients for additive and interaction effects were simulated with no minor allele frequency dependency (see Materials and Methods). Here, we assume a heritability and vary the proportion contributed by additive effects with . We run i-LDSC while computing the cis-interaction LD scores using different estimating windows of ± 5, ± 10, ± 25, and ± 50 SNPs. The “average” column represents results using model averaging over the different estimating windows (see Materials and Methods). We report the mean estimates of heritability (with standard errors in the parentheses) and use mean absolute error (MAE) to quantify the difference between the two methods. Results are based on 100 simulations per parameter combination. As shown in Figure 3—figure supplements 3 and 1, LDSC does not capture the contribution of non-additive genetic effects to trait variation.
- https://cdn.elifesciences.org/articles/90459/elife-90459-supp1-v1.xlsx
-
Supplementary file 2
Comparison of LDSC and i-LDSC estimates of the proportion of phenotypic variance explained (PVE) by genetic effects (i.e., estimated heritability) when the true heritability is set to .
Synthetic trait architecture was simulated using real genotype data from individuals of self-identified European ancestry in the UK Biobank. All SNPs were considered to have at least an additive effect (i.e., creating a polygenic trait architecture). Next, we randomly select two groups of interacting variants and divide them into two interacting groups. The group #1 SNPs are chosen to be 10% of the total number of SNPs genome-wide. These interact with the group #2 SNPs which are selected to be variants within a ± 100 kilobase (kb) window around each SNP in group #1. Coefficients for additive and interaction effects were simulated with no minor allele frequency dependency (see Materials and Methods). Here, we assume a heritability and vary the proportion contributed by additive effects with . We run i-LDSC while computing the cis-interaction LD scores using different estimating windows of ± 5, ± 10, ± 25, and ± 50 SNPs. The “average” column represents results using model averaging over the different estimating windows (see Materials and Methods). We report the mean estimates of heritability (with standard errors in the parentheses) and use mean absolute error (MAE) to quantify the difference between the two methods. Results are based on 100 simulations per parameter combination. As shown in Figure 3—figure supplements 3 and 1, LDSC does not capture the additional contribution of non-additive genetic effects to trait variation.
- https://cdn.elifesciences.org/articles/90459/elife-90459-supp2-v1.xlsx
-
Supplementary file 3
Abbreviations used throughout this study for 14 quantitative traits analyzed in this study.
The remaining 11 traits analyzed were Basophil count, Cholesterol, Eosinophil count, Height, Hematocrit, Hemoglobin, Lymphocyte count, Monocyte count, Neutrophil count, and Triglyceride levels, respectively. These are not abbreviated in the main text.
- https://cdn.elifesciences.org/articles/90459/elife-90459-supp3-v1.xlsx
-
Supplementary file 4
Trait-specific α parameters for each of the 25 traits analyzed.
Here, α values are used to weight each variant based on its minor allele frequency to account for frequency dependent architectures in each trait. The ∗ indicates α parameters that were taken directly from Schoech et al. The α parameters for other traits were calculated using the protocol used in that paper. Expansion of trait abbreviations are given in Supplementary file 3.
- https://cdn.elifesciences.org/articles/90459/elife-90459-supp4-v1.xlsx
-
Supplementary file 5
Number of individuals and total SNPs included in the analysis of each trait in BioBank Japan.
- https://cdn.elifesciences.org/articles/90459/elife-90459-supp5-v1.xlsx
-
MDAR checklist
- https://cdn.elifesciences.org/articles/90459/elife-90459-mdarchecklist1-v1.docx
Download links
A two-part list of links to download the article, or parts of the article, in various formats.
Downloads (link to download the article as PDF)
Open citations (links to open the citations from this article in various online reference manager services)
Cite this article (links to download the citations from this article in formats compatible with various reference manager tools)
Discovering non-additive heritability using additive GWAS summary statistics
eLife 13:e90459.
https://doi.org/10.7554/eLife.90459


