Physiological roles of endocytosis and presynaptic scaffold in vesicle replenishment at fast and slow central synapses
- Cellular and Molecular Synaptic Function Unit, Okinawa Institute of Science and Technology - Graduate University, Japan
Figures
Figure 1 with 1 supplement
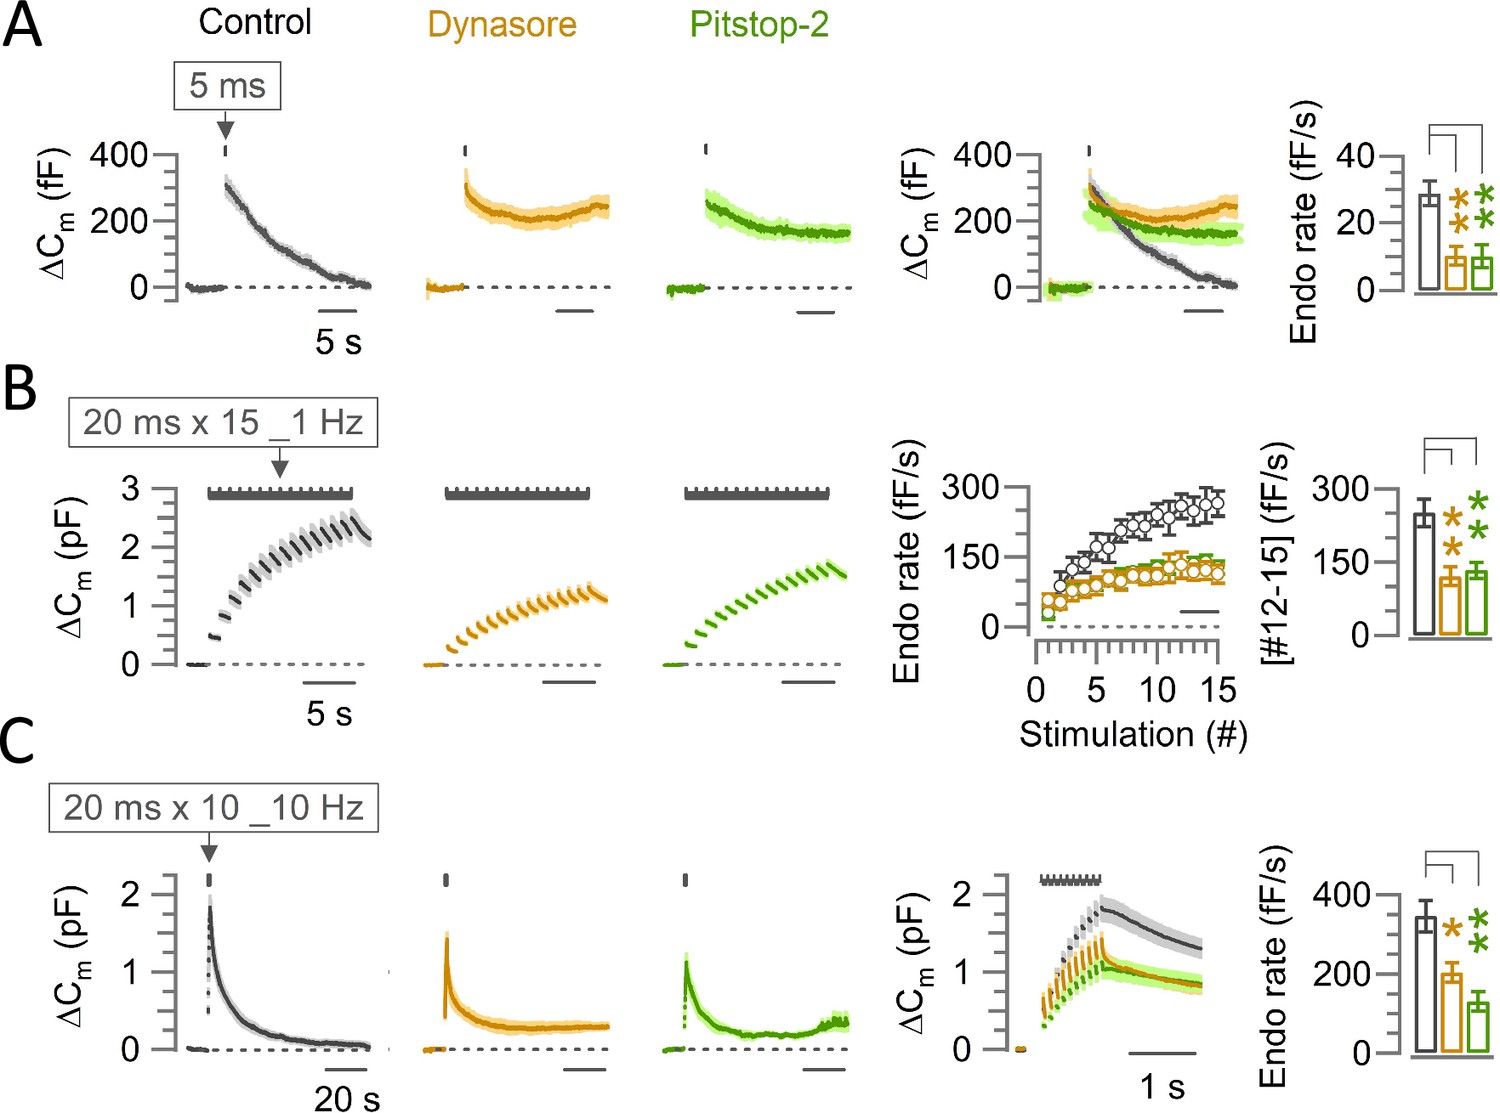
The endocytic blocker Dynasore or Pitstop-2 inhibits slow, fast-accelerating and fast endocytosis at the calyx of Held.
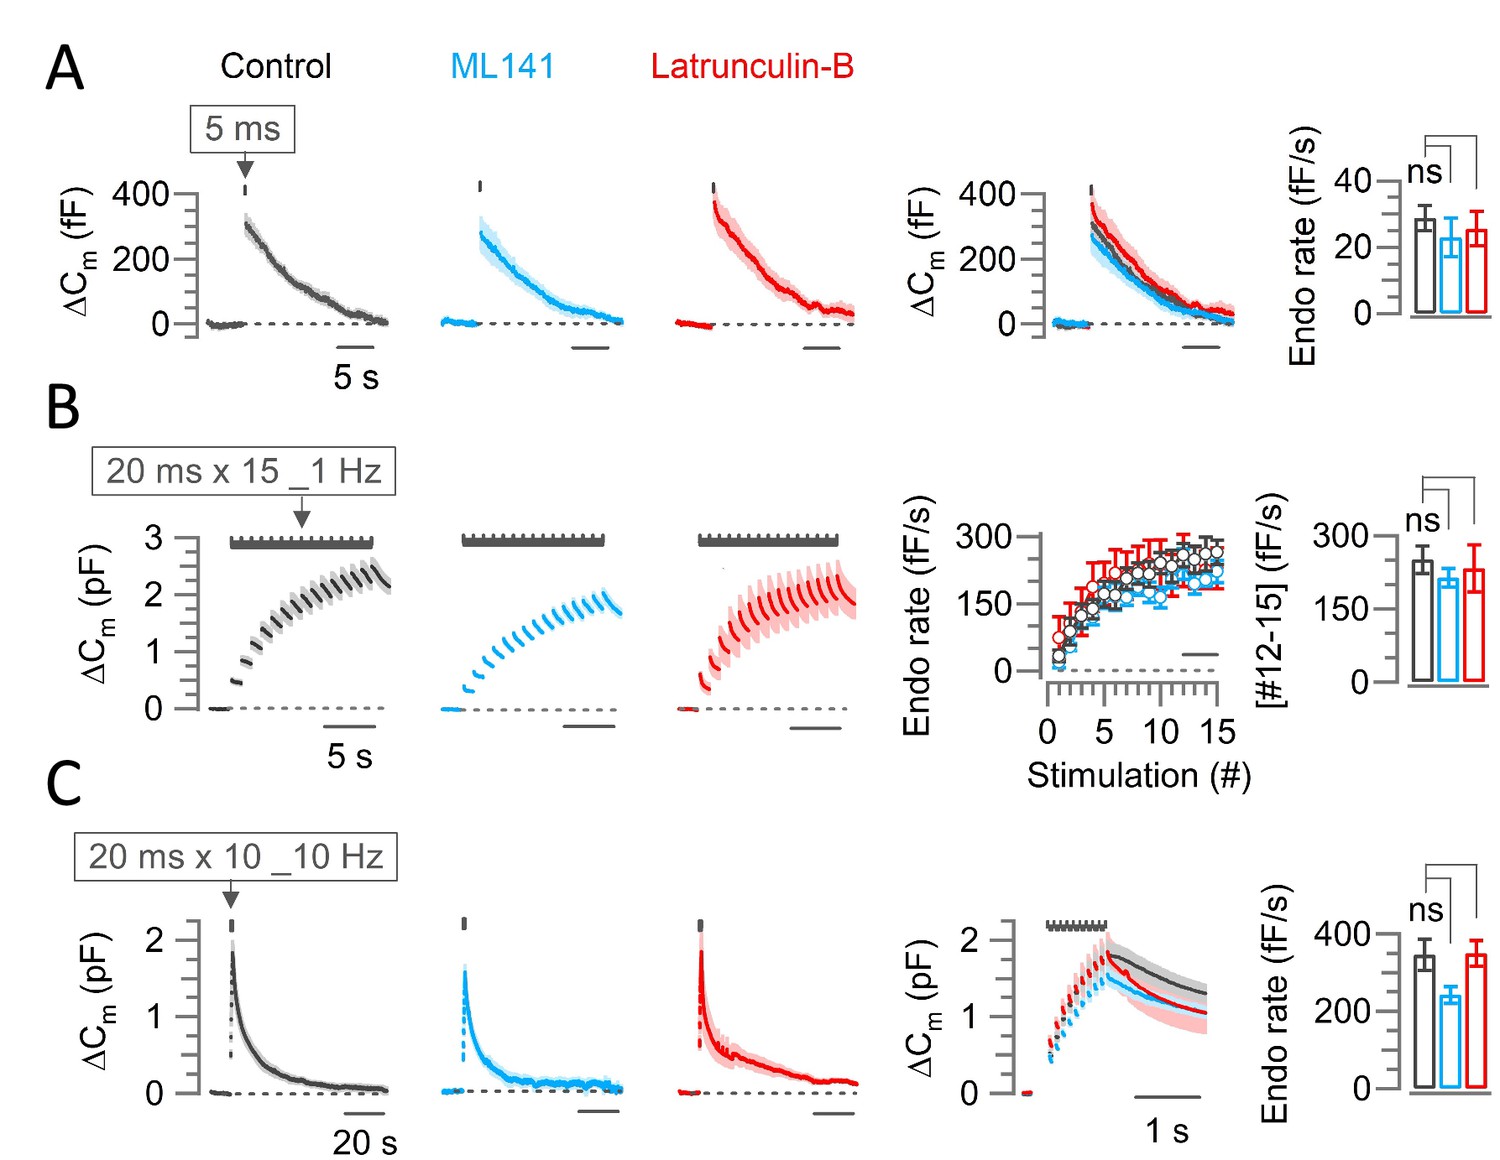
(A) Average traces of slow endocytic membrane capacitance changes (ΔCm) in response to a 5 ms depolarizing pulse (stepping from –70 mV to +10 mV) in the absence (control, black trace) or presence of Dynasore (100 µM, 10–60 min, brown trace) or Pitstop-2 (25 µM, 10–60 min, green trace), recorded from the calyx of Held presynaptic terminal in slices from P13-15 post-hearing mice at physiological temperature (PT, 37°C) and in 2.0 mM Ca2+ aCSF. The 4th panel from the left shows the superimposed average ΔCm traces under control, Dynasore and Pitstop-2. The rightmost bar graph shows the endocytic decay rate (calculated from the slope 0.45–5.45 s after stimulation) that was slower in the presence of Dynasore (10.3±2.8 fF/s; n=5; p=0.004, Student’s t-test) or Pitstop-2 (10.1±3.4 fF/s; n=5; p=0.006) than control (28.8±3.7 fF/s; n=5). (B) Fast-accelerating endocytosis induced by a train of 20 ms depolarizing pulses (repeated 15 times at 1 Hz) in the absence (control) or presence of Dynasore or Pitstop-2. Averaged traces are shown as in (A). The 4th panel shows the endocytic rates (fF/s) calculated from the slope of Cm decay, 0.45–0.95 ms after each stimulation pulse under control, Dynasore, or Pitstop-2 (superimposed). The rightmost bar graph shows the endocytic rate averaged from stimulations #12–15 (bar in 4th panel) that was slower in the presence of Dynasore (121±19 fF/s; n=6; p=0.0045, Student’s t-test) or Pitstop-2 (133±16 fF/s; n=5; p=0.007) than control (251±28 fF/s; n=6), indicating significant inhibition of the fast-accelerating endocytosis by Dynasore or Pitstop-2 (also see Supplementary file 1). (C) Fast-endocytosis (average traces) evoked by a train of 20 ms pulses (repeated 10 times at 10 Hz) in the absence (control) or presence of Dynasore or Pitstop-2. The 4th panel shows cumulative ΔCm traces (superimposed) in an expanded timescale during and immediately after the 10 Hz stimulation train. The rightmost bar graph indicates endocytic decay rates (measured 0.45–1.45 s after the 10th stimulation) in Dynasore (204±25.3 fF; n=4; p=0.017, Student’s t-test) or in Pitstop-2 (131±24.6 fF; n=4; p=0.004) both of which were significantly slower than control (346±40.1 fF; n=6). All data in this figure are presented as mean ± sem and the statistical significance level was set at p<0.05, denoted with asterisks (*p<0.05, **p<0.01, ***p<0.001). The significance of effect was evaluated using one-way ANOVA and Student’s t-test, with Bonferroni-Holm method of p level correction.
-
Figure 1—source data 1
The endocytic blocker Dynasore or Pitstop-2 inhibits slow, fast-accelerating and fast endocytosis at the calyx of Held.
- https://cdn.elifesciences.org/articles/90497/elife-90497-fig1-data1-v1.xlsx
Figure 1—figure supplement 1
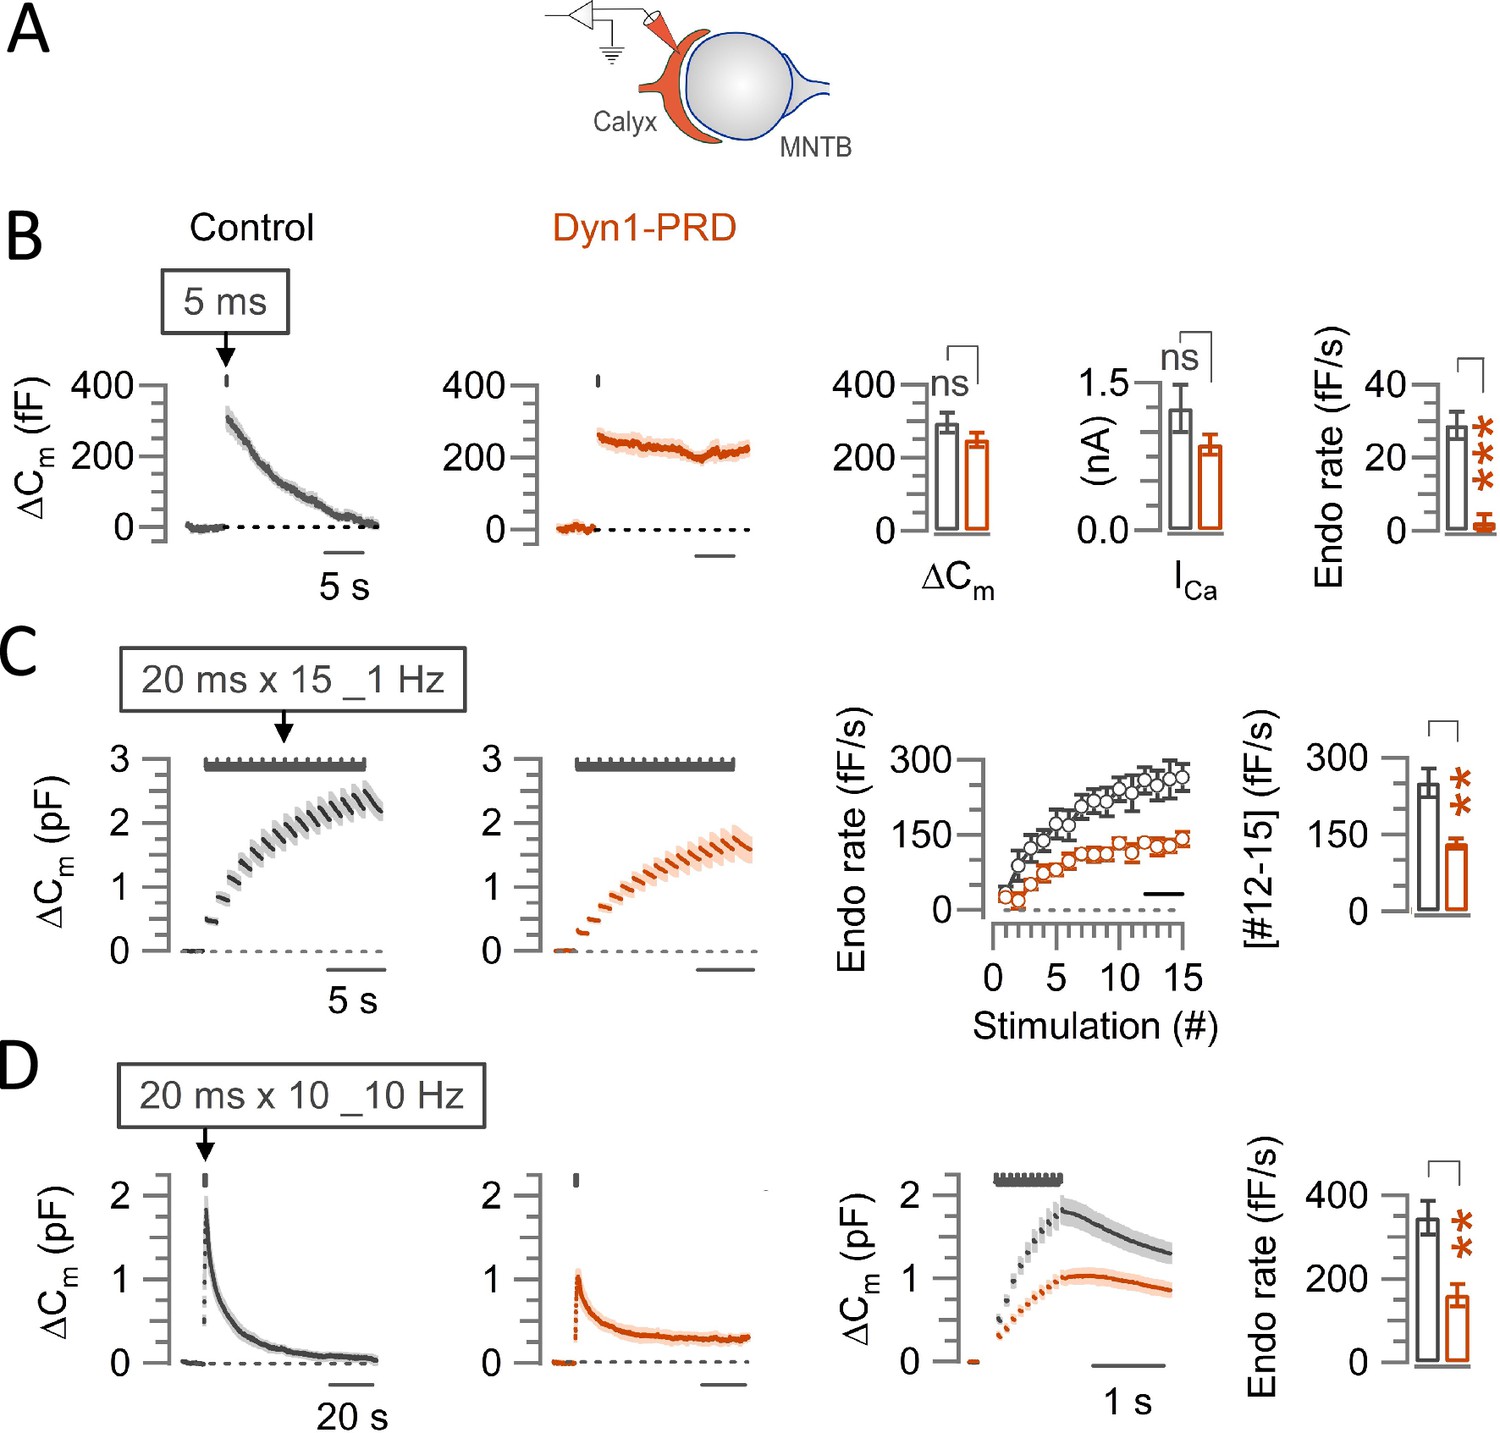
Effect of intra-terminal loading of Dynamin-1 PRD peptide on endocytosis at the calyx of Held.
(A) Schematic illustration of presynaptic membrane capacitance (Cm) recording and loading of dynamin-1 proline-rich domain (Dyn1-PRD) peptide (sequence: PQVPSRPNRAP) into a calyceal terminal (maroon) through a recording pipette. (B) Average traces of slow endocytic membrane capacitance changes (ΔCm) in response to a 5 ms depolarizing pulse (stepping from –70 mV to +10 mV), without (control, black) or with dynamin-1 PRD peptide (1 mM, waiting 4–5 min after whole-cell rupture, maroon) at the calyx of Held presynaptic terminal in slices from P13-15 mice at physiological temperature (PT, 37°C) and in 2.0 mM Ca2+ aCSF. Bar graphs on 3rd and 4th panels from left show magnitude of exocytic capacitance change (ΔCm) and calcium current in the presence of Dyn1-PRD peptide showing no difference from control (Supplementary file 1). Rightmost bar graph indicates that endocytic decay rate in dynamin PRD peptide (2.3±2.2 fF; n=5; p<0.001, Student’s t-test), was significantly slowed compared to control (28.8±3.7 fF; n=5). (C) Average fast-accelerating endocytosis traces elicited by a train of 20 ms pulses (x15) at 1 Hz in control and in the presence of dynamin-1 PRD peptide. In the 3rd panel, mean endocytic rate (fF/s) calculated from the slope of Cm decay 0.45–0.95 ms after each stimulation pulse in control and under Dyn-1 PRD peptide are superimposed. The bar graph in the 4th panel shows the average endocytic decay rate (between #12–15, bar in 3rd panel from left) that was significantly less in Dyn1-PRD peptide (132±10 fF; n=7; p=0.001) than control (251±28.3 fF; n=6). (D) Averaged traces of fast endocytosis induced by a 10 Hz train of 20 ms pulses (x10) in control and in the presence of Dyn1-PRD peptide. In the 3rd panel, superimposed Cm traces are shown in expanded time scale. The cumulative exocytic change (ΔCm) in the presence of Dyn1-PRD peptide was significantly lower than control (Supplementary file 1). Rightmost bar graph indicates that the fast endocytic decay rate was significantly slowed in the presence of Dyn1-PRD peptide (161±27.3 fF; n=6; p=0.003, t-test) compared to control (346±40.1 fF; n=6).
-
Figure 1—figure supplement 1—source data 1
Effect of intra-terminal loading of Dynamin-1 PRD peptide on endocytosis at the calyx of Held.
- https://cdn.elifesciences.org/articles/90497/elife-90497-fig1-figsupp1-data1-v1.xlsx
Figure 2 with 3 supplements
Endocytic blockers enhance activity dependent rapid synaptic depression, but do not prolong the recovery from depression at the calyx.
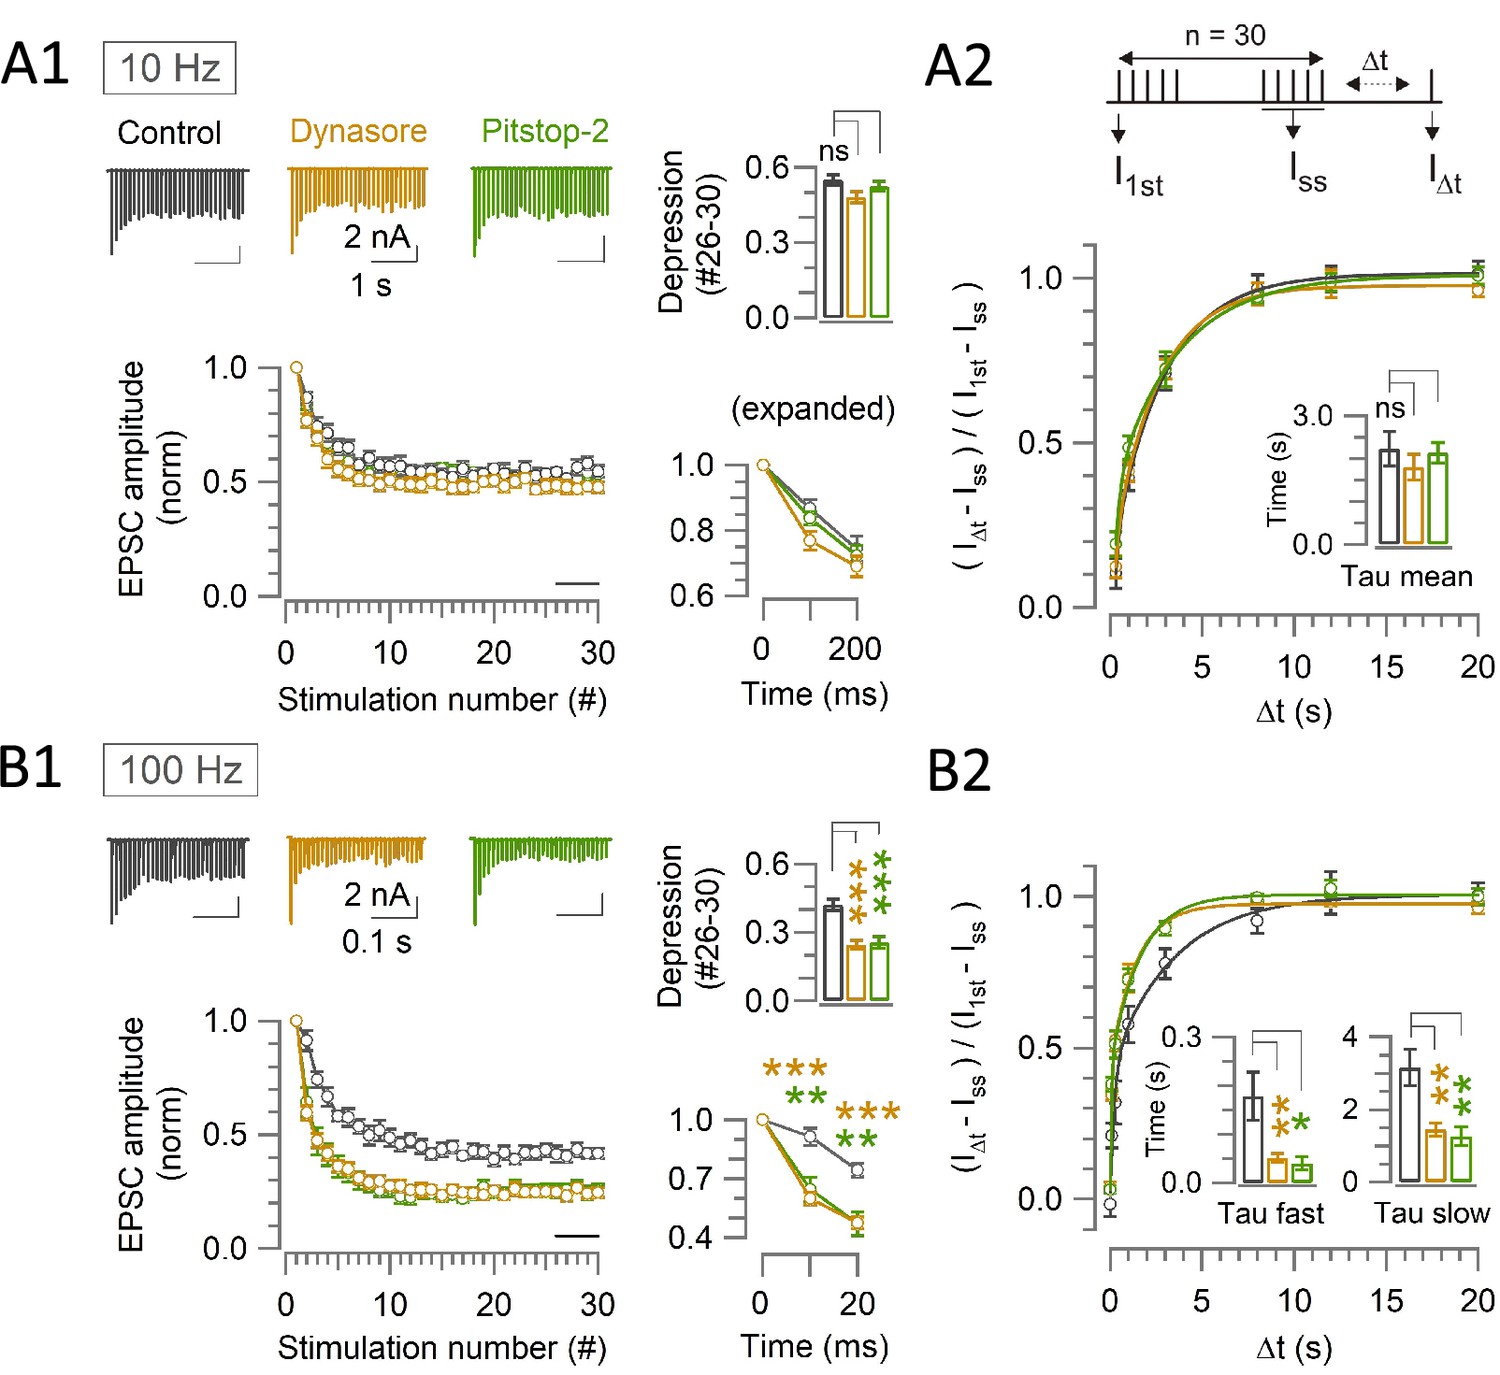
(A1, B1) A train of 30 EPSCs were evoked at the calyx of Held by afferent fiber stimulation at 10 Hz (A1) or 100 Hz (B1) in the absence (control, black traces) or presence of Dynasore (10–60 min, brown traces) or Pitstop-2 (10–60 min, green traces) at PT (37°C) in 1.3 mM Ca2+ aCSF. Panels from left to right: left-top: sample EPSC traces; left-bottom: normalized average EPSC amplitudes at each stimulus number; right-top bar graph: steady-state depression of EPSC amplitudes (mean of EPSCs #26–30, bar in the second panel); right-bottom: normalized 1st - 3rd EPSC amplitudes in expanded timescale. (A2, B2) The recovery of EPSCs from STD in control, or in the presence of Dynasore or Pitstop-2 at the calyx of Held measured using a stimulation protocol (shown on top in A2); a train of 30 stimulations at 10 Hz (A2) or 100 Hz (B2) followed by test pulses after different time intervals (∆t: 0.02, 0.1, 0.3, 1, 3, 8, 12, and 20 s). The EPSC amplitude after ∆t (I∆t) relative to the first EPSC in the stimulus train (I1st) was normalized by subtracting the steady state EPSCs (Iss) to measure the recovery rates. (A1) During 10 Hz stimulation, the steady-state depression under control (0.55±0.02; n=11) was unaltered in the presence of either Dynasore (0.48±0.02; n=12; p=0.03, not significantly different, One-way ANOVA and Student’s t-test with Bonferroni-Holm correction) or Pitstop-2 (0.53±0.02; n=7; p=0.4, no significant difference). (A2) After 10 Hz stimulation, the time constant of EPSCs recovery in control (2.3±0.4 s; n=9) was unchanged in the presence of either Dynasore (1.7±0.2 s; n=8; p=0.2, Student’s t-test) or Pitstop-2 (1.9±0.3 s; n=7; p=0.4). (B1) During 100 Hz stimulation, EPSCs underwent a significant depression starting at the 2nd stimulation (10 ms) in the presence of both Dynasore (0.6±0.03; n=10; p<0.001, t-test) or Pitstop-2 (0.65±0.06; n=7; p=0.003) than control (0.91±0.05; n=11). Bar graph indicates steady-state STD magnitudes; control: (0.42±0.025), Dynasore: (0.25±0.02; p<0.001), and Pitstop-2: (0.26±0.03; p<0.001). (B2) After 100 Hz stimulation, both fast and slow recovery time constants were significantly faster in the presence of Dynasore (τfast: 0.05±0.009 s; n=8; p=0.008 and τslow: 1.5±0.2 s; p=0.003) or Pitstop-2 (τfast: 0.04±0.014 s; n=6; p=0.02 and τslow: 1.3±0.3 s; p=0.008) than control (τfast: 0.18±0.05 s; n=8 and τslow: 3.2±0.5 s) Supplementary file 2. The online version of this article includes the following source data and figure supplement(s) for Figure 2:
-
Figure 2—source data 1
Endocytic blockers enhance activity dependent rapid synaptic depression, but do not prolong the recovery from depression at the calyx.
- https://cdn.elifesciences.org/articles/90497/elife-90497-fig2-data1-v1.xlsx
Figure 2—figure supplement 1
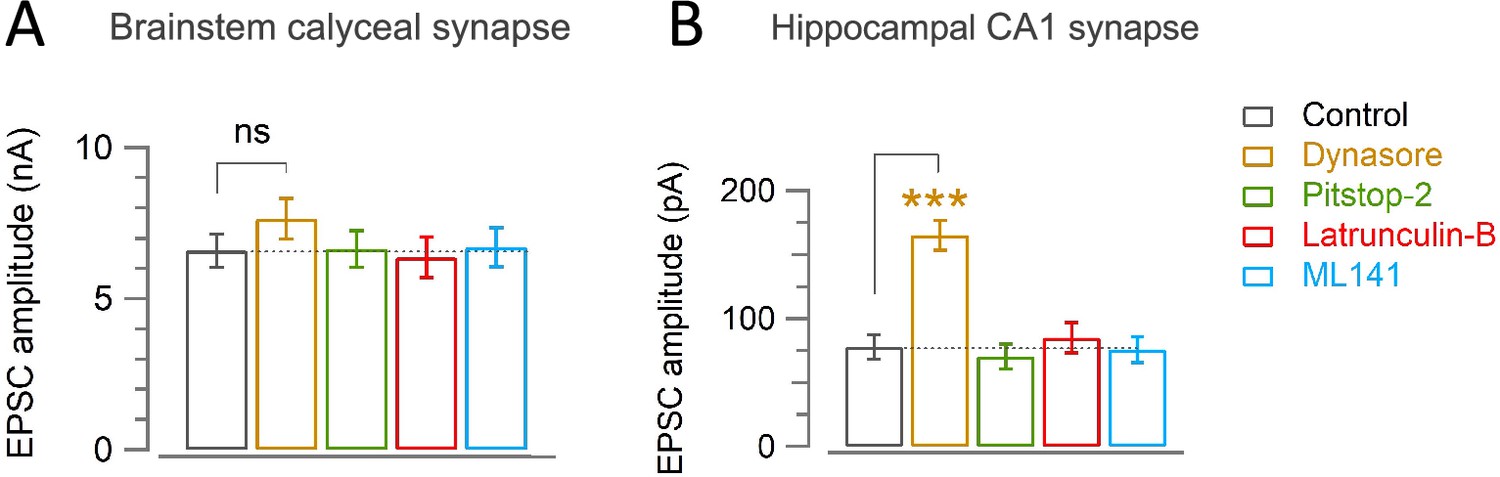
Effect of endocytic inhibitors or scaffold inhibitors on basal EPSC amplitude at the calyx and hippocampal CA1 synapses.
(A) Basal mean amplitude of EPSCs recorded from the calyx of Held in control (6.6±0.54 nA; n=22) was unaffected by Dynasore (7.6±0.67 nA; n=12; p=0.24), Pitstop-2 (6.6±0.61 nA; n=8; p=0.96), Latrunculin-B (6.4±0.67 nA; n=8; p=0.8), or ML141 (6.7±0.64 nA; n=12; p=0.9). (B) Basal mean amplitude of EPSCs recorded from hippocampal CA1 area in control (78±9.5 pA; n=17) was increased by Dynasore (165±12 pA; n=10; p<0.001, Student’s t-test), but not by Pitstop-2 (70±10 pA; n=14; p=0.6), Lat-B (85±12 pA; n=12; p=0.63), or ML141 (76±10 pA; n=10; p=0.88). The statistical significance of all data in this figure was evaluated by one-way ANOVA and Student’s t-test, with Bonferroni-Holm correction.
Figure 2—figure supplement 2
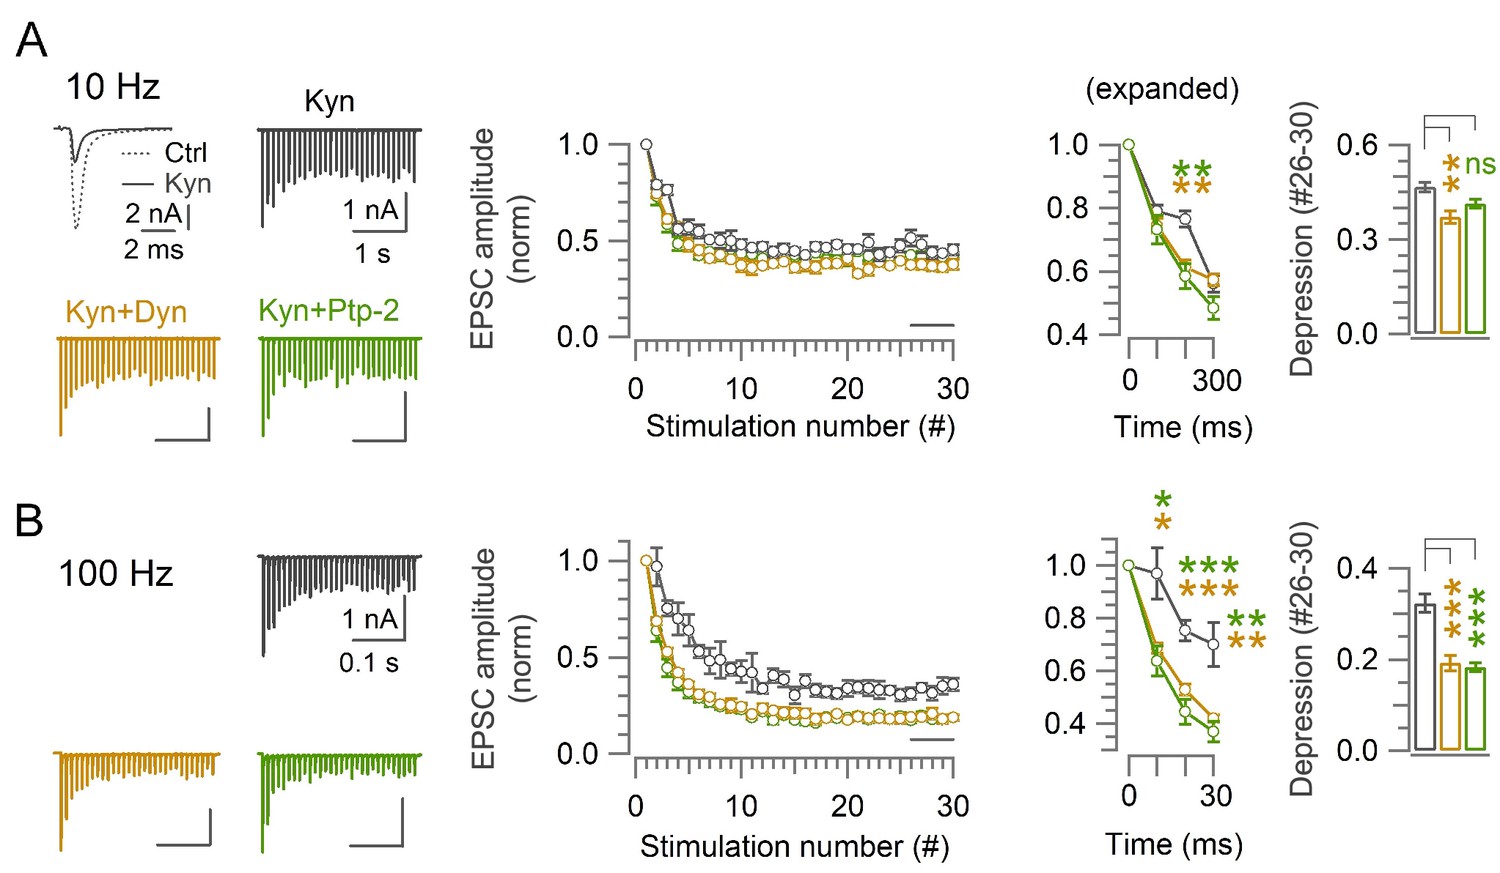
Postsynaptic AMPA receptor saturation does not contribute to enhancement of synaptic depression by endocytic blockers at the calyx of Held.
The low affinity glutamate receptor ligand kynurenic acid (Kyn, 1 mM) attenuated the EPSC amplitude (left top panel). In the presence of Kyn, the magnitude of enhancement of synaptic depression by endocytic blockers was essentially the same as that in their absence (Figure 2). (A) At 10 Hz stimulation, the steady state depression (stimulation #26–30) in the presence of Kyn or control (0.47±0.02; n=6) was slightly enhanced by Kyn+Dynasore (0.37±0.02; n=6; p=0.004, Student’s t-test), but not by Kyn+Pitstop-2 (0.41±0.014; n=7; p=0.052). (B) At 100 Hz stimulation, starting from the 2nd stimulation (10 ms from onset) synaptic depression in control (0.97±0.1; n=5) was significantly enhanced in the presence of Dynasore (0.69±0.02; n=6; p=0.012) or Pitstop-2 (0.64±0.056; n=7; p=0.01). The steady state depression (#26–30) in control (0.32±0.02; n=5) was significantly enhanced in the presence of Dynasore (0.19±0.2; p<0.001) or Pitstop-2 (0.18±0.01; p<0.001). One-way ANOVA and t-test, with Bonferroni-Holm correction was used to evaluate the statistical significance of all data in this figure.
-
Figure 2—figure supplement 2—source data 1
Postsynaptic AMPA receptor saturation does not contribute to enhancement of synaptic depression by endocytic blockers at the calyx of Held.
- https://cdn.elifesciences.org/articles/90497/elife-90497-fig2-figsupp2-data1-v1.xlsx
Figure 2—figure supplement 3
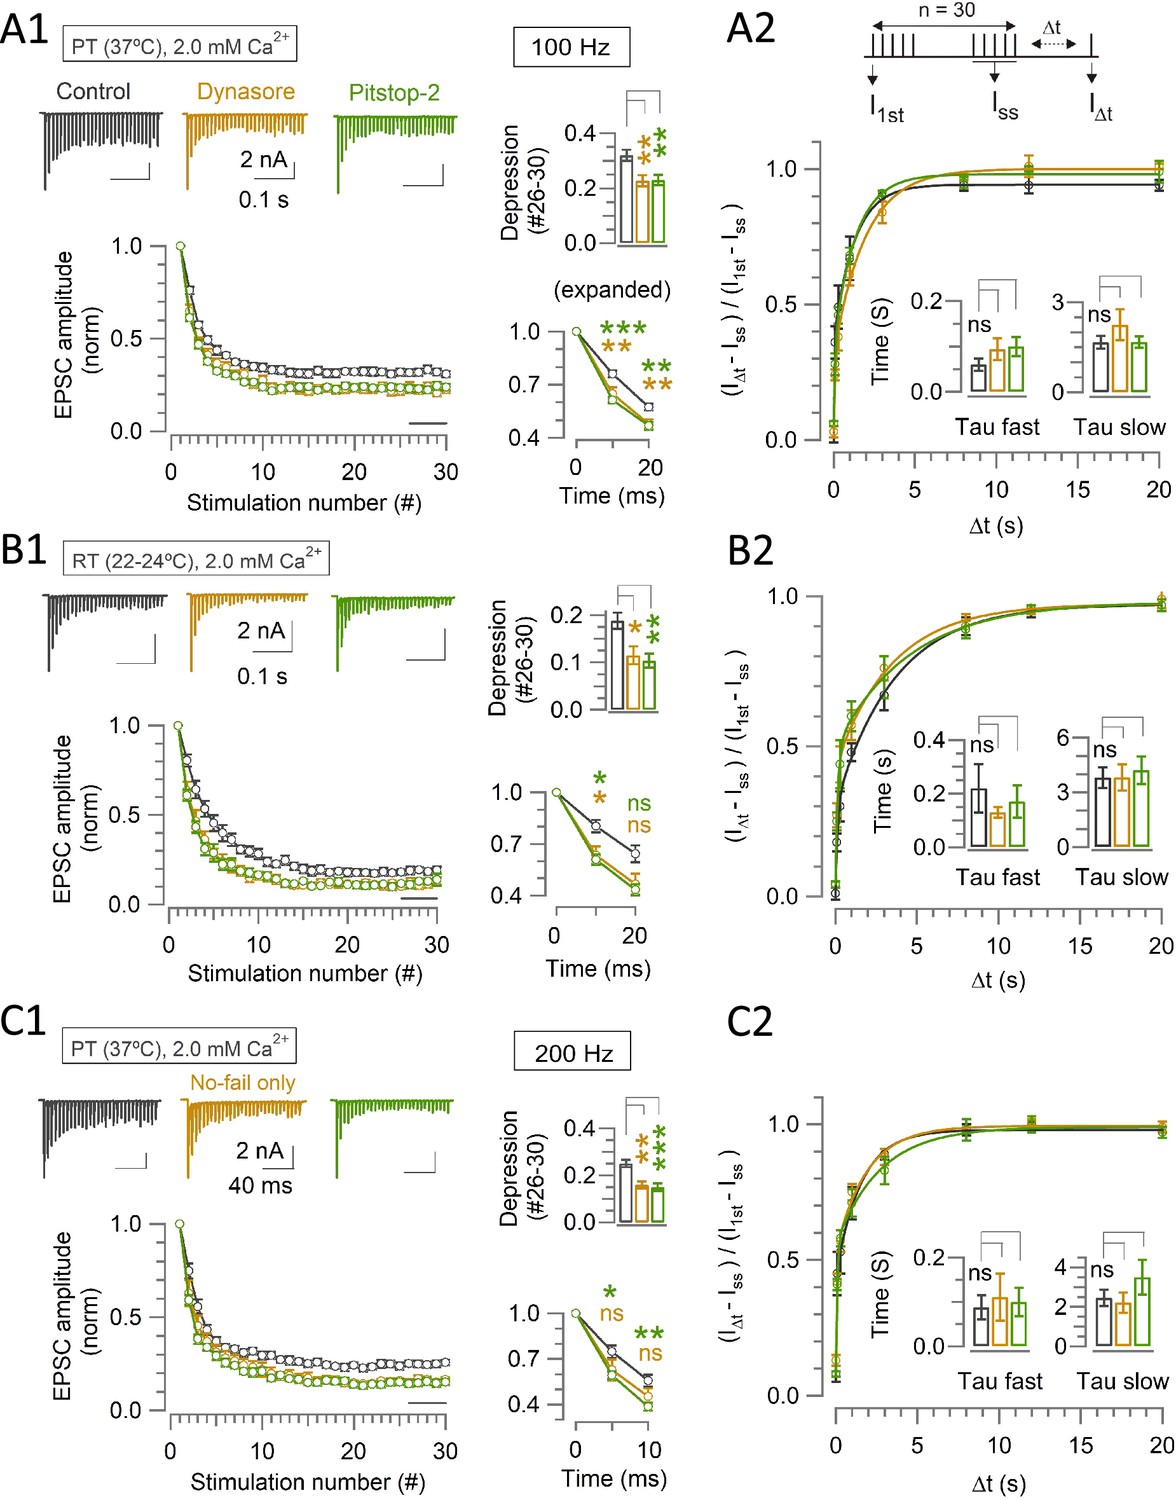
Endocytic blockers enhance STD but do not alter the recovery from STD time-course in 2.0 mM [Ca2+] irrespective of PT or RT at the calyx of Held.
Effects of Dynasore and Pitstop-2 on short-term synaptic depression (STD; A1, B1, and C1) and on the time course of normalized recovery from STD (A2, B2, and C2) during 100 Hz (A, B) or 200 Hz (C) stimulation at PT (A, C) or RT (B). (A) At PT (37°C) and in 2.0 mM Ca2+ aCSF, the magnitude of EPSCs at 100 Hz show enhanced steady state depression in the presence of either Dynasore (0.23±0.02; n=9; p=0.003, Student’s t-test) or Pitstop-2 (0.23±0.02; n=11; p=0.002), in comparison to control (0.32±0.02; n=16). However, the kinetics of normalized recovery from STD (τfast and τslow) in the presence of Dynasore (τfast: 0.094±0.024 s; n=4; p=0.2, t-test and τslow: 2.2±0.5 s; p=0.3) or Pitstop-2 (τfast: 0.1±0.02 s; n=9, p=0.2 and τslow: 1.7±0.2 s; p=0.97) were not different from control (τfast: 0.06±0.014 s, n=5 and τslow: 1.7±0.2 s). (B) In 2.0 mM Ca2+ at room temperature (RT; 22–24°C), Dynasore (0.12±0.02; n=6; p=0.016) or Pitstop-2 (0.10±0.015; n=5; p=0.008) enhanced STD (100 Hz) from control (0.19±0.02; n=11). The kinetics of recovery from STD (τfast and τslow) in the presence of Dynasore (τfast: 0.13±0.02 s; n=6; p=0.4 and τslow: 3.8±0.7 s; p=1) or Pitstop-2 (τfast: 0.17±0.06; n=5; p=0.7 and τslow: 4.2±0.8 s; p=0.7) were unchanged from control (τfast: 0.22±0.09 s; n=7 and τslow: 3.8±0.6). (C) During 200 Hz stimulation at PT and in 2.0 mM Ca2+ aCSF, steady state STD was significantly enhanced by Dynasore (0.16±0.014; n=6; p=0.001) or Pitstop-2 (0.15±0.017 s; n=7; p<0.001) compared to control (0.25±0.015; n=10). However, the normalized recovery kinetics in control (τfast: 0.09±0.03 s; n=7 and τslow: 2.5±0.41 s) were not changed by Dynasore (τfast: 0.11±0.05 s; n=6; p=0.7 and τslow: 2.2±0.5 s; p=0.7) or Pitstop-2 (τfast: 0.1±0.03 s; n=6; p=0.8 and τslow: 3.5±0.9 s; p=0.32).
-
Figure 2—figure supplement 3—source data 1
Endocytic blockers enhance STD but do not alter the recovery from STD time-course in 2.0 mM [Ca2+] irrespective of PT or RT at the calyx of Held.
- https://cdn.elifesciences.org/articles/90497/elife-90497-fig2-figsupp3-data1-v1.xlsx
Figure 3
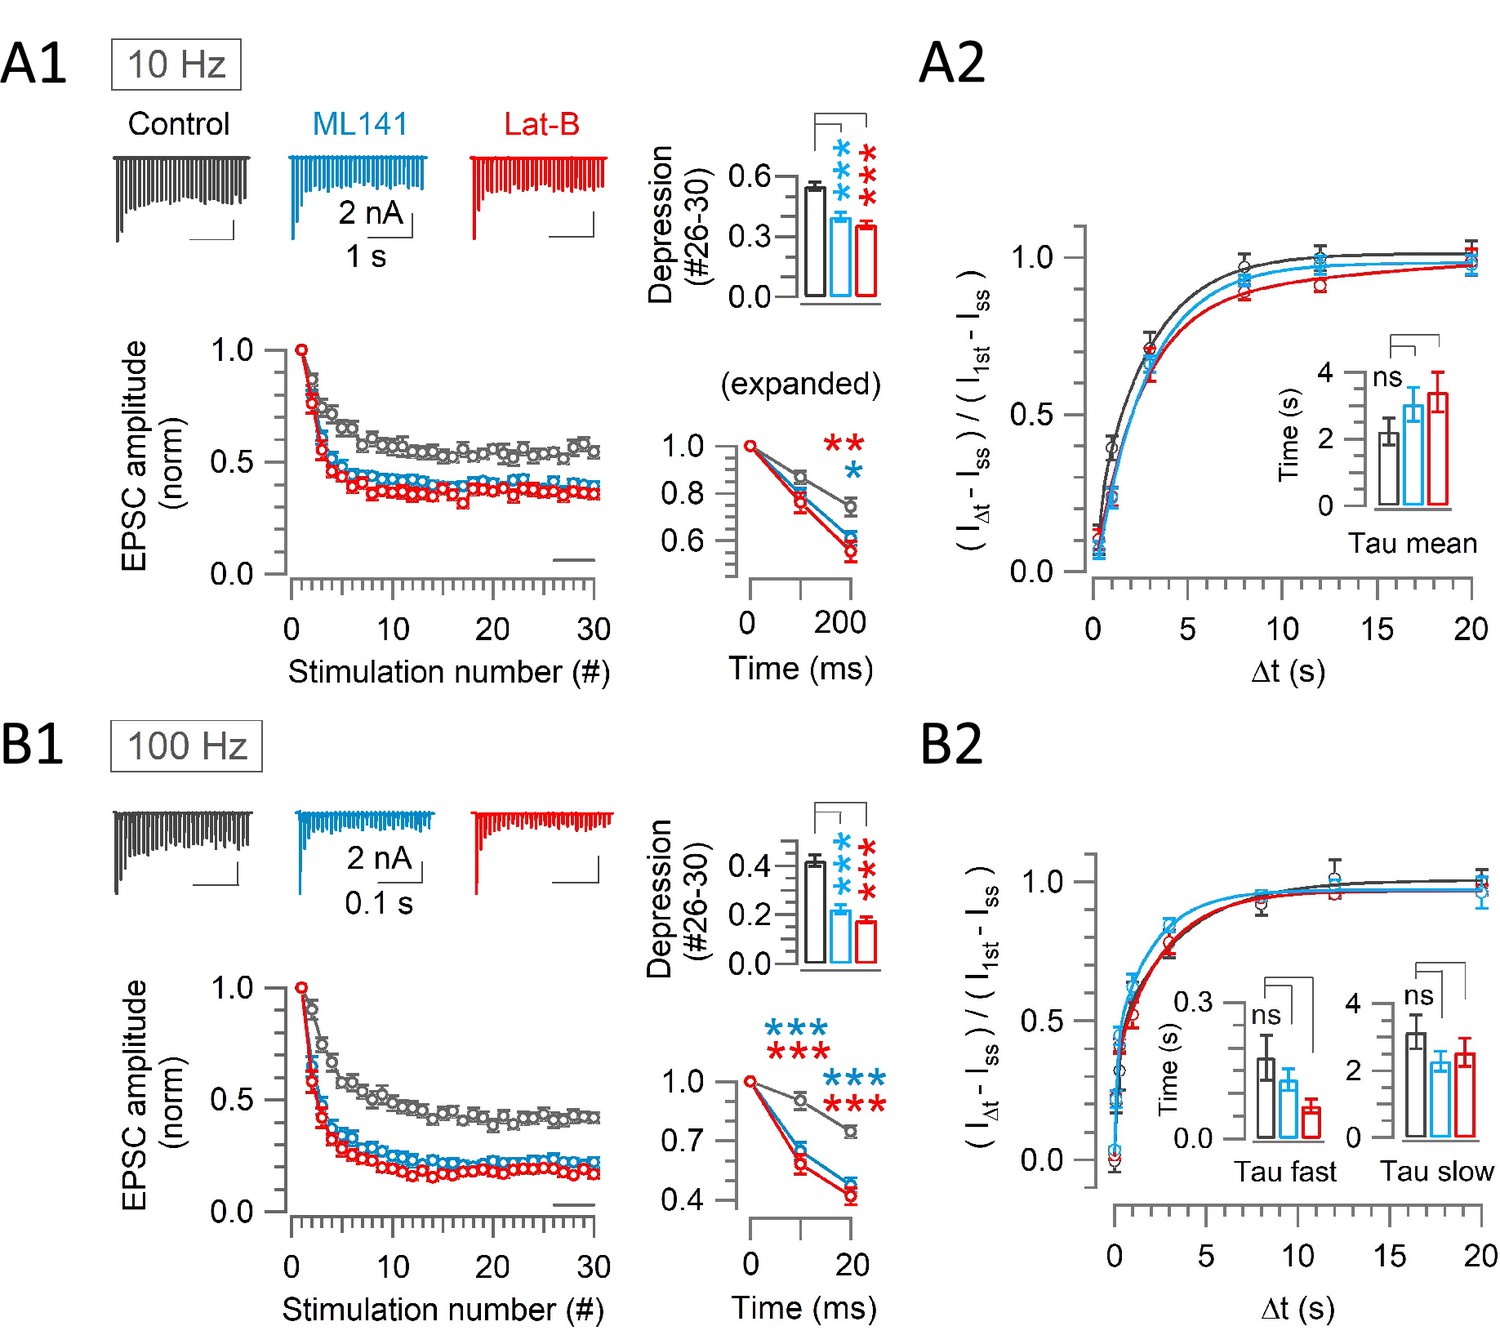
Scaffold machinery inhibitors have no effect on endocytic membrane retrievals at the calyx of Held.
The CDC42 inhibitor ML141 (10 µM, 10–60 min, cyan) or actin depolymerizer Latrunculin B (Lat-B, 10–60 min, 15 µM, red) had no effect on slow endocytosis in response to a 5 ms depolarizing pulse (A) or on fast accelerating endocytosis (B; induced by 1 Hz train of 20 ms x 15 pulses) or fast endocytosis (C; evoked by a 10 Hz train of 20 ms x 10 pulses) at PT (37°C) and in 2.0 mM Ca2+ aCSF at the post hearing-calyceal presynaptic terminals (P13-15) in slices. (A) Averaged and superimposed ∆Cm traces in response to a 5 ms pulse. The rightmost bar graph indicates the endocytic decay rate in control (28.8±3.7 fF; n=5), unchanged by ML141 (23.0±5.8 fF; n=6; p=0.44, Student’s t-test) or Lat-B (25.6±5.2 fF; n=6; p=0.65; Supplementary file 1). (B) The average endocytic rate (#12–15) in control (251±28 fF/s; n=6) unaltered by ML141 (214±19 fF/s; n=5; p=0.3, Student’s t-test) or Latrunculin-B (233±48 fF/s; n=4; p=0.7; Supplementary file 1). (C) Fast endocytic decay rate in the presence of ML141 (242±21.5 fF; n=4; p=0.08, t-test) or Lat-B (350±33.3 fF; n=5; p=0.95) was not different from control (346±40.1 fF; n=6; Supplementary file 1). Statistical significance of all data in this figure were tested using one-way ANOVA and Student’s t-test, with Bonferroni-Holm method of p-level correction.
-
Figure 3—source data 1
Scaffold machinery inhibitors have no effect on endocytic membrane retrievals at the calyx of Held.
- https://cdn.elifesciences.org/articles/90497/elife-90497-fig3-data1-v1.xlsx
Figure 4 with 1 supplement
Scaffold machinery inhibitors strongly enhance rapid synaptic depression activity independently, without prolonging the recovery from depression at the calyx.
(A1, B1) EPSCs (30x) evoked at the calyx of Held by afferent fiber stimulation at 10 Hz (A1) or 100 Hz (B1) in the absence (control, black) or presence of ML141 (10–60 min, cyan) or Lat-B (10–60 min, red) at PT and in 1.3 mM Ca2+ aCSF. Panels from left to right: like Figure 2. (A2, B2) The recovery of EPSCs from STD in control, or in the presence of ML141 or Latrunculin-B at the calyx of Held measured at 10 Hz (A2) or 100 Hz (B2) – like Figure 2. (A1) At 10 Hz stimulation, enhancement of depression became significant starting from the 3rd stimulation (200 ms) in the presence of ML141 (0.61±0.03; n=9; p=0.016, One-way ANOVA and Student’s t-test with Bonferroni-Holm p level correction) or Lat-B (0.55±0.04; n=7; p=0.006) compared to control (0.74±0.04; n=11). Bar graph indicates the steady-state depression (STD) strongly enhanced from control (0.55±0.02) by ML141 (0.4±0.02; p<0.001) or Lat-B: (0.36±0.02; p<0.001). (A2) After a train of 30 stimulations at 10 Hz, the time constant of EPSCs recovery under control (2.2±0.4 s; n=9) was unchanged by ML141 (3.0±0.5 s; n=8; p=0.21) or Latrunculin-B (3.4±0.6 s; n=6; p=0.16; Supplementary file 2). (B1) At 100 Hz stimulation, EPSCs showed significant enhancement of depression starting at the 2nd stimulation (10 ms) in the presence of ML141 (0.65±0.05; n=10; p<0.001) or Lat-B (0.58±0.05; n=8; p<0.001) from control (0.91±0.05; n=11). Bar graph indicates strong steady-state STD produced by ML141 (0.22±0.02; p<0.001) or Lat-B (0.18±0.013; p<0.001) compared to control (0.42±0.025). (B2) The time course of EPSC recovery from STD induced by a train of 30 stimulations at 100 Hz, indicating no significant change in recovery from STD time constants caused by ML141 (τfast: 0.13±0.02 s; n=8; p=0.4 and τslow: 2.3±0.3 s; p=0.15) or Lat-B (τfast: 0.072±0.02 s; n=8; p=0.05 and τslow: 2.5±0.4 s; p=0.4) from control (τfast: 0.18±0.05 s; n=8 and τslow: 3.2±0.5 s; Supplementary file 2). One-way ANOVA and Student’s t-test with Bonferroni-Holm p level correction was used to evaluate the statistical significance. The stimulation and recovery protocols were the same as those used in Figure 2.
-
Figure 4—source data 1
Scaffold machinery inhibitors strongly enhance rapid synaptic depression activity independently, without prolonging the recovery from depression at the calyx.
- https://cdn.elifesciences.org/articles/90497/elife-90497-fig4-data1-v1.xlsx
Figure 4—figure supplement 1
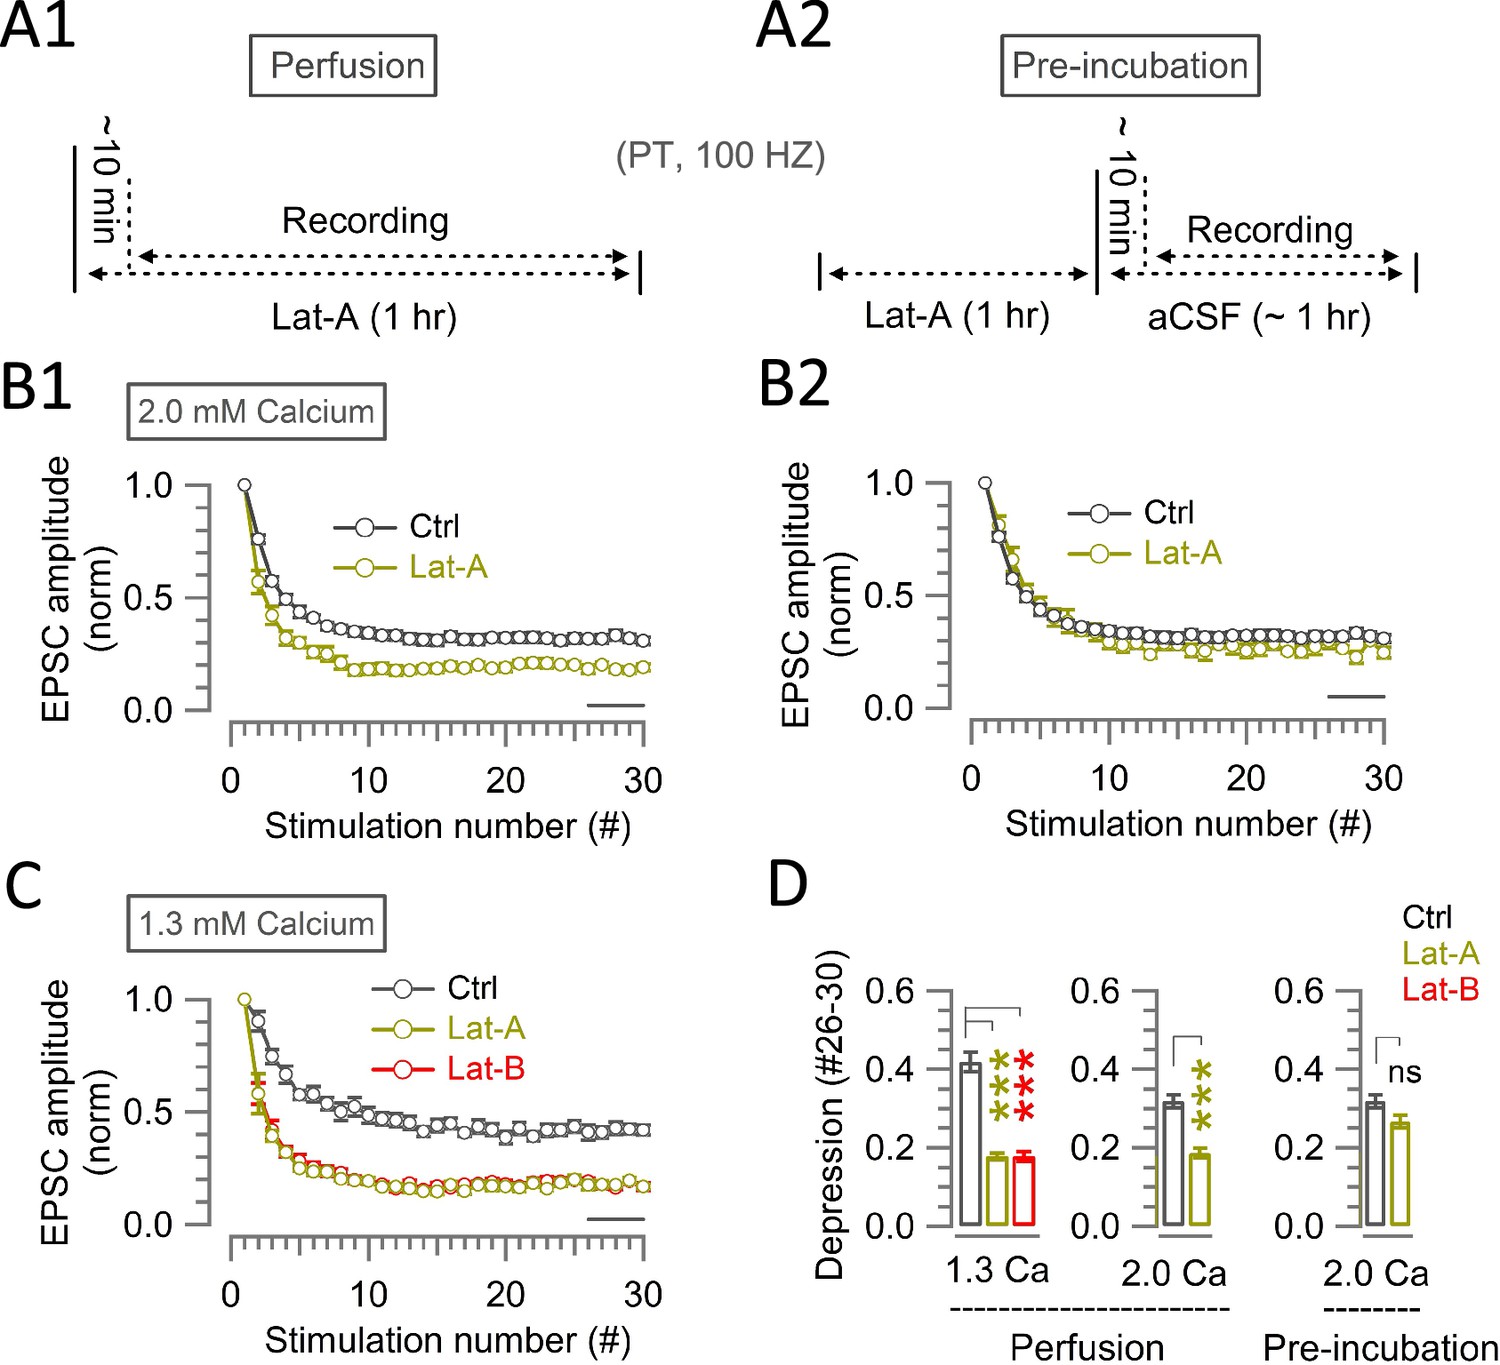
Effects of Latrunculin application protocols and [Ca2+] on STD.
(A) Two types of Latrunculin-A application protocols: perfusion (A1) and pre-incubation (A2). (B) In 2.0 mM [Ca2+], normalized amplitudes of EPSCs (30x at 100 Hz) in the presence (green circles) or absence (control, black circles) of Latrunculin-A (20 µM) under perfusion (B1) or pre-incubation (B2) protocols. (C) In 1.3 mM [Ca2+], normalized amplitudes of EPSCs (30x at 100 Hz) in the presence of Latrunculin-A (20 µM, green) or Latrunculin-B (15 µM, red) applied through perfusion or in their absence (control, black circles). (D) Bar graphs for the magnitude of synaptic depression at #26–30 during 100 Hz stimulation in control (black), Latrunculin A (green) and Latrunculin B (red). Data from perfusion experiments (left and middle panels) and from pre-incubation experiments (right panel) are compared. Left panel, in 1.3 mM [Ca2+]; middle and right panels, in 2.0 mM [Ca2+]. Left panel: in 1.3 mM [Ca2+], perfusion of Lat-A (0.18±0.009; n=5; p<0.001) or Lat-B (0.18±0.013; n=8; p<0.001) equipotently enhanced depression from control (0.42±0.025; n=11). Middle and right panel: in 2.0 mM [Ca2+], perfusion of Lat-A (0.19±0.013; n=5; p<0.001) significantly enhanced depression from control (0.32±0.02; n=16), whereas Lat-A preincubation (0.27±0.018; n=4; p=0.16) was not different from control (0.32±0.02). The magnitude of depression by Latrunculin A in 2.0 mM [Ca2+] was significantly greater in perfusion than preincubation (p=0.008). Statistical significance was evaluated using one-way ANOVA and Student’s t-test, with Bonferroni-Holm method of p level correction.
-
Figure 4—figure supplement 1—source data 1
Effects of Latrunculin application protocols and [Ca2+] on STD.
- https://cdn.elifesciences.org/articles/90497/elife-90497-fig4-figsupp1-data1-v1.xlsx
Figure 5
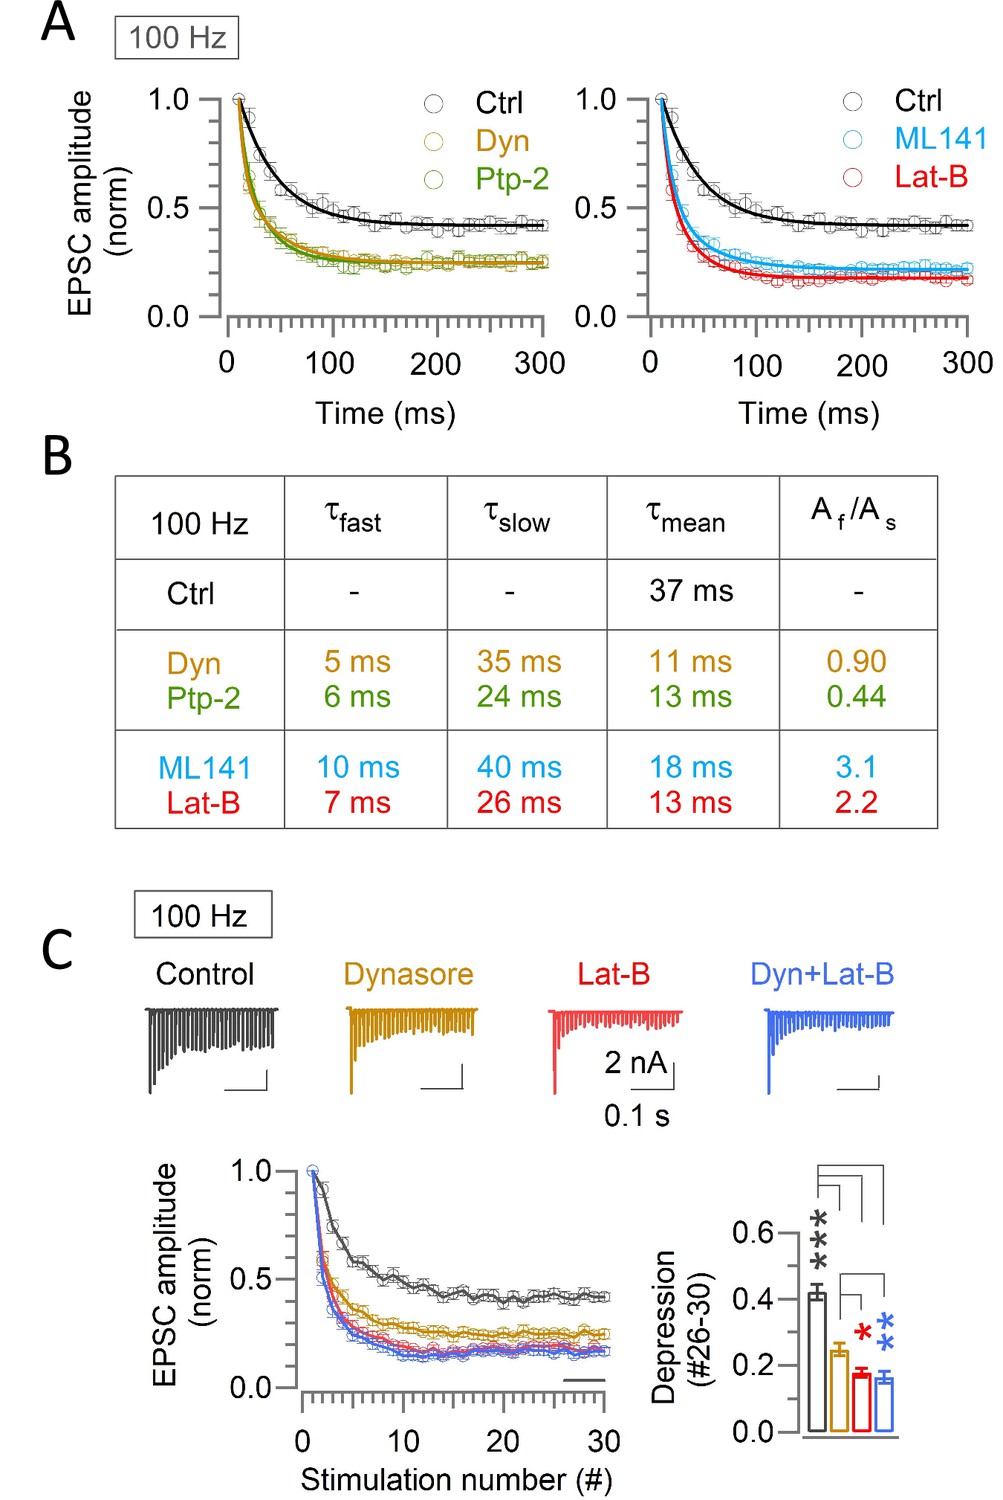
Endocytic and scaffold machineries co-operate for rapid vesicle replenishment during high-frequency transmission at the calyx of Held.
(A) Exponential curve fits to the time-course of synaptic depression during 100 Hz stimulation under control and in the presence of either endocytic blockers or scaffold cascade inhibitors. The control time-course was best fit to a single exponential, whereas the time-course in the presence of endocytic blockers or scaffold cascade inhibitors was fit best to double exponential function with fast and slow time constants. (B) Parameters for the curve-fit, including fast and slow time constants (τfast, τslow), weighted mean time constant (τmean) and relative ratio of fast and slow components (Af/As). Similar fast time constant (τfast) in the presence of either endocytic inhibitors or scaffold cascade inhibitors suggests simultaneous operation of both endocytic and scaffold mechanisms for countering the synaptic depression. Similar slow decay time constant irrespective of the presence or absence of blockers suggests that the endocytosis and scaffold mechanisms for vesicle replenishment operates predominantly at the beginning of the high frequency stimulations. (C) Enhancement of synaptic depression by co-application of Dynasore and Latrunculin-B (10–60 min) was like Latrunculin-B alone and stronger than Dynasore alone. Sample EPSC traces and normalized depression time courses are shown on the upper and lower left panels, respectively. The steady-state STD magnitudes are compared in bar graph; control: (0.42±0.025; n=11), Dynasore: (0.25±0.02; n=10; p<0.001 vs control; p=0.012 vs Lat-B; p=0.005 vs Dyn +Lat B), Latrunculin-B: (0.18±0.013; n=8; p<0.001 vs control; p=0.6 vs Dyn +Lat B), and Dyn +Lat B together: (0.17±0.02; n=11; p<0.001 vs control). Significance of difference was estimated by one-way ANOVA and Student’s t-test, with Bonferroni-Holm method of p level correction.
-
Figure 5—source data 1
Endocytic and scaffold machineries co-operate for rapid vesicle replenishment during high-frequency transmission at the calyx of Held.
- https://cdn.elifesciences.org/articles/90497/elife-90497-fig5-data1-v1.xlsx
Figure 6 with 1 supplement
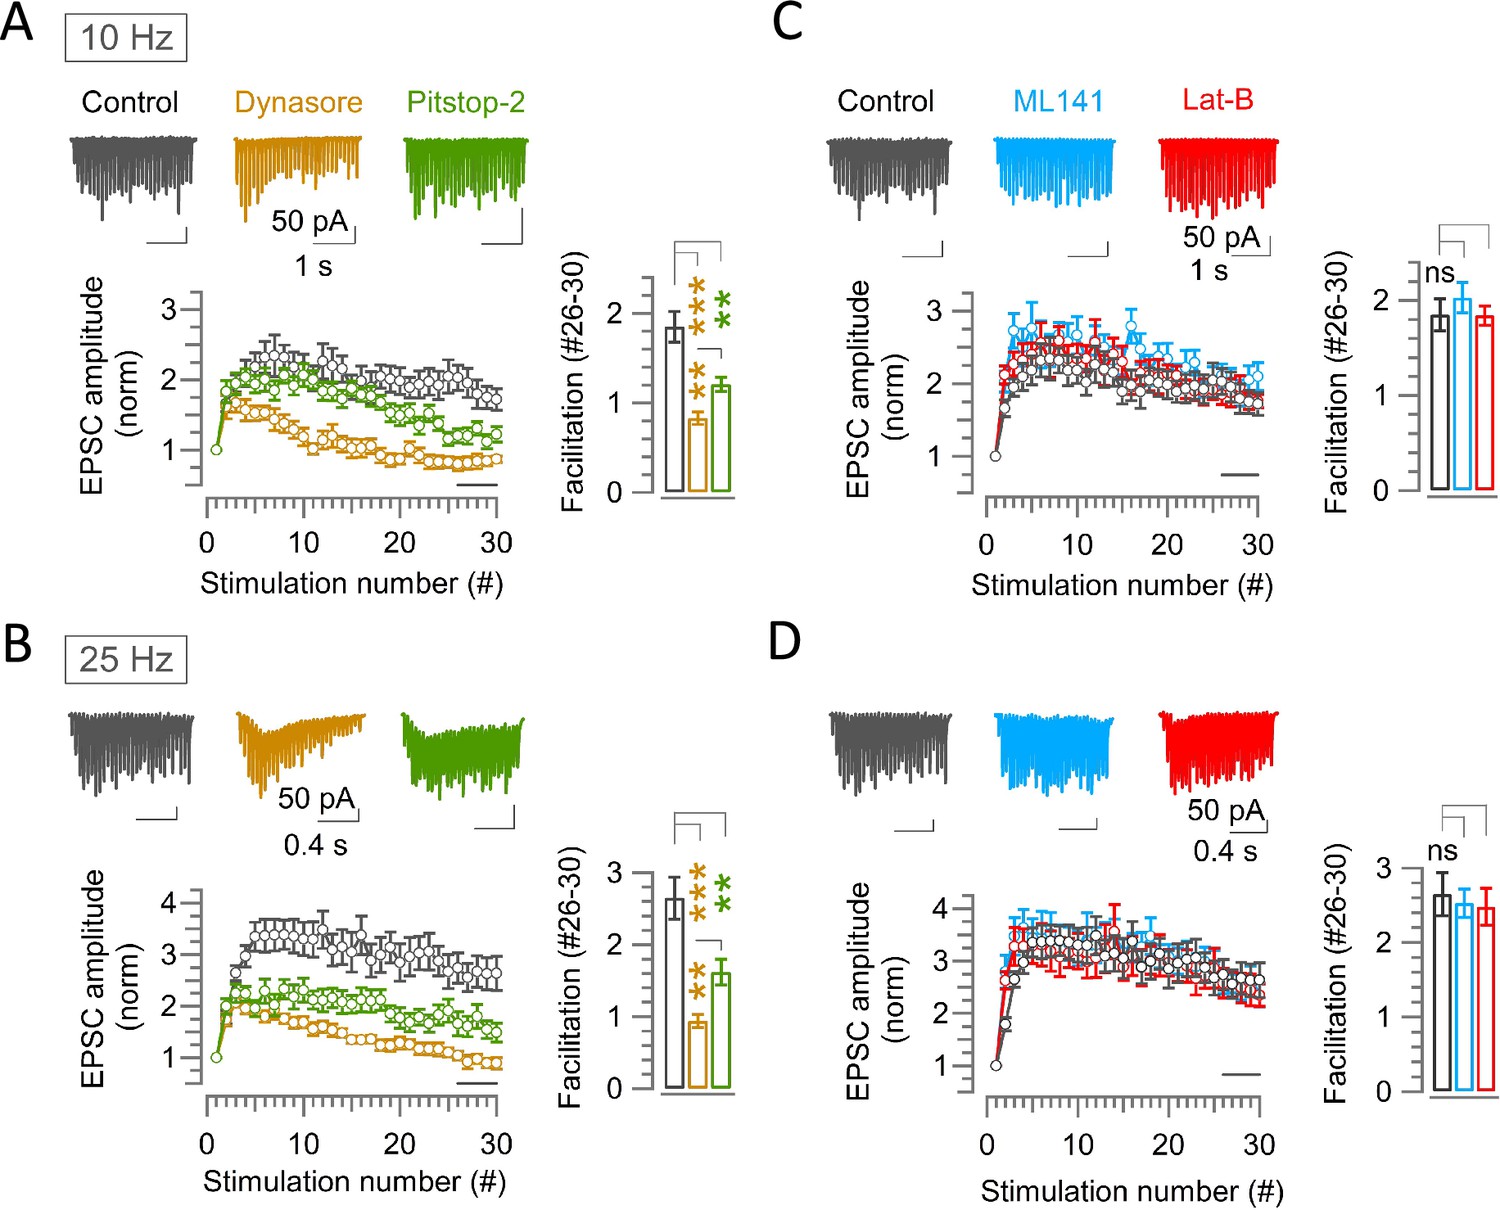
Endocytic blockers attenuate synaptic facilitation activity dependently at hippocampal CA1 synapses, but scaffold cascade inhibitors show no effect.
(A–D) A train of 30 EPSCs recorded from hippocampal CA1 pyramidal cells evoked by Schaffer collaterals stimulations at 10 Hz (A and C) or 25 Hz (B and D) in the absence (control, black) or presence of endocytic blocker Dynasore (100 μM, 10–60 min, brown) or Pitstop-2 (25 μM, 10–60 min, green) (A, B), or scaffold protein inhibitor ML141 (10 µM, 10–60 min, cyan) or Latrunculin-B (15 µM, 10–60 min, red) (C, D) at PT (37°C) and in 1.3 mM Ca2+ aCSF. Top panels show sample EPSC traces. Lower panels show average EPSC amplitudes normalized and plotted against stimulation numbers. Bar graphs show EPSCs amplitudes averaged from #26–30 events. (A) At 10 Hz stimulation, EPSCs in control showed facilitation reaching a peak at the 7th stimulation (2.34±0.3; n=17). Thereafter, it gradually reduced. Dynasore significantly reduced the facilitation immediately before the peak at 6th stimulation (1.53±0.097; n=10; p=0.016) compared to control (2.32±0.22), but not Pitstop-2. Towards the end of stimulus train (#26–30), synaptic facilitation in control (1.85±0.17) was significantly attenuated by Dynasore (0.83±0.07; p<0.001) or Pitstop-2 (1.21±0.08; p=0.003). (B) At 25 Hz stimulation, synaptic facilitation peaked at the 12th stimulation in control (3.5±0.4; n=16), at which the facilitation was significantly attenuated by Dynasore (1.6±0.11; n=11; p<0.001, t-test) or Pitstop-2 (2.11±0.22; n=14; p=0.004). Also, at #26–30, synaptic facilitation in control (2.65±0.3) was strongly attenuated by Dynasore (0.94±0.1; p<0.001) or Pitstop-2 (1.62±0.2; p=0.007). (C) At 10 Hz stimulation, the peak facilitation at the 7th stimulation in control (2.34±0.3; n=17) was not significantly changed by ML141 (2.5±0.22; n=10; p=0.8, Student’s t-test) or Lat-B (2.3±0.23; n=12; p=0.9). Likewise, the facilitation at #26–30 in control (1.85±0.17) was not altered by ML141 (2.03±0.16; p=0.5) or Lat-B (1.84±0.1; p=0.96). (D) At 25 Hz stimulation, peak facilitation at 12th stimulation in control (3.5±0.4; n=16) was unchanged by ML141 (3.3±0.34; n=10; p=0.72, t-test) or Lat-B (3.1±0.4; n=11; p=0.42). Facilitation at #26–30 events in control (2.65±0.3) was also unaltered by ML141 (2.53±0.2; p=0.8) or Lat-B (2.5±0.25; p=0.7). The significance of difference of all data in this figure was estimated by one-way ANOVA and Student’s t-test, with Bonferroni-Holm method of p level correction.
-
Figure 6—source data 1
Endocytic blockers attenuate synaptic facilitation activity dependently at hippocampal CA1 synapses, but scaffold cascade inhibitors show no effect.
- https://cdn.elifesciences.org/articles/90497/elife-90497-fig6-data1-v1.xlsx
Figure 6—figure supplement 1
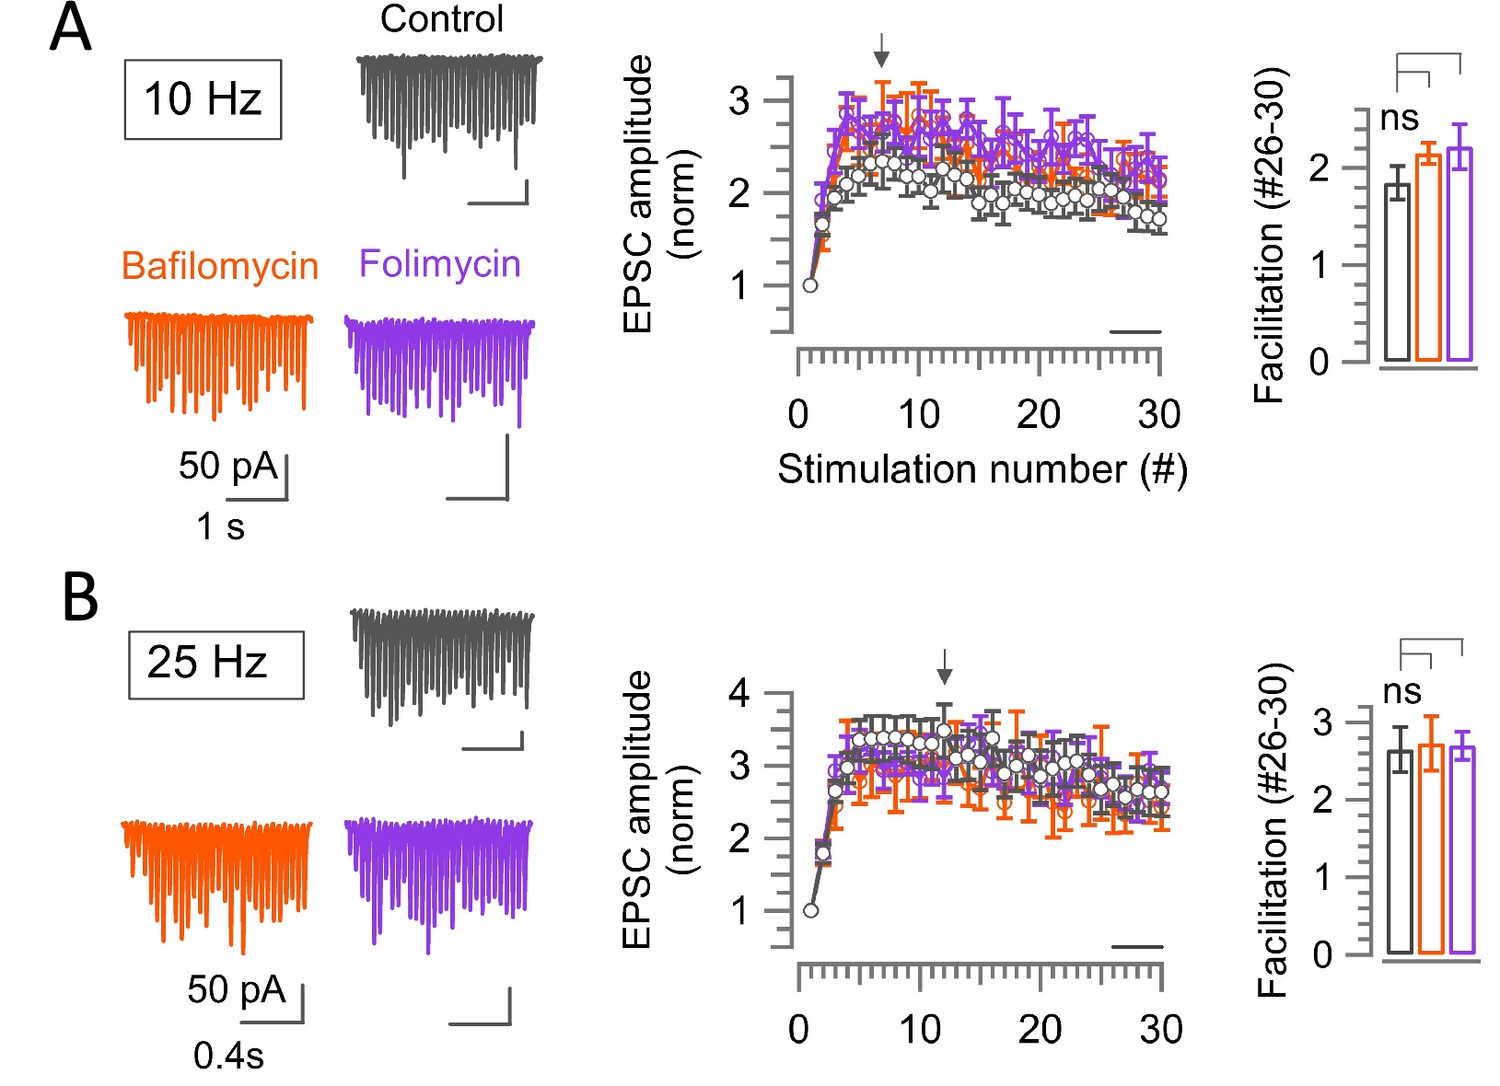
Vacuolar (v-) ATPase blockers, Bafilomycin or Folimycin does not affect the short-term synaptic facilitation at the hippocampal CA1 synapse.
(A, B) EPSCs (30x) evoked in hippocampal CA1 pyramidal cells by Schaffer collateral stimulation at 10 Hz (A) or 25 Hz (B) in the absence (control, black) or presence of v-ATPase blockers Bafilomycin (5 μM, 10–60 min, orange) or Folimycin (67 nM, 10–60 min, violet) at PT (37°C) and in 1.3 mM Ca2+ aCSF. Panels from left to right: sample traces; normalized average EPSCs plotted against stimulation number. The bar graph indicates the magnitude of EPSC facilitation between stimulations #26–30. (A) At 10 Hz stimulation, the magnitude of synaptic facilitation at #26–30 in control (1.85±0.17 n=17) was unaffected by Bafilomycin (2.15±0.11; n=7; p=0.3) or Folimycin (2.2±0.23; n=8; p=0.21). The basal EPSC amplitude was significantly reduced in the presence of Bafilomycin (32.5±6.1 pA; p=0.006) or Folimycin (40.0±8.0 pA; p=0.014) than control (78±9.5 pA). (B) Also at 25 Hz, synaptic facilitation in control (2.65±0.3; n=16) was unchanged by Bafilomycin (2.5±0.25; n=6; p=0.8) or Folimycin (2.7±0.18; n=7; p=0.9). One way ANOVA and Student’s t-test, with Bonferroni-Holm correction was used to evaluate the statistical significance.
-
Figure 6—figure supplement 1—source data 1
Vacuolar (v-) ATPase blockers, Bafilomycin or Folimycin does not affect the short-term synaptic facilitation at the hippocampal CA1 synapse.
- https://cdn.elifesciences.org/articles/90497/elife-90497-fig6-figsupp1-data1-v1.xlsx
Figure 7
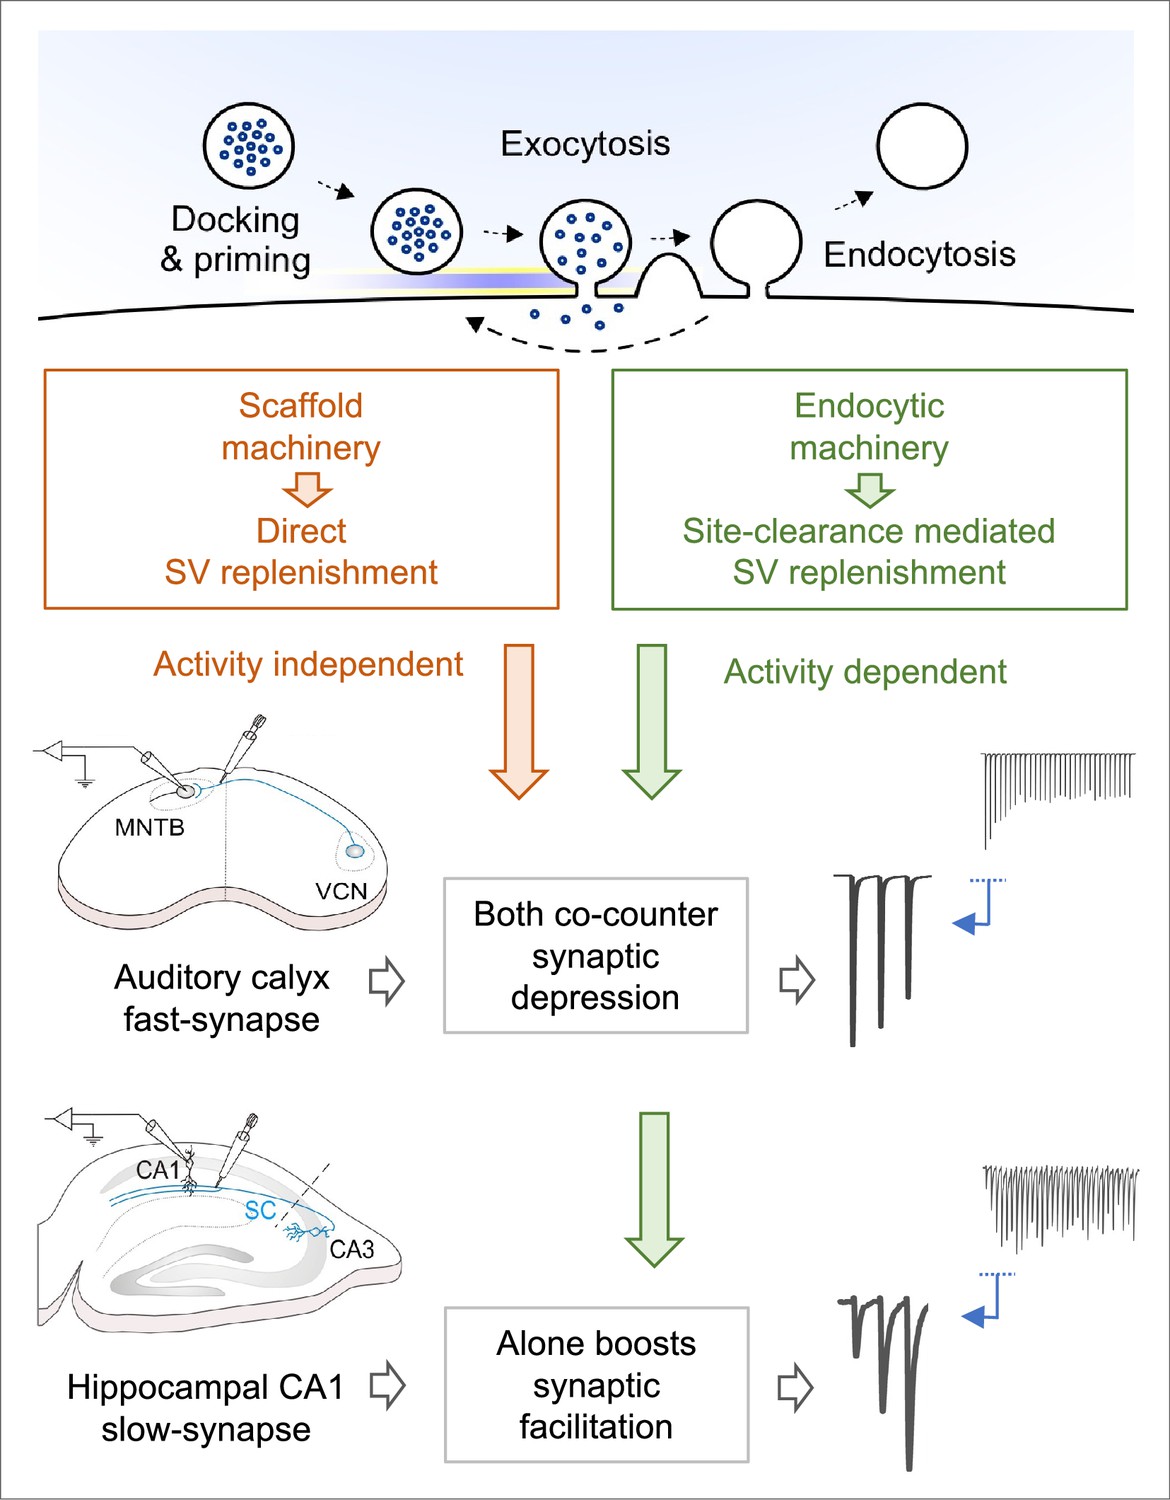
Hypothetical vesicle replenishment scheme by endocytosis and scaffold-machineries during repetitive transmission at fast calyx and slow hippocampal CA1 synapses.
During high-frequency transmission, endocytosis driven site-clearance allows activity-dependent replenishment of new vesicles to release sites. This endocytic function counteracts synaptic depression caused by vesicle depletion, thereby maintain synaptic strength, enabling high-fidelity fast neurotransmission at sensory relay synapses, like at the calyx of Held. This endocytosis driven synaptic strengthening function augments synaptic facilitation at slow-plastic synapses like hippocampal CA1 synapses that exhibit long-term plasticity, thereby boosting its induction capability for memory formation. Whereas, the presynaptic scaffold machinery plays a powerful direct vesicle replenishment role, independent of endocytosis and activity, thereby rapidly translocating new vesicles to open release sites including those just opened by endocytic site-clearance. This scaffold function is specifically devoted to fast synapses, with high release probability but not to slow synapses, where vesicle depletion is minimal due to low release probability.
Tables
Key resources table
| Reagent type (species) or resource | Designation | Source or reference | Identifiers | Additional information |
|---|---|---|---|---|
| Chemical compound, drug | Dynasore | Abcam | Cat# ab120192 | 100 µM |
| Chemical compound, drug | Pitstop-2 | Abcam | Cat# ab120687 | 25 µM |
| Chemical compound, drug | ML141 | Abcam | Cat# ab145603 | 10 µM |
| Chemical compound, drug | Latrunculin A | Labchem -Wako, Fujifilm | 125–04363 | 20 µM |
| Chemical compound, drug | Latrunculin B | Abcam | Cat# ab144291 | 15 µM |
| Chemical compound, drug | Folimycin (or Concanamycin A) | Abcam | Cat# ab144227 | 67 nM |
| Chemical compound, drug | Bafilomycin A1 | Cayman Chemical | Cat# 11038 | 5 µM |
| Peptide, recombinant protein | Dynamin-1 PRD peptide | GenScript | (Custom ordered) | 1 mM Sequence: PQVPSRPNRAP |
| Chemical compound, drug | Strychnine HCl | Sigma-Aldrich | Cat# S8753 | 2 µM |
| Chemical compound, drug | Bicuculline Methiodide | Sigma-Aldrich | Cat# 14343 | 10 µM |
| Chemical compound, drug | D-AP5 | Tocris | Cat# 0106 | 50 µM |
| Chemical compound, drug | QX-314 bromide | Alomone Labs | Cat# Q-100 | 2 mM |
| Chemical compound, drug | DMSO, Sterile Filtered | Santa Cruz Chemicals | Cat# sc-359032 | See in Methods details |
| Other | EPC 10 USB Patch Clamp Amplifier | Heka Elektronik | N/A | See in Method details |
| Other | BX51WI upright microscope | Olympus | Cat# BX51WI | See in Method details |
| Other | VT1200S Vibratome | Leica | N/A | See in Method details |
| Other | Model 2100 Isolated Pulse Stimulator | A-M Systems | N/A | See in Method details |
| Other | TC-344C Dual Channel Temp Controller | Warner Instruments | TC-344C | See in Method details |
| Other | PatchStar Micromanipulator | Scientifica | PatchStar | For precise movement and positioning of recording probe and stimulation electrode |
| Other | Axiocam 506 mono camera system | Zeiss | Axiocam 506 mono | Visualization system for slice recording |
| Other | PIP 6 pipette puller | HEKA | PIP 6 | See in Method details |
| Other | Borosilicate glass capillary | King Precision Glass Inc. | N/A | (2.0 mm OD) |
| Software, algorithm | Patchmaster | HEKA | N/A | |
| Software, algorithm | ZEN 2 Lite | Zeiss | N/A | |
| Software, algorithm | IGOR Pro | Wavemetrics | N/A | |
| Software, algorithm | Microsoft Excel | Microsoft | N/A | |
| Software, algorithm | Corel Draw | Corel Corporation | N/A |
Additional files
-
Supplementary file 1
Membrane capacitance and calcium current amplitudes with or without endocytic blockers or presynaptic scaffold inhibitors during slow, fast-accelerating, or fast endocytosis.
- https://cdn.elifesciences.org/articles/90497/elife-90497-supp1-v1.docx
-
Supplementary file 2
Parameters of recovery from STD at 37°C and 1.3 mM Ca2+ with or without endocytic- or presynaptic scaffold-blockers.
- https://cdn.elifesciences.org/articles/90497/elife-90497-supp2-v1.docx
-
MDAR checklist
- https://cdn.elifesciences.org/articles/90497/elife-90497-mdarchecklist1-v1.docx
Download links
A two-part list of links to download the article, or parts of the article, in various formats.
Downloads (link to download the article as PDF)
Open citations (links to open the citations from this article in various online reference manager services)
Cite this article (links to download the citations from this article in formats compatible with various reference manager tools)
Physiological roles of endocytosis and presynaptic scaffold in vesicle replenishment at fast and slow central synapses
eLife 12:RP90497.
https://doi.org/10.7554/eLife.90497.4


