Intrinsic and extrinsic cues time somite progenitor contribution to the vertebrate primary body axis
- Department of Genetics, University of Cambridge, United Kingdom
- Department of Molecular and Cell Biology, University of California, Berkeley, United States
Figures
Figure 1 with 1 supplement
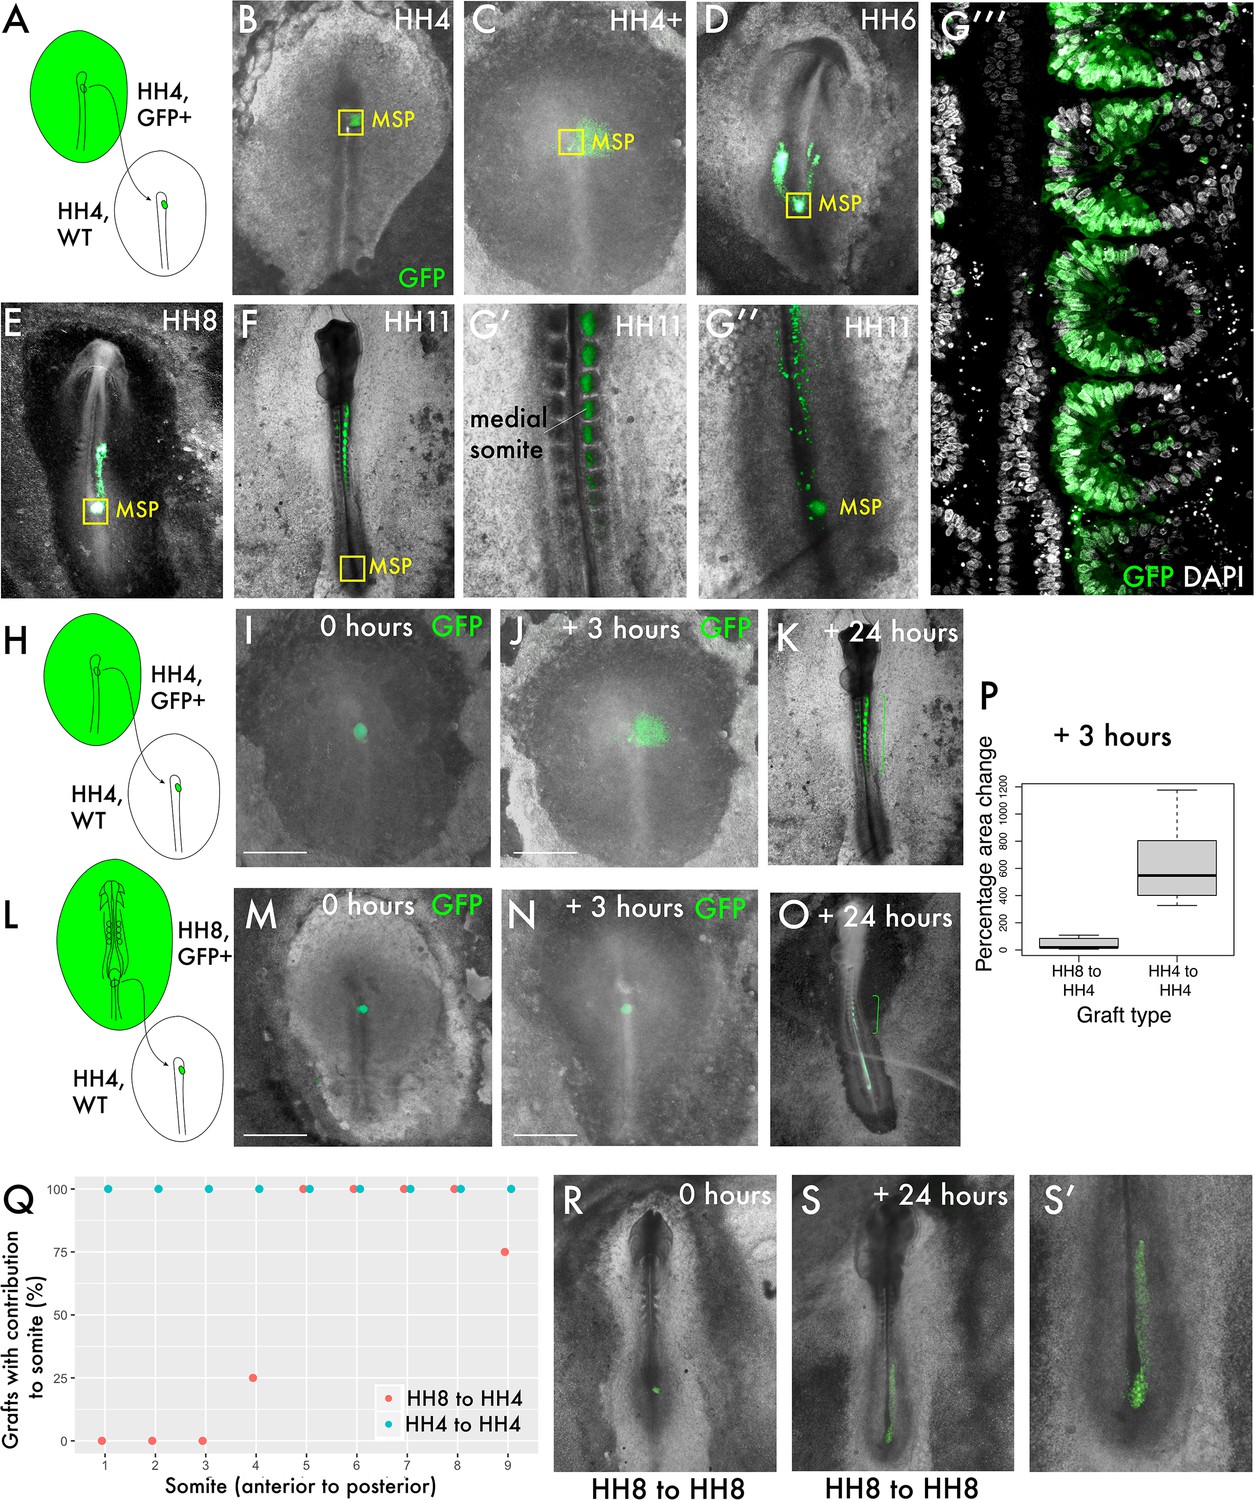
Delayed contribution of heterochronic grafts is characterised by a lack of dispersion of cells from the primitive streak (PS).
(A) Homochronic grafts of the 90% PS region were performed from GFP-expressing HH4 embryos to wild-type HH4 embryos. (B–-G’’) Combined GFP/brightfield images of grafts at various times between 0 and 24 hr after grafting reveal the behaviours of this population during body axis development. As the node regresses posteriorly after HH5, a subpopulation of the medial somite progenitor (MSP) region remains associated closely with the morphological remnant of the node (yellow box ‘MSP’), whilst other cells clearly part from this population and move towards the anterior of the embryo, where the somites will form. At 24 hr post-graft, embryos are approximately HH10-11 and GFP cells are clearly located in the medial portion of the somites (G’), close to the midline. At this timepoint, a population of GFP+ cells remain at the posterior progenitor region of the embryo (the tailbud) (G’’). (G’’’) is a single-slice confocal image of the graft in (G’, G’’) stained with DAPI showing the precise localisation of grafted cells (GFP) in the medial portion of the somite. (H) and (L) are schematic representations of the two graft types, showing homochronic HH4-HH4 and heterochronic HH8-HH4 grafts, respectively. (I) and (M) show overlaid GFP/brightfield images of homochronic (HH4-HH4) and heterochronic (HH8-HH4) grafts at 0 hr after grafting. (J) and (N) show the same grafts at 3 hr, when the homochronic graft has spread substantially from the initial graft site but the heterochronic graft appears very similar to the 0 hr image. (K) and (O) are combined GFP/brightfield images of homochronic and heterochronic grafts, respectively, at 24 hr after grafting. The green brackets in (O) and (P) indicate the somite contribution of the two grafts. (P) Quantification of the change in area of GFP-positive grafted tissue in homochronic and heterochronic grafts at 3 hr vs. 0 hr post-graft, represented as a boxplot. N = 6 for homochronic grafts and n = 5 for heterochronic grafts. (Q) is a scatterplot showing the somite contribution of HH4-HH4 and HH8-HH4 grafts, with the percentage of grafts that have cells in each somite plotted against somite number. The different colours of datapoint represent the type of graft (homochronic or heterochronic). N = 8 for homochronic grafts and n = 4 for heterochronic grafts. (R–S) Combined GFP/brightfield images of HH8-to-HH8 grafts at 0 and 24 hr after grafting, respectively. Scale bars in (I), (J), (M), and (N) represent 1 mm.
Figure 1—figure supplement 1
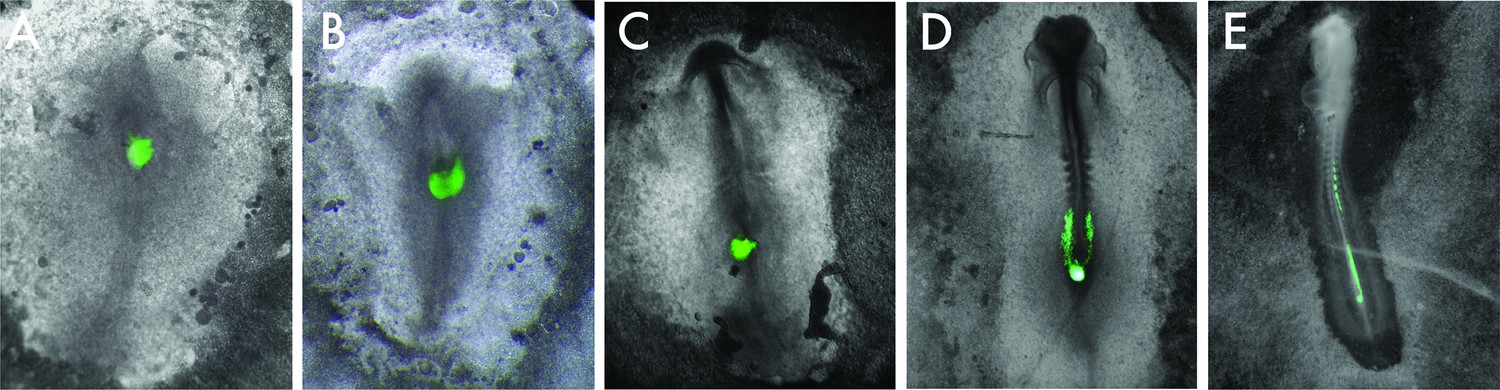
HH8 to HH4 graft time series.
Representative composite brightfield/GFP images of HH8 to HH4 grafts at (A) 0 hr, (B) 3 hr, (C) 6 hr, (D) 12 hr, and (E) 24 hr. Please note that different embryos are shown in each image.
Figure 2 with 2 supplements
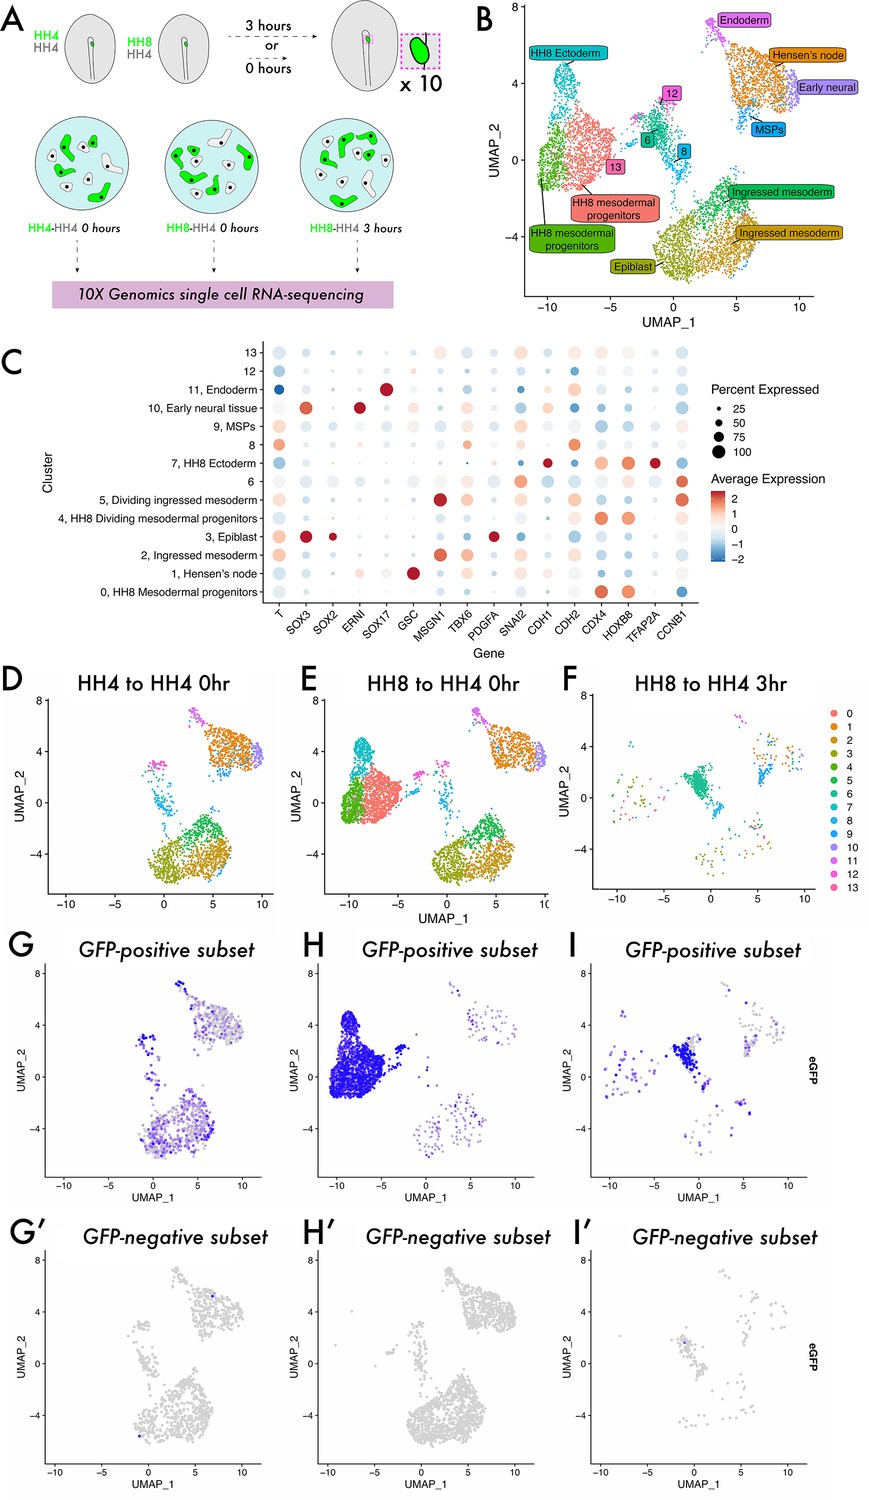
Single-cell analysis reveals a previously undescribed cell state within which heterochronic grafted cells are stalled.
(A) Schematic representing single-cell RNA-sequencing experimental design. Grafts were performed from a GFP-expressing donor embryo to a wild-type host embryo and the region containing fluorescent tissue was dissected either 0 or 3 hr after grafting. Ten grafts were pooled for each condition and subjected to dissociation and single-cell RNA-sequencing. (B) UMAP plot showing cells from all three datasets clustered according to gene expression differences. The colour of each point on the plot represents the cluster to which it has been assigned, and labels denote cluster identities assigned according to the expression of previously described ‘marker’ genes. Note that clusters 6, 8, 12, and 13 were unable to be assigned a specific cell state identity based on described gene expression. (C) Dotplot showing the expression of genes in each cluster of the combined dataset. The appearance of each dot is a composite of the percentage of cells in that cluster with positive expression of the gene (size of dot) and the average quantitative level of gene expression (colour of dot) – see key on the far right of the plot. (D–F) UMAP plots of each sample, with the colour of each spot (cell) representing the cluster to which it has been assigned. (G–I) UMAP plots of each sample, with the colour of each spot (cell) representing the expression level of eGFP; more purple spots represent higher expression values. Cells with expression values >0.001 can be identified as donor cells deriving from the GFP-expressing transgenic embryo and are shown in (G–I). Cells with expression values <0.001 are identified as host cells and are shown in (G’–I’).
Figure 2—figure supplement 1
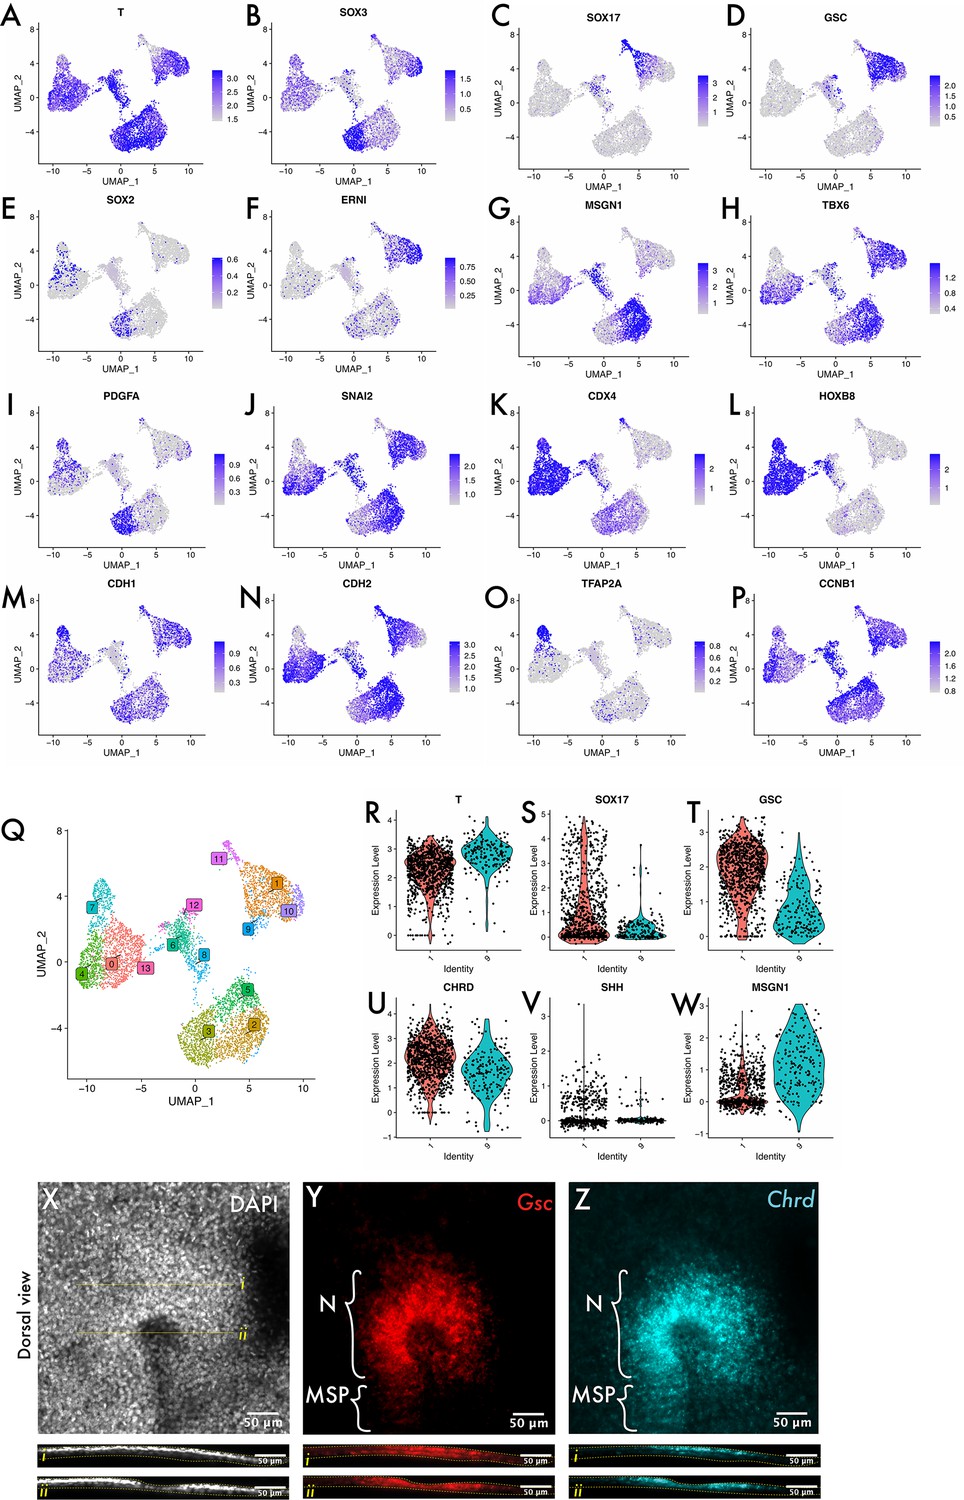
scRNA-seq annotation supporting data.
(A–P) are full dataset feature plots generated in Seurat, where the colour of each dot (cell) denotes the expression level of a single gene. (A) Brachyury (Bra or T) is a pan-mesodermal marker, (B) Sox3 is expressed in the epiblast from HH2, (C) SRY-Box 17 (Sox17) is an endodermal marker, (D) Goosecoid (Gsc) is expressed by Hensen’s node, (E) Sox2 is a neural marker expressed in the epiblast around the primitive streak, (F) ERNI is another early neural marker expressed in the epiblast and forming neural plate. (G), and (H) mesogenin-1 (Msgn1) and Tbx6 are paraxial mesoderm markers, with Tbx6 expressed in streak cells, whereas Msgn1 is expressed only upon ingression. (I) PDGFA is expressed throughout the epiblast. (J) Snail2 (Snai2) is a master regulator of EMT expressed in cells of the primitive streak undergoing EMT. (K) Caudal-type homeobox 4 (Cdx4) is a posterior homeobox gene expressed in the posterior portion of the embryo at HH4 (i.e. spatially distinct from the MSP region) and at HH8 (encompassing the MSP region at HH8). (L) HoxB8 is expressed in the posterior progenitor region and presomitic mesoderm at HH8 but not expressed at HH4. (M) E-cadherin (Cdh1) is expressed by cells of epithelia including the epiblast, whereas (N) N-cadherin (Cdh2) is expressed by mesenchymal tissue including ingressing/ingressed mesoderm and endoderm of the primitive streak and mesendoderm. (O) Transcription factor AP-2 alpha (TFAP2A) is expressed in the neural plate border (i.e. close to the primitive streak at HH8 but spatially distinct at HH4). (P) Cyclin B1 (CCNB1) is a cell cycle regulator that is active in cells in G2/M phase and so its active transcription is indicative of a cell in G2 (i.e. that is actively cycling). Many populations in the dataset comprise both a CCNB1-positive and CCNB1-negative compartment, for example, cluster 5 vs cluster 2. Expression patterns were accessed using GEISHA (Bell et al., 2004; Darnell et al., 2007) and include both data generated as part of the database as well as published papers (Alev et al., 2010; Barak et al., 2012; Dady et al., 2012; review by Fung and Poon, 2005; Joshi et al., 2019; Khudyakov and Bronner-Fraser, 2009). (Q) UMAP plot showing all cells across the three datasets with labelled clusters. Note the overlap between clusters 1 and 9 on the top-right corner of the plot. (R–W) are violin plots showing the expression of T, Sox17, Goosecoid, Chordin, Sonic Hedgehog (Shh), and mesogenin-1 in clusters 1 and 9. Note cluster 1 contains cells expressing both mesodermal and endodermal markers, whereas cluster 9 contains mesodermal cells only, whilst both have cells with expression of the node markers Gsc, Chrd, and Shh. There is higher expression of these markers in cluster 1 than cluster 9. We infer from these data that cluster 1 represents Hensen’s node whilst cluster 9 represents the medial somite progenitors (MSPs) that form the focus of this study. This is consistent with the published fate map of Hensen’s node where the node contains a mixture of mesodermal and endodermal progenitors at HH3 that are largely depleted by HH4, whereas the more posterior portions of the streak contribute mesoderm only (Psychoyos and Stern, 1996; Selleck and Stern, 1991). Note that expression of ‘node’ markers including Gsc and Chordin extends into the MSP region, as shown in the hybridisation chain reactions (HCRs) in (X–Z). The images in (X–Z) are maximum intensity confocal Z-projections of a single HH4 embryo stained for Chordin and Goosecoid and imaged at 20×.
Figure 2—figure supplement 2
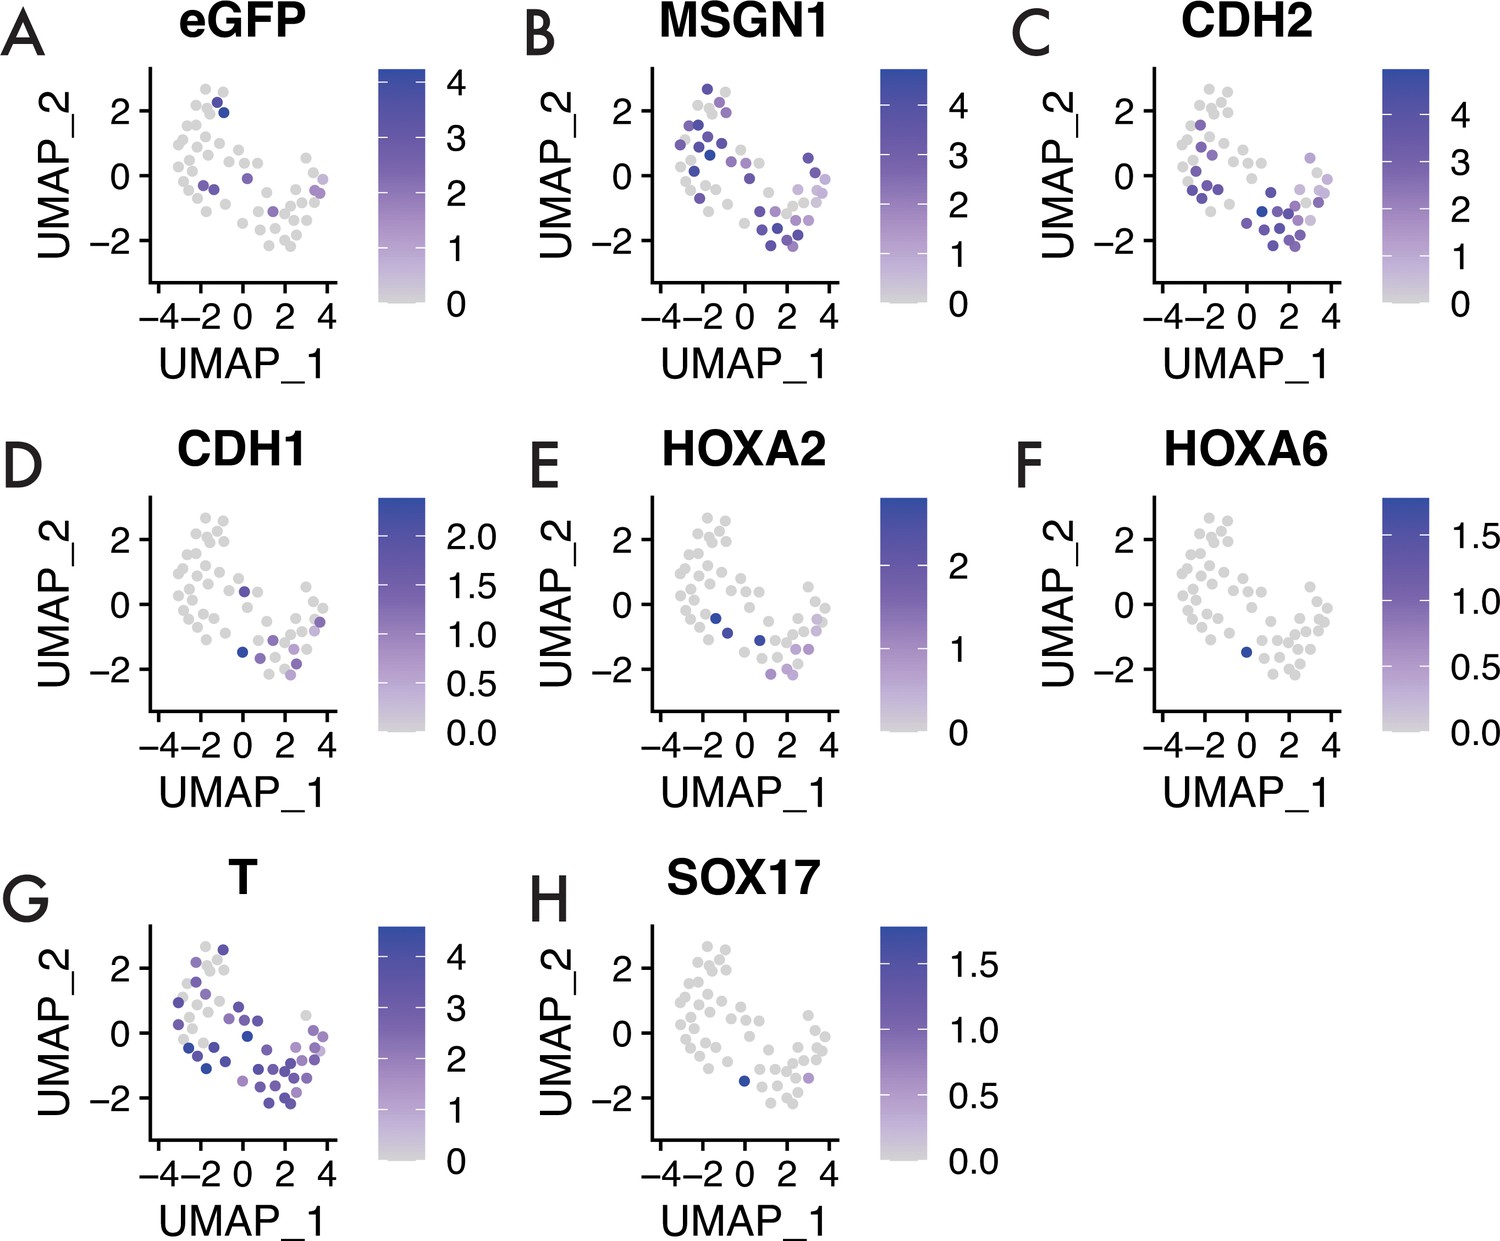
HH4 to HH4 3 hr sample.
Feature plots showing expression of key genes in the HH4 to HH4 3 hr sample. (A) eGFP expression, (B) mesogenin-1 (Msgn1) expression, (C) cadherin-2 (Cdh2) expression, (D) cadherin-1 (Cdh1) expression, (E) Hoxa2 expression, (F) Hoxa6 expression, (G) Brachyury (T) expression, and (H) Sox17 expression. Note the intermixing of GFP-positive and GFP-negative cells in the dataset.
Figure 3 with 1 supplement
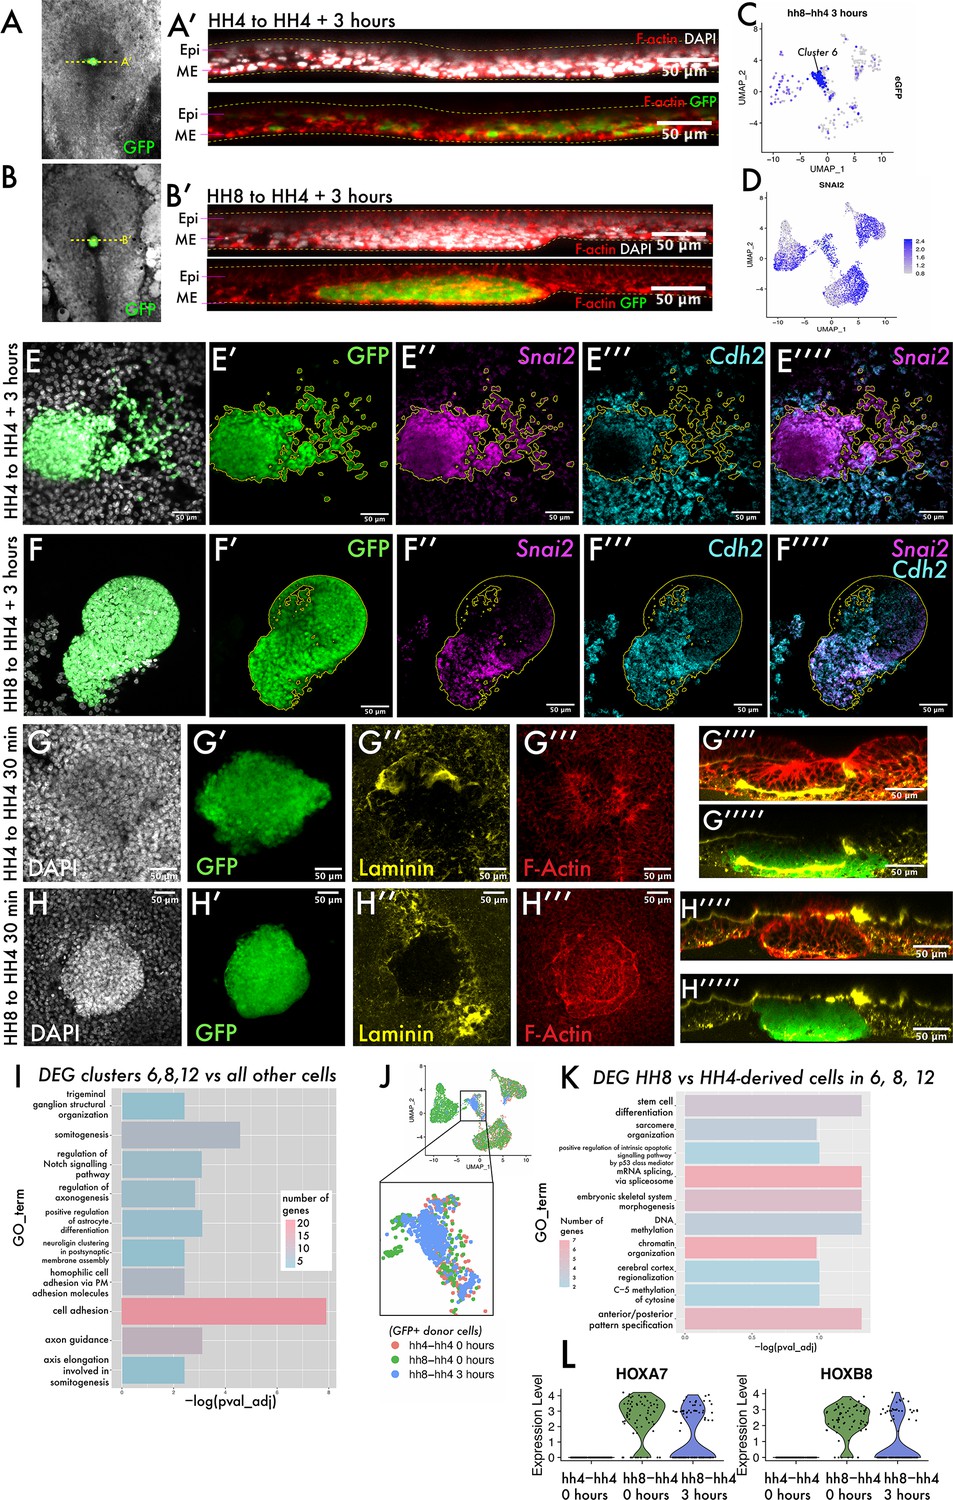
The transition from ingressed mesoderm to individual dispersed cells is an important step in gastrulation, associated with changes in cell adhesion.
(A–B) Composite GFP/brightfield images of HH4-HH4 and HH8-HH4 grafts at 3 hr. Dotted yellow lines represent the plane of section shown in (A’) and (B’), respectively. (A’) and (B’) are summed slice projections (~10 μm) re-sliced Z-stacks of the grafts in (A) and (B), respectively, fixed and stained with phalloidin (red) and DAPI (white). Images in (A’) and (B’) are oriented with dorsal at the top and ventral at the bottom. (C) UMAP plot for HH8-HH4 sample showing eGFP expression. (D) UMAP plot of the full combined dataset showing Snail2 (Snai2) expression. (E) and (F) Summed slice Z-projections of HH4-HH4 and HH8-HH4 grafts stained by multiplexed hybridisation chain reaction (HCR) for the EMT markers Snai2 and N-cadherin (Cdh2). Yellow outlines in panels (E) and (F) outline the location of GFP donor-positive tissue. (G) and (H) Summed slice Z-projections of HH4-HH4 and HH8-HH4 grafts, respectively, at 30 min after grafting stained for DAPI, laminin, and actin. (I) Gene Ontology (GO) term analysis of genes differentially expressed in cluster 6 of the dataset represented here as a bar chart where the negative log of the adjusted p-value for each GO term is plotted. The colour of the bar represents the number of genes annotated with that GO term. (J) Schematic showing the cells utilised to look for differential expression between HH8 and HH4-derived cells in the central populations (clusters 6, 8, and 12). (K) Bar chart showing key GO terms enriched amongst genes differentially expressed between HH8 and HH4 cells in clusters 6, 8, and 12. (L) Violin plots showing the expression of the genes Hoxa7 and Hoxb8 in these cells by sample (note that only donor GFP+ cells are included in this plot). Scale bars in (A’), (B’), and (E–H) represent 50 μm. Epi: epiblast; ME: mesendoderm.
Figure 3—figure supplement 1
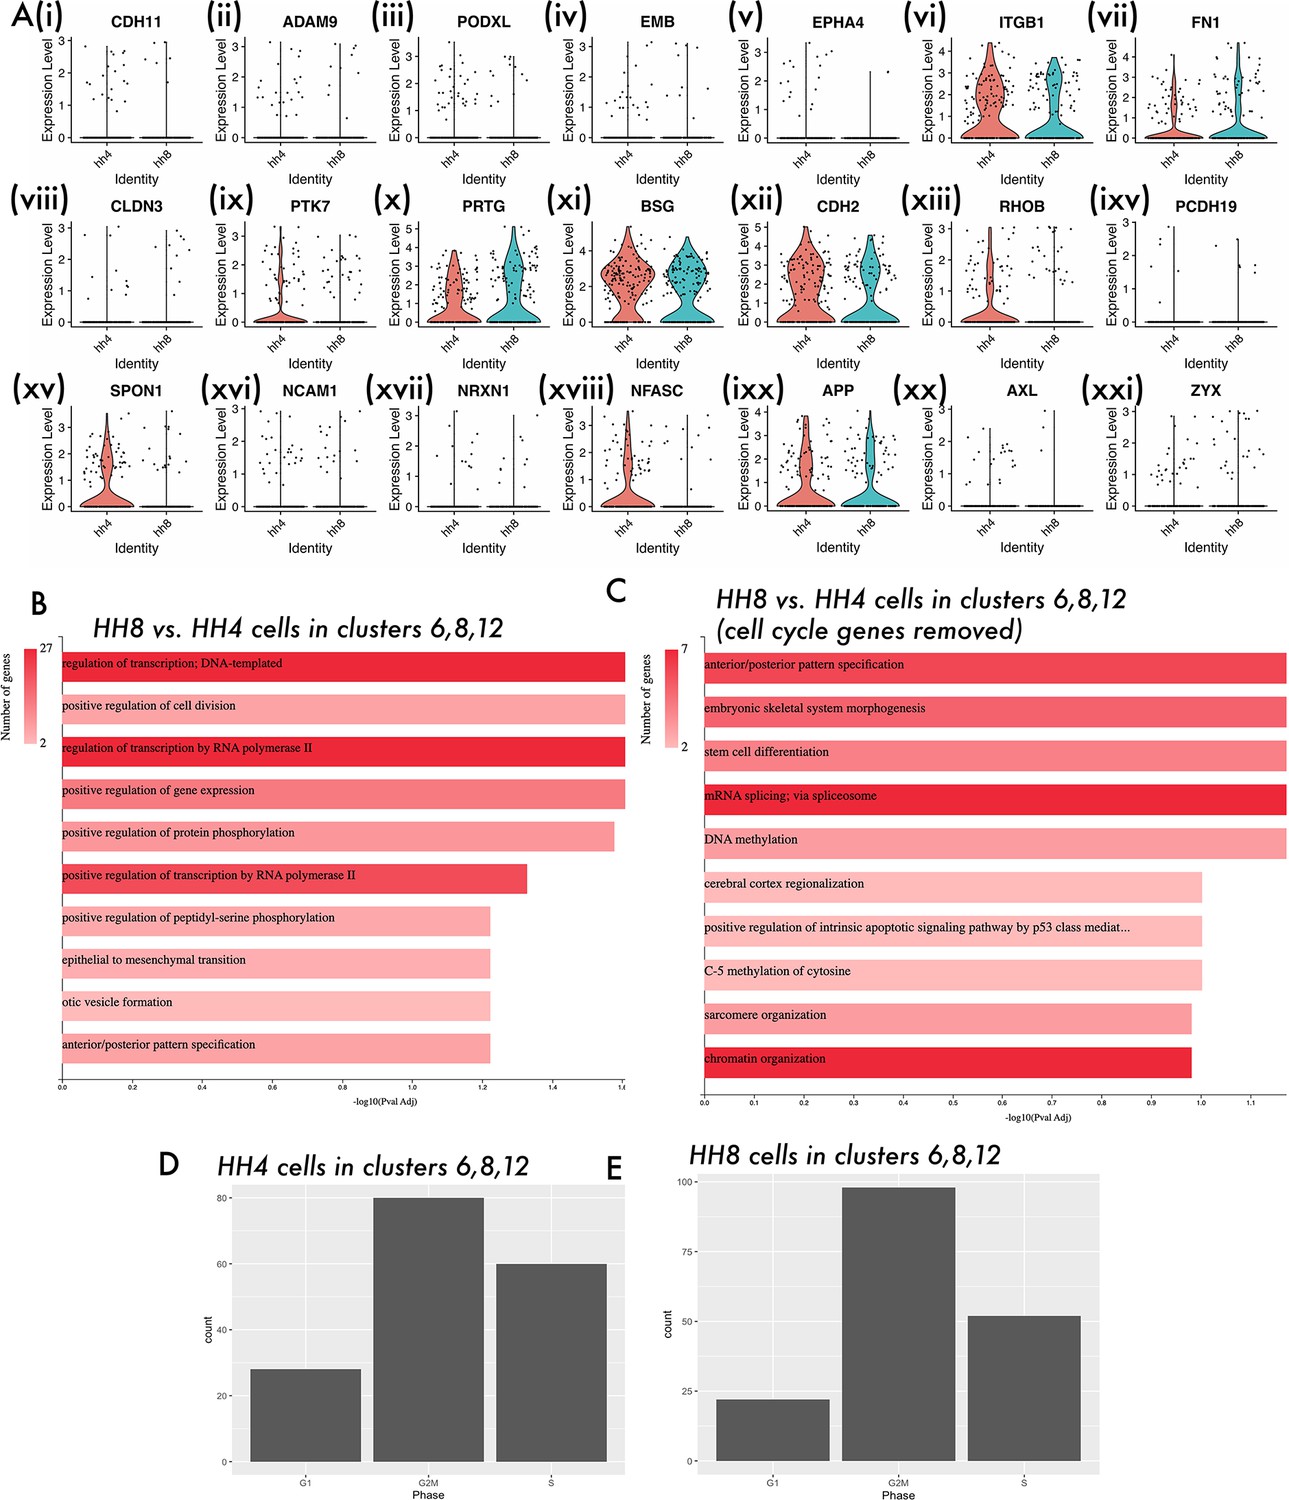
Supporting data for single-cell analysis of stage differences.
(A) Violin plots showing the expression of genes annotated with the ‘Cell adhesion’ GO term in HH4- and HH8-derived cells of clusters 6, 8, and 12. (B) Bar chart showing key GO terms for genes differentially expressed between HH8 and HH4 cells in clusters 6, 8, and 12. (C) Bar chart showing key GO terms for genes differentially expressed between HH8 and HH4 cells in clusters 6, 8, and 12, after regressing out cell cycle-related genes. (D, E) Bar charts showing the predicted cell cycle phase of HH4 and HH8-derived cells in clusters 6, 8, and 12 based on gene expression.
Figure 4 with 1 supplement
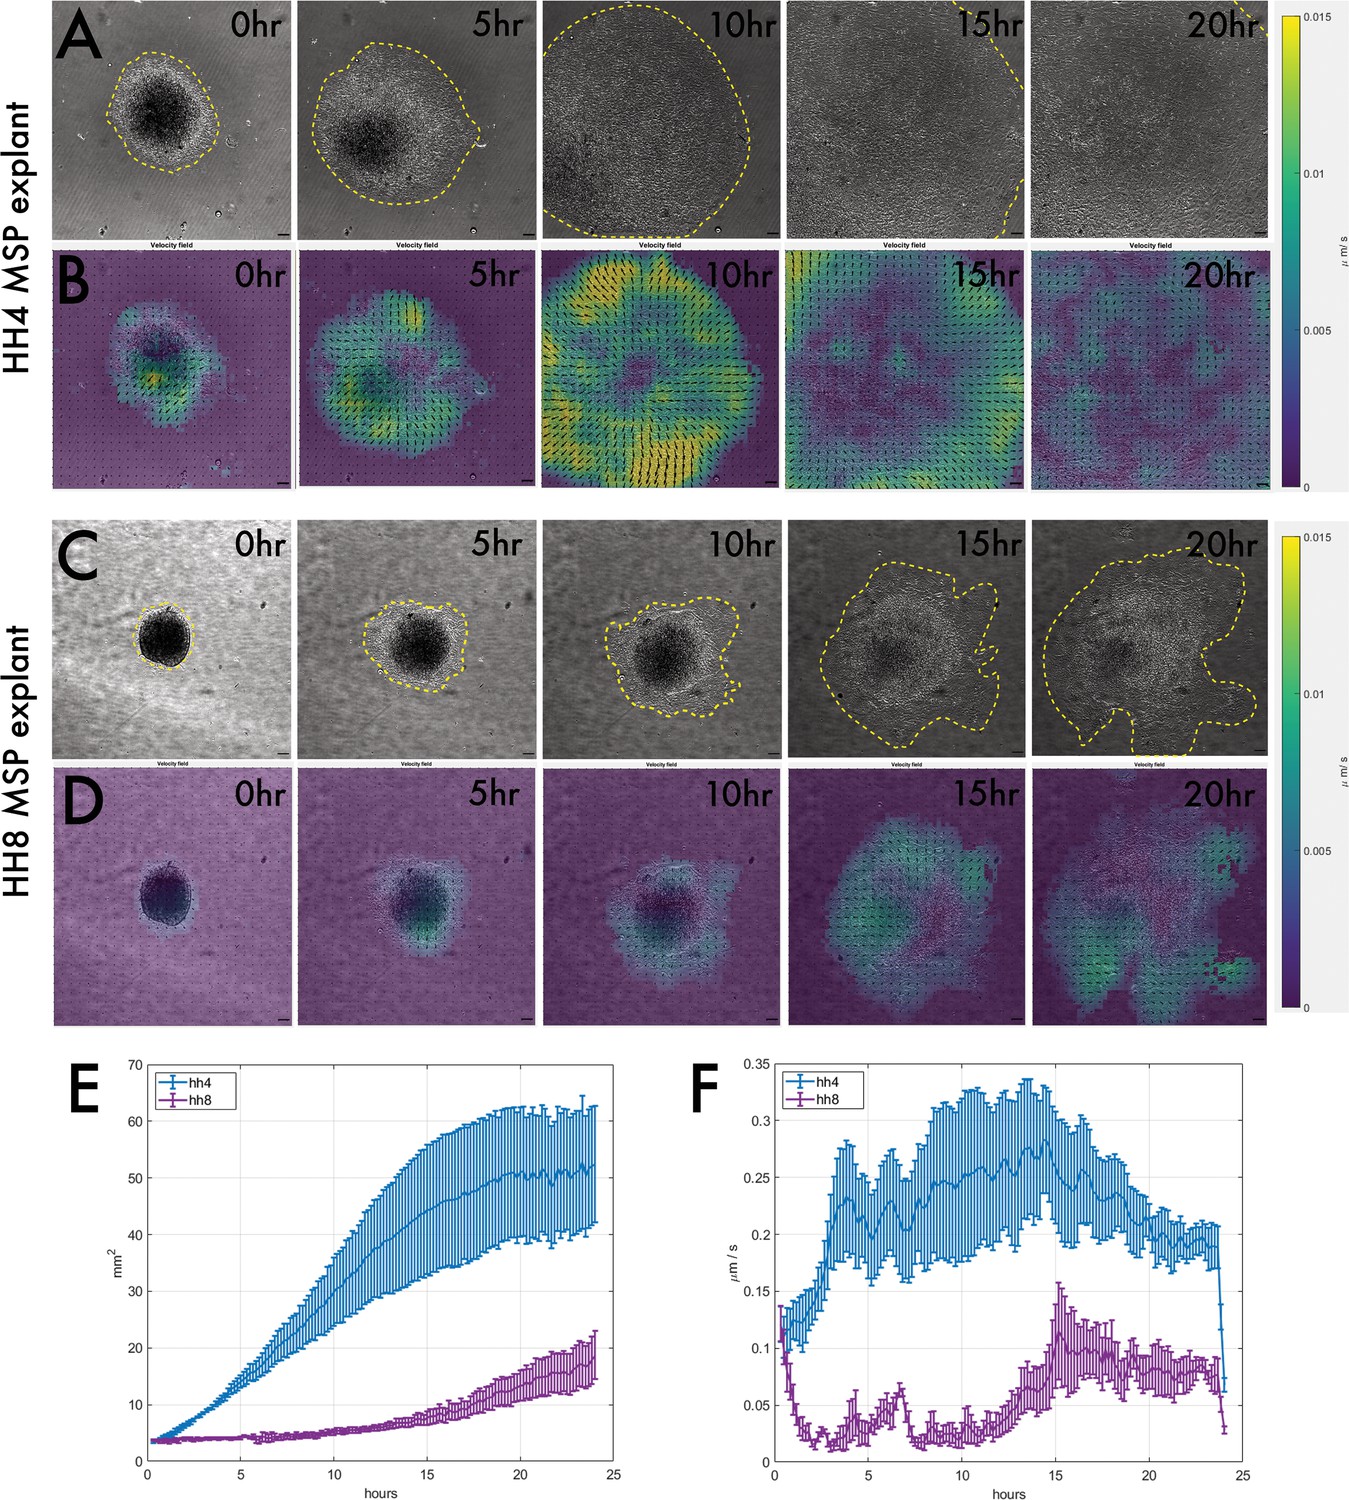
Explanting medial somite progenitor (MSP) tissue on fibronectin reveals that HH4 and HH8 MSP tissue intrinsically migrate with different dynamics.
(A) and (C) are brightfield stills taken from timelapse movies of MSP tissue migrating on fibronectin, with (A) showing an HH4 explant and (C) showing an HH8 explant. Yellow dotted outlines delineate the edge of the migrating explant sheet. (B) and (D) are velocity field stills for the corresponding images in (A) and (C), respectively, calculated using particle image velocimetry (PIV). The colour of each interrogation window denotes the velocity of movement (scale on right) between the current time step and the previous one, and the directionality of each vector arrow similarly represents the direction of tissue flow. (E) Plot showing the mean area for several explants of each class (n = 5 for HH4 and n = 3 for HH8). (F) Plot showing the mean velocity at each timepoint for several explants of each class (n = 5 for HH4 and n = 3 for HH8). In (E) and (F), error bars represent the standard error. Scale bars in (A–D) represent 50 μm.
Figure 4—figure supplement 1
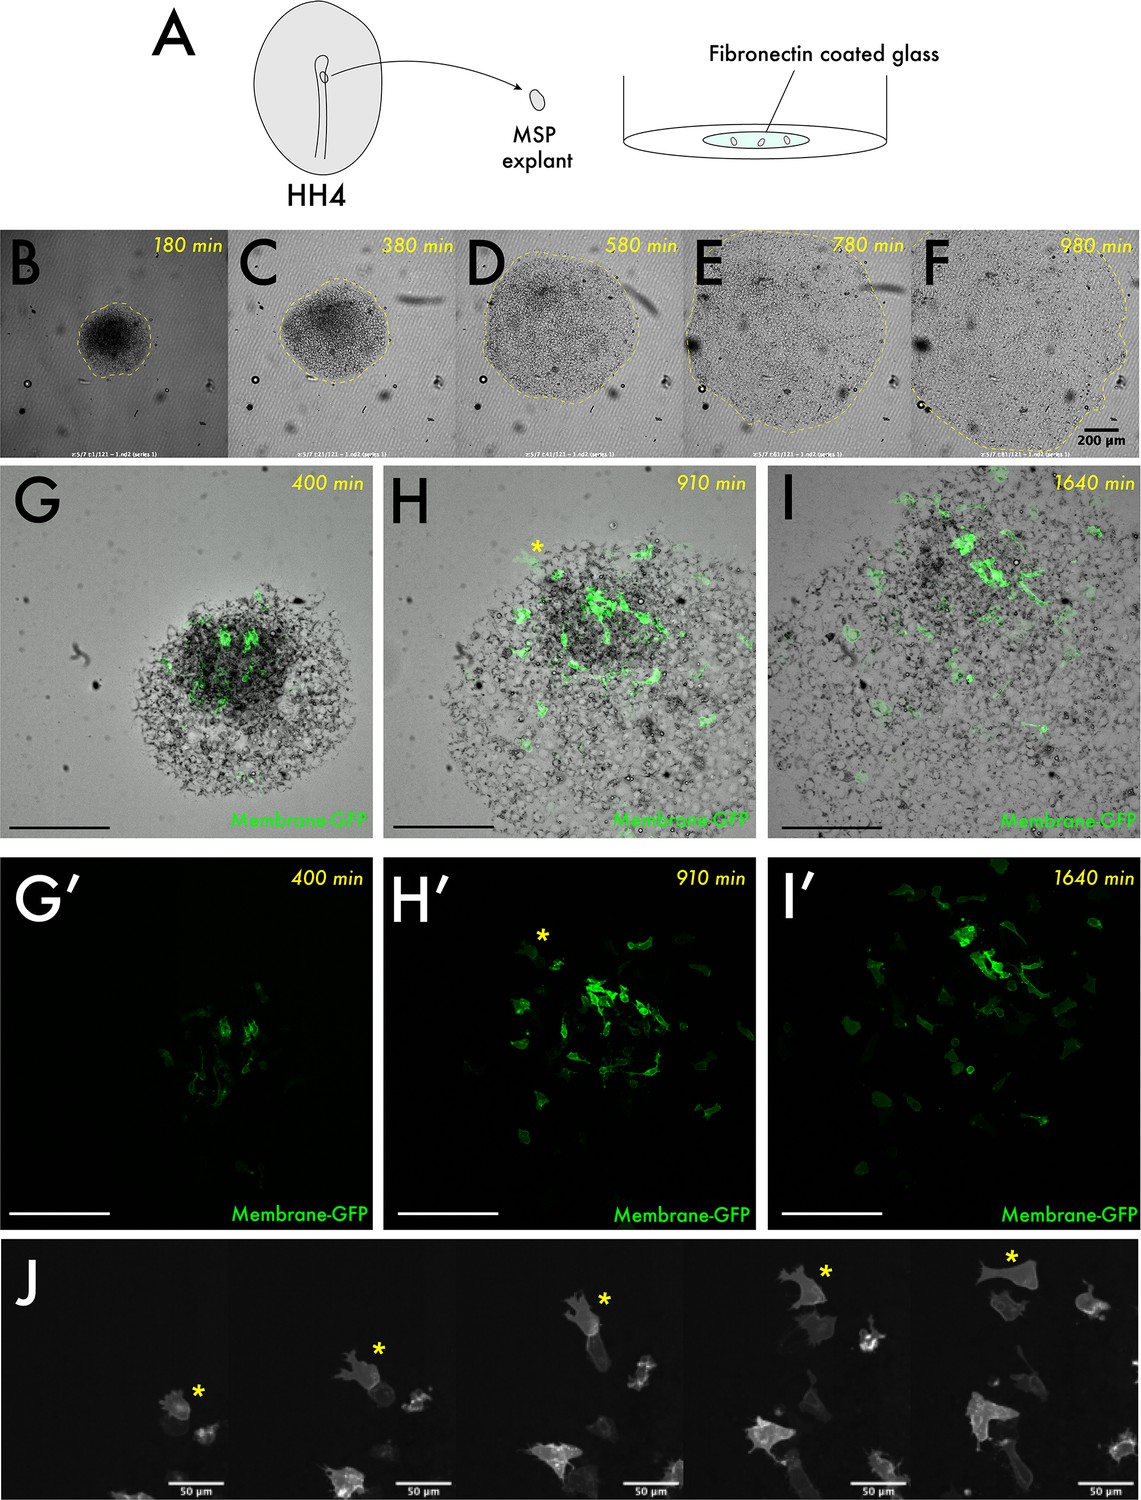
Characterising migration of HH4 medial somite progenitor (MSP) explants grown on fibronectin.
(A) Schematic describing experimental set-up: HH4 MSP regions were dissected from the embryo and placed mesendoderm down on a fibronectin-coated glass surface. (B–F) are brightfield still images taken from a timelapse of a growing explant. The yellow dashed outline shows the edge of the explant in each image. (G–I) Images taken from a timelapse of a different explant, in this case explanted mosaically with a membrane-GFP construct to yield low-density labelling of individual cells within the explant. (G–I) are composite brightfield and GFP images whilst (G’–I’) are corresponding GFP single-channel images. (J) is a set of enlarged images from the data in (G’–I’). The yellow asterisk corresponds to a single labelled cell found at the edge of the explant that shows highly polarised protrusions over time towards the edge of the explant. Scale bars in (B–I) represent 200 μm, in (J) represent 50 μm.
Figure 5 with 2 supplements
Hox expression is intrinsically regulated in both grafts and explants.
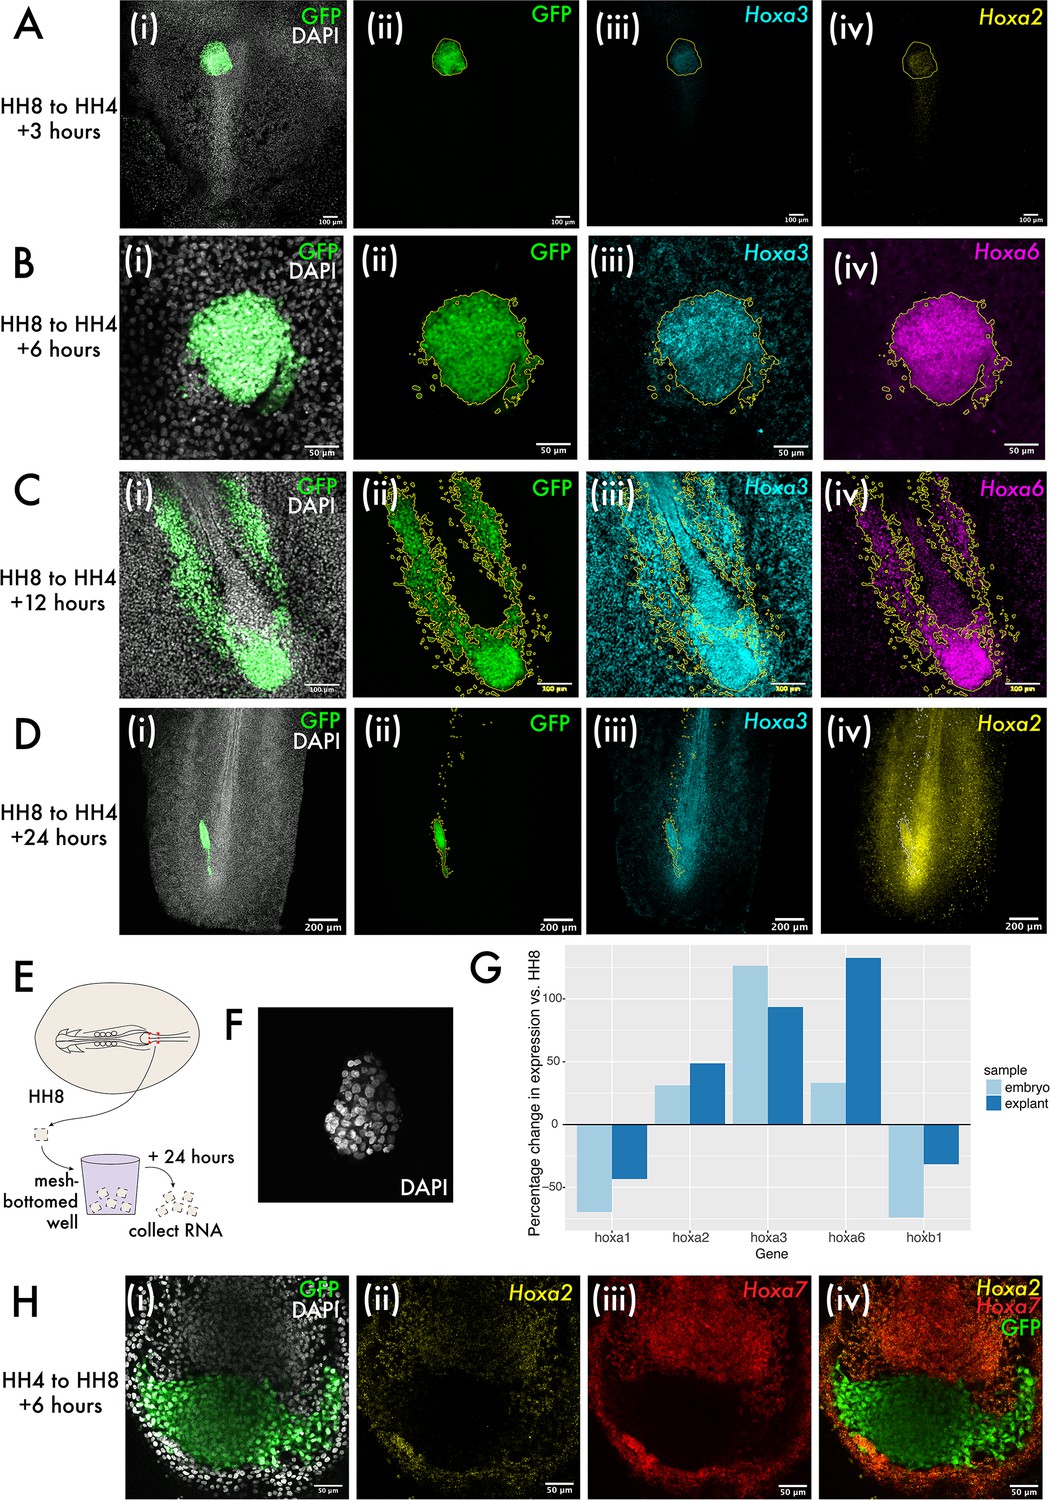
(A–D) show heterochronic HH8 to HH4 grafts at 3, 6, 6, 12, and 24 hr post-grafting, respectively, with each image showing the cells in the progenitor population (tailbud in [C] and [D]). Panel (i) of (A–D) shows composite DAPI and GFP summed slice projections. (ii), (iii), and (iv) are the same images as single-channel summed slice projections, showing the location of the donor GFP+ cells, Hoxa3 mRNA and Hoxa2 or Hoxa6 mRNA expression, respectively (please see labels in panel for gene). In (A–D), yellow or white lines outline the location of GFP+ (donor) tissue. (E) Schematic showing explant experiment set-up. (F) DAPI stained HH8 explant after 24 hr of culture shown here as a summed slice projection. (G) Bar chart showing expression of five different Hox genes in embryonic medial somite progenitor (MSP) regions and HH8 explants after 24 hr, represented relative to the endogenous expression in MSP regions at HH8. (H) HH4 to HH8 graft at 6 hr after grafting, stained for Hoxa2 and Hoxa7 expression. (i) shows GFP and DAPI fluorescence, (ii) shows Hoxa2 expression, (iii) shows Hoxa7 expression, and (iv) shows Hoxa2, Hoxa7, and GFP. Scale bars in (D) represent 200 μm, in (A) and (C) represent 100 μm, and in (B) and (H) represent 50 μm. All fluorescence images are presented as summed slice Z-projections.
Figure 5—figure supplement 1
Hox gene expression characterisation.
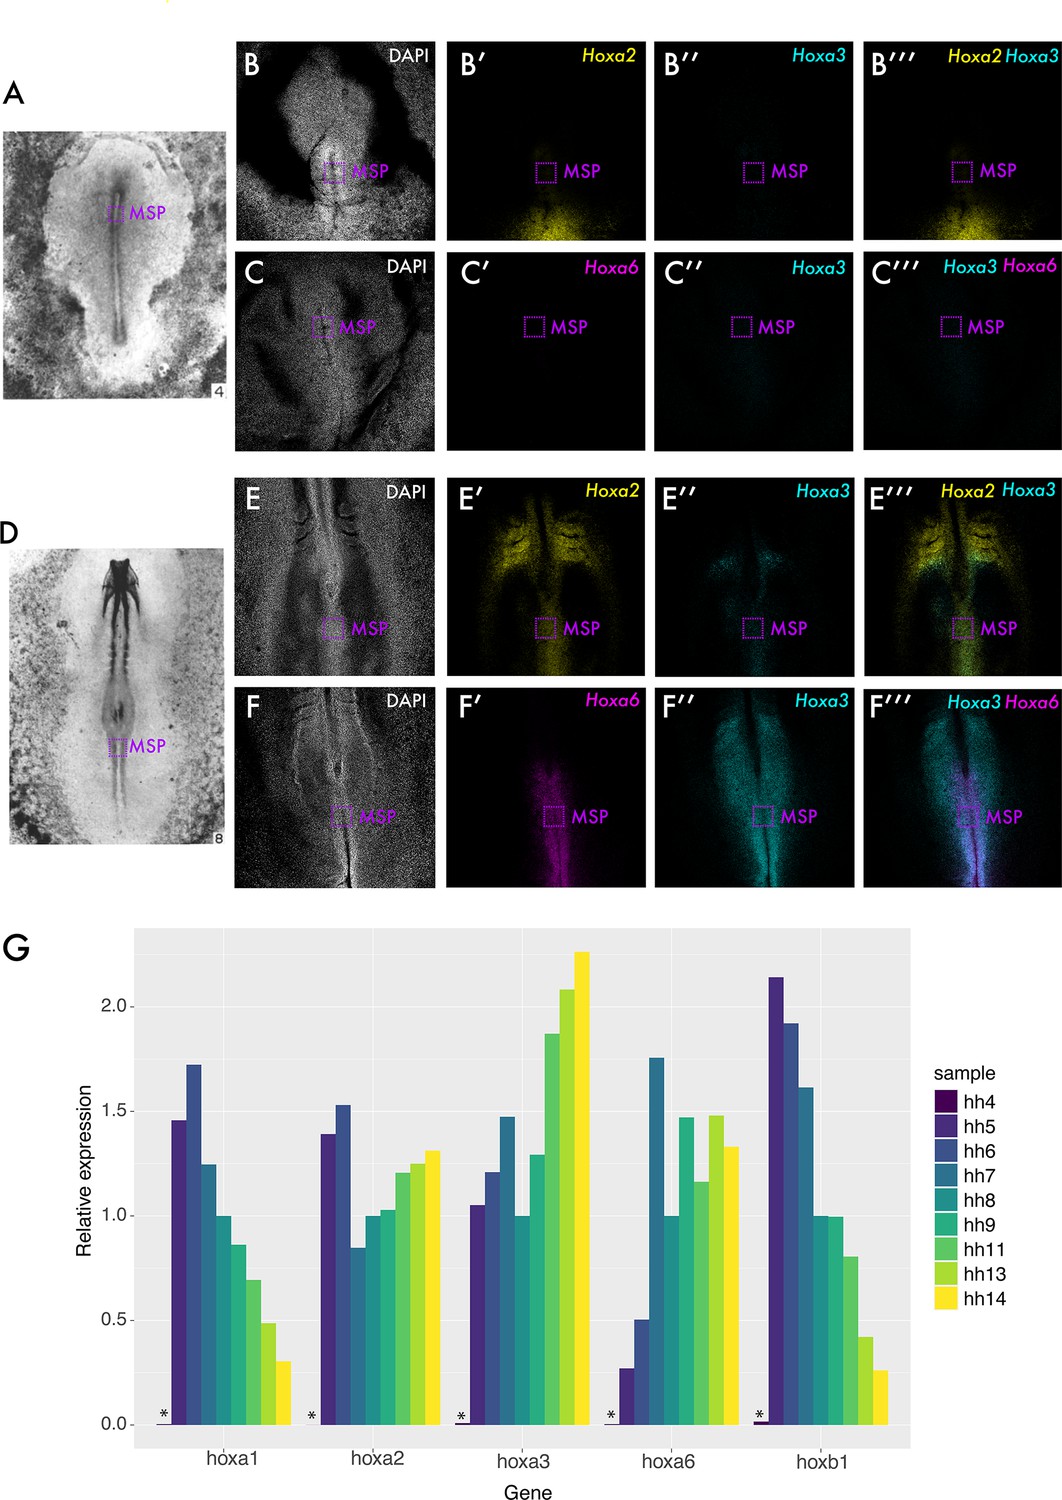
Hybridisation chain reaction (HCR) for Hoxa2, Hoxa3, and Hoxa6 was performed at HH4 and HH8. Whole embryo images taken from Hambuger and Hamilton, 1951 are shown in (A) and (D), with dotted purple boxes indicating the location of medial somite progenitor (MSP) cells at each stage. HCRs at HH4 are shown in (B) and (C). HCRs at HH8 are shown in (E) and (F). All confocal images are average intensity Z-projections. (G) shows RT-qPCR data for several Hox genes in MSP regions at several stages. All expression levels are relative to ACTB (housekeeping) gene expression. Asterisks in (G) indicate no detected transcript.
Figure 5—figure supplement 2
Hox gene expression in the formed axis of grafted embryos.
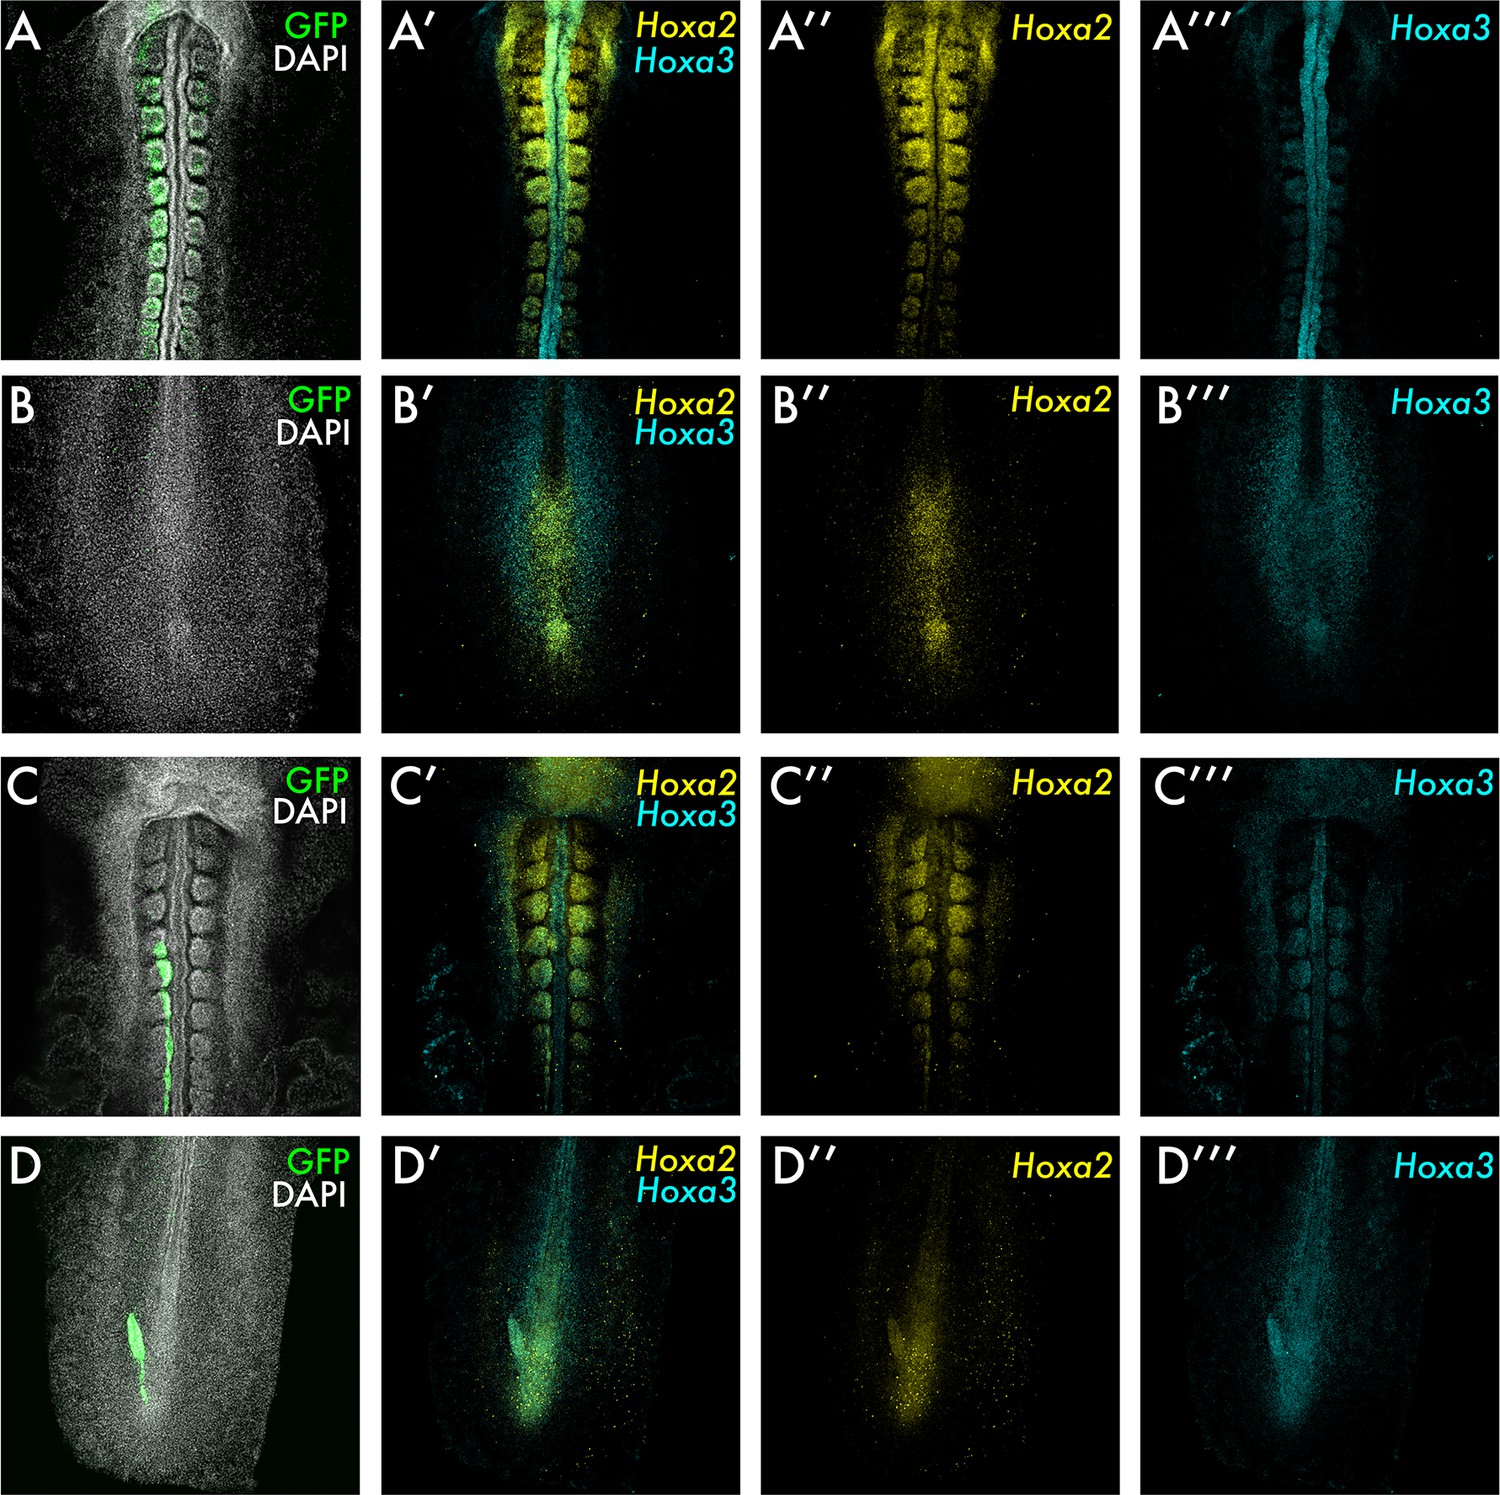
(A) and (B) show an HH4-HH4 homochronic graft fixed at 24 hr after grafting, with the field of view in (A) showing the trunk and in (B) showing the tailbud. (C) and (D) show an HH8-HH4 heterochronic graft fixed at 24 hr after grafting, with the field of view in (C) showing the trunk and in (D) showing the tailbud. Both types of graft were stained by Hybridisation chain reaction (HCR) for Hoxa2 and Hoxa3 and with DAPI. Grafted tissue expresses GFP. All images are summed slice Z-projections.
Figure 6 with 1 supplement
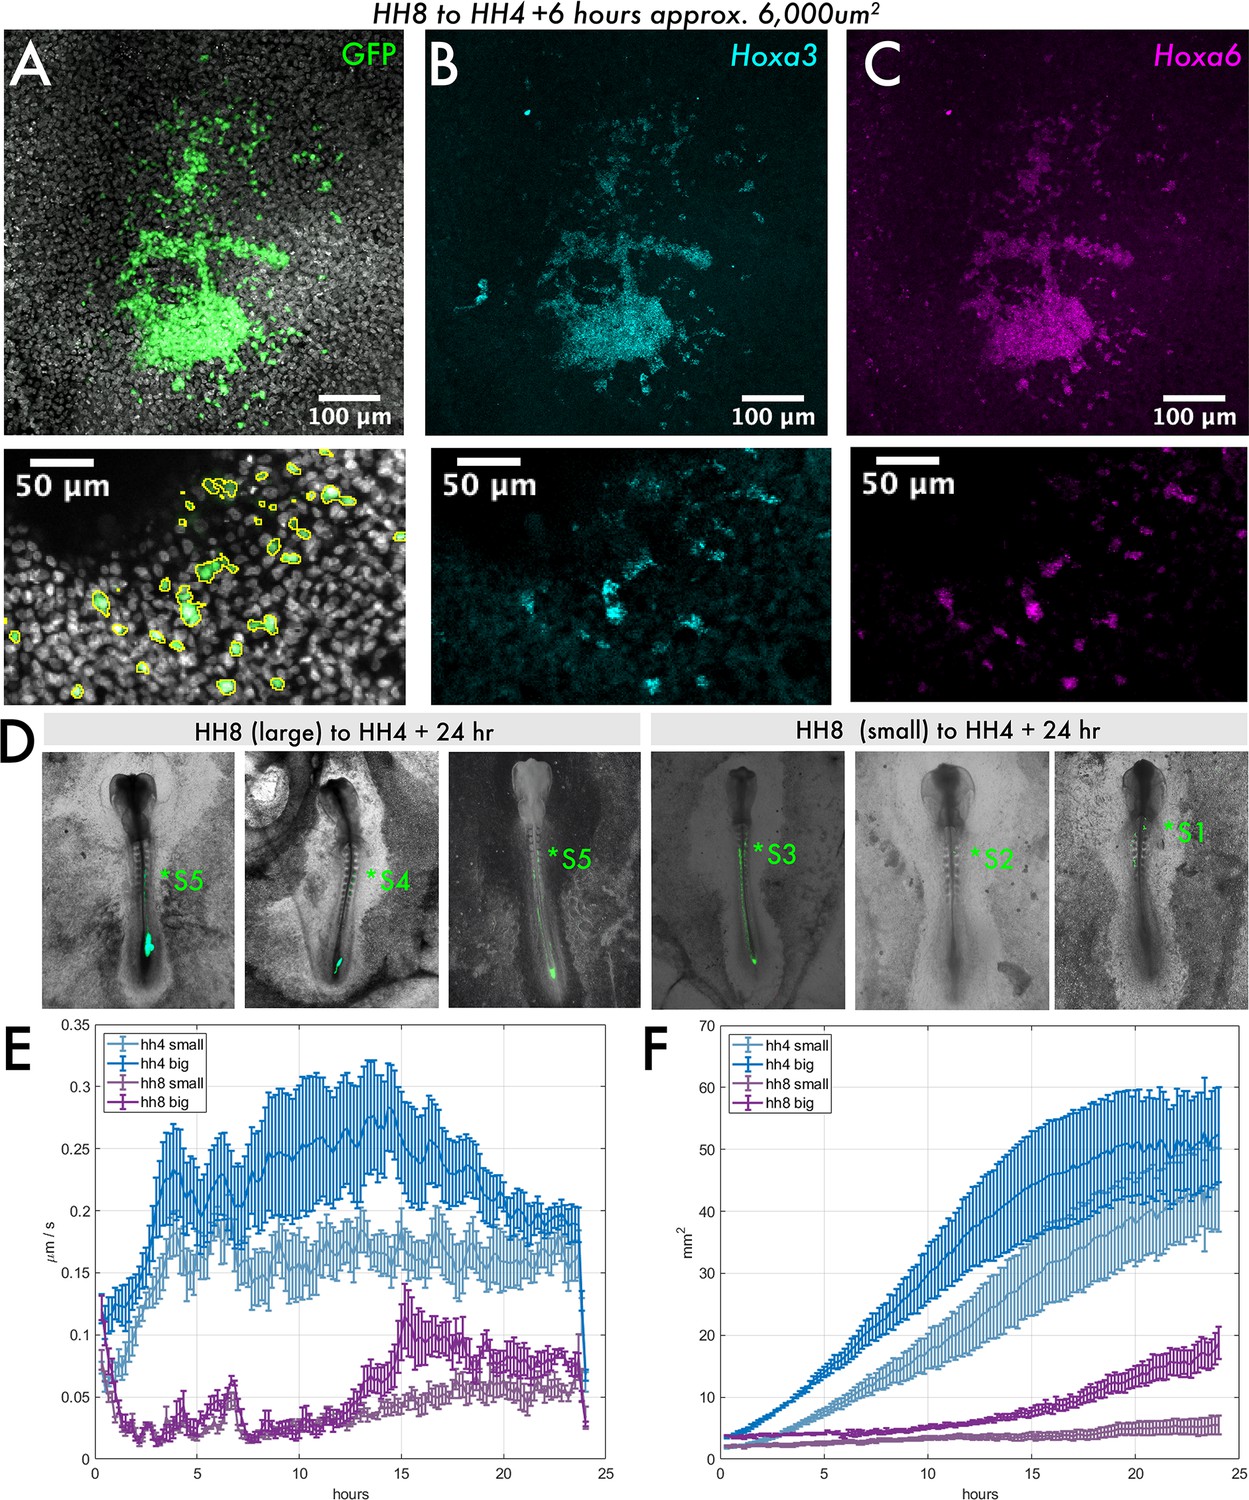
Size dependency of HH8 medial somite progenitor (MSP) tissue behaviour.
(A–C) Small HH8 to HH4 graft (donor tissue ~6000 μm2) at 6 hr after grafting. (A) DAPI and GFP composite image, (B) Hoxa3 hybridisation chain reaction (HCR) stain, and (C) Hoxa6 HCR stain. Lower panels show an enlarged view of images above; GFP signal outlined in (A). (D) Three examples of HH8-HH4 large and small grafts are shown at 24 hr after grafting as combined GFP/brightfield images. The most anterior somite contribution of each graft is indicated by the annotation (*S). (E) Velocity plot showing the mean velocity at each timepoint for several explants of each class (n = 5 for HH4 large, n = 4 for HH4 small, n = 3 for HH8 large, and n = 5 for HH8 small). (F) Area plot showing the mean area for several explants of each class at each timepoint (n’s as above). In (E) and (F), error bars represent the standard error. Scale bars in (D) represent 200 μm, in (A–C) upper panels represent 100 μm, and in lower inset panels represent 50 μm. All fluorescence images are presented as summed slice Z-projections.
Figure 6—figure supplement 1
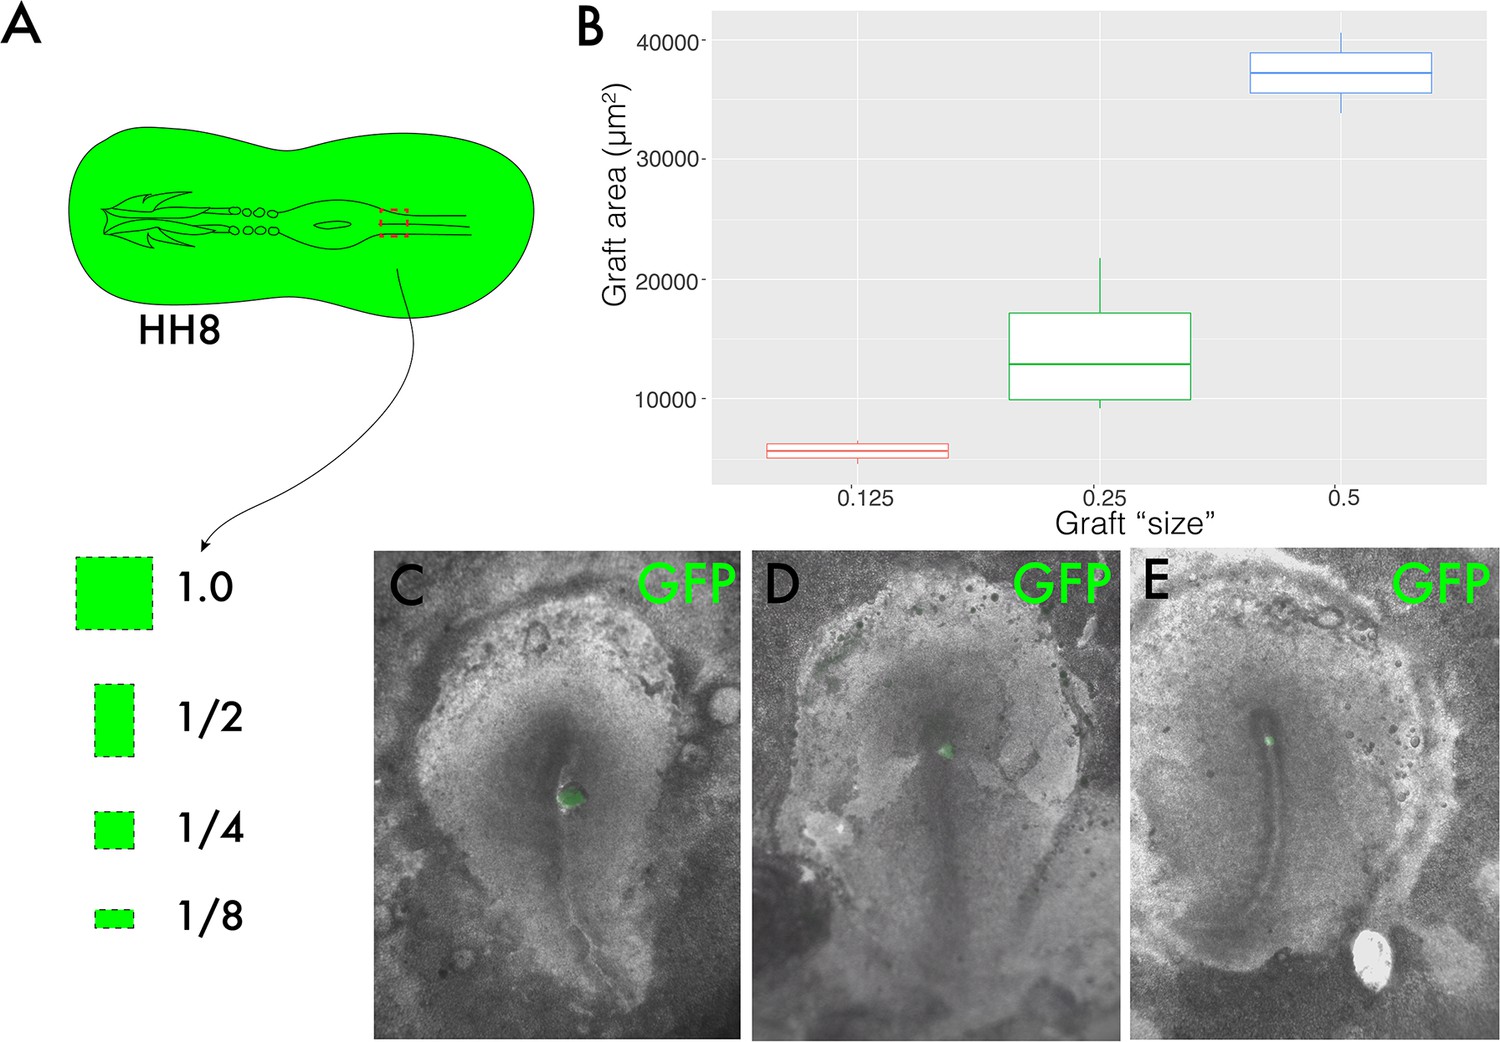
Graft size validation.
(A) is a schematic summarising the different sized pieces of donor tissue used for the graft sizes experiment in Figure 5. The different graft sizes were defined relative to one another, that is, a quarter-sized graft was achieved by cutting the whole medial somite progenitor (MSP) region in half twice. (B) Boxplot showing the area in µm2 of 1/2, 1/4, and 1/8-sized grafts. N = 2 for 1/2, n = 4 for 1/4, and n = 4 for 1/8-sized grafts. (C–E) are composite brightfield and GFP fluorescence images showing a representative graft of each size, with (C) showing a 1/2-sized graft, (D) showing a 1/4-sized graft, and (E) showing a 1/8- sized graft.
Additional files
-
MDAR checklist
- https://cdn.elifesciences.org/articles/90499/elife-90499-mdarchecklist1-v2.docx
-
Supplementary file 1
Supporting differential gene expression and primer sequences.
(a) Differential gene expression (clusters 0–13). Differential expression analysis was performed in Seurat to identify ‘markers’ of each cluster, that is, those genes whose expression differed significantly between a given cluster and the remainder of the dataset. For each cluster, the 10s genes with the most significant (smallest) adjusted p-value are provided in this table. (b) GO term analysis for cluster 6. GeneCodis was used to perform Gene Ontology analysis on the full list of differentially expressed genes in cluster 6 conserved across samples (i.e. genes differentially expressed in cluster 6 across all three samples). (c) Differential gene expression for HH8- and HH4-derived cells in clusters 6, 8, and 12. Pooled HH8- and HH4-derived cells in the central clusters of the UMAP plot were used to test for genes differentially expressed between these groups. Cell cycle-related genes were removed from the analysis. (d) Primer sequences for RT-qPCR.
- https://cdn.elifesciences.org/articles/90499/elife-90499-supp1-v2.docx
Download links
A two-part list of links to download the article, or parts of the article, in various formats.
Downloads (link to download the article as PDF)
Open citations (links to open the citations from this article in various online reference manager services)
Cite this article (links to download the citations from this article in formats compatible with various reference manager tools)
Intrinsic and extrinsic cues time somite progenitor contribution to the vertebrate primary body axis
eLife 13:e90499.
https://doi.org/10.7554/eLife.90499


