Endosomal dysfunction contributes to cerebellar deficits in spinocerebellar ataxia type 6
- Biology Department, McGill University, Canada
- Department of Biological Sciences, Columbia University, United States
Figures
Figure 1
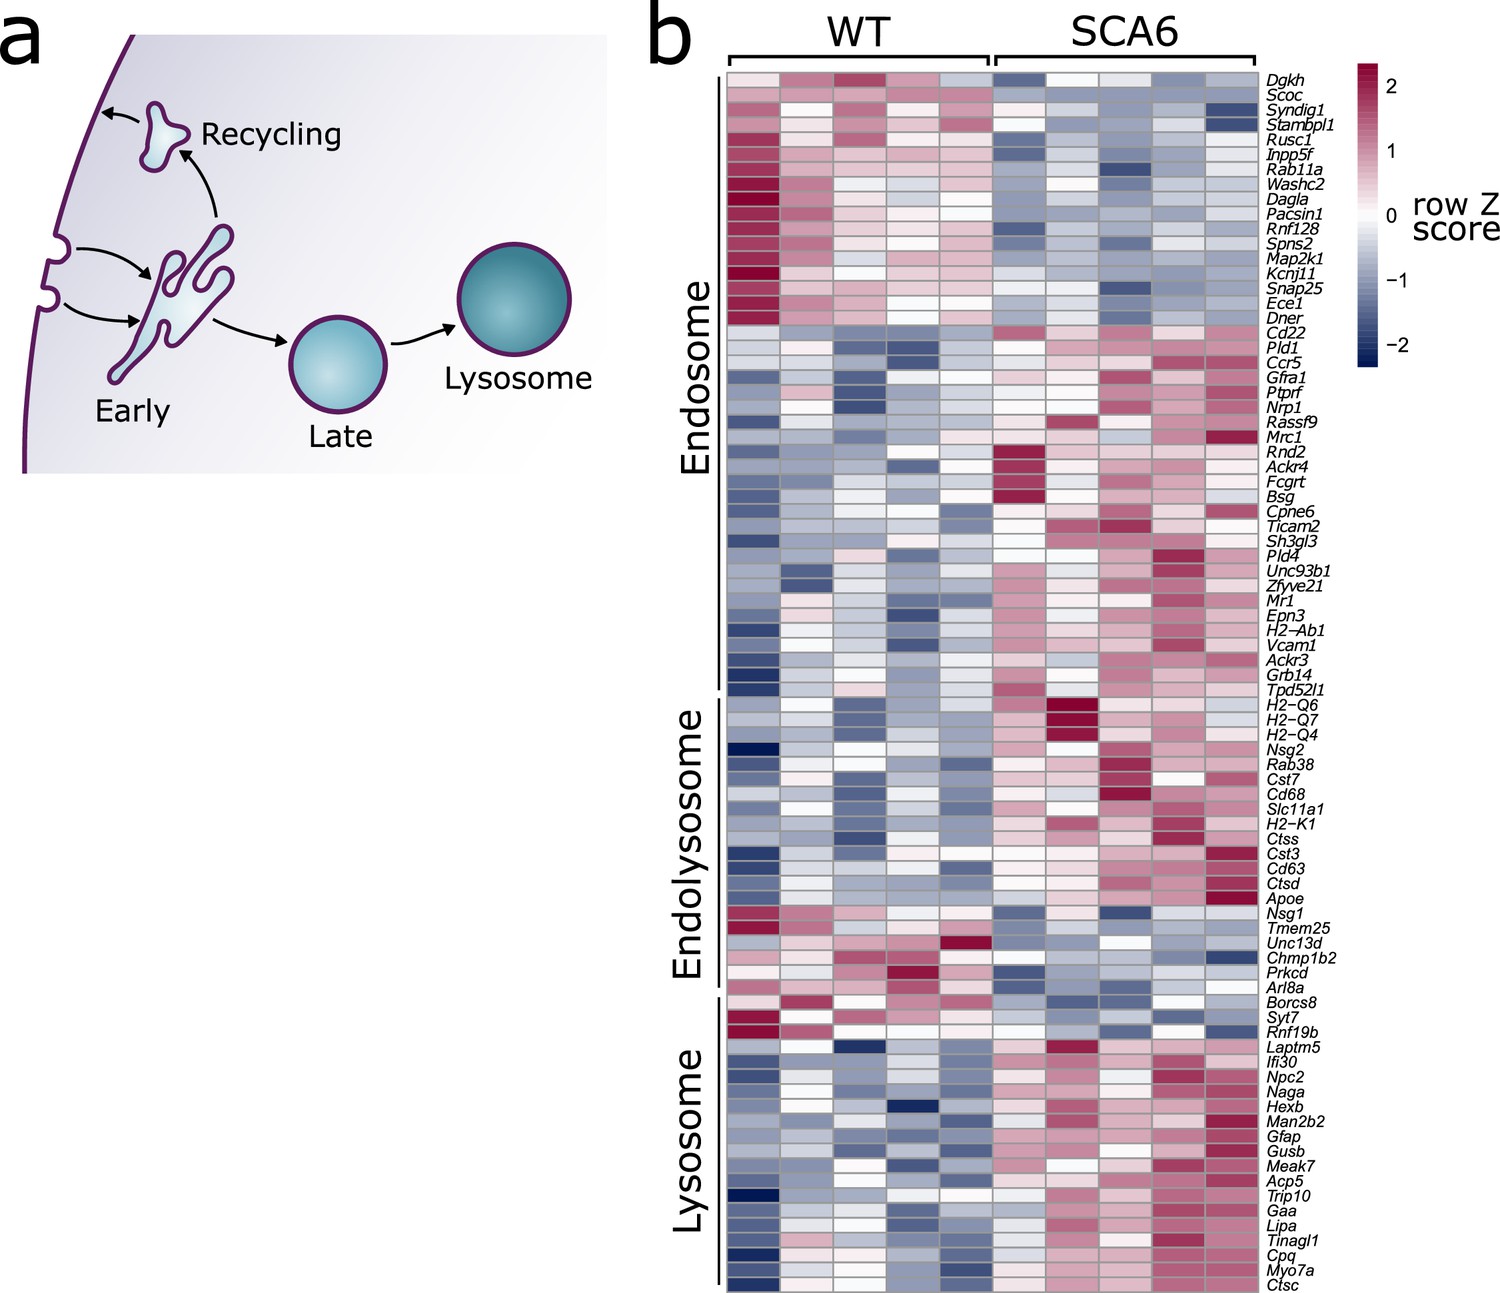
Endo-lysosomal genes are dysregulated in the spinocerebellar ataxia type 6 (SCA6) cerebellum.
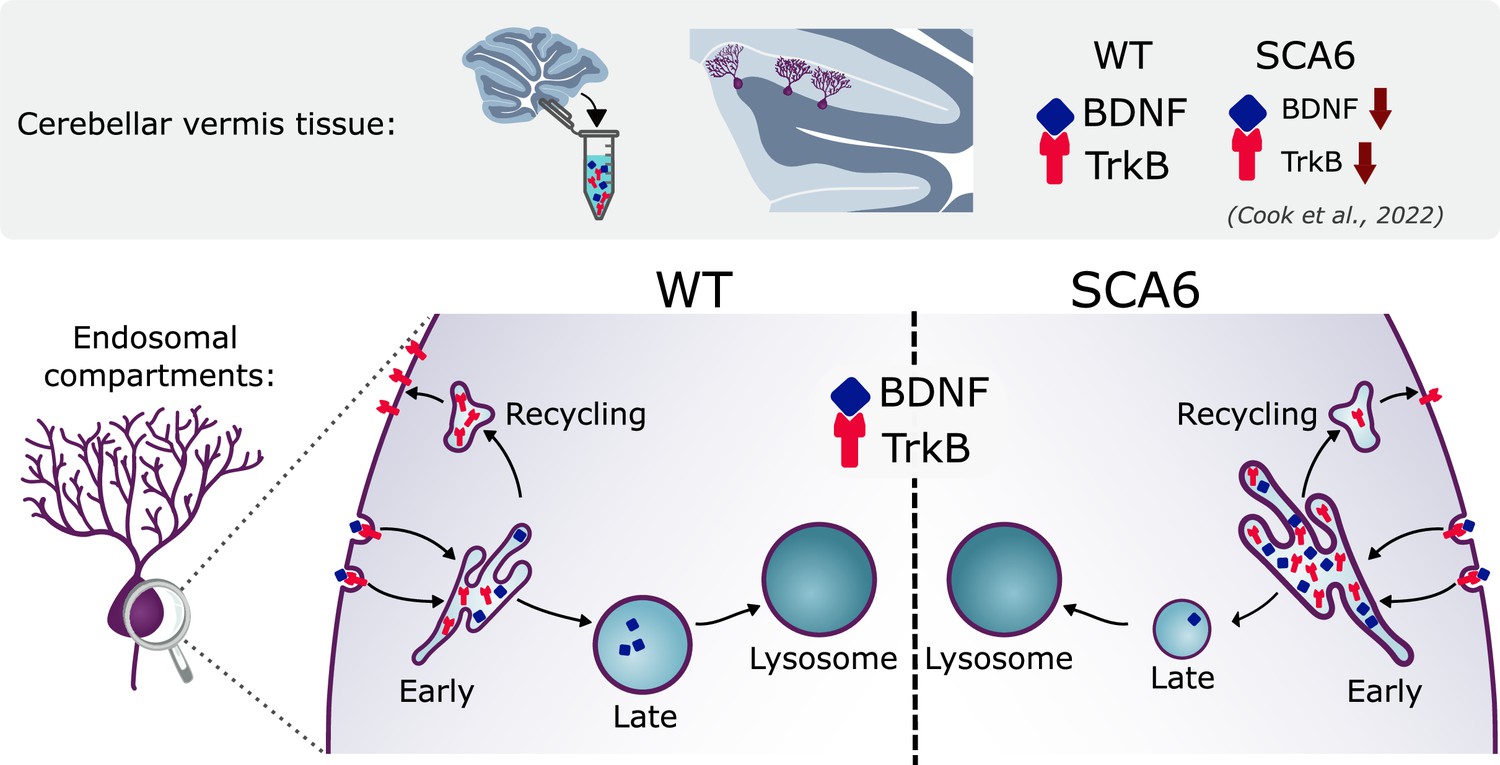
(a) Schematic showing the endo-lysosomal system. (b) Heat map showing relative expression of endo-lysosomal-associated transcripts in the cerebellum of five wildtype (WT) and five SCA6 mice (1 column per mouse). Genes are separated into groups based on their gene ontology categorization (GO term Endosome and Lysosome; the group ‘Endolysosome’ denotes genes that belong to both GO term categories), only genes with an adjusted p value <0.05 are shown.
-
Figure 1—source data 1
Normalized reads of endolysosomal genes.
- https://cdn.elifesciences.org/articles/90510/elife-90510-fig1-data1-v1.xlsx
Figure 2
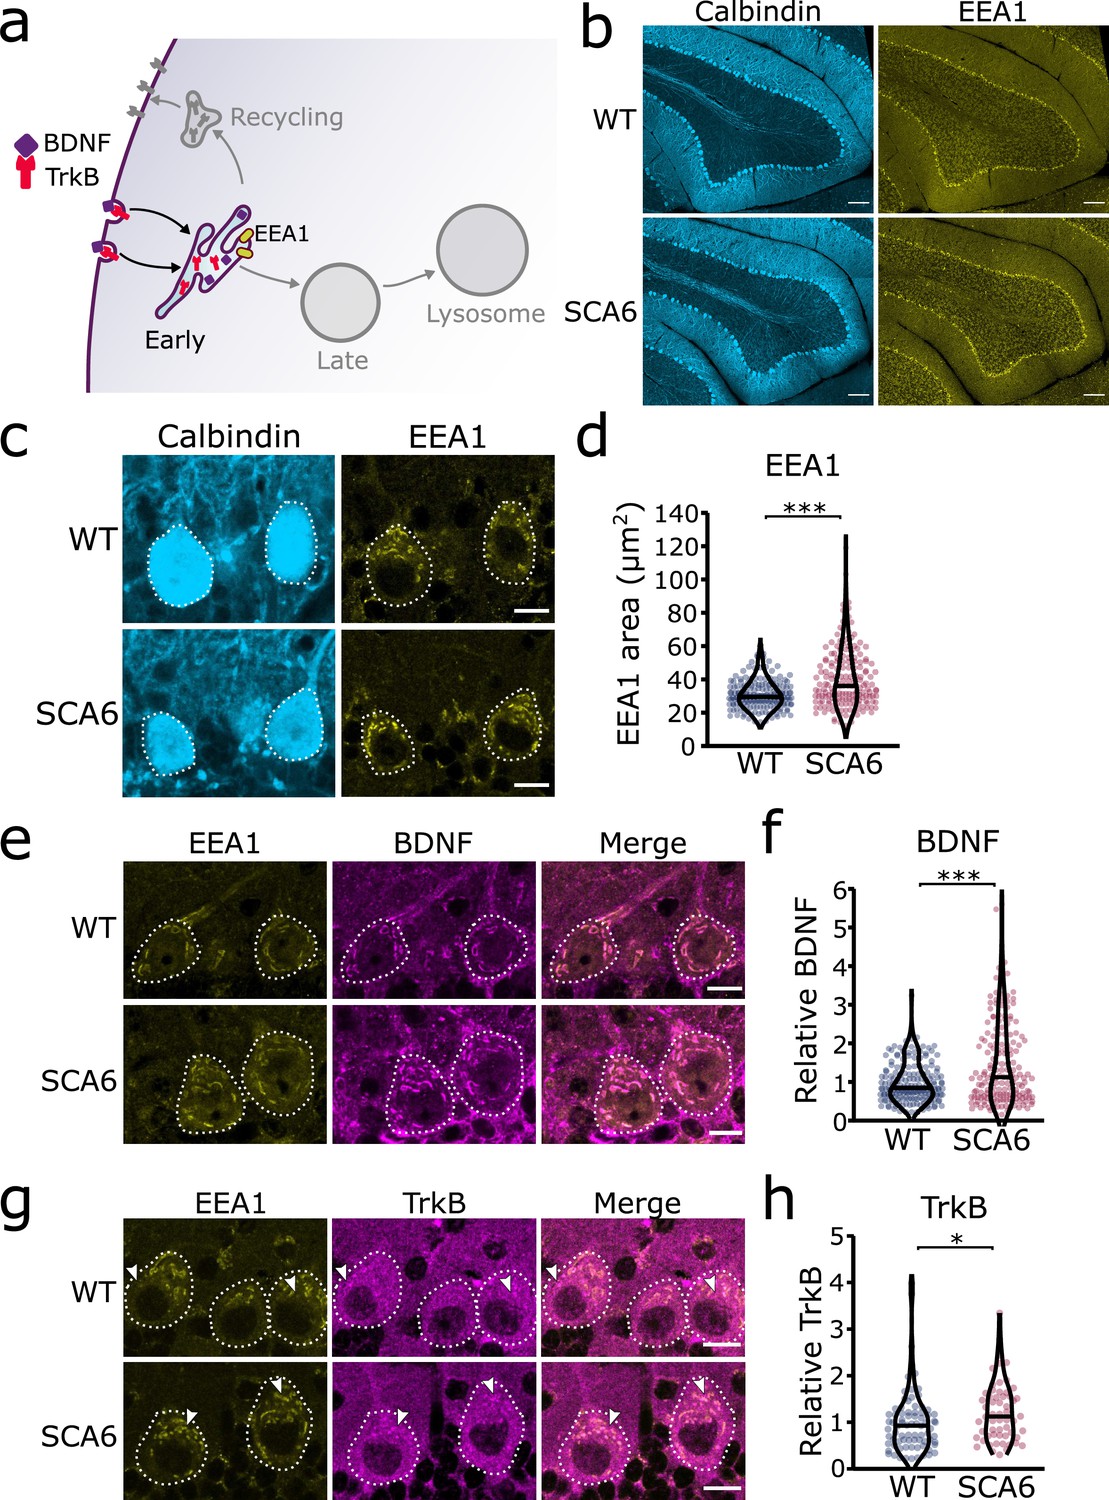
Early endosomes are enlarged and accumulate brain-derived neurotrophic factor (BDNF) and tropomyosin kinase B (TrkB) in spinocerebellar ataxia type 6 (SCA6) Purkinje cells.
(a) Schematic showing BDNF and TrkB endocytosis and trafficking to early endosomes labeled with early endosome antigen 1 (EEA1). (b) The early endosome marker EEA1 stains early endosomes in lobule 3 of the cerebellar vermis in wildtype (WT) and SCA6 mice, calbindin labels Purkinje cells. Scale bar, 100 µm. (c) Closeup images of the early endosome marker EEA1 in lobule 3 of cerebellum, calbindin labels Purkinje cells (outlined). Scale bar, 10 µm. (d) The area covered by EEA1 staining in Purkinje cells is increased in SCA6 mice compared to WT (p < 0.001; N = 6 WT mice, 173 cells; 5 SCA6 mice, 171 cells). (e) Representative images of the early endosome marker EEA1 and BDNF within Purkinje cells (outlined) in the anterior vermis. Scale bar, 10 µm. (f) Relative staining level of BDNF within early endosome compartment is higher in the Purkinje cells of SCA6 mice compared to WT (p < 0.001; N = 6 WT mice, 173 cells; 5 SCA6 mice, 171 cells). (g) Representative images of the early endosome marker EEA1 and TrkB within Purkinje cells (outlined) in the anterior vermis. Arrowheads denote locations of significant TrkB accumulations. Scale bar, 10 µm. (h) Relative staining level of TrkB within early endosome compartment is higher in the Purkinje cells of SCA6 mice compared to WT (p = 0.013; N = 4 WT mice, 79 cells; 4 SCA6 mice, 58 cells). Mann–Whitney U-test used for all statistical comparisons, *p < 0.05, ***p < 0.001.
Figure 3 with 1 supplement
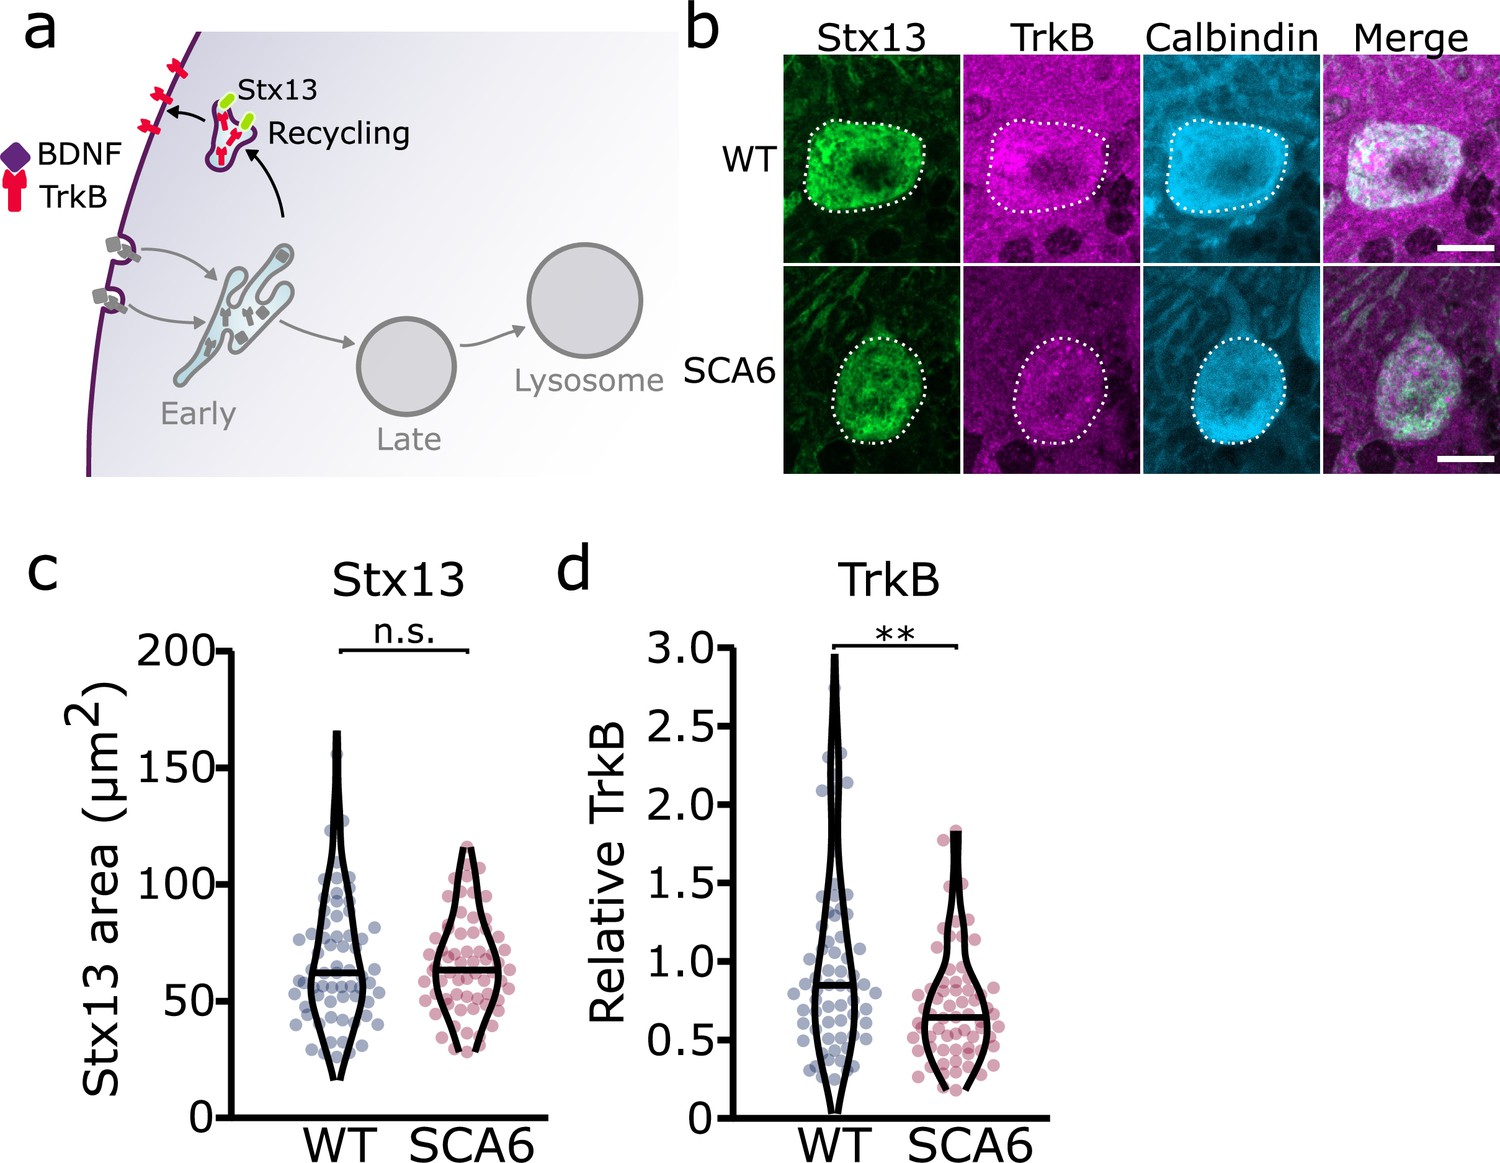
Recycling of tropomyosin kinase B (TrkB) in recycling endosomes is impaired in spinocerebellar ataxia type 6 (SCA6) Purkinje cells.
(a) Schematic showing the return of TrkB to the cell membrane via recycling endosomes labeled with Stx13. (b) Representative images of the recycling endosome marker Stx13 and TrkB within Purkinje cells (outlined) of the anterior vermis. Scale bar, 10 µm. (c) The area covered by Stx13 staining in Purkinje cells is unchanged between wildtype (WT) and SCA6 mice (p = 0.96; N = 4 WT mice, 67 cells; 4 SCA6 mice, 66 cells). (d) The relative level of TrkB within recycling endosomes was significantly decreased in SCA6 Purkinje cells (p = 0.0034; N = 4 WT mice, 67 cells; 4 SCA6 mice, 66 cells). Mann–Whitney U-test used for all statistical comparisons, **p < 0.01, n.s. p > 0.05.
Figure 3—figure supplement 1
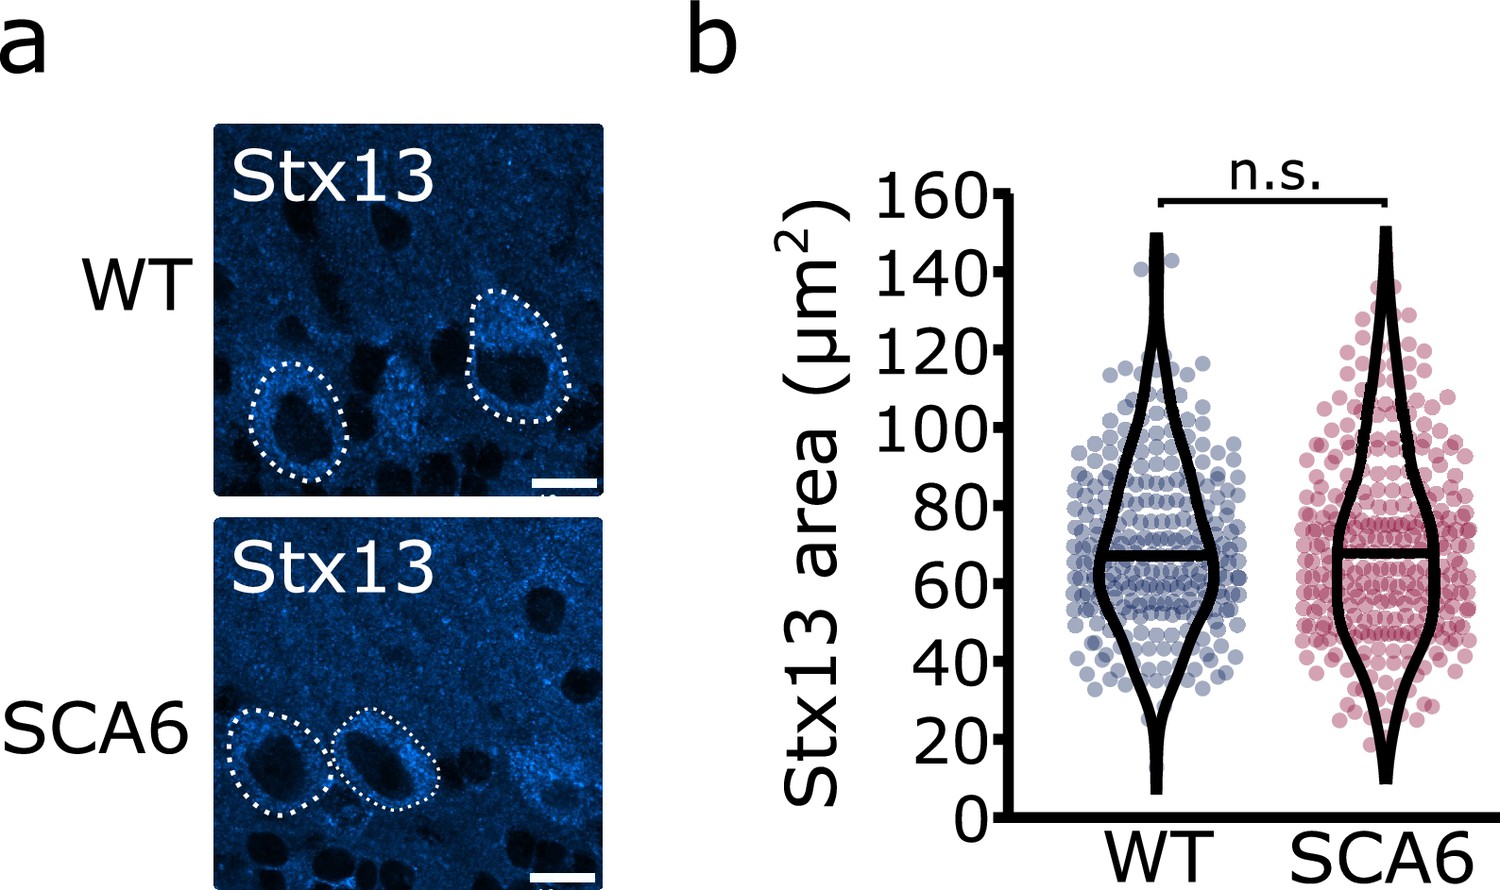
A second Stx13 antibody confirms that recycling endosome area is unchanged in spinocerebellar ataxia type 6 (SCA6) Purkinje cells.
(a) Representative image of the recycling endosome marker Stx13 within Purkinje cells of the anterior vermis. Scale bar, 10 µm. (b) The area covered by Stx13 staining in Purkinje cells is unchanged between wildtype (WT) and SCA6 mice (p = 0.59; Mann–Whitney U-test; N = 4 WT mice, 268 cells; 6 SCA6 mice, 304 cells). n.s. p > 0.05.
Figure 4
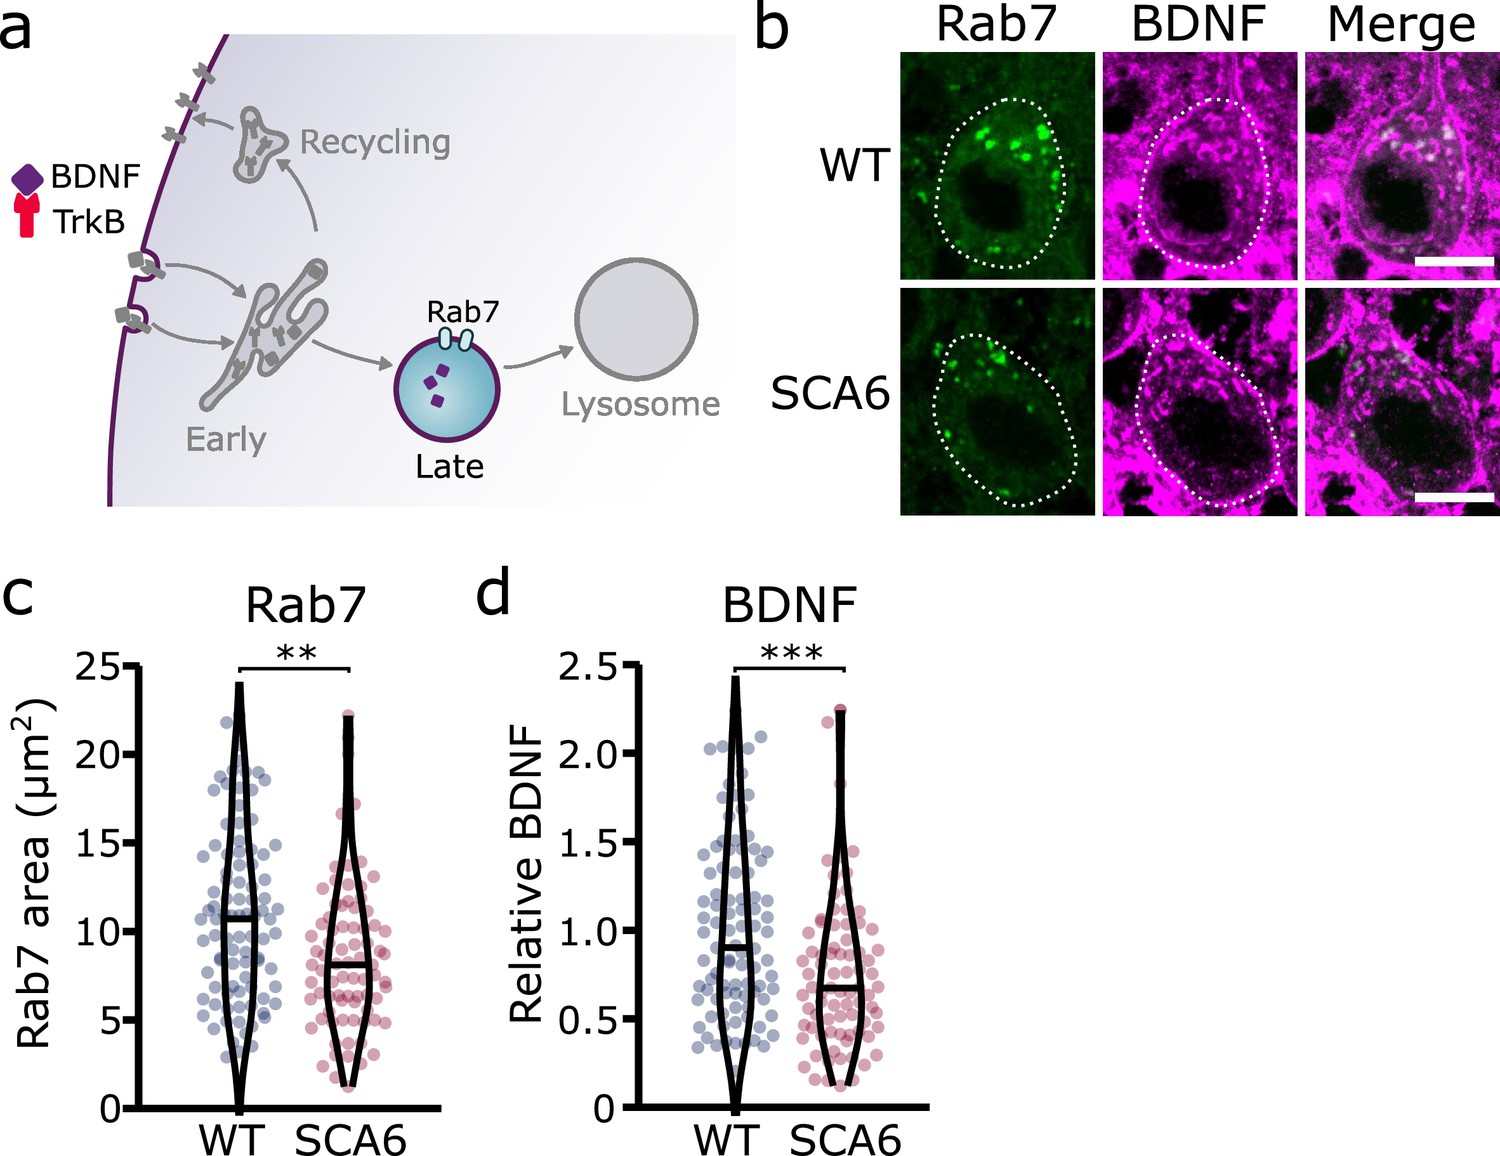
Late endosomes are reduced in spinocerebellar ataxia type 6 (SCA6) Purkinje cells and carry less brain-derived neurotrophic factor (BDNF).
(a) Schematic showing the transport of BDNF in late endosomes expressing Rab7. (b) Representative images of the late endosome marker Rab7 and BDNF within Purkinje cells (outlined) of the anterior vermis. Scale bar, 10 µm. (c) The area covered by Rab7 staining in Purkinje cells is decreased in SCA6 mice compared to wildtype (WT) (p = 0.0019; N = 4 WT mice, 93 cells; 4 SCA6 mice, 81 cells). (d) The relative level of BDNF within late endosomes was significantly decreased in SCA6 Purkinje cells (p < 0.001; N = 4 WT mice, 93 cells; 4 SCA6 mice, 81 cells). Mann–Whitney U-test used for all statistical comparisons, **p < 0.01, ***p < 0.001.
Figure 5 with 1 supplement
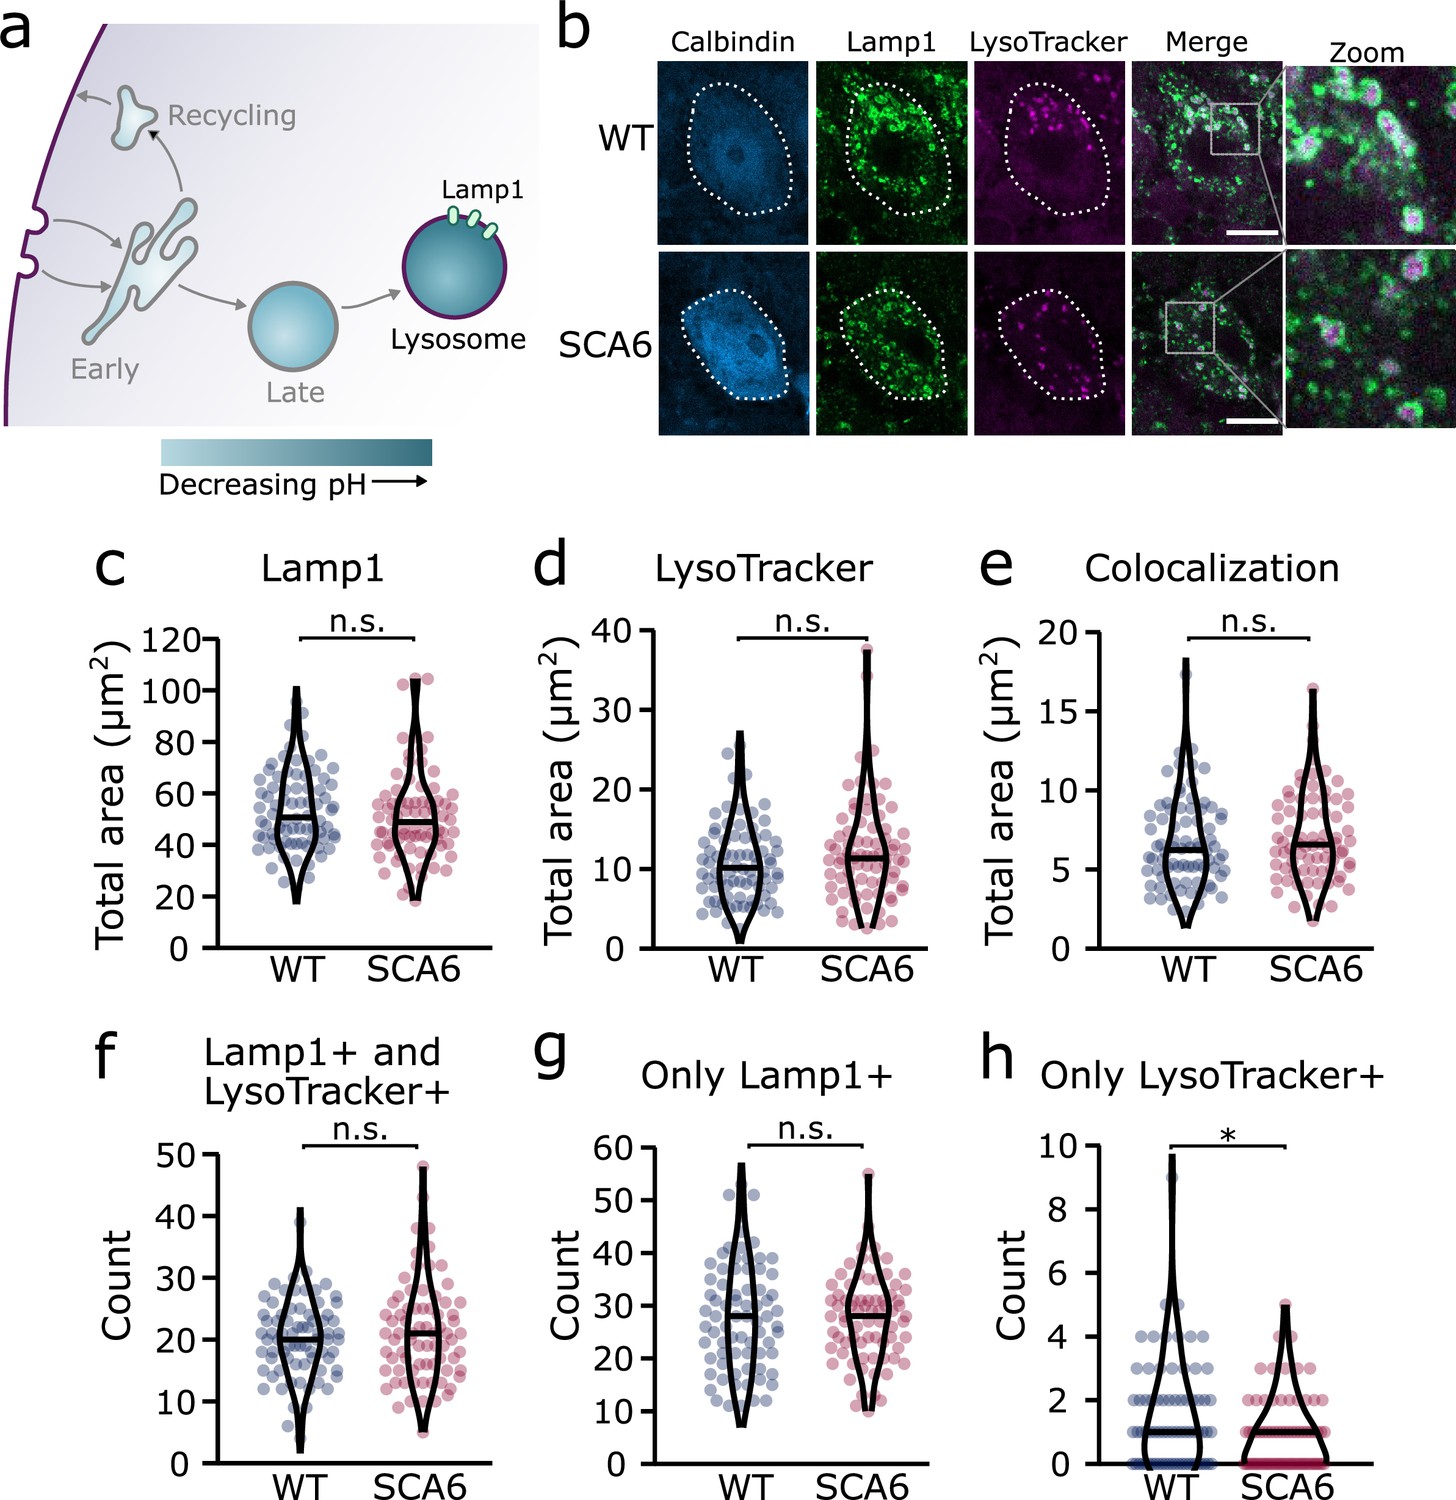
Lysosomes in spinocerebellar ataxia type 6 (SCA6) Purkinje cells are morphologically normal but there may be a deficit in late endosome maturation.
(a) Schematic showing the endo-lysosomal system as a series of compartments of increasingly acidic pH with lysosomes, expressing Lamp1, being most acidic. (b) Representative images of Purkinje cells in the anterior vermis stained for the lysosome membrane marker Lamp1 and LysoTracker as a marker of acidic compartments. Calbindin labels Purkinje cells (outlined). Scale bar, 10 µm. The area covered by (c) Lamp1 staining and (d) LysoTracker staining in Purkinje cells is unchanged between wildtype (WT) and SCA6 mice (p = 0.26 for Lamp1; p = 0.20 for LysoTracker; N = 3 WT mice, 78 cells; 3 SCA6 mice, 76 cells). (e) The area of colocalization between Lamp1 and Lysotracker is unchanged between WT and SCA6 mice (p = 0.34; N = 3 WT mice, 78 cells; 3 SCA6 mice, 76 cells). (f) The number of lysosomes that were both Lamp1- and LysoTracker positive was not significantly different between genotypes (p = 0.72; N = 3 WT mice, 78 cells; 3 SCA6 mice, 76 cells). (g) The number of lysosomes that were Lamp1 positive, but LysoTracker negative was unchanged between genotypes (p = 0.83; N = 3 WT mice, 78 cells; 3 SCA6 mice, 76 cells). (h) The number of putative late endosomes undergoing maturation that were Lamp1 negative, but LysoTracker positive was significantly decreased in the Purkinje cells of SCA6 mice (p = 0.034; N = 3 WT mice, 78 cells; 3 SCA6 mice, 76 cells). Mann–Whitney U-test used for all statistical comparisons except number of Lamp1+ puncta (f) which was normally distributed and so a Student’s t-test was used, *p < 0.05, n.s. p > 0.05.
Figure 5—figure supplement 1
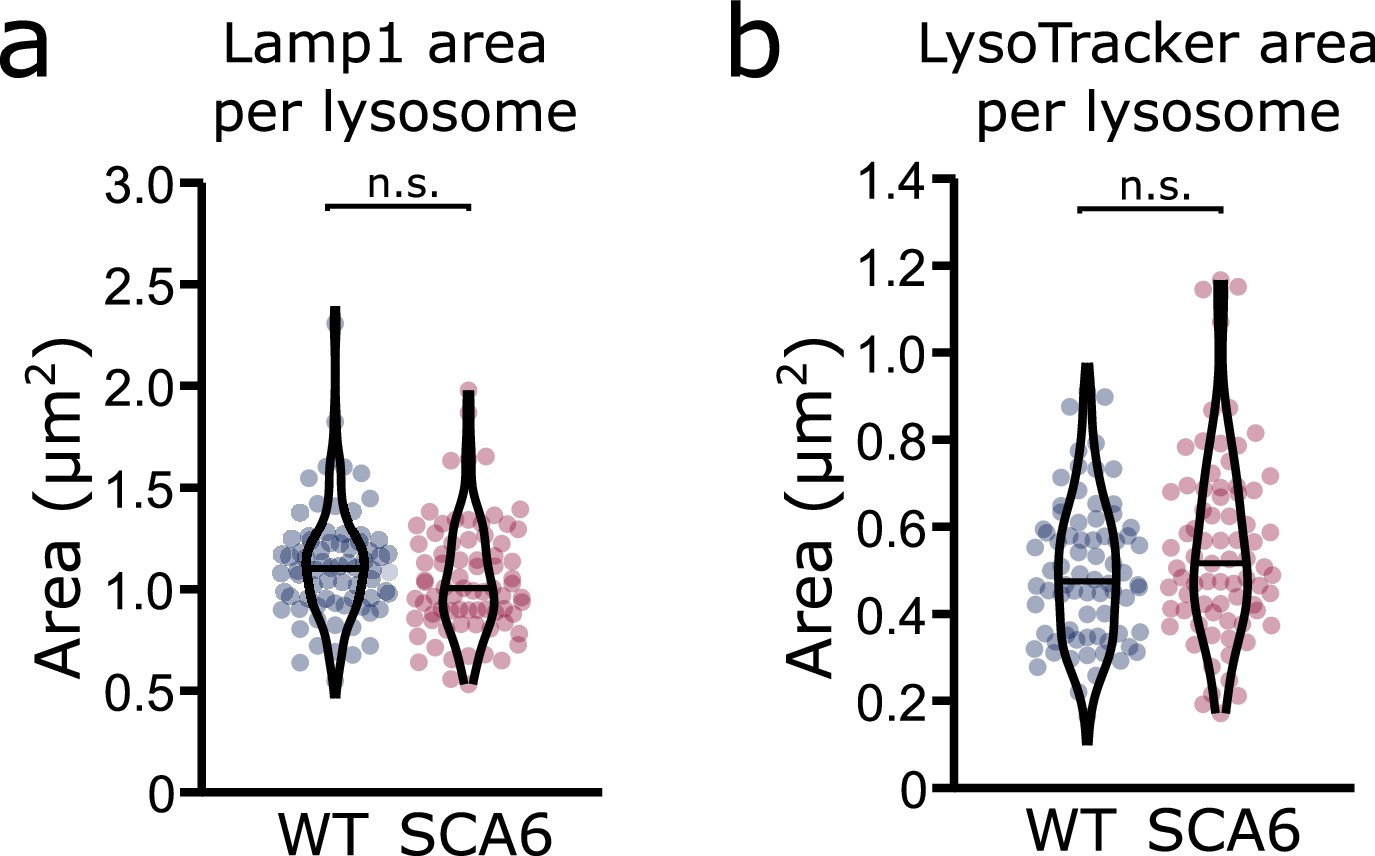
Lysosome size is unchanged in spinocerebellar ataxia type 6 (SCA6) Purkinje cells.
(a) The area covered by Lamp1 staining divided by the number of Lamp1-positive organelles is not significantly different in the Purkinje cells of wildtype (WT) and SCA6 mice (p = 0.093; N = 3 WT mice, 78 cells; 3 SCA6 mice, 76 cells). (b) The area covered by LysoTracker staining divided by the number of LysoTracker-positive organelles is not significantly different in the Purkinje cells of WT and SCA6 mice (p = 0.14; N = 3 WT mice, 3 SCA6 mice). Mann–Whitney U-test used for all statistical comparisons; n.s. p > 0.05.
Figure 6
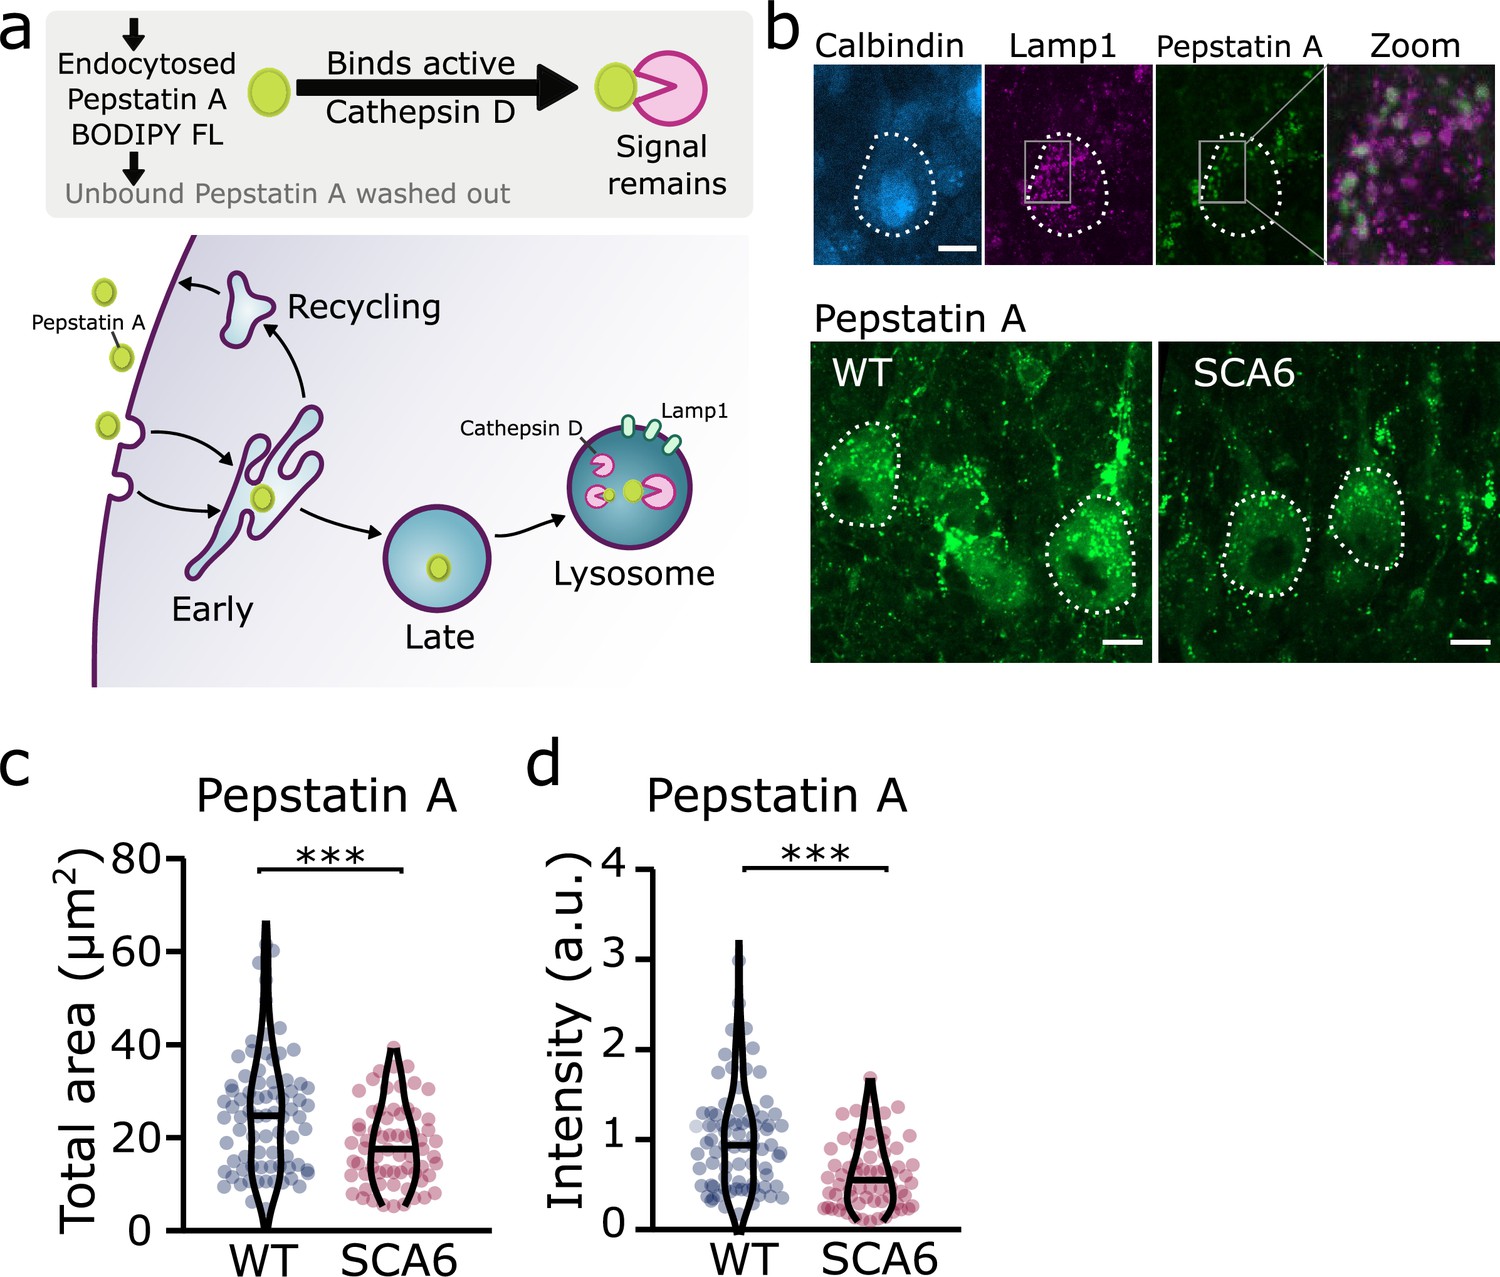
Trafficking of an exogenous peptide to the lysosome shows impairment in lysosomal action on endocytosed cargo in spinocerebellar ataxia type 6 (SCA6).
(a) Schematic showing the use of Pepstatin A BODIPY FL construct to visualize endosome trafficking and Cathepsin D activity. (b) Representative images of Pepstatin A staining in the anterior vermis. Top row shows colocalization with lysosome marker Lamp1, Calbindin labels Purkinje cells (outlined). Scale bars, 10 µm (c) The area covered by Pepstatin A staining in Purkinje cells was significantly decreased in SCA6 mice (p = 0.00076; N = 3 wildtype (WT) mice, 78 cells; 3 SCA6 mice, 66 cells). (d) The intensity of Pepstatin A staining within Purkinje cells was significantly decreased in SCA6 mice (p < 0.0001; N = 3 WT mice, 78 cells; 3 SCA6 mice, 66 cells). ann–Whitney U-test used for all statistical comparisons, ***p < 0.001.
Figure 7
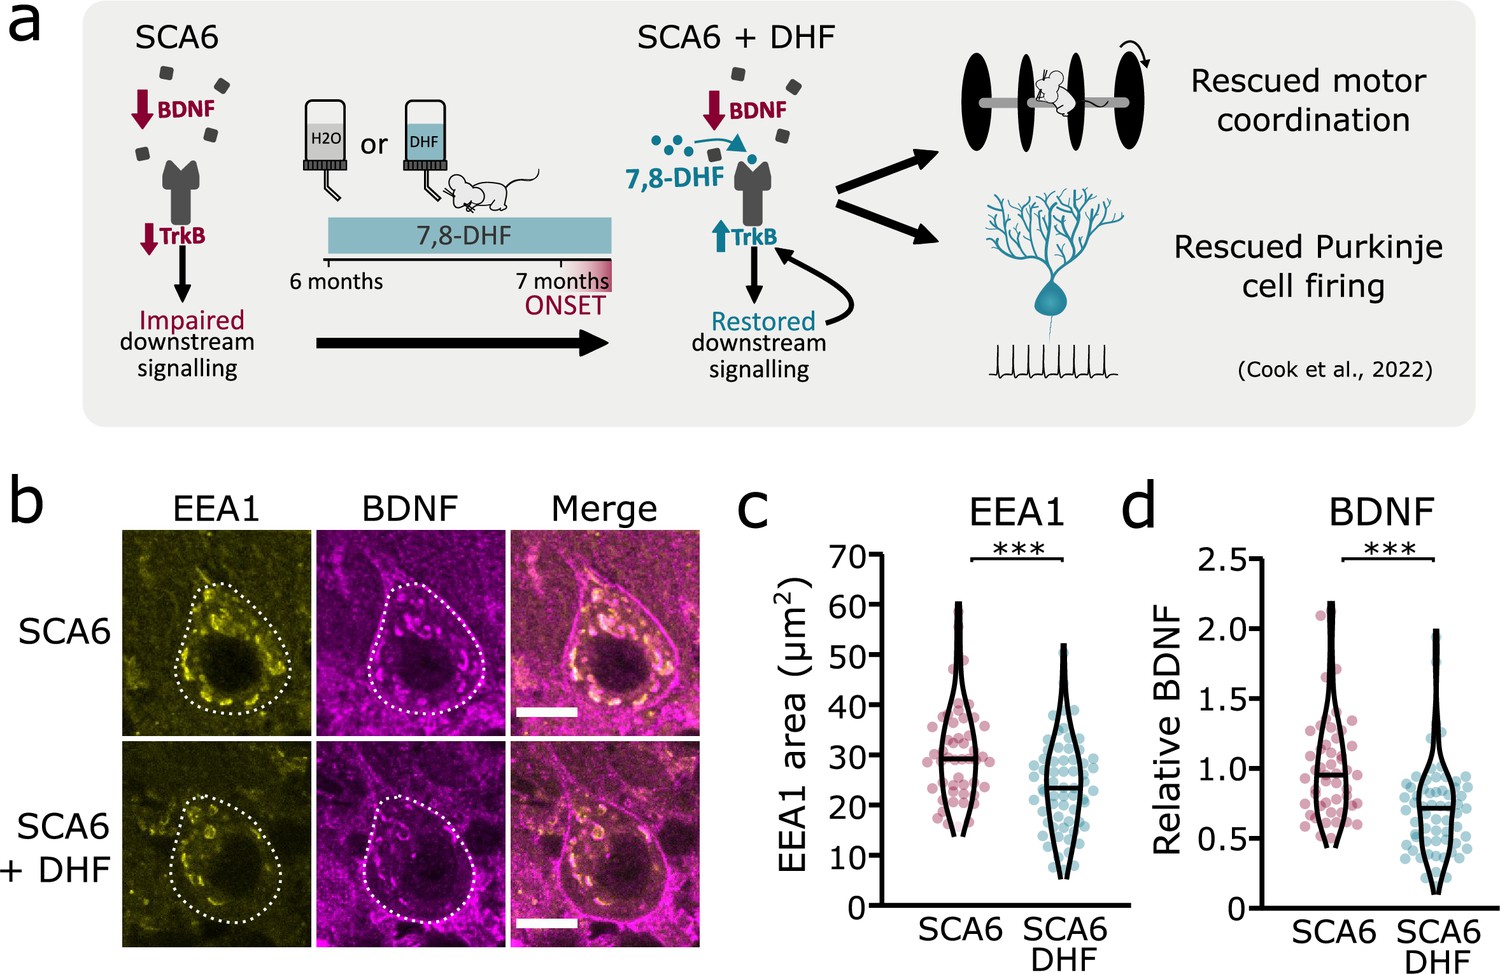
Tropomyosin kinase B (TrkB) activation with 7,8-dihydroxyflavone (7,8-DHF) rescues early endosomes deficits in spinocerebellar ataxia type 6 (SCA6) Purkinje cells.
(a) Schematic showing 7,8-DHF administration to SCA6 mice and the previously described therapeutic benefits of 7,8-DHF in SCA6 mice. (b) Representative images of the early endosome marker EEA1 and brain-derived neurotrophic factor (BDNF) within Purkinje cells (outlined) of the anterior vermis. Scale bar, 10 µm. (c) The area covered by EEA1 staining in Purkinje cells is decreased in SCA6 mice given DHF compared to those that received control water (p < 0.001; Student’s t-test; N = 3 SCA6 mice, 50 cells; 3 SCA6 DHF mice, 63 cells). (d) Relative staining level of BDNF within early endosome compartment is decreased in the Purkinje cells of SCA6 mice that received DHF compared to controls (p < 0.001; Mann–Whitney U-test; N = 3 SCA6 mice, 50 cells; 3 SCA6 DHF mice, 63 cells). ***p < 0.001.
Figure 8
Multiple deficits in the endo-lysosomal system lead to abnormal localization of brain-derived neurotrophic factor (BDNF) and tropomyosin kinase B (TrkB) in the Purkinje cells of spinocerebellar ataxia type 6 (SCA6) mice.
Figure 9 with 2 supplements
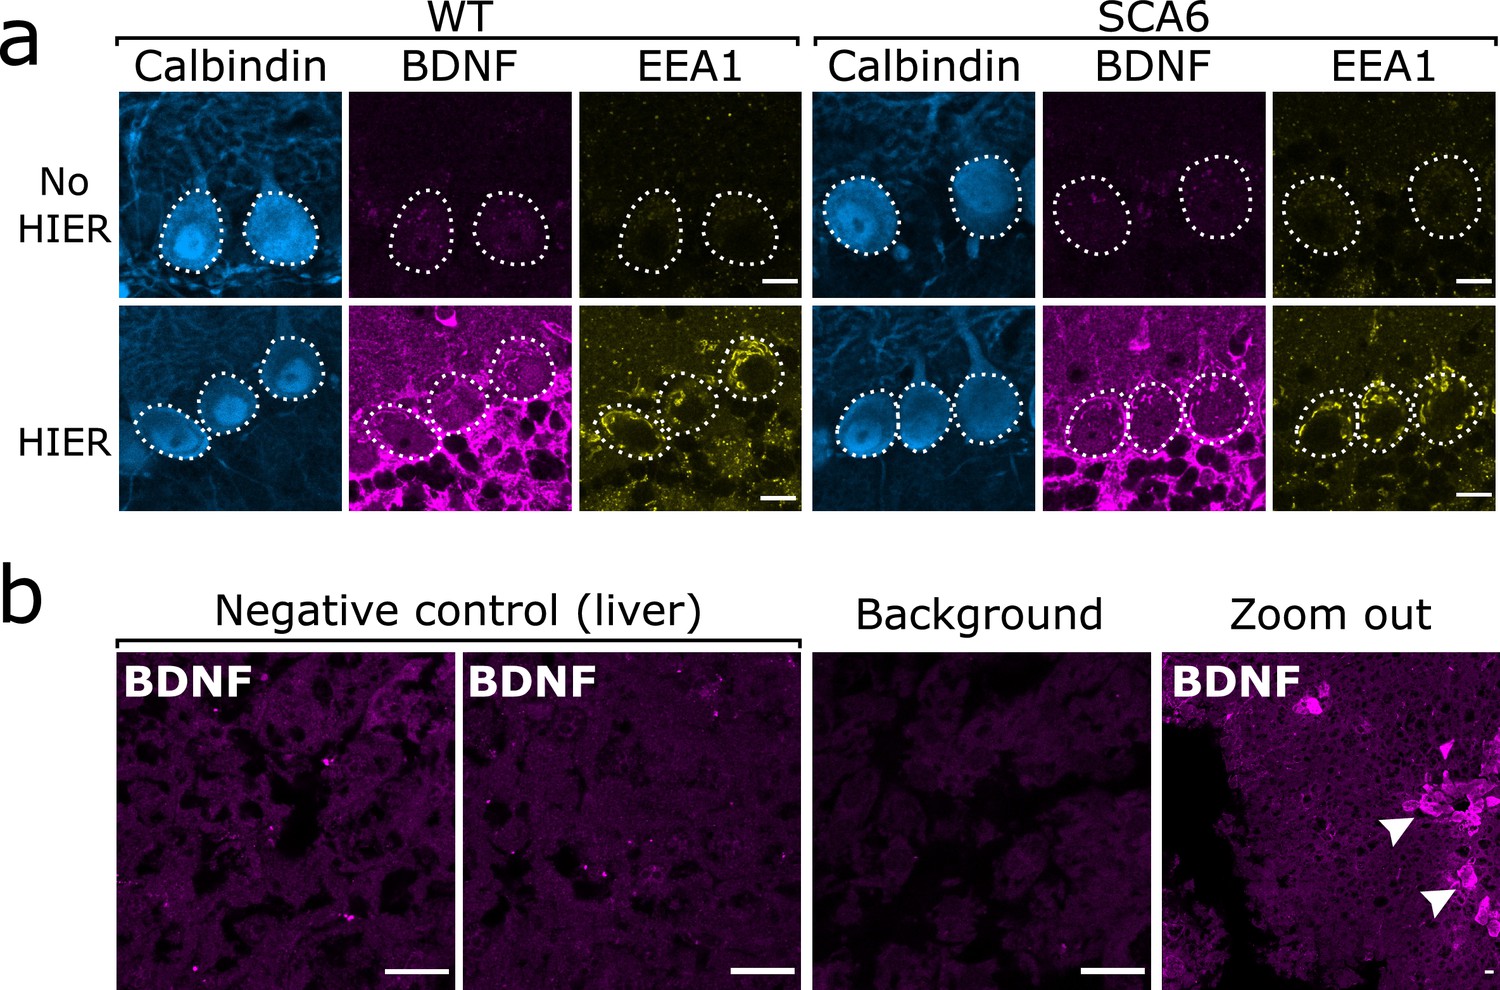
Brain-derived neurotrophic factor (BDNF) immunostaining in the cerebellum requires heat-induced epitope retrieval (HIER) and is not detectable in the majority of liver tissue.
(a) HIER greatly enhances the signal from both BDNF and early endosome antigen 1 (EEA1) staining in cerebellar vermis tissue from wildtype (WT) and spinocerebellar ataxia type 6 (SCA6) mice. Calbindin staining is unaffected. Scale bars, 10 µm. (b) BDNF staining is undetectable in the majority of liver tissue from WT mouse, with only the BDNF-positive putative cholangiocytes (arrowheads) showing immunoreactivity with the BDNF antibody. Background slice was incubated without primary antibody but all other staining steps proceeded as normal. Scale bars, 20 µm.
Figure 9—figure supplement 1
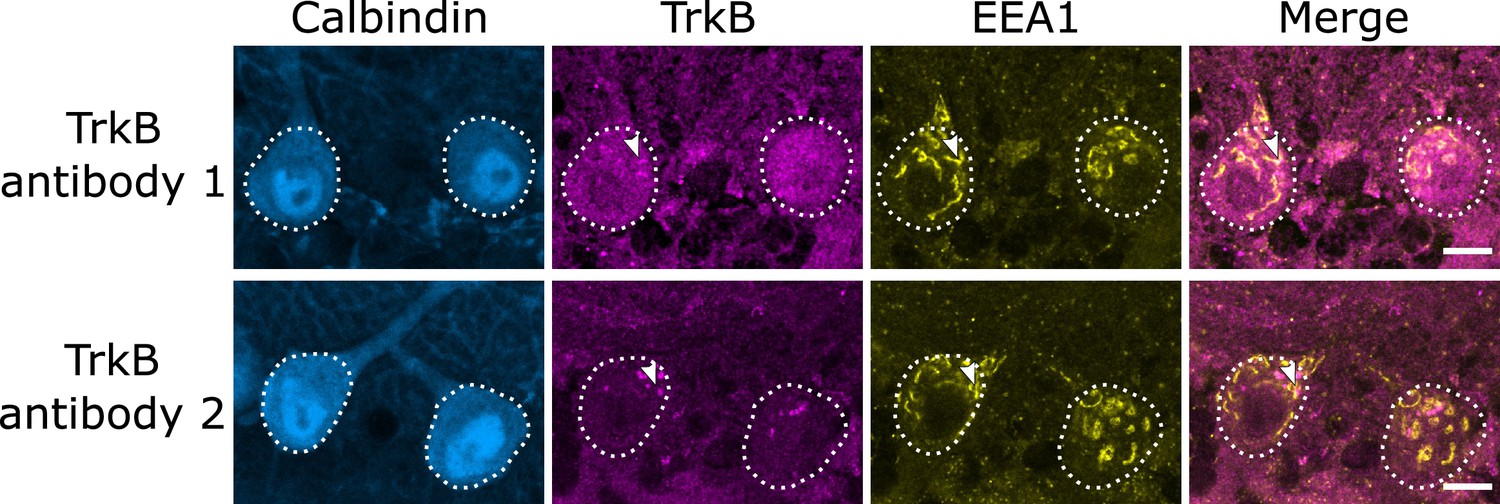
A second tropomyosin kinase B (TrkB) antibody confirms endosomal localization of TrkB.
Comparison of cerebellar vermis slices from the same wildtype (WT) mouse stained in the same batch show similar patterns of staining with two different TrkB antibodies. Arrowheads indicate TrkB colocalization with early endosome antigen 1 (EEA1). Scale bars, 10 µm.
Figure 9—figure supplement 2
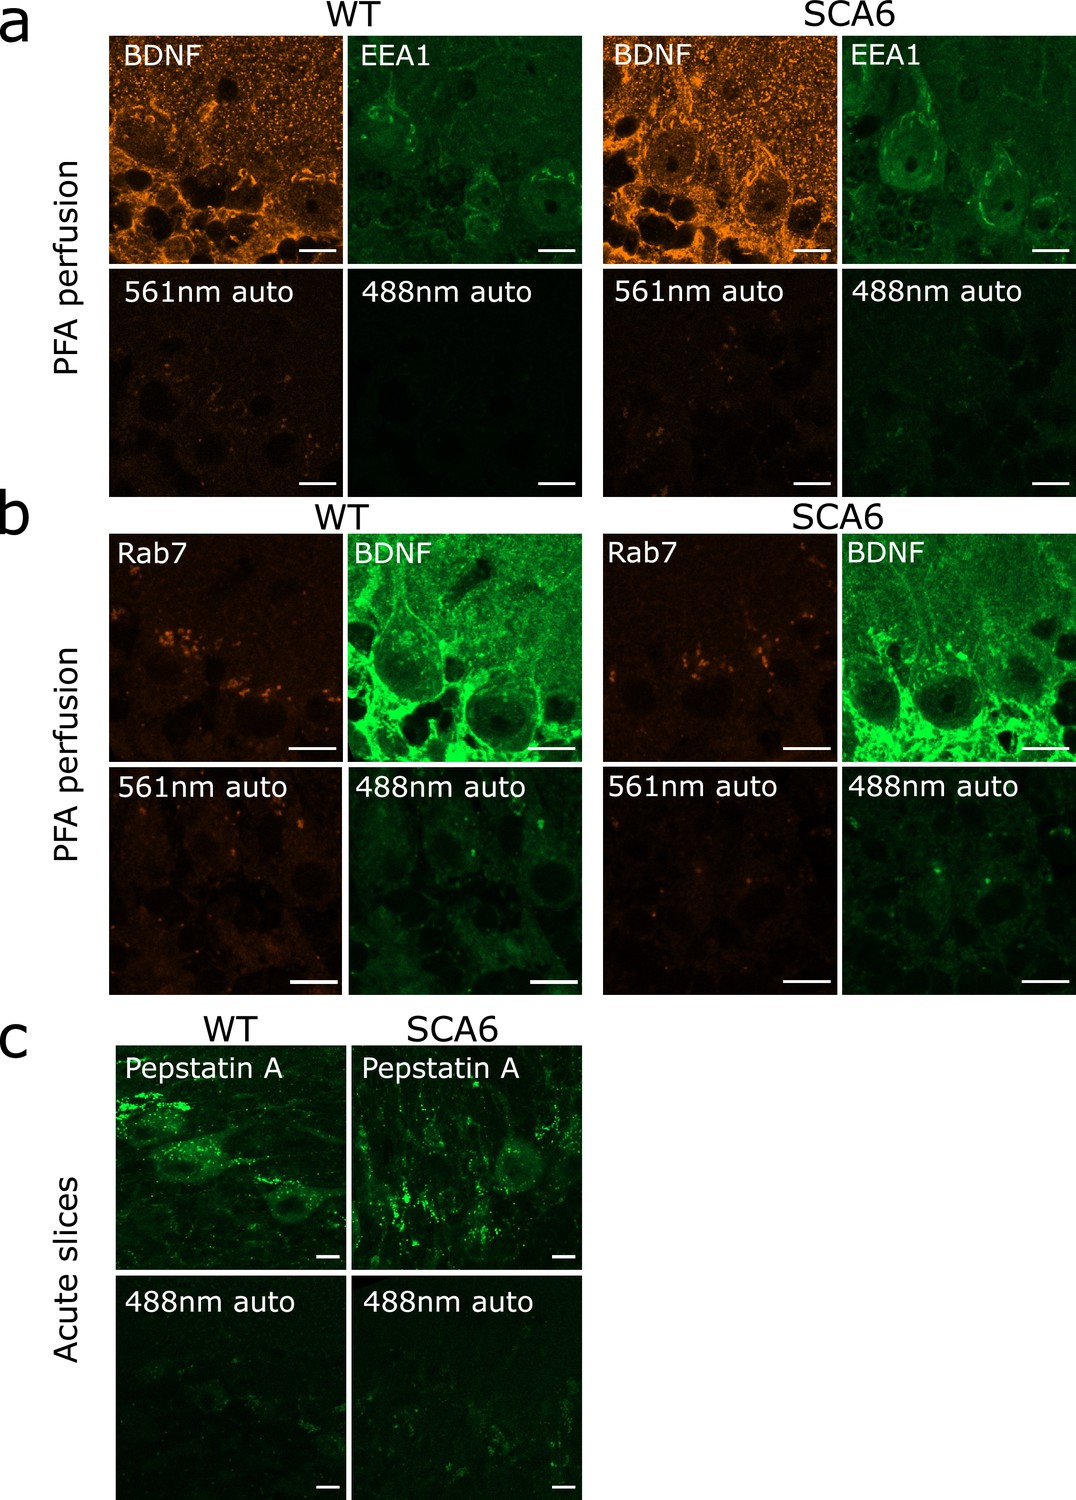
Autofluorescence granules in Purkinje cells do not interfere with endosome identification.
(a) Top row: raw images of brain-derived neurotrophic factor (BDNF) and early endosome antigen 1 (EEA1) staining in anterior vermis. Bottom row: raw images of slices from the same mice with no primary antibody incubation, showing autofluorescence from excitation at 561 and 488 nm. (b) Top row: raw images of Rab7 and BDNF staining in anterior vermis. Bottom row: raw images of slices from the same mice with no primary antibody incubation, showing autofluorescence from excitation at 561 and 488 nm. (c) Top row: raw images of Pepstatin A BODIPY FL incubation on acute slices that were post-fixed in paraformaldehyde (PFA). Bottom row: raw images of slices from the same mice with no Pepstatin A incubation, showing autofluorescence from excitation at 488 nm. Scale bars, 10 µm.
Tables
Table 1
List of differentially expressed genes (DEGs) in Endosome and Lysosome pathways.
| Gene name | Gene ID | Base mean | Log2 fold change | Adjusted p value |
|---|---|---|---|---|
| H2-K1 | ENSMUSG00000061232 | 8985.033 | 0.557 | <0.001 |
| Cst7 | ENSMUSG00000068129 | 66.028 | 1.634 | 0.010 |
| Cd68 | ENSMUSG00000018774 | 761.094 | 0.557 | 0.006 |
| Nsg1 | ENSMUSG00000029126 | 118,453.175 | −0.214 | 0.041 |
| H2-Q7 | ENSMUSG00000060550 | 461.700 | 0.761 | 0.001 |
| Nsg2 | ENSMUSG00000020297 | 17,203.283 | 0.363 | 0.012 |
| Ctsd | ENSMUSG00000007891 | 33,856.962 | 0.382 | <0.001 |
| 2610002M06Rik | ENSMUSG00000031242 | 7455.780 | −0.157 | 0.038 |
| Prkcd | ENSMUSG00000021948 | 15,130.466 | −0.240 | 0.012 |
| Rab38 | ENSMUSG00000030559 | 74.954 | 1.387 | 0.042 |
| Ctss | ENSMUSG00000038642 | 8398.508 | 0.350 | <0.001 |
| Tmem25 | ENSMUSG00000002032 | 16,856.246 | −0.150 | 0.035 |
| Apoe | ENSMUSG00000002985 | 294,918.992 | 0.315 | 0.003 |
| Unc13d | ENSMUSG00000057948 | 1948.570 | −0.298 | 0.025 |
| Cst3 | ENSMUSG00000027447 | 72,853.485 | 0.250 | 0.046 |
| Arl8a | ENSMUSG00000026426 | 23,966.848 | −0.112 | 0.040 |
| Cd63 | ENSMUSG00000025351 | 16,922.196 | 0.306 | 0.003 |
| H2-Q4 | ENSMUSG00000035929 | 1712.362 | 0.637 | <0.001 |
| H2-Q6 | ENSMUSG00000073409 | 605.404 | 0.610 | 0.017 |
| Slc11a1 | ENSMUSG00000026177 | 351.078 | 0.472 | 0.006 |
| Tinagl1 | ENSMUSG00000028776 | 1872.544 | 0.444 | 0.013 |
| Gaa | ENSMUSG00000025579 | 42,288.649 | 0.148 | 0.046 |
| Npc2 | ENSMUSG00000021242 | 13,576.144 | 0.252 | 0.005 |
| Cpq | ENSMUSG00000039007 | 3671.835 | 0.301 | 0.043 |
| Naga | ENSMUSG00000022453 | 5578.299 | 0.171 | 0.009 |
| Man2b2 | ENSMUSG00000029119 | 5625.125 | 0.227 | 0.008 |
| Gfap | ENSMUSG00000020932 | 49,633.449 | 0.670 | <0.001 |
| Hexb | ENSMUSG00000021665 | 11,580.391 | 0.325 | 0.001 |
| Lipa | ENSMUSG00000024781 | 3011.385 | 0.339 | 0.003 |
| Meak7 | ENSMUSG00000034105 | 1681.762 | 0.255 | 0.012 |
| Ifi30 | ENSMUSG00000031838 | 755.863 | 0.547 | <0.001 |
| Trip10 | ENSMUSG00000019487 | 1776.641 | 0.312 | 0.029 |
| Borcs8 | ENSMUSG00000002345 | 2644.624 | −0.392 | <0.001 |
| Myo7a | ENSMUSG00000030761 | 5484.873 | 0.552 | <0.001 |
| Syt7 | ENSMUSG00000024743 | 66,668.649 | −0.232 | 0.001 |
| Gusb | ENSMUSG00000025534 | 2558.973 | 0.185 | 0.017 |
| Rnf19b | ENSMUSG00000028793 | 28,209.761 | −0.243 | 0.038 |
| Ctsc | ENSMUSG00000030560 | 1554.587 | 0.610 | 0.003 |
| Laptm5 | ENSMUSG00000028581 | 2659.155 | 0.278 | 0.006 |
| Acp5 | ENSMUSG00000001348 | 57.183 | 1.434 | 0.004 |
| Inpp5f | ENSMUSG00000042105 | 25,096.641 | −0.158 | 0.005 |
| Rusc1 | ENSMUSG00000041263 | 8435.506 | −0.146 | 0.044 |
| Pld1 | ENSMUSG00000027695 | 1492.635 | 0.305 | 0.013 |
| Ticam2 | ENSMUSG00000056130 | 58.459 | 1.110 | 0.010 |
| Rassf9 | ENSMUSG00000044921 | 702.197 | 0.316 | 0.017 |
| Mr1 | ENSMUSG00000026471 | 1753.049 | 0.342 | 0.006 |
| Ece1 | ENSMUSG00000057530 | 21,877.619 | −0.213 | 0.007 |
| Sh3gl3 | ENSMUSG00000030638 | 1097.889 | 0.255 | 0.046 |
| Ptprf | ENSMUSG00000033295 | 6447.473 | 0.311 | 0.032 |
| Washc2 | ENSMUSG00000024104 | 71,355.731 | −0.263 | 0.033 |
| Syndig1 | ENSMUSG00000074736 | 15,931.471 | −0.199 | 0.019 |
| Pld4 | ENSMUSG00000052160 | 865.562 | 0.329 | 0.046 |
| Ackr4 | ENSMUSG00000079355 | 668.906 | 0.813 | <0.001 |
| Unc93b1 | ENSMUSG00000036908 | 1732.922 | 0.268 | 0.014 |
| Rab11a | ENSMUSG00000004771 | 12,908.215 | −0.146 | 0.028 |
| Rnd2 | ENSMUSG00000001313 | 14,349.243 | 0.181 | 0.030 |
| H2-Ab1 | ENSMUSG00000073421 | 394.199 | 0.802 | 0.005 |
| Pacsin1 | ENSMUSG00000040276 | 65,047.878 | −0.166 | 0.017 |
| Ackr3 | ENSMUSG00000044337 | 1329.920 | 0.292 | 0.032 |
| Snap25 | ENSMUSG00000027273 | 334,660.707 | −0.225 | 0.005 |
| Map2k1 | ENSMUSG00000004936 | 25,321.319 | −0.117 | 0.046 |
| Cd22 | ENSMUSG00000030577 | 81.223 | 0.856 | 0.003 |
| Nrp1 | ENSMUSG00000025810 | 1247.448 | 0.283 | 0.042 |
| Kcnj11 | ENSMUSG00000096146 | 7056.627 | −0.188 | 0.025 |
| Fcgrt | ENSMUSG00000003420 | 4913.386 | 0.239 | 0.013 |
| Dgkh | ENSMUSG00000034731 | 13,465.118 | −0.264 | 0.022 |
| Bsg | ENSMUSG00000023175 | 98,426.046 | 0.221 | 0.048 |
| Rnf128 | ENSMUSG00000031438 | 4114.551 | −0.181 | 0.016 |
| Stambpl1 | ENSMUSG00000024776 | 2576.502 | −0.196 | 0.023 |
| Cpne6 | ENSMUSG00000022212 | 2074.575 | 0.537 | 0.003 |
| Ccr5 | ENSMUSG00000079227 | 417.390 | 0.454 | 0.030 |
| Dagla | ENSMUSG00000035735 | 19,804.120 | −0.336 | 0.012 |
| Zfyve21 | ENSMUSG00000021286 | 2110.324 | 0.191 | 0.021 |
| Dner | ENSMUSG00000036766 | 118,667.368 | −0.372 | <0.001 |
| Grb14 | ENSMUSG00000026888 | 2737.028 | 0.223 | 0.030 |
| Scoc | ENSMUSG00000063253 | 12,593.242 | −0.778 | <0.001 |
| Mrc1 | ENSMUSG00000026712 | 489.484 | 0.466 | 0.045 |
| Epn3 | ENSMUSG00000010080 | 4581.906 | 0.446 | 0.009 |
| Gfra1 | ENSMUSG00000025089 | 1244.452 | 0.557 | 0.006 |
| Tpd52l1 | ENSMUSG00000000296 | 1312.485 | 0.471 | 0.033 |
| Vcam1 | ENSMUSG00000027962 | 3713.941 | 0.429 | <0.001 |
| Spns2 | ENSMUSG00000040447 | 9562.590 | −0.159 | 0.029 |
Table 2
List of antibodies.
| Antigen | Antibody (host) | Supplier | Catalog # | Dilution | Figure |
|---|---|---|---|---|---|
| EEA1 | Anti-EEA1 monoclonal (mouse) | Sigma | E7659 | 1:500 | 2, 7, 9 |
| BDNF | Anti-BDNF monoclonal (rabbit) | Abcam | ab108319 | 1:500 | 2, 4, 7, 9 |
| TrkB | Anti-TrkB polyclonal (rabbit) | EMD Millipore | ab9872 | 1:500 | 2, 3, 9 |
| Stx13 | Anti-Stx13 polyclonal (goat) | R&D Systems | AF6617 | 1:500 | 3 |
| Calbindin | Anti-calbindin polyclonal (guinea pig) | Synaptic Systems | 214 004 | 1:500 | 2, 3, 6, 9 |
| Rab7 | Anti-Rab7 monoclonal (mouse) | Cell Signaling Technology | 95746 | 1:400 | 4 |
| Calbindin | Anti-calbindin monoclonal (mouse) | Swant | 300 | 1:500 | 5 |
| Lamp1 | Anti-Lamp1 monoclonal (rat) | DSHB (University of Iowa)* | 1D4B | 1:400 | 5, 6 |
| Stx13 | Anti-Stx13 polyclonal (rabbit) | Synaptic systems | 110 133 | 1:150 | Figure 3—figure supplement 1 |
| TrkB | Anti-TrkB polyclonal (rabbit) | Abcam | ab18987 | 1:500 | 9 |
| Anti-mouse secondary | Alexa 488 anti-mouse | Jackson Immunoresearch | AB_2338840 | 1:1000 | 2, 7, 9 |
| Anti-rabbit secondary | Alexa 594 anti-rabbit | Jackson Immunoresearch | AB_2340621 | 1:1000 | 2, 3, 7, 9 |
| Anti-mouse secondary | Alexa 594 anti-mouse | Jackson Immunoresearch | AB_2338871 | 1:1000 | 4 |
| Anti-rabbit secondary | Alexa 488 anti-rabbit | Jackson Immunoresearch | AB_2313584 | 1:1000 | 4 |
| SAnti-rat secondary | Alexa 488 anti-rat | Invitrogen | AB_2313584 | 1:1000 | 5 |
| Anti-goat secondary | Alexa 488 anti-goat | Jackson Immunoresearch | AB_2340428 | 1:1000 | 3 |
| Anti-mouse secondary | DyLight 405 anti-mouse | Invitrogen | 35501BID | 1:500 | 5 |
| Anti-guinea pig secondary | DyLight 405 anti-goat | Jackson Immunoresearch | AB_2340426 | 1:500 | 2, 3, 6, 9 |
-
*
The LAMP-1 monoclonal antibody was obtained from the Developmental Studies Hybridoma Bank, created by the NICHD of the NIH and maintained at The University of Iowa, Department of Biology, Iowa City, IA 52242. It was deposited to the DSHB by August, J.T.
Additional files
Download links
A two-part list of links to download the article, or parts of the article, in various formats.
Downloads (link to download the article as PDF)
Open citations (links to open the citations from this article in various online reference manager services)
Cite this article (links to download the citations from this article in formats compatible with various reference manager tools)
Endosomal dysfunction contributes to cerebellar deficits in spinocerebellar ataxia type 6
eLife 12:RP90510.
https://doi.org/10.7554/eLife.90510.3


