Inhibition of CERS1 in skeletal muscle exacerbates age-related muscle dysfunction
- Laboratory of Integrative Systems Physiology, École Polytechnique Fédérale de Lausanne, Switzerland
- Metabolomics Platform, Faculty of Biology and Medicine, University of Lausanne (UNIL), Switzerland
- Bioimaging and optics platform, École polytechnique fédérale de Lausanne (EPFL), Switzerland
- School of Chemistry, University of New South Wales Sydney, Australia
- Cellular Bioenergetics Laboratory, Victor Chang Cardiac Research Institute, Australia
- School of Biomedical Sciences, University of New South Wales Sydney, Australia
Figures
Figure 1 with 1 supplement
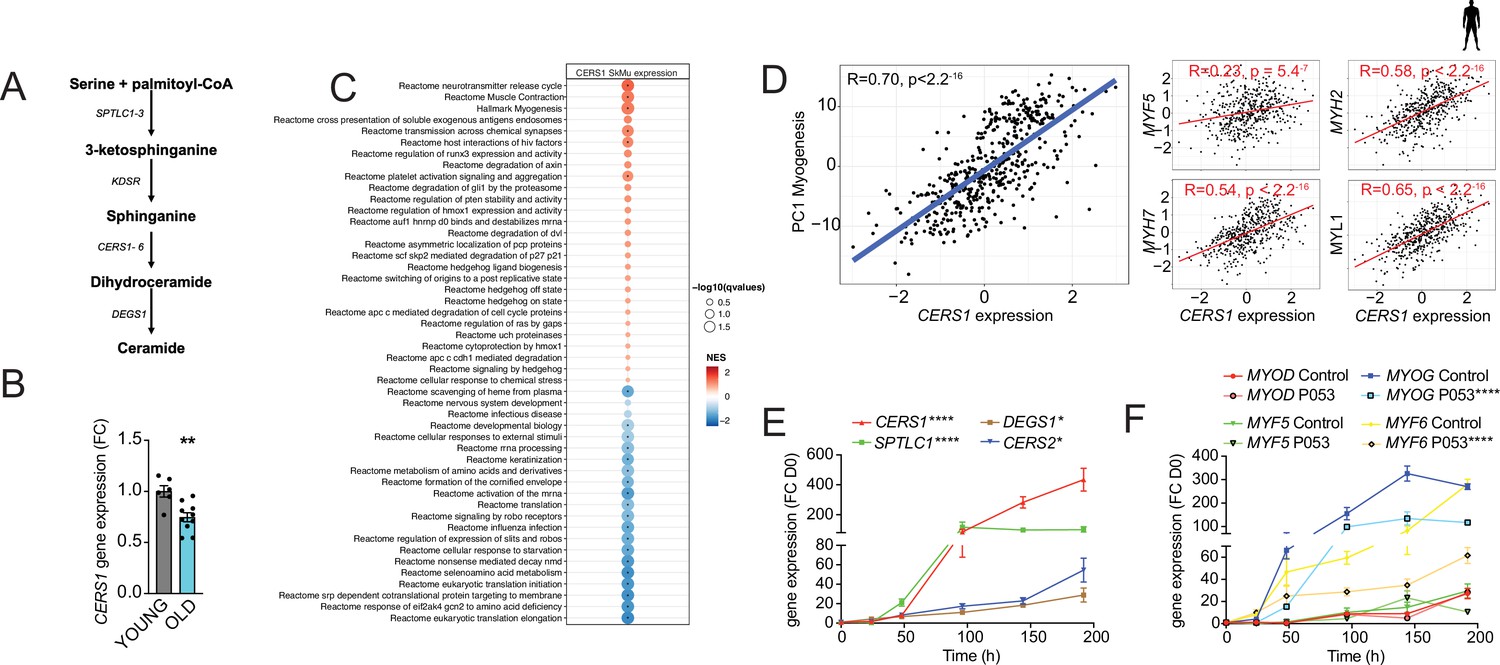
CERS1-correlated pathways in human skeletal muscle associate with muscle function and myogenesis.
(A) Overview over the de novo sphingolipid biosynthesis pathway. (B) CERS1 expression in young (22±3.61 yo) and old (74±8.4 yo) human skeletal muscle cells (n=3–5 biological replicates). (C) Gene set enrichment analysis of CERS1 mRNA correlated transcripts in the human skeletal muscle from the Genotype-Tissue Expression (GTEx) dataset (n=469). Normalized effect size (NES). (D) Spearman correlation between skeletal muscle expression of CERS1 and the first principal component (PC1) of the myogenesis pathway (left) from (C) and expression of key genes involved in myogenesis (right). (E–F) Gene expression of enzymes involved in the sphingolipid de novo synthesis pathway (E) and myogenic regulatory factors (F) upon horse serum induced differentiation of primary human skeletal muscle cells (n=2–3 biological replicates). The pharmacological inhibitor P053 or DMSO was used at 1 uM in (E–F). Data: mean ± SEM. Unpaired Student’s t-test and two-way ANOVA determined significance. *p<0.05, **p<0.01, ****p<0.0001.
Figure 1—figure supplement 1

Cers1 regulates muscle contraction in human muscle and myoblast maturation.
(A) Spearman correlation between skeletal muscle expression of CERS1 and the first principal component (PC1) of the muscle contraction pathway (left) and expression of key genes involved in muscle contraction (right). (B) Gene expression of enzymes involved in the sphingolipid de novo synthesis pathway upon horse serum induced differentiation of mouse C2C12 myoblasts (n=3–4). (C–D) Ceramide levels during myogenic differentiation of (C) mouse C2C12 myoblasts (n=3–4) and (D) human primary skeletal muscle cells (n=2–3). (E) Gene expression of myogenic regulatory factors upon horse serum induced differentiation of mouse C2C12 myoblasts (n=3–4). (F–G) Gene expression of myosin light- and heavy chains upon horse serum induced differentiation of isolated human primary myoblasts (n=2–3 biological replicates) (F) and mouse C2C12 (n=3–4) muscle cells (G) upon horse serum induced myoblast differentiation. P053 or DMSO was used at 1 uM in (E–G). Data: mean ± SEM. Two-way ANOVA determined significance. **p<0.01, ***p<0.001, ****p<0.0001.
Figure 2 with 1 supplement
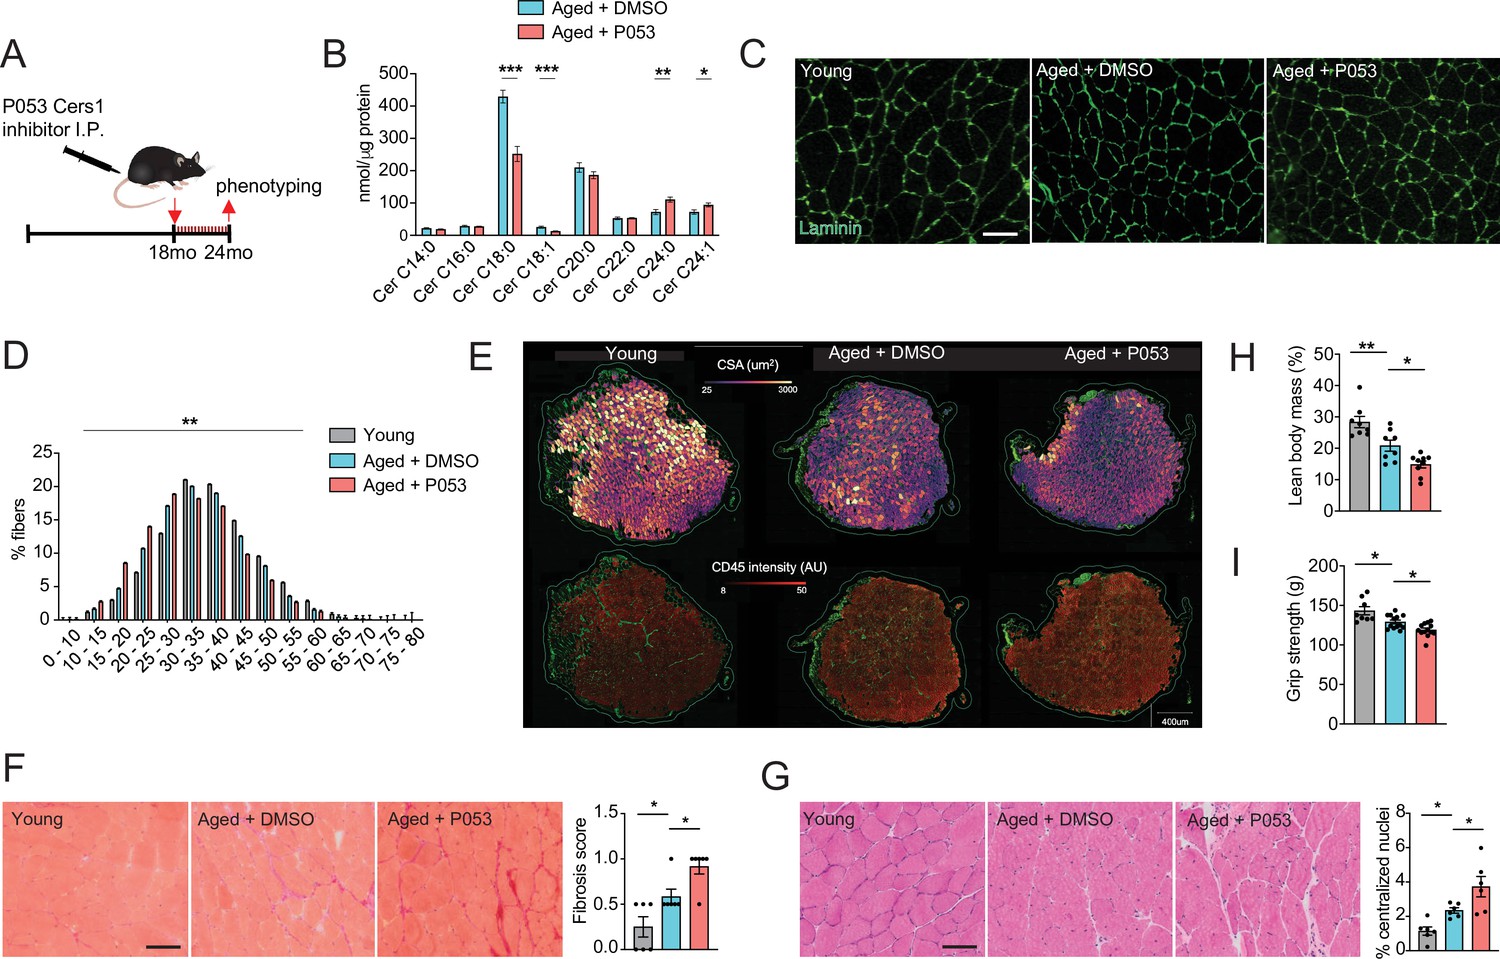
P053 administration inhibiting Cers1 in aged mice deteriorates skeletal muscle function and morphology.
(A) Overview over the experimental pipeline that was used to administer P053 in aged C57BL/6 J mice using intraperitoneal injections (I.P) three times a week for 6 months. (B) Skeletal muscle ceramide levels in aged mice treated with DMSO or P053 (n=7–8 per group). (C) Representative images of laminin-stained tibialis anterior of young control or mice injected with DMSO or P053 (n=5–6 per group). Scale bar, 50 µM. (D) Quantification of minimal Ferret diameter distribution in skeletal muscle cross-sections from young control or mice injected with DMSO or P053 (n=5–6 per group). (E) Automated detection of laminin/CD45+ stained muscle fibers from young control or aged mice injected with DMSO or P053 showing cross-sectional area (top) and inflammation-adjacent signal intensities (bottom). (F) Representative brightfield images and quantification of Sirus red stained muscle sections from young and aged mice treated with DMSO or P053 (n=6 per group). (G) Representative brightfield images and quantification of muscle cross-sections from young and aged mice treated with DMSO or P053 stained with hematoxylin/eosin (n=6 per group). (H–I) Phenotyping measurements of young control and aged mice injected with DMSO or P053 showing (H) lean body mass and (I) grip strength (n=7–14 per group). Data: mean ± SEM. Unpaired Student’s t-test and one-way ANOVA determined significance. *p<0.05, **p<0.01, ***p<0.001.
Figure 2—figure supplement 1
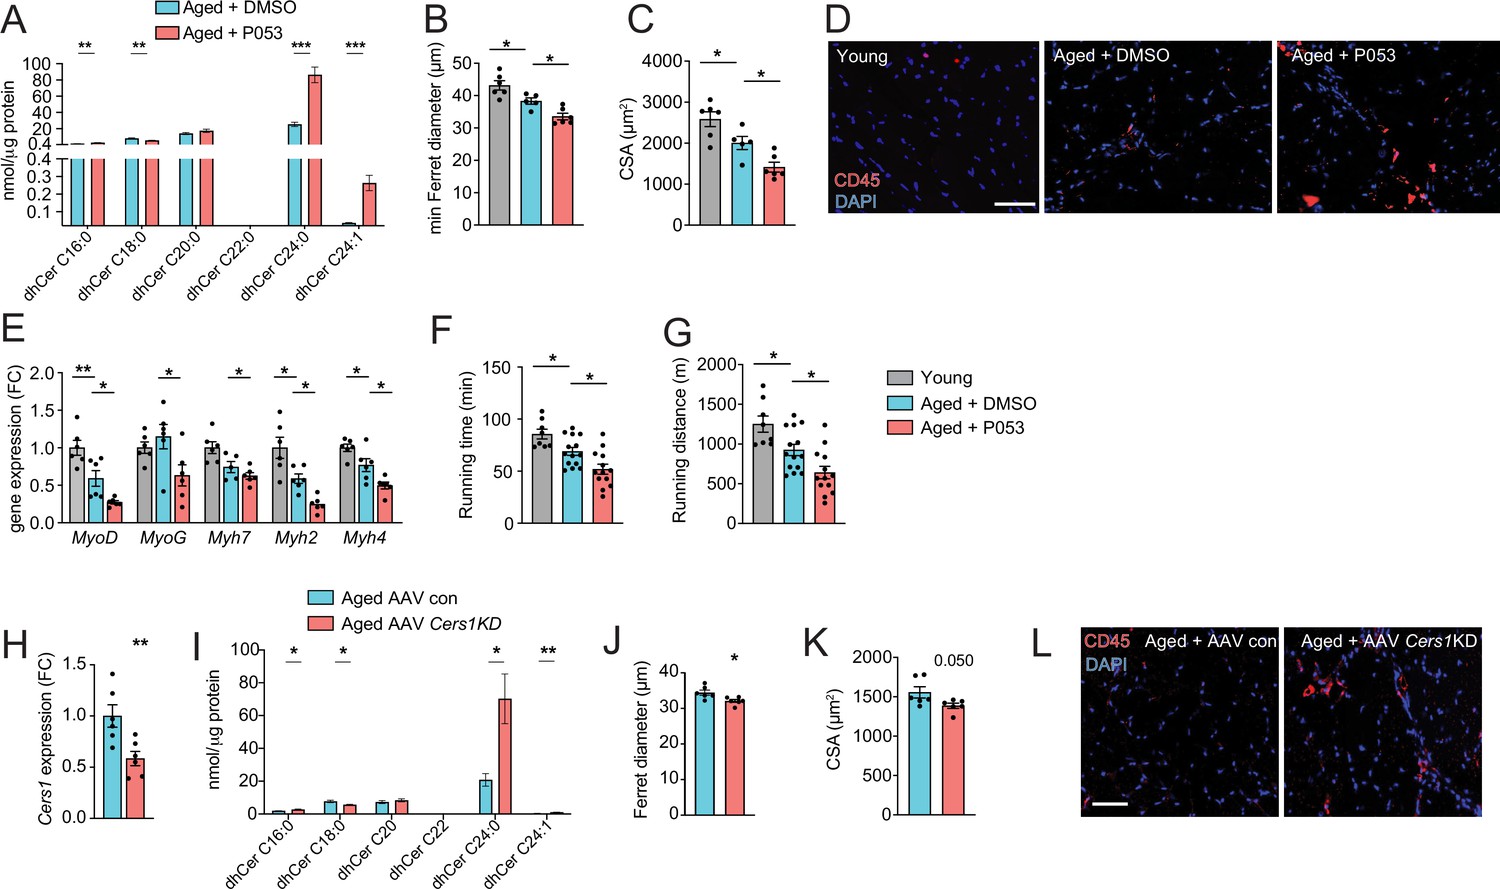
Cers1 inhibition exacerbates mouse skeletal muscle aging.
(A) Skeletal muscle dihydroceramide levels in aged mice treated with DMSO or P053 (n=7–8 per group). (B) Average minimal Ferret diameter in muscle of young and aged mice treated with DMSO or P053 (n=5–6 per group). (C) Quantification of muscle cross-sectional area in young and aged mice treated with DMSO or P053 (n=5–6 per group). (D) Representative immunohistochemistry images of muscle cross-sections from young and aged mice treated with DMSO or P053 stained with DAPI and CD45 (n=5–6 per group). Scale bar, 50 µM. (E) Gene expression in young or aged muscle of mice treated with DMSO or P053 (n=5–6 per group). (F–G) Phenotyping of young control and aged mice injected with DMSO or P053 showing running time (F), and running distance (G) (n=7–14 per group). (H) Cers1 RNA expression in aged mouse muscle intramuscularly injected with scramble, or shRNA targeting Cers1 (n=6 per group). (I) Dihydroceramide levels in gastrocnemius muscle injected with AAV9 particles containing scramble, or shRNA targeting Cers1 (n=6–8 per group). (J) Average Ferret diameter in skeletal muscle of aged mice intramuscularly injected with scramble, or shRNA targeting Cers1 (n=6 per group). (K) Quantification of cross-sectional area in aged mice treated with AAV9-shRNA Cers1 (n=6 per group). (L) Representative immunohistochemistry images of muscle cross-sections of CD45-stained muscle from mice intramuscularly injected with AAV9 particles containing scramble, or shRNA targeting Cers1 (n=6 per group). Data: mean ± SEM. Unpaired Student’s t-test and one-way ANOVA determined significance. *p<0.05, **p<0.01, ***p<0.001.
Figure 3 with 1 supplement
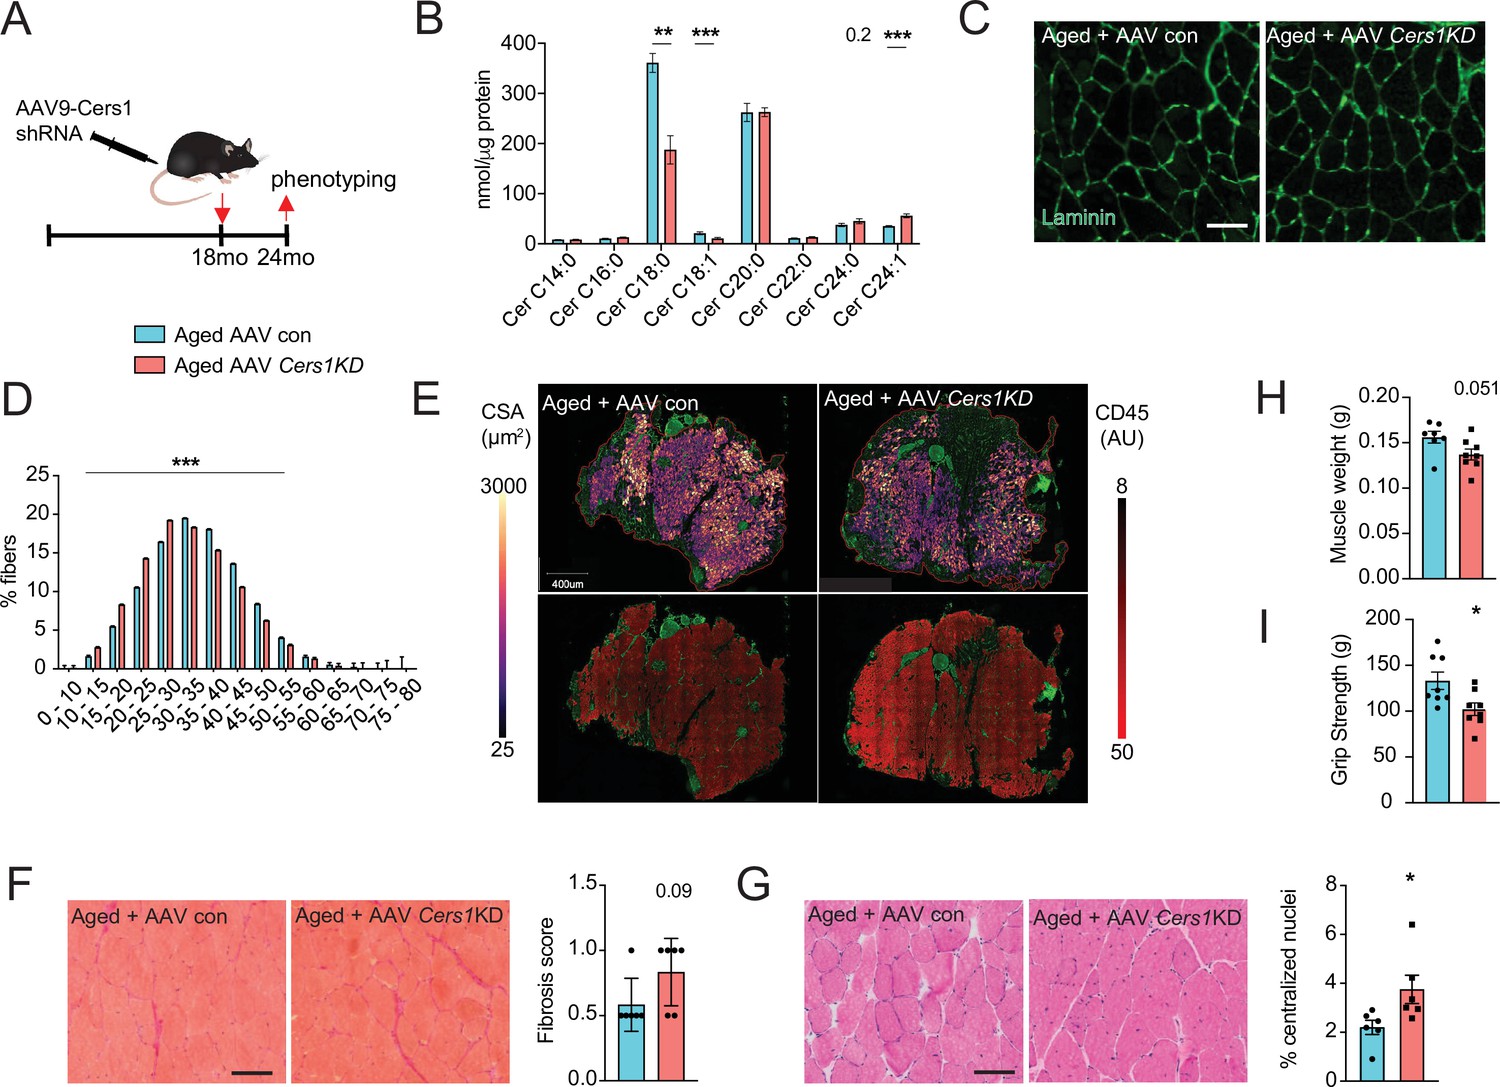
Adeno-associated virus 9 (AAV9)-mediated knockdown of Cers1 expression in aged skeletal muscle reduces skeletal muscle function and morphology.
(A) Schematic showing a single gastrocnemius intramuscular injection of adeno-associated virus particles containing short hairpin RNA against Cers1 in aged C57BL/6 J mice. (B) Skeletal muscle ceramide levels in aged mice intramuscularly injected with shRNA targeting Cers1 (n=6–8). (C) Representative images of laminin-stained aged mice muscle cross-sections intramuscularly injected with shRNA targeting Cers1 (n=6 per group). Scale bar, 50 µM. (D) Quantification of minimal Ferret diameter distribution in aged mice intramuscularly injected with shRNA targeting Cers1 (n=6 per group). (E) Automated detection of laminin/CD45+ stained skeletal muscle fibers from aged mice intramuscularly injected with shRNA-Cers1 showing cross-sectional area (top) and inflammation-adjacent signal intensities (bottom). (F) Representative brightfield images and quantification of Sirus red stained skeletal muscle cross-sections from mice intramuscularly injected with AAV9 particles containing scramble, or shRNA targeting Cers1 (n=6 per group). (G) Representative brightfield images and quantification of hematoxylin/eosin-stained muscle cross-sections from mice intramuscularly injected with AAV9 particles containing scramble, or shRNA targeting Cers1 (n=6 per group). (H–I) Phenotyping measurements of aged mice intramuscularly injected with shRNA-Cers1 or a scramble shRNA with (H) gastrocnemius muscle weight and (I) grip strength (n=6–8 per group). Data: mean ± SEM. Unpaired Student’s t-test determined significance. *p<0.05, **p<0.01, ***p<0.001.
Figure 3—figure supplement 1
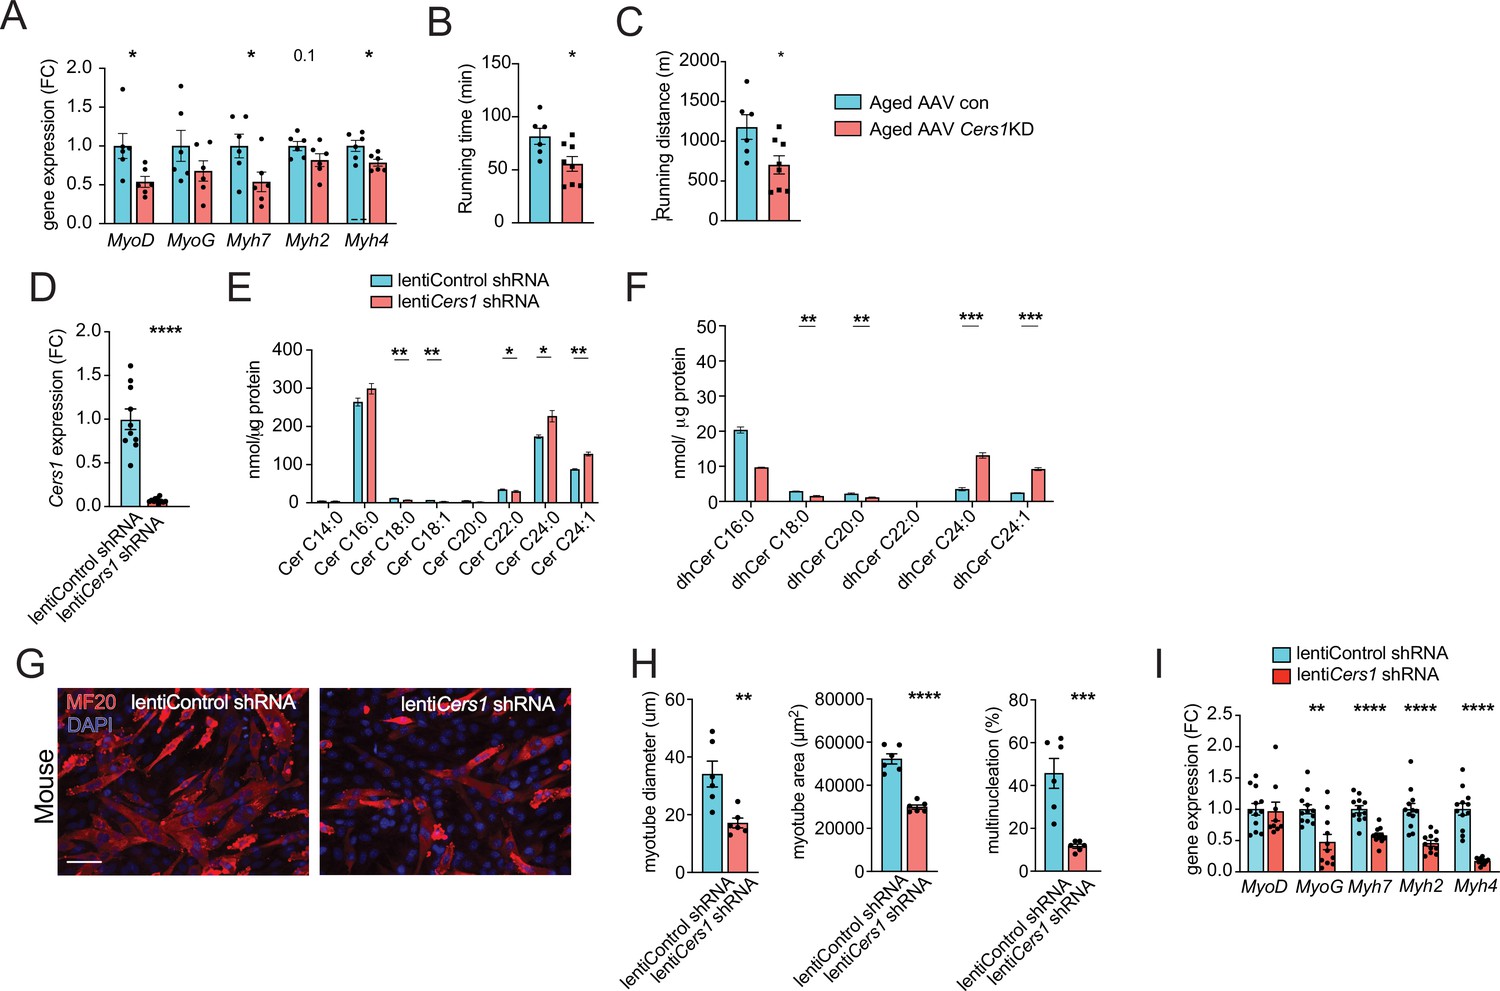
Cers1 silencing deteriorates age-related running, ceramides and blunts myogenesis in myoblasts.
(A) Muscle gene expression in of mice intramuscularly injected with AAV9 particles containing scramble, or shRNA targeting Cers1 (n=6 per group). (B–C) Phenotyping measurements of aged mice intramuscularly injected with shRNA-Cers1 shows running time (B) and running distance (C) (n=6–8 per group). (D) Cers1 gene expression in C2C12 mouse muscle cells transduced with lentivirus containing scramble, or shRNA targeting Cers1 (n=5–6 biological replicates per group). (E) C2C12 myoblast ceramide levels upon lentivirus mediated silencing of Cers1 (n=3 per group). (F) Dihydroceramide levels in C2C12 cells transduced with lentivirus containing shRNA targeting Cers1 (n=3 per group). (G) Representative immunocytochemistry images of differentiating C2C12 muscle cells deficient of Cers1 (n=6 per group). Scale bar, 50 µM. (H) Quantification of (G) showing myotube diameter (left), myotube area (middle) and % of multinucleated myotubes (right) in C2C12 cells transduced with lentivirus containing scramble, or shRNA targeting Cers1 (n=6 per group). (I) Gene expression profiling of differentiating C2C12 muscle cells deficient of Cers1 (n=8–12 per group). Data: mean ± SEM. Unpaired Student’s t-test determined significance. *p<0.05, **p<0.01, ***p<0.001, ****p<0.0001.
Figure 4 with 1 supplement

Inhibition of Cers1 in muscle cells impairs myogenic differentiation and C. elegans healthspan.
(A) Primary human skeletal muscle cell ceramide levels infected with adenovirus containing silencing RNA targeting CERS1 (n=5–6 per group). (B) Representative confocal immunocytochemistry images of differentiating human primary muscle cells deficient of CERS1 (n=4 per group, left). Scale bar, 50 µM. (C) Gene expression profiling of differentiating human primary muscle cells deficient of CERS1 (n=4–5 per group, right). (D) Traveled distance in C. elegans treated with DMSO, 50uM P053 or 100uM P053 (n=40–57 per group). (E) Representative confocal muscle images of RW1596 C. elegans (myo3p-GFP) treated with DMSO or 100uM P053 (n=6 per group). (F) Traveled distance in C. elegans (myo3p-GFP) treated with EV control, or RNAi against lagr-1 (n=46–56 per group). (G) Representative confocal muscle images of RW1596 C. elegans (myo3p-GFP) treated with control, or RNAi against lagr-1 (n=6 per group). (H) Lifespan of C. elegans treated with control, or 100uM P053 (n=144–147 per group). Data: mean ± SEM. Unpaired Student’s t-test, ANOVAs and log-ranked Mantel-Cox determined significance. *p<0.05, **p<0.01, ***p<0.001, ****p<0.0001.
Figure 4—figure supplement 1
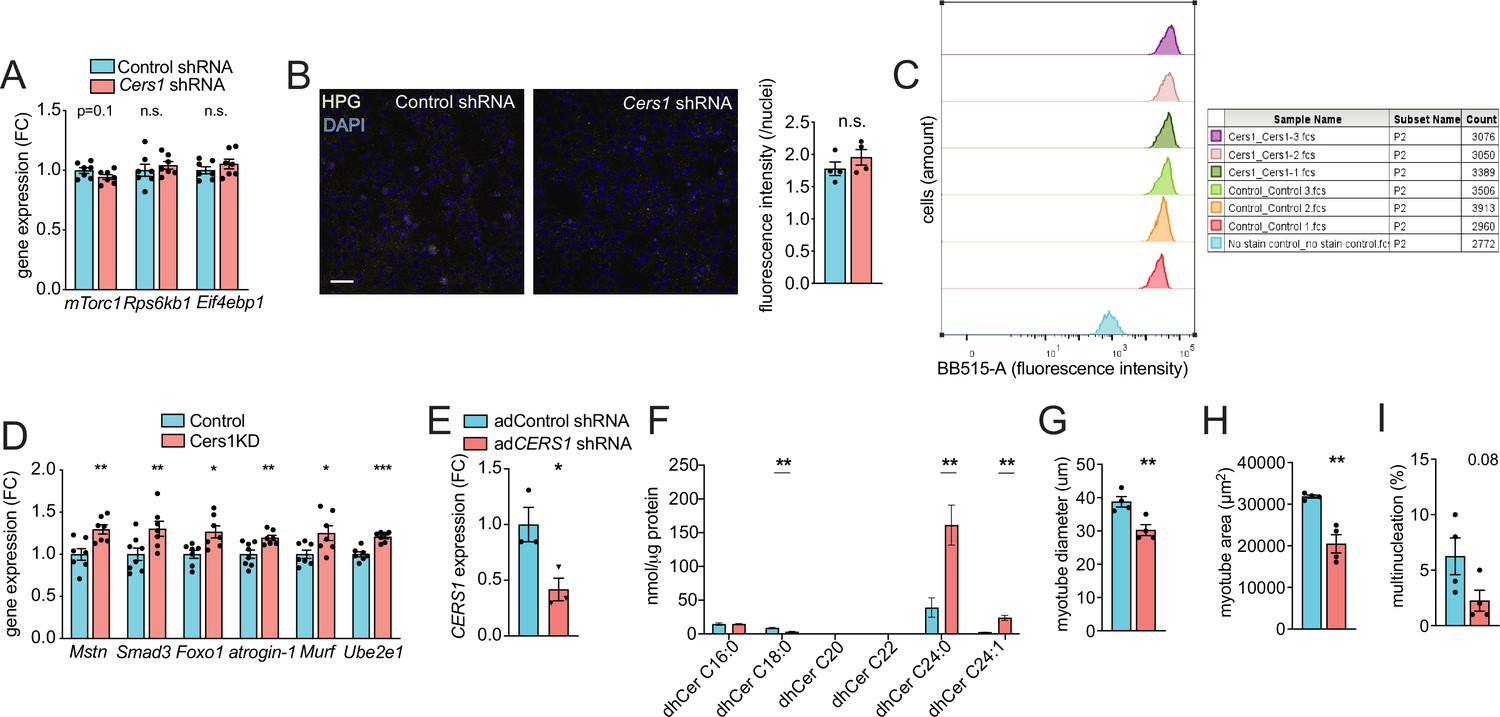
Adenovirus-mediated silencing of CERS1 reduces ceramides and blunts myogenesis in human muscle cells.
(A) Normalized gene expression of transcripts related to protein synthesis in scramble control and Cers1 deficient differentiating myoblasts (n=7). (B) Representative confocal immunocytochemistry images of scramble control and Cers1 deficient, differentiating myoblasts incubated with the Click-iT HPG dye to capture protein synthesis with quantification (n=4). Scale bar, 50 µm. (C) Fluorescence-activated cell sorting of scramble control and Cers1-deficient differentiating myoblasts incubated with the Click-iT HPG dye, to score for protein synthesis. (D) Normalized gene expression of transcripts related to protein degradation in scramble control and Cers1 deficient, differentiating myoblasts (n=7 per group). (E) CERS1 gene expression in isolated primary human muscle cells transduced with adenovirus containing scramble, or shRNA targeting CERS1 (n=3 per group). (F) Dihydroceramide levels in differentiated primary human muscle cells transduced with adenovirus containing scramble, or shRNA targeting CERS1 (n=5–6 per group). (G–I) Quantification of myotube diameter (G), myotube area (H), and % of multinucleated myotubes (I) in differentiated primary human muscle cells transduced with adenovirus containing scramble, or shRNA targeting CERS1 (n=4 per group). Data: mean ± SEM. Unpaired Student’s t-test determined significance. *p<0.05, **p<0.01, ***p<0.001.
Figure 5 with 1 supplement
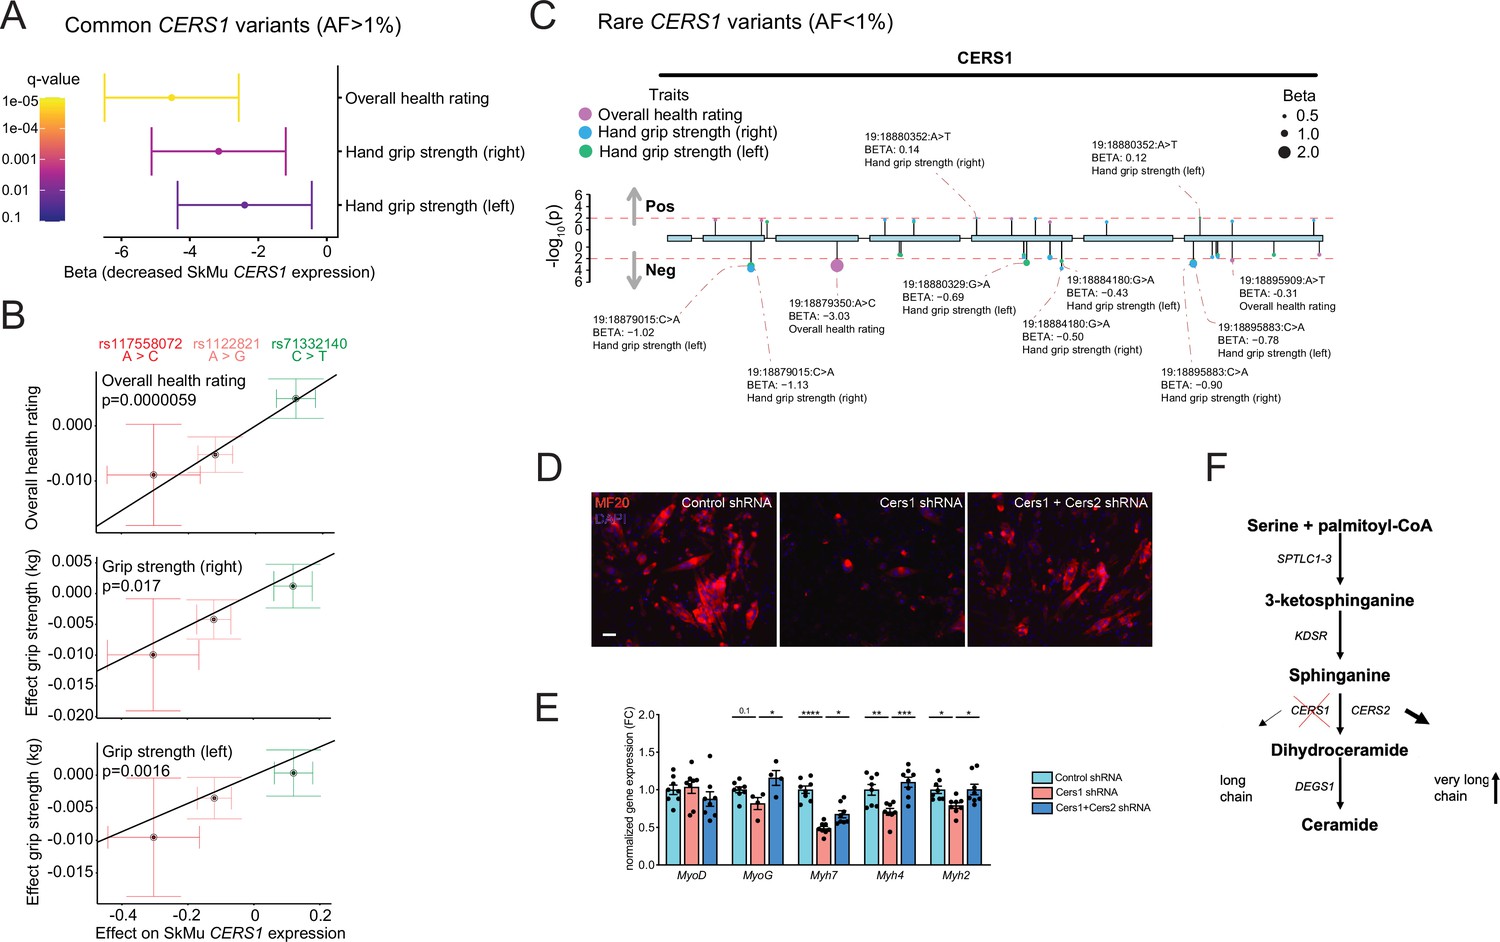
Common and rare genetic variants in CERS1 affect muscle function and health in humans.
(A) Overall result of the Mendelian randomization analysis in the UK biobank cohort using skeletal muscle expression quantitative trait loci (cis-eQTL) of CERS1. (B) Scatter plot showing the effect of the three independent (R2 <0.1, see Figure 5—figure supplement 1E) cis-eQTLs rs117558072, rs1122821, rs71332140 on overall health, right grip strength, and left grip strength in the UK biobank. The slope of the regression line depicts the estimated causal effect with the inverse-variance weighted Mendelian randomization method. (C) Lollipop plot depicting rare variants in the coding region of CERS1 and their effects on overall health, right grip strength, and left grip strength in the UK biobank. Colors indicate phenotypes, dot size indicates effect size, red dotted line indicates the suggested cut-off p<0.05. (D) Representative immunocytochemistry images of differentiating mouse muscle cells treated with scramble control shRNA, or shRNA targeting Cers1 alone, or shRNA against Cers1 and Cers2. Scale bar, 50 µM. (E) Gene expression profiling of differentiating mouse muscle cells treated with scramble control shRNA, or an shRNA targeting Cers1 alone, or an shRNA against Cers1 and Cers2 (n=4–8 per group). (F) Overview over the de novo sphingolipid biosynthesis pathway highlighting the hypothesis that CERS1 inhibition leads to a compensatory upregulation of CERS2, which might inhibit muscle function in aging. Data: mean ± SEM. One-way ANOVA determined significance. *p<0.05, **p<0.01, ***p<0.001.
Figure 5—figure supplement 1
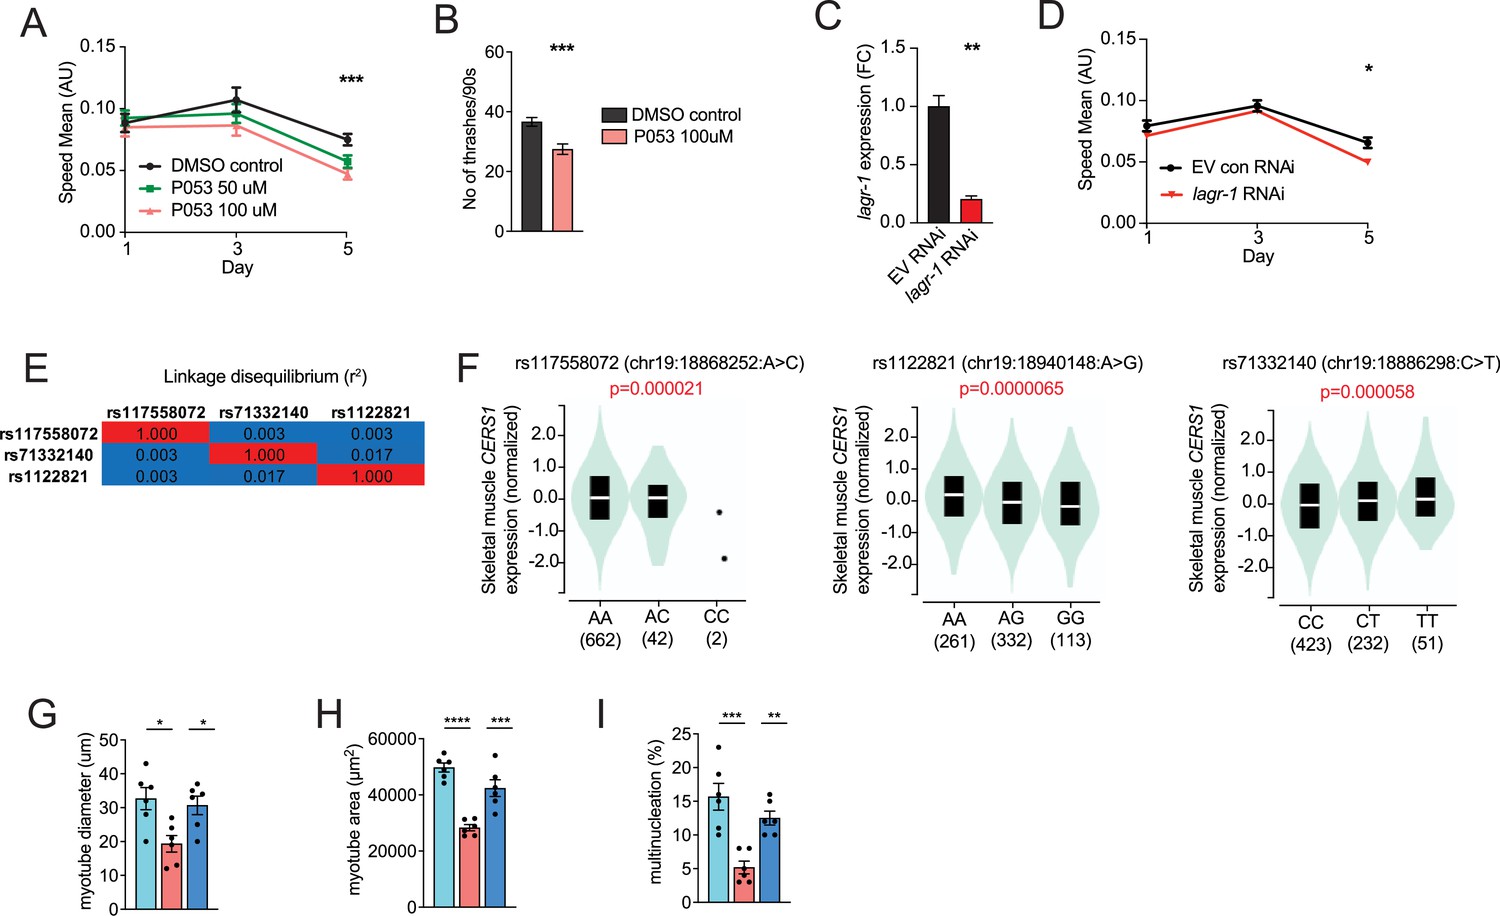
CERS1 inhibition is associated with impaired health span.
(A) Mean speed measured in C. elegans treated with DMSO, 50µM P053 or 100µM P053 (n=40–57 per group). (B) Number of trashes recorded within 90 s in control or P053 treated C. elegans at day 5 of adulthood (n=33–40 per group). (C) Gene expression of the Cers1 orthologue lagr-1 in C. elegans treated with empty vector control, or RNAi targeting lagr-1 (n=3 biological replicates per group). (D) Mean speed measured in C. elegans (myo3p-GFP) treated with EV control, or RNAi against the Cers1 orthologue lagr-1 (n=46–56 per group). (E) Linkage disequilibrium of the common CERS1 expression quantitative trait loci (cis-eQTL) rs117558072, rs1122821, rs71332140 measured as r2 in all populations (https://ldlink.nci.nih.gov). (F) Violin plots showing the allelic effect of rs117558072 (left), rs1122821 (middle), rs71332140 (right) on CERS1 expression in human skeletal muscle in the Genotype-Tissue Expression (GTEx) dataset (n=706 human in total). (G–I) Quantification of (G) myotube diameter, (H) myotube area (middle) and (I) % of multinucleated myotubes in C2C12 mouse muscle cells treated with scramble control shRNA, shRNA targeting Cers1, or shRNA targeting Cers1 and Cers2 (n=6 per group). Data: mean ± SEM. Unpaired Student’s t-test and ANOVAs determined significance. *p<0.05, **p<0.01, ***p<0.001.
Author response image 1
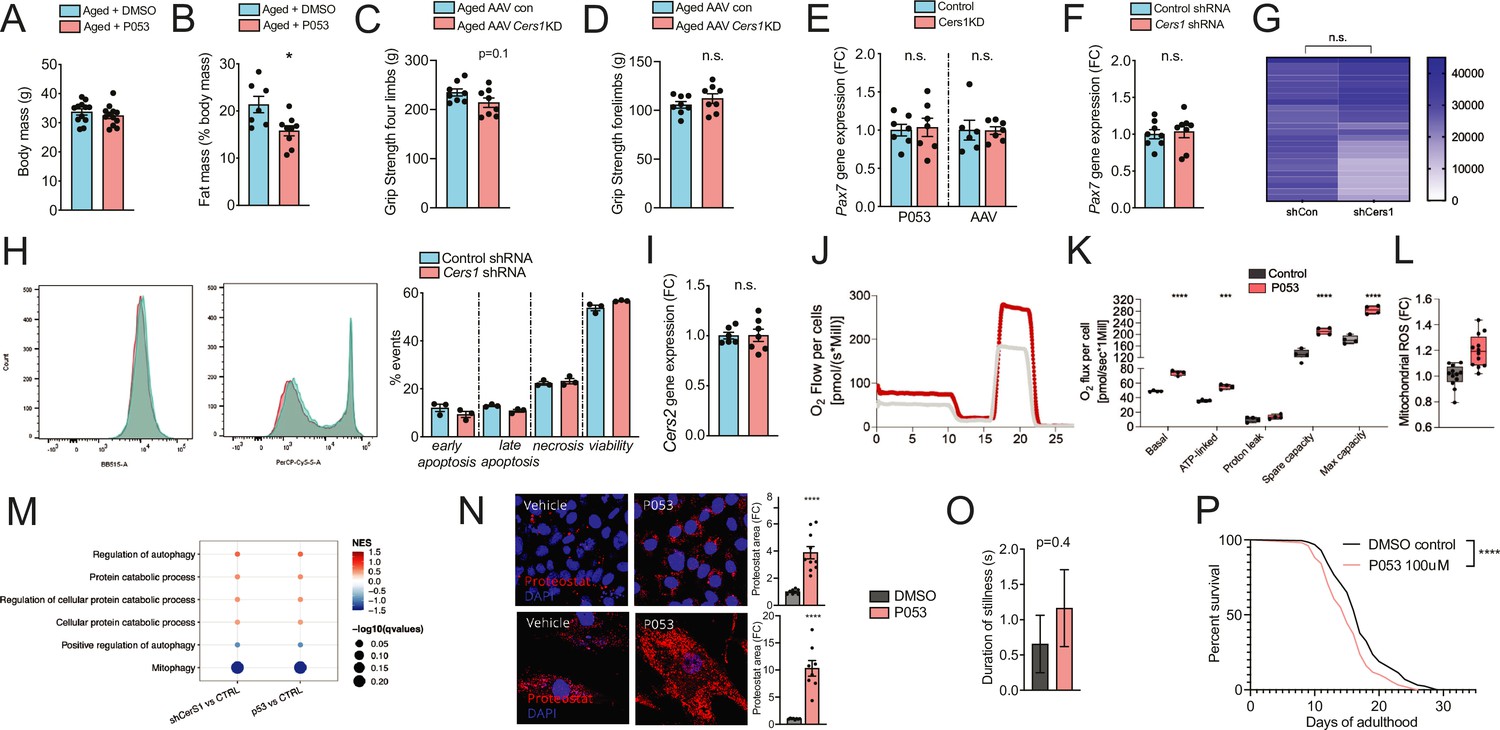
(A-B) Body mass (A) and Fat mass as % of body mass (B) were measured in 22mo C57BL/6J mice intraperitoneally injected with DMSO or P053 using EchoMRI (n=7-12 per group). (C-D) Grip strengh measurements in all limbs (C) or only the forelimbs (D) in 24mo C57BL/6J mice intramuscularly injected with AAV9 particles containing scramble, or shRNA targeting Cers1 (n=8 per group). (E-F) Pax7 gene expression in P053 or AAV9 treated mice (n=6-7 per group) (E), or in mouse C2C12 muscle progenitor cells treated with 25nM scramble or Cers1 targeting shRNA (n=8 per group) (F). (G) Proliferation as measured by luciferase intensity in mouse C2C12 muscle muscle cells treated with 25nM scramble or Cers1 targeting shRNA (n=24 per group). Each column represents one biological replicate. (H) Overlayed FACS traces of Annexin-V (BB515, left) and Propidium Iodide (Cy5, right) of mouse C2C12 muscle myotubes treated with 25nM scramble or Cers1 targeting shRNA (n=3 per group). Quantification right: early apoptosis (Annexin+-PI-), late apoptosis (Annexin+-PI+), necrosis (Annexin--PI+), viability (Annexin--PI-). (I) Normalized Cers2 gene expression in mouse C2C12 muscle muscle cells treated with 25nM scramble or Cers1 targeting shRNA (n=6-7 per group). (J-K) Representative mitochondrial respiration traces of digitonin-permeablized mouse C2C12 muscle muscle cells treated DMSO or P053 (J) with quantification of basal, ATP-linked, proton leak respiration as well as spare capacity and maximal capacity linked respiration (n=4 per group). (L) Reactive oxygen production in mitochondria of mouse C2C12 muscle muscle cells treated DMSO or P053. (M) Enriched gene sets related to autophagy and mitophagy in 24mo C57BL/6J mouse muscles intramuscularly injected with AAV9 particles containing scramble, or shRNA targeting Cers1 (left), or intraperitoneally injected with DMSO or P053 (right). Color gradient indicates normalized effect size. Dot size indicates statistical significance (n=6-8 per group). (N) Representative confocal Proteostat stainings with quantifications of DMSO and P053 treated mouse muscle cells expressing APPSWE (top) and human primary myoblasts isolated from patients with inclusion body myositis (bottom). (O) Stillness duration during a 90 seconds interval in adult day 5 C. elegans treated with DMSO or 100uM P053. (P) Lifespan of C. elegans treated with DMSO or P053. (n=144-147 per group, for method details see main manuscript page 10).
Additional files
-
Supplementary file 1
Cellpose training quality control.
- https://cdn.elifesciences.org/articles/90522/elife-90522-supp1-v2.docx
-
Supplementary file 2
List of mouse and human qPCR primers.
- https://cdn.elifesciences.org/articles/90522/elife-90522-supp2-v2.docx
-
Supplementary file 3
List of plasmids.
- https://cdn.elifesciences.org/articles/90522/elife-90522-supp3-v2.docx
-
Supplementary file 4
List of antibodies.
- https://cdn.elifesciences.org/articles/90522/elife-90522-supp4-v2.docx
-
MDAR checklist
- https://cdn.elifesciences.org/articles/90522/elife-90522-mdarchecklist1-v2.pdf
-
Source data 1
Numerical source data for Figures 1—5 and accompanying figure supplements.
- https://cdn.elifesciences.org/articles/90522/elife-90522-data1-v2.xlsx
Download links
A two-part list of links to download the article, or parts of the article, in various formats.
Downloads (link to download the article as PDF)
Open citations (links to open the citations from this article in various online reference manager services)
Cite this article (links to download the citations from this article in formats compatible with various reference manager tools)
Inhibition of CERS1 in skeletal muscle exacerbates age-related muscle dysfunction
eLife 12:RP90522.
https://doi.org/10.7554/eLife.90522.3


