Different coexistence patterns between apex carnivores and mesocarnivores based on temporal, spatial, and dietary niche partitioning analysis in Qilian Mountain National Park, China
- Ecology and Nature Conservation Institute, Chinese Academy of Forestry, Key Laboratory of Biodiversity Conservation, State Forestry and Grassland Administration, China
- Institute of Ecological Conservation and Restoration, Chinese Academy of Forestry, China
- Department of Biological Sciences, Duquesne University, United States
Figures
Figure 1
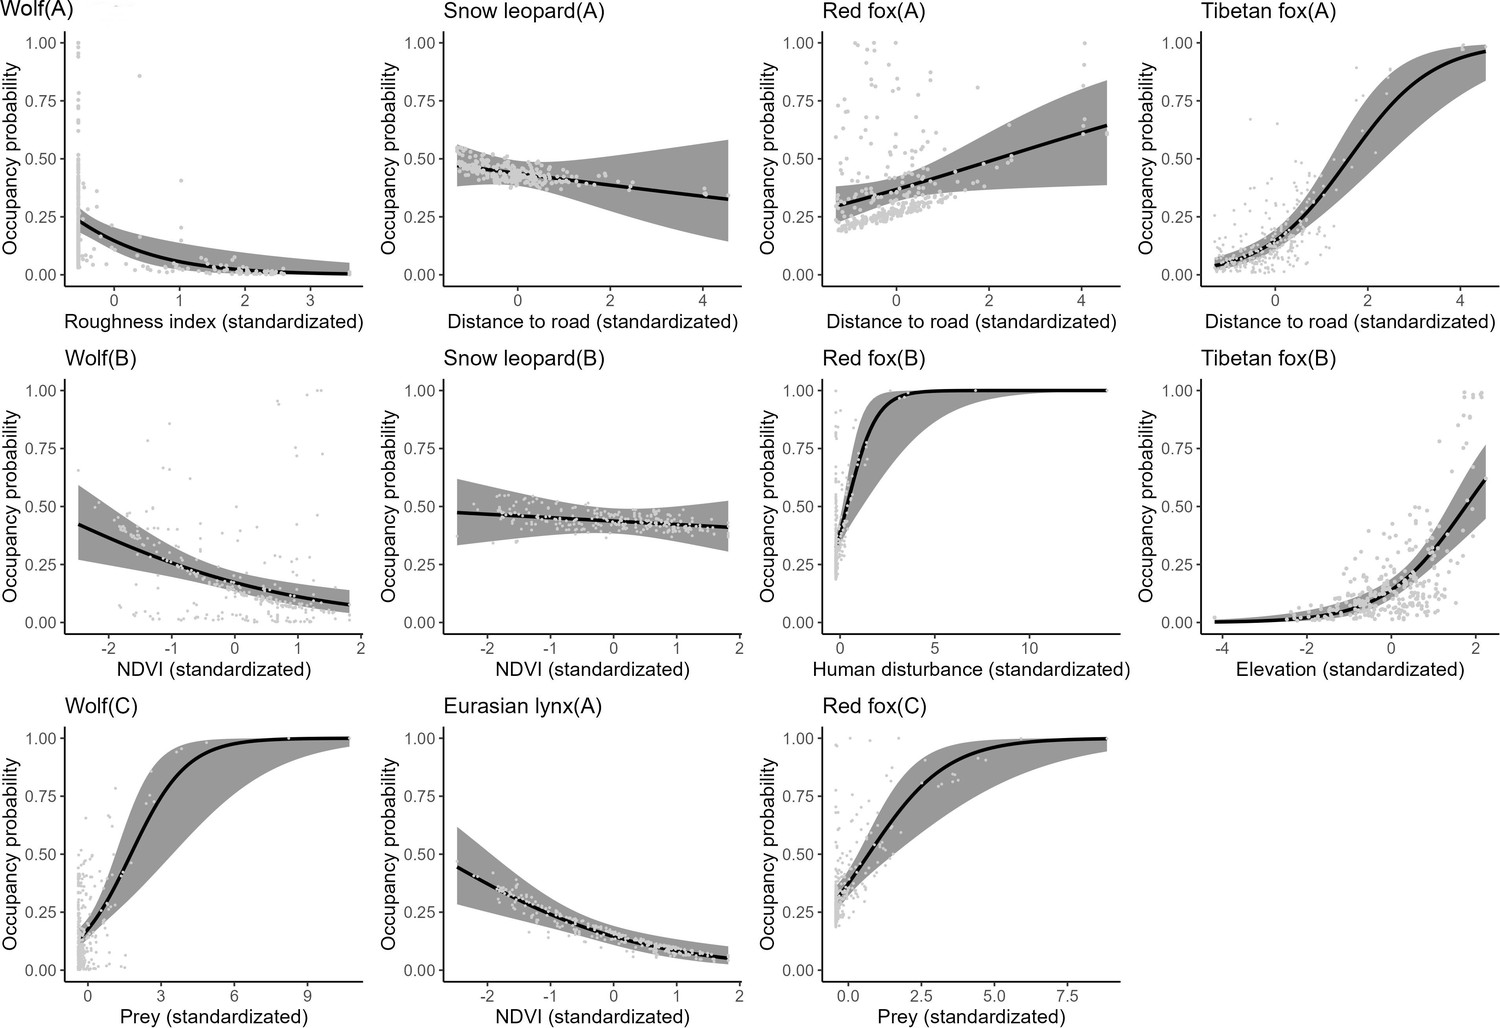
The relationship between carnivore species occupancy probability and covariates by the optimal models (∆AIC≤2).
The solid line represents the fitted polynomial regression and the gray area represents 95% confidence intervals.
Figure 2
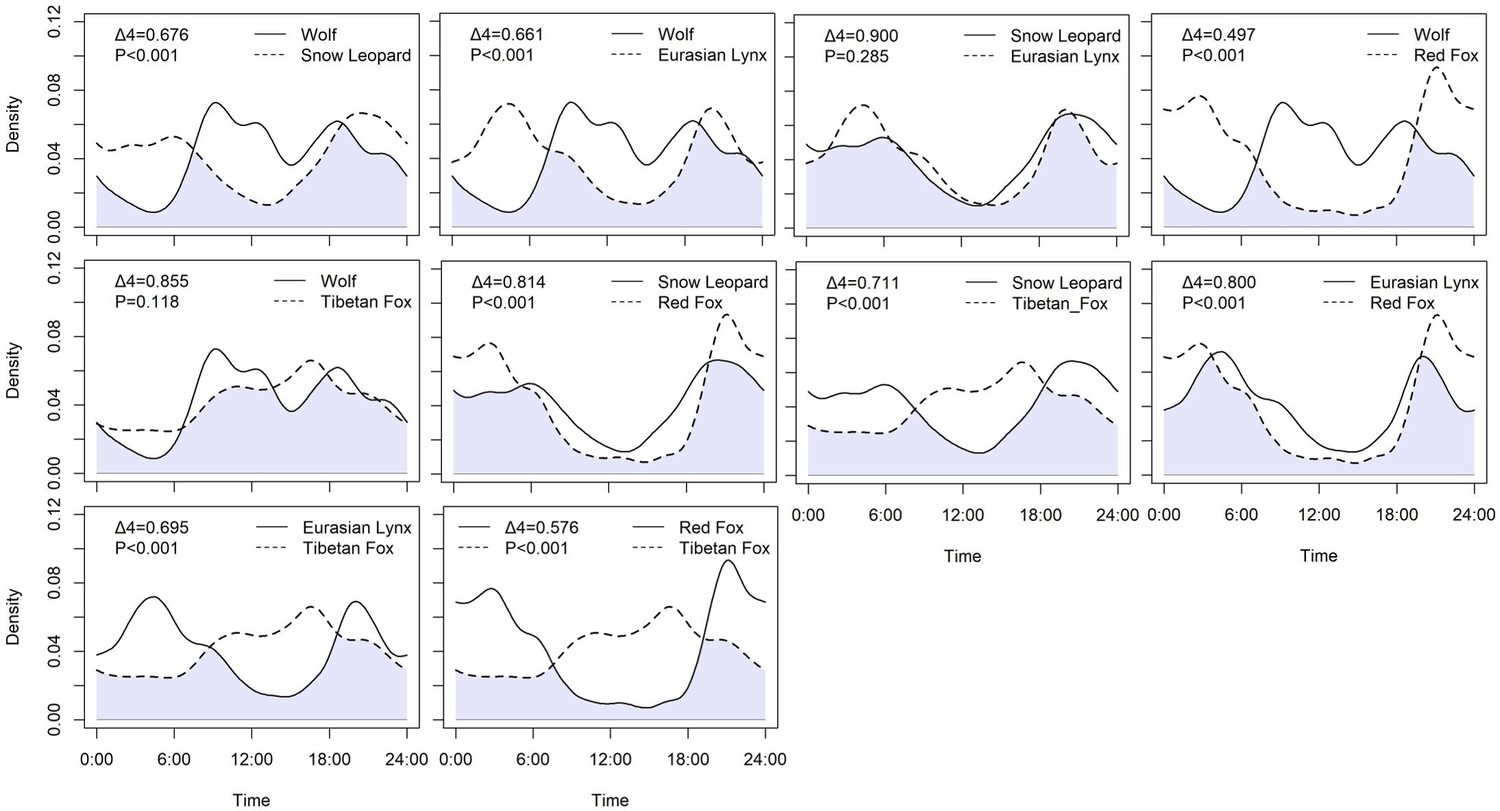
Daily activity patterns of carnivore species.
Shades of lavender indicate temporal areas of overlap. The p-values are derived from Wald tests. A p-value less than 0.05 indicates that the parameter significantly contributes to the model.
Figure 3 with 2 supplements
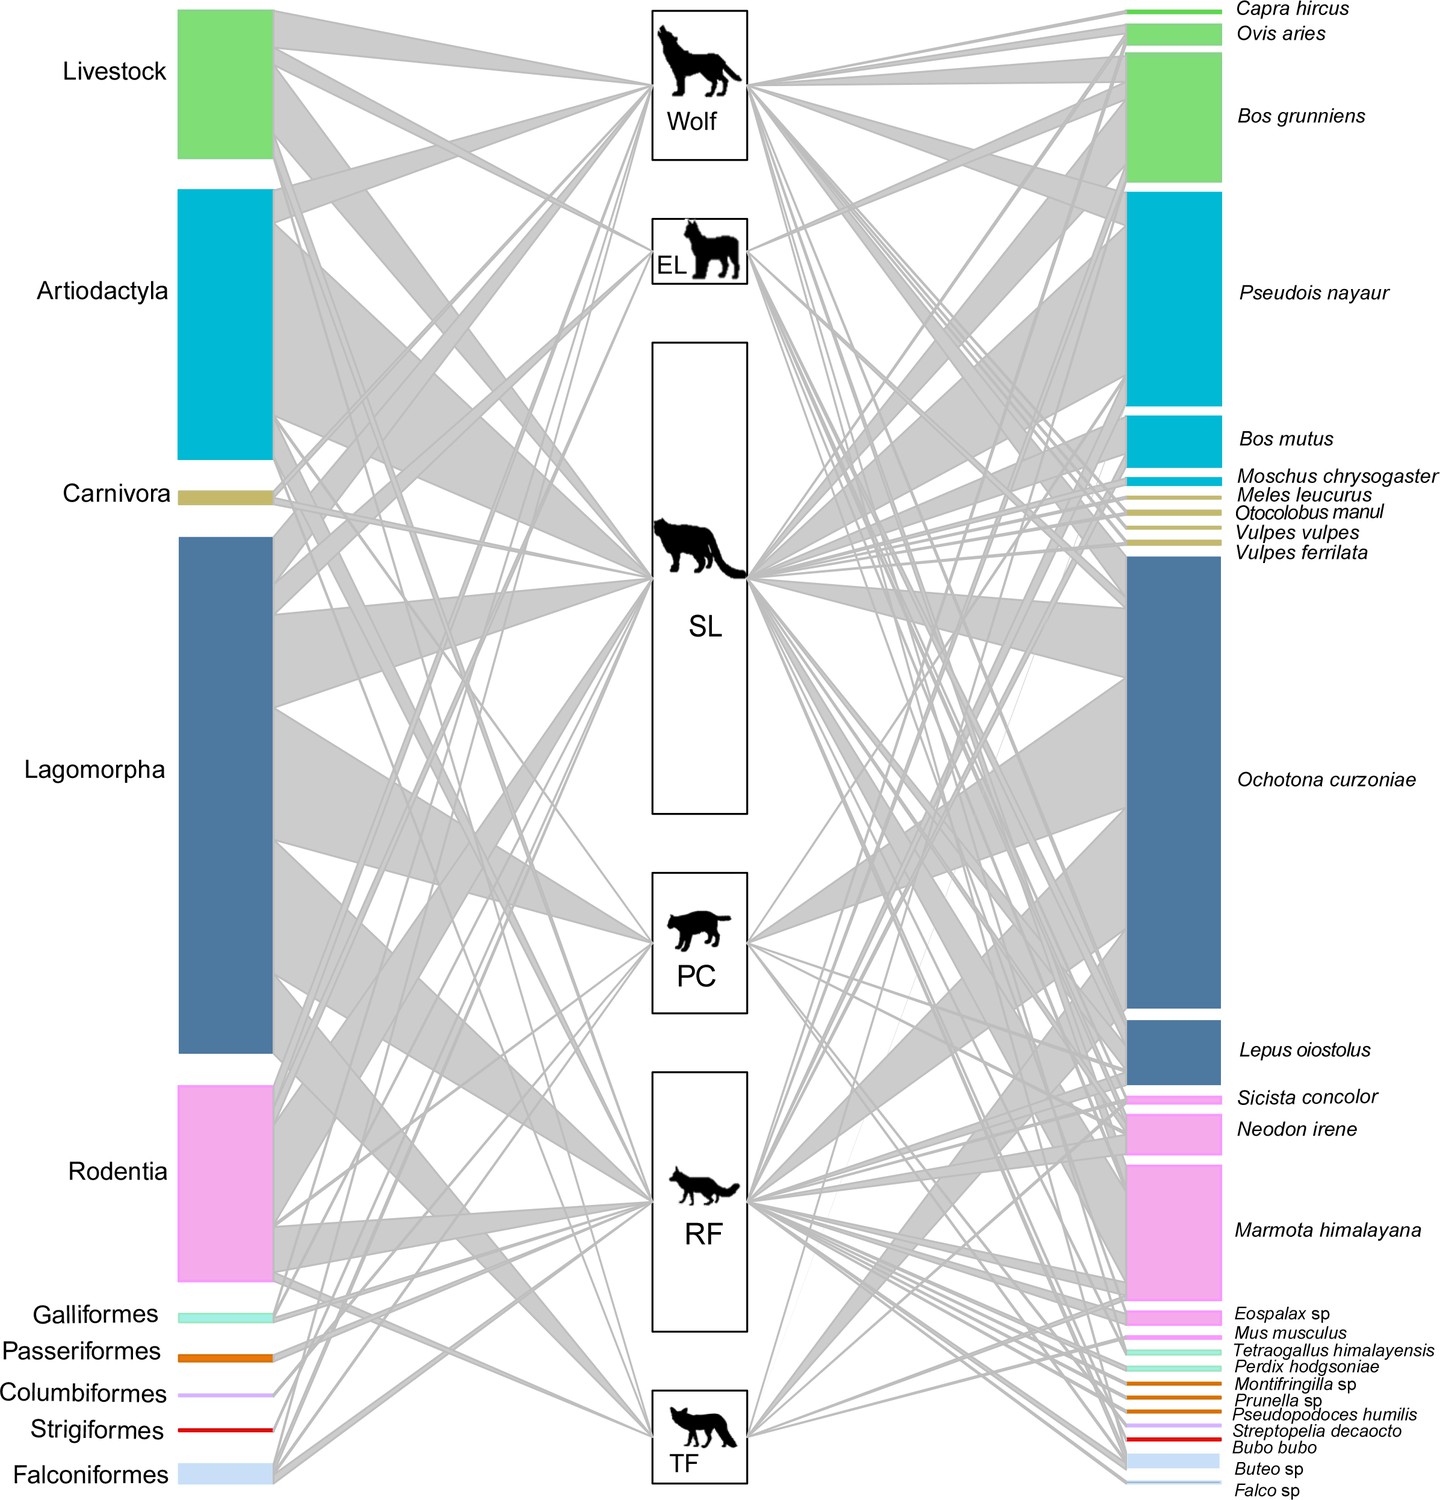
The food web of carnivore species (SL – snow leopard, EL – Eurasian lynx, PC – Pallas’s cat, RF – red fox, TF – Tibetan fox).
The heights of the left bars represent the frequency of occurrence of the taxonomic order of prey species, the middle bars represent the number of samples for each carnivore, and the heights of the right bars represent the frequency of occurrence of prey species in scats. The colors of prey match the taxonomic orders. The connecting line widths represent the prey frequency of occurrence in the diet of each carnivore species.
Figure 3—figure supplement 1
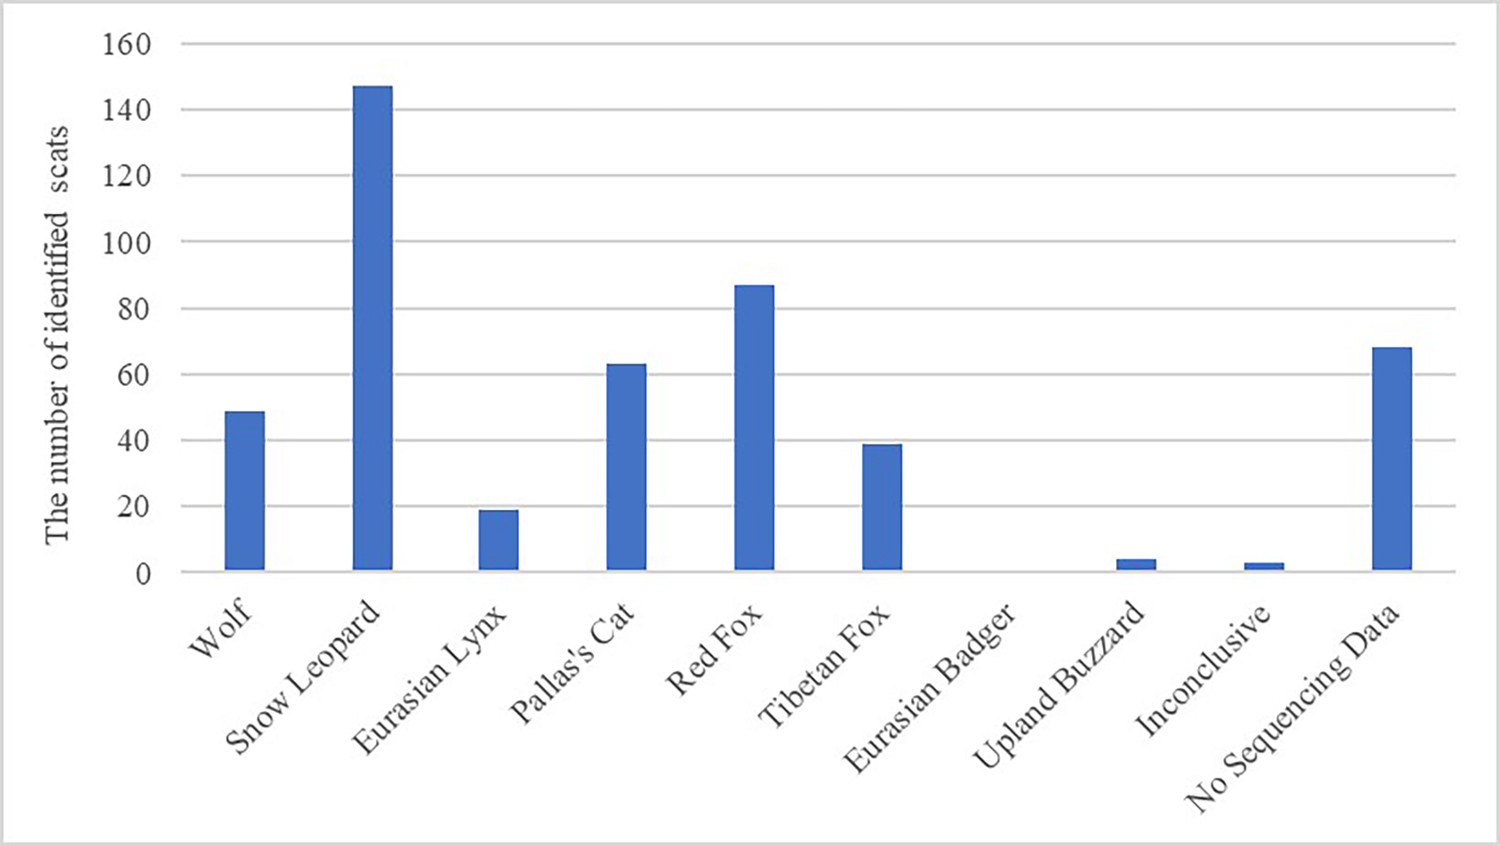
The number of scats belonging to each host species among 480 scats samples.
Figure 3—figure supplement 2
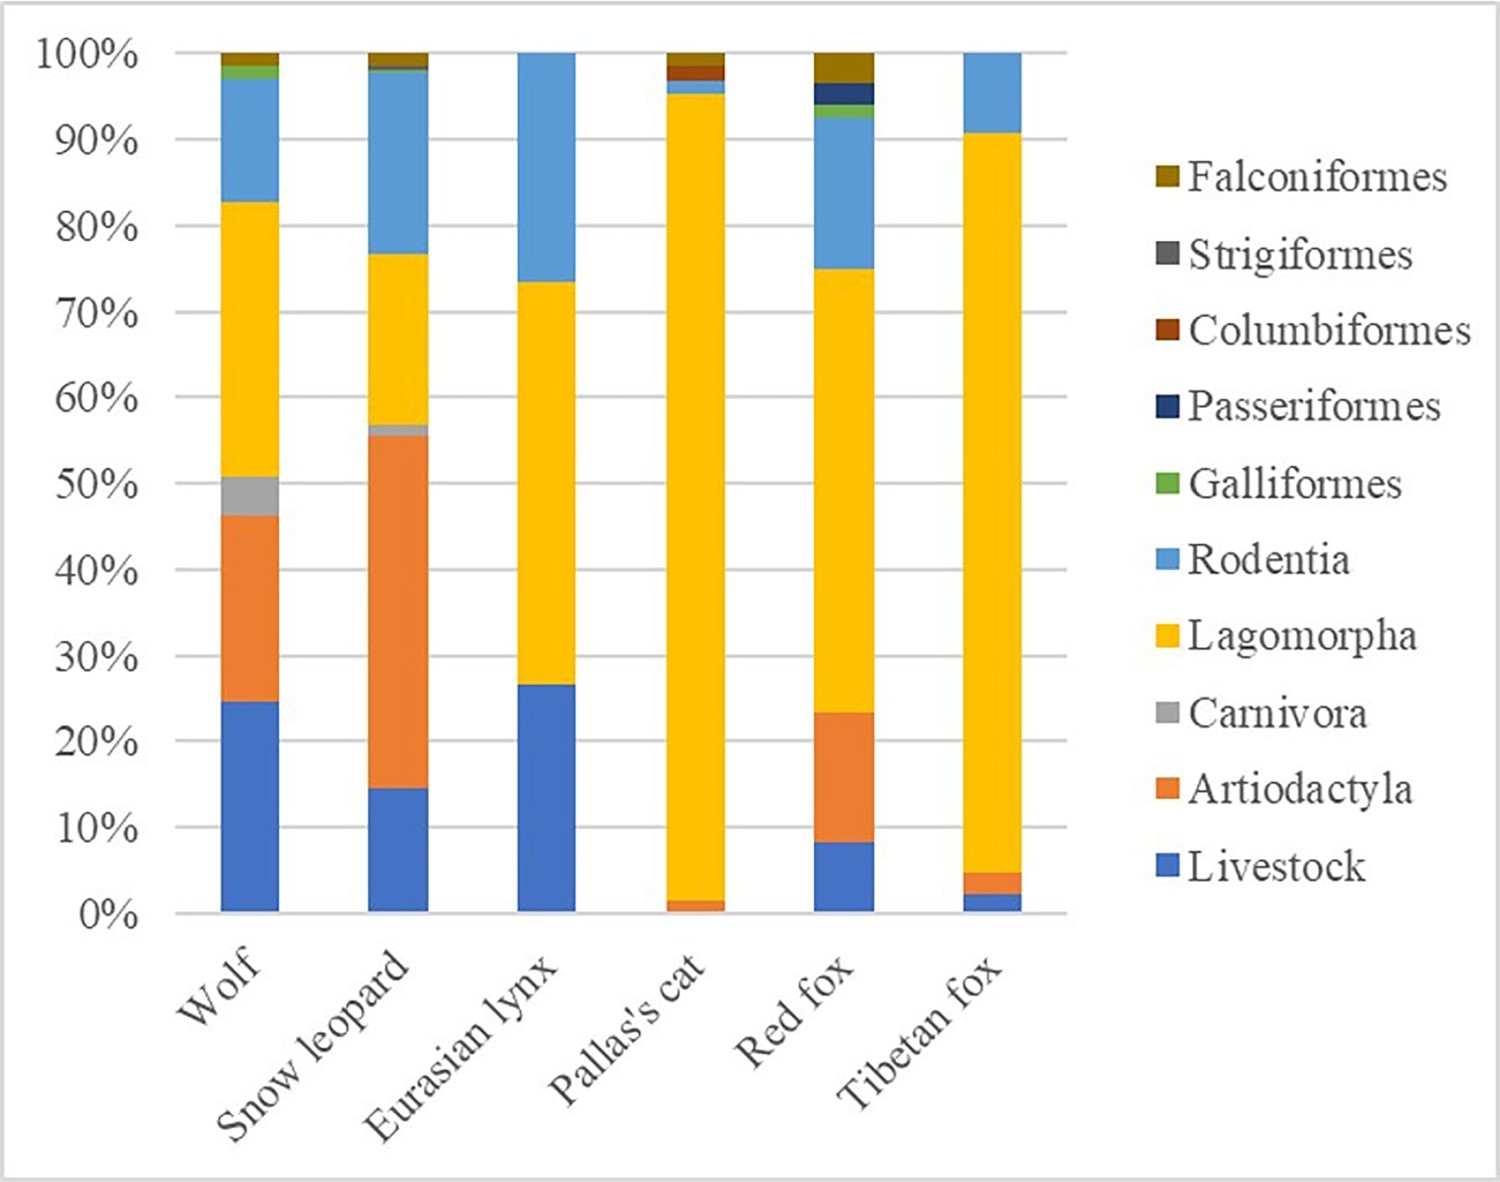
The frequency of occurrence (FOO) percentage of each prey order by carnivore.
‘Livestock’ consists of all domestic animals observed as prey combined.
Figure 4
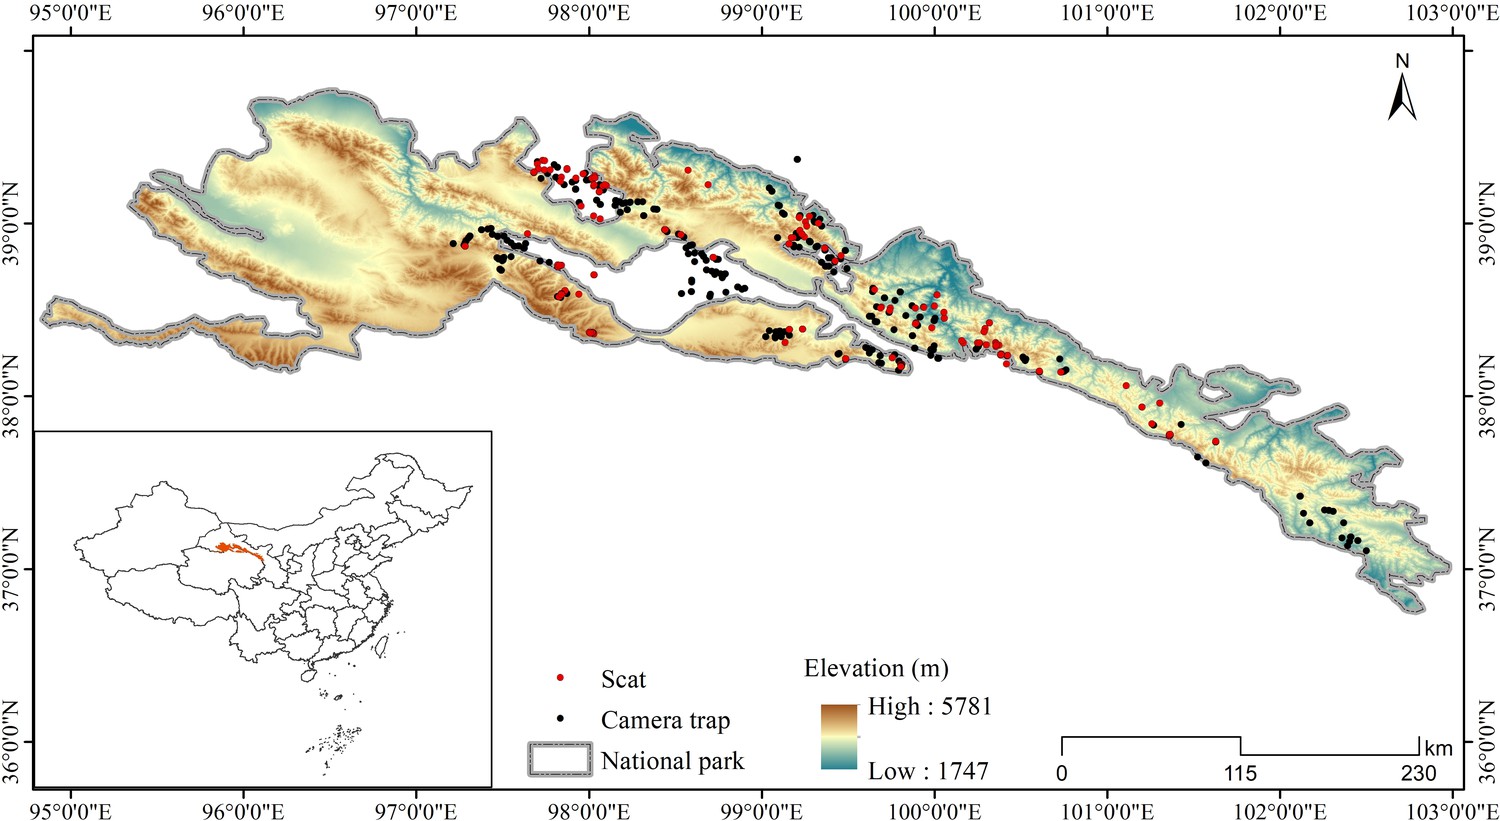
Locations of camera trap stations and scat collection sites in this study.
Tables
Table 1
Summary of occupancy rate and detection probability of different species for the optimal models (ΔAIC≤2).
| Species | Models | Number of parameters | AIC | ΔAIC | AIC Wt | ψ | p |
|---|---|---|---|---|---|---|---|
| Wolf | Psi (rix+ndvi+prey); P (ele+prey) | 7 | 282.14 | 0.000 | 0.077 | 0.180 | 0.153 |
| Psi (rix+ndvi+prey); P (ele+hdis) | 7 | 282.45 | 0.302 | 0.066 | 0.183 | 0.145 | |
| Psi (rix+ndvi+prey); P (ele) | 6 | 283.67 | 1.525 | 0.036 | 0.217 | 0.111 | |
| Psi (rix+ndvi+prey); P (ele+hdis+prey) | 8 | 284.10 | 1.959 | 0.029 | 0.179 | 0.154 | |
| Psi (ele+rix+ndvi+prey); P (ele+prey) | 8 | 284.12 | 1.972 | 0.029 | 0.168 | 0.165 | |
| Psi (rix+ndvi+disrd+prey); P (ele+prey) | 8 | 284.14 | 2.000 | 0.028 | 0.178 | 0.156 | |
| Model average | 0.184 | 0.147 | |||||
| Snow leopard | Psi (disrd+ndvi); P (hdis+prey) | 6 | 970.69 | 0.000 | 0.035 | 0.436 | 0.419 |
| Psi (ele+disrd); P (hdis+prey) | 6 | 970.81 | 0.113 | 0.033 | 0.435 | 0.421 | |
| Psi (.); P (hdis+prey) | 4 | 970.99 | 0.292 | 0.030 | 0.437 | 0.420 | |
| Psi (disrd+ndvi); P (ele+hdis+prey) | 7 | 971.12 | 0.429 | 0.028 | 0.440 | 0.413 | |
| Psi (ele+disrd+ndvi); P (hdis+prey) | 7 | 971.13 | 0.439 | 0.028 | 0.433 | 0.420 | |
| Psi (.); P (ele+hdis+prey) | 5 | 971.21 | 0.511 | 0.027 | 0.442 | 0.413 | |
| Psi (disrd); P (ele+hdis+prey) | 6 | 971.22 | 0.525 | 0.027 | 0.444 | 0.410 | |
| Psi (disrd); P (hdis+prey) | 5 | 971.52 | 0.825 | 0.023 | 0.437 | 0.420 | |
| Psi (ele); P (hdis+prey) | 5 | 971.62 | 0.928 | 0.022 | 0.435 | 0.421 | |
| Psi (ndvi); P (hdis+prey) | 5 | 971.64 | 0.947 | 0.022 | 0.437 | 0.420 | |
| Psi (ele+disrd); P (ele+hdis+prey) | 7 | 971.92 | 1.222 | 0.019 | 0.436 | 0.416 | |
| Psi (ndvi); P (ele+hdis+prey) | 6 | 972.42 | 1.726 | 0.015 | 0.440 | 0.414 | |
| Psi (ele+disrd+ndvi); P (ele+hdis+prey) | 8 | 972.45 | 1.757 | 0.014 | 0.435 | 0.416 | |
| Psi (disrd+ndvi+rix); P (hdis+prey) | 7 | 972.67 | 1.974 | 0.013 | 0.436 | 0.419 | |
| Model average | 0.437 | 0.417 | |||||
| Eurasian lynx | Psi (ndvi); P (hdis) | 4 | 371.32 | 0.000 | 0.025 | 0.163 | 0.321 |
| Psi (rix+ndvi); P (hdis) | 5 | 371.40 | 0.076 | 0.024 | 0.161 | 0.322 | |
| Psi (ndvi); P (hdis+prey) | 5 | 371.64 | 0.325 | 0.021 | 0.170 | 0.296 | |
| Psi (rix+ndvi); P (hdis+prey) | 6 | 371.86 | 0.539 | 0.019 | 0.167 | 0.300 | |
| Psi (ndvi+hdis); P (prey) | 5 | 371.94 | 0.623 | 0.019 | 0.163 | 0.315 | |
| Psi (ndvi+disrd); P (hdis) | 5 | 372.02 | 0.702 | 0.018 | 0.163 | 0.321 | |
| Psi (rix+ndvi+hdis); P (prey) | 6 | 372.23 | 0.907 | 0.016 | 0.161 | 0.318 | |
| Psi (ndvi+hdis); P (.) | 4 | 372.24 | 0.916 | 0.016 | 0.156 | 0.343 | |
| Psi (rix+ndvi+hdis); P (.) | 5 | 372.36 | 1.044 | 0.015 | 0.154 | 0.345 | |
| Psi (rix+ndvi+disrd); P (hdis) | 6 | 372.39 | 1.072 | 0.015 | 0.161 | 0.321 | |
| Psi (ndvi+disrd); P (hdis+prey) | 6 | 372.64 | 1.318 | 0.013 | 0.168 | 0.300 | |
| Psi (ndvi+prey); P (hdis) | 5 | 372.67 | 1.352 | 0.013 | 0.163 | 0.320 | |
| Psi (rix+ndvi+prey); P (hdis) | 6 | 372.99 | 1.672 | 0.011 | 0.160 | 0.323 | |
| Psi (ndvi+disrd+hdis); P (.) | 5 | 373.06 | 1.744 | 0.011 | 0.156 | 0.344 | |
| Psi (ndvi+hdis); P (hdis) | 5 | 373.09 | 1.775 | 0.010 | 0.156 | 0.325 | |
| Psi (ndvi+disrd+hdis); P (prey) | 6 | 373.11 | 1.792 | 0.010 | 0.162 | 0.319 | |
| Psi (rix+ndvi+disrd); P (hdis+prey) | 7 | 373.12 | 1.796 | 0.010 | 0.165 | 0.303 | |
| Psi (rix+ndvi+hdis); P (hdis) | 6 | 373.23 | 1.913 | 0.010 | 0.154 | 0.326 | |
| Psi (ele+ndvi); P (hdis) | 5 | 373.32 | 1.999 | 0.009 | 0.164 | 0.319 | |
| Model average | 0.161 | 0.320 | |||||
| Red fox | Psi (disrd+hdis+prey); P (.) | 5 | 894.44 | 0.000 | 0.039 | 0.369 | 0.391 |
| Psi (disrd+hdis+prey); P (ele) | 6 | 894.59 | 0.152 | 0.037 | 0.370 | 0.387 | |
| Psi (disrd+hdis+ndvi+prey); P (.) | 6 | 895.30 | 0.864 | 0.026 | 0.370 | 0.391 | |
| Psi (disrd+hdis+ndvi+prey); P (ele) | 7 | 895.37 | 0.934 | 0.025 | 0.370 | 0.387 | |
| Psi (disrd+hdis+prey+rix); P (.) | 6 | 895.99 | 1.544 | 0.018 | 0.369 | 0.392 | |
| Psi (disrd+hdis+prey+rix); P (ele) | 7 | 896.16 | 1.717 | 0.017 | 0.370 | 0.388 | |
| Psi (disrd+hdis+prey); P (prey) | 6 | 896.29 | 1.850 | 0.016 | 0.368 | 0.388 | |
| Psi (disrd+hdis+prey); P (hdis) | 6 | 896.37 | 1.932 | 0.015 | 0.368 | 0.394 | |
| Model average | 0.369 | 0.390 | |||||
| Tibetan fox | Psi (ele+disrd+prey+rix); P (ele+prey) | 8 | 326.43 | 0.000 | 0.066 | 0.147 | 0.236 |
| Psi (disrd+prey+rix); P (ele+prey+hdis) | 8 | 327.14 | 0.714 | 0.046 | 0.277 | 0.135 | |
| Psi (ele+disrd+hdis+prey+rix); P (ele+prey) | 9 | 327.20 | 0.775 | 0.045 | 0.151 | 0.230 | |
| Psi (ele+disrd+rix); P (ele+prey) | 7 | 327.29 | 0.866 | 0.043 | 0.158 | 0.219 | |
| Psi (ele+disrd+prey+rix); P (ele+prey+hdis) | 9 | 327.53 | 1.100 | 0.038 | 0.153 | 0.222 | |
| Psi (ele+disrd+prey); P (ele+prey) | 7 | 327.69 | 1.263 | 0.035 | 0.149 | 0.234 | |
| Psi (disrd+hdis+prey+rix); P (ele+prey) | 8 | 328.01 | 1.585 | 0.030 | 0.260 | 0.142 | |
| Psi (ele+disrd); P (ele+prey) | 6 | 328.42 | 1.986 | 0.024 | 0.159 | 0.219 | |
| Model average | 0.182 | 0.205 |
-
disrd – distance to roads, ele – elevation, ndvi – normalized difference vegetation index, rix – roughness index, hdis – human disturbance.
-
Table 1—source data 1
Data captured by camera traps on carnivore species.
- https://cdn.elifesciences.org/articles/90559/elife-90559-table1-data1-v1.xlsx
Table 2
Covariates influencing carnivore occupancy rate and detection probability based on the optimal models (ΔAIC≤2).
| Species | Model component | Covariates | Estimate (β) | SE | Z | p |
|---|---|---|---|---|---|---|
| Wolf | Occupancy | Intercept | –2.031 | 0.497 | 4.083 | <0.001*** |
| ndvi | –0.843 | 0.287 | 2.935 | 0.003** | ||
| prey | 1.318 | 0.534 | 2.470 | 0.014* | ||
| rix | –1.166 | 0.570 | 2.046 | 0.041* | ||
| Detection | Intercept | –1.920 | 0.457 | 4.198 | <0.001*** | |
| ele | 0.618 | 0.266 | 2.320 | 0.020* | ||
| Snow leopard | Occupancy | Intercept | –0.256 | 0.143 | 1.783 | 0.075 |
| disrd | –0.163 | 0.172 | 0.953 | 0.341 | ||
| ndvi | –0.095 | 0.145 | 0.653 | 0.514 | ||
| Detection | Intercept | –0.451 | 0.124 | 3.628 | <0.001*** | |
| hdis | –1.830 | 0.520 | 3.519 | <0.001*** | ||
| ele | 0.661 | 0.247 | 2.678 | 0.007** | ||
| Eurasian lynx | Occupancy | Intercept | –1.879 | 0.316 | 5.941 | <0.001*** |
| ndvi | –0.583 | 0.201 | 2.899 | 0.004** | ||
| Detection | Intercept | –0.999 | 0.375 | 2.665 | 0.008** | |
| hdis | –1.785 | 1.690 | 1.056 | 0.291 | ||
| Red fox | Occupancy | Intercept | –0.441 | 0.177 | 2.488 | 0.013* |
| disrd | 0.331 | 0.178 | 1.866 | 0.062 | ||
| hdis | 1.333 | 0.611 | 2.184 | 0.029* | ||
| prey | 0.665 | 0.319 | 2.083 | 0.037* | ||
| Detection | Intercept | –0.451 | 0.121 | 3.729 | <0.001*** | |
| ele | 0.057 | 0.093 | 0.606 | 0.545 | ||
| Tibetan fox | Occupancy | Intercept | –2.087 | 0.643 | 3.247 | <0.001*** |
| disrd | 0.955 | 0.321 | 2.973 | 0.003** | ||
| ele | 0.768 | 0.547 | 1.403 | 0.161 | ||
| Detection | Intercept | –1.679 | 0.685 | 2.453 | 0.014* | |
| ele | 0.882 | 0.417 | 2.112 | 0.035* | ||
| prey | 0.369 | 0.167 | 2.216 | 0.027* |
-
The different superscript letters represent significance, ***p<0.001, **0.001<p<0.01, *0.01<p<0.05.
Table 3
Spatial overlap (Sørensen’s index), diel activity overlap (Δ), and dietary overlap (Pianka’s index), as well as confidence intervals for carnivore species.
| Sørensen’s index | Δ | Pianka’s index | |
|---|---|---|---|
| Wolf – Snow leopard | 0.277 | 0.676 (0.562–0.756) | 0.892 (0.804–0.982) |
| Wolf – Eurasian lynx | 0.272 | 0.661 (0.541–0.759) | 0.585 (0.141–0.881) |
| Snow leopard – Eurasian lynx | 0.305 | 0.900 (0.854–0.992) | 0.458 (0.160–0.886) |
| Wolf – Pallas’s cat | – | – | 0.658 (0.053–0.950) |
| Wolf – Red fox | 0.365 | 0.497 (0.359–0.563) | 0.811 (0.497–0.962) |
| Wolf – Tibetan fox | 0.350 | 0.855 (0.777–0.937) | 0.689 (0.456–0.967) |
| Snow leopard – Pallas’s cat | – | – | 0.354 (0.092–0.827) |
| Snow leopard – Red fox | 0.477 | 0.814 (0.756–0.863) | 0.586 (0.568–0.941) |
| Snow leopard – Tibetan fox | 0.292 | 0.711 (0.629–0.744) | 0.390 (0.299–0.905) |
| Eurasian lynx – Pallas’s cat | – | – | 0.376 (0–0.921) |
| Eurasian lynx – Red fox | 0.205 | 0.800 (0.728–0.878) | 0.536 (0.442–0.910) |
| Eurasian lynx – Tibetan fox | 0.198 | 0.695 (0.601–0.756) | 0.385 (0.078–0.919) |
| Pallas’s cat – Red fox | – | – | 0.945 (0.369–0.988) |
| Pallas’s cat – Tibetan fox | – | – | 0.997 (0–1) |
| Red fox – Tibetan fox | 0.349 | 0.576 (0.467–0.580) | 0.949 (0.279–0.988) |
Additional files
-
Supplementary file 1
Dietary composition, diversity, as well as similarity among six carnivore species.
(a) The frequency of occurrence (FOO) of prey found in carnivore diet. (b) Dietary diversity indices for each carnivore species. (c) Jaccard distance for prey items in diets using binary presence-absence data.
- https://cdn.elifesciences.org/articles/90559/elife-90559-supp1-v1.docx
-
MDAR checklist
- https://cdn.elifesciences.org/articles/90559/elife-90559-mdarchecklist1-v1.docx
Download links
A two-part list of links to download the article, or parts of the article, in various formats.
Downloads (link to download the article as PDF)
Open citations (links to open the citations from this article in various online reference manager services)
Cite this article (links to download the citations from this article in formats compatible with various reference manager tools)
Different coexistence patterns between apex carnivores and mesocarnivores based on temporal, spatial, and dietary niche partitioning analysis in Qilian Mountain National Park, China
eLife 13:RP90559.
https://doi.org/10.7554/eLife.90559.3


