Automated multiconformer model building for X-ray crystallography and cryo-EM
- Department of Bioengineering and Therapeutic Sciences, University of California, San Francisco, United States
- Structural Biology Initiative, CUNY Advanced Science Research Center, United States
- Ph.D. Program in Biology, The Graduate Center, City University of New York, United States
- Atomwise Inc, United States
- Department of Chemistry and Biochemistry, City College of New York, United States
- Ph.D. Programs in Biochemistry, Biology and Chemistry, The Graduate Center, City University of New York, United States
Figures
Figure 1
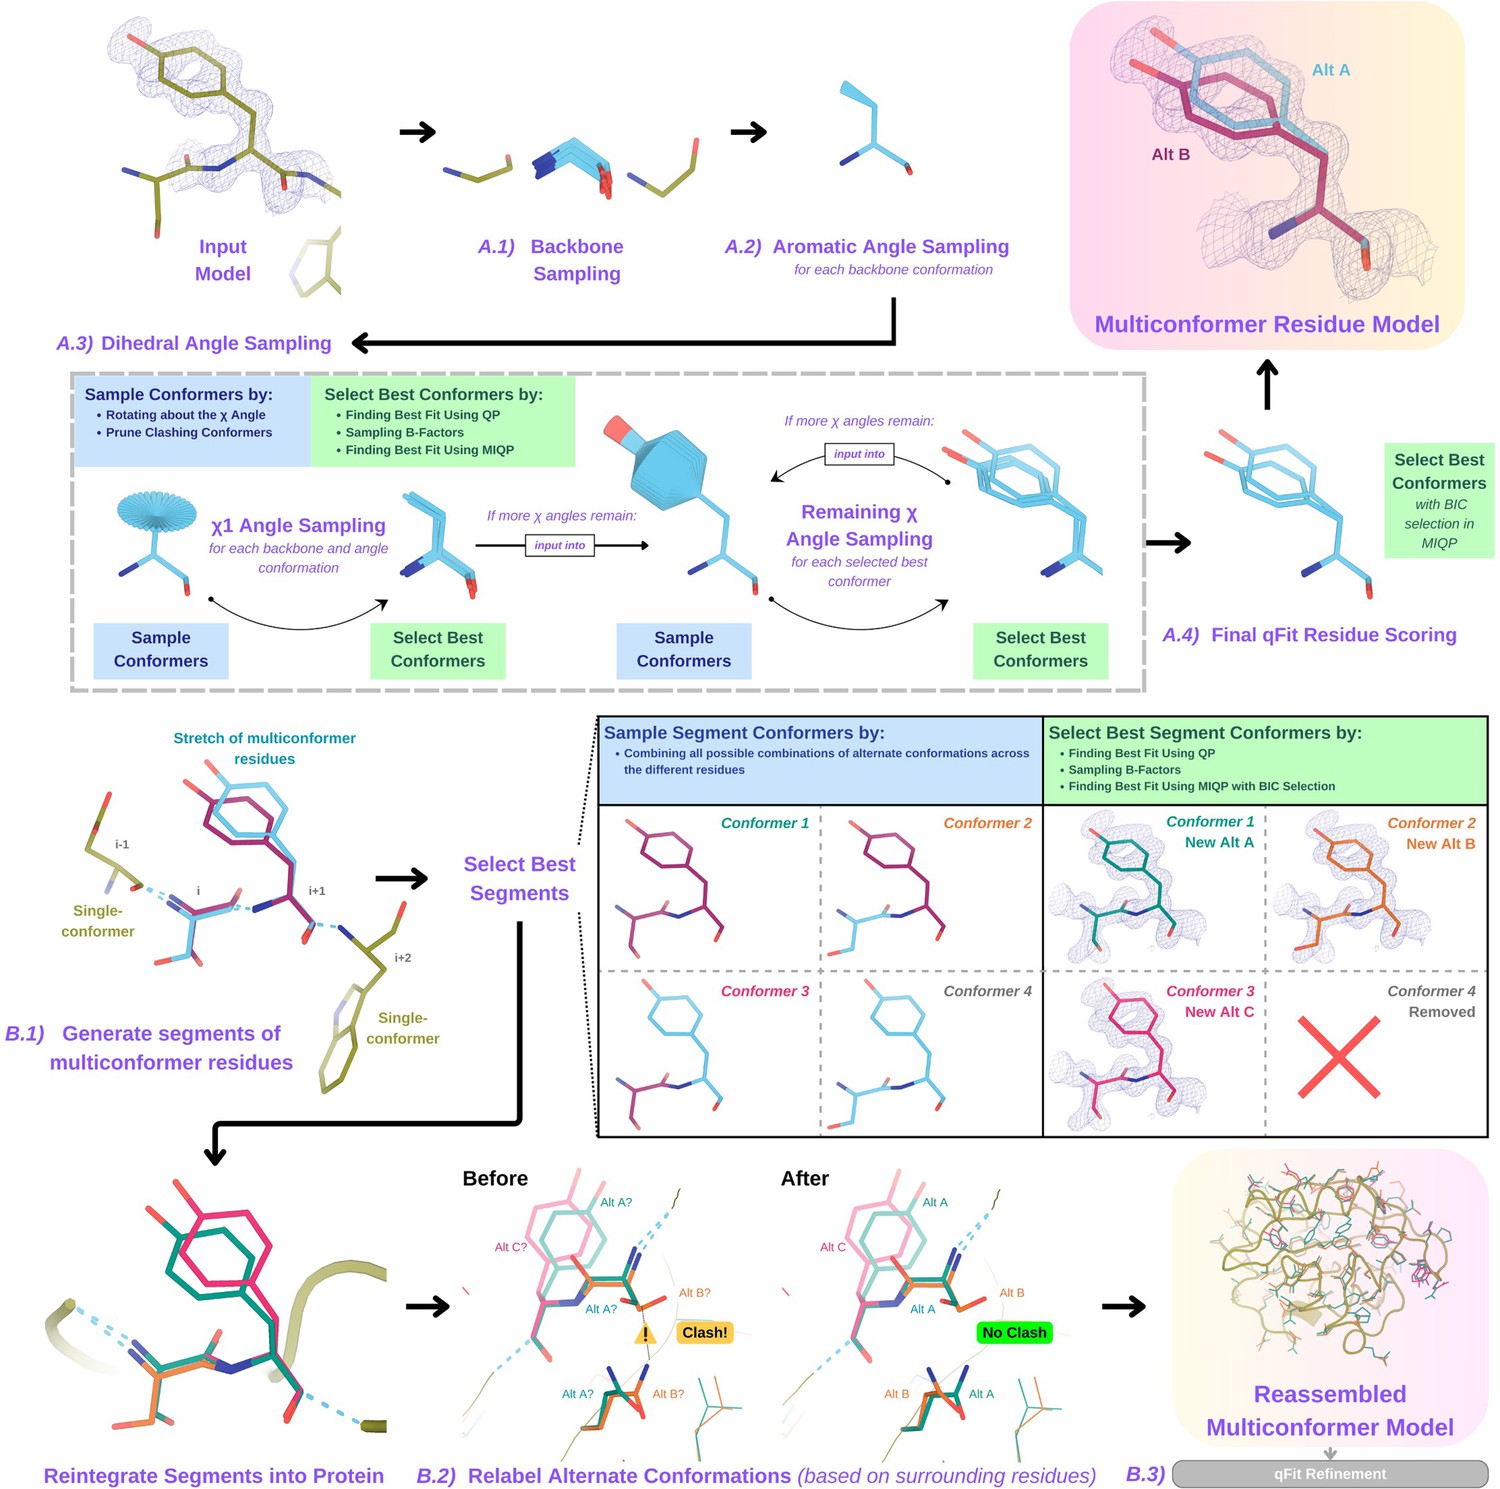
Programmatic flow of qFit protein algorithm.
(A) qFit residue algorithm, demonstrated by Tyr118 in the E46Q mutant structure of the photoactive yellow protein from Halorhodospira halophila (PDB: 1OTA) (Anderson et al., 2004). The 2mFo‐DFc composite omit density map contoured at 1 σ is shown as a blue mesh. (A.1) Backbone sampling: for each residue, qFit performs a collective translation of backbone atom (N, C, Cα, O) coordinates. (A.2) Aromatic angle sampling: for aromatic residues (His, Tyr, Phe, Trp), qFit takes the conformations from the backbone step and samples the Cα-Cβ-Cγ angle. (A.3) Dihedral angle sampling: since Tyr has two χ angles, qFit starts by taking the output conformers from the aromatic angle sampling step and exhaustively samples the χ1 angle, scoring the best conformations based on QP/B-factor/mixed-integer quadratic programming (MIQP) scoring. qFit then uses these best conformations as input to sample the remaining χ angles in the Tyr residue. Since the only angle left to be sampled is the χ2 angle, qFit rotates about the terminal ring of the Tyr and then scores the conformations that best fit the density. (A.4) Final qFit residue scoring: once we reach the terminal ring (all sampling steps have occurred), we perform QP and B-factor sampling, followed by MIQP with Bayesian information criteria (BIC) selection. MIQP with BIC selection removes a redundant overlapping conformation, resulting in two distinct conformations of this Tyr residue. This model is then output as the residue multiconformer. (B) qFit segment algorithm, demonstrated by Tyr118 in PDB: 1OTA. After identifying all optimal conformations for each individual residue, qFit works to connect the protein back together. (B.1) qFit segment: moving linearly along the protein sequence, qFit identifies ’segments' of residues with multiple backbone conformations. Here, Ser117 (i) and Tyr118 (i + 1) have multiple backbone conformations. qFit segment enumerates each possible combination of alternate conformations between these two residues, creating four possible combinations. The optimal combination of conformations is then determined by the QP/MIQP scoring, leading to one combination being culled. (B.2) qFit relabel: qFit uses Monte Carlo optimization with a steric model to assign altloc labels to spatially coupled alternative conformers. In this example, Ser117 and the neighboring Gln32 initially have clashing altloc B conformers. However, relabeling swaps the A and B labels of Gln32 to relieve this clash. (B.3) qFit refinement: we then refine the occupancies, coordinates, and B-factors of the raw qFit output file to produce a final qFit model. qFit improves overall fit to data relative to deposited structures.
Figure 2 with 3 supplements
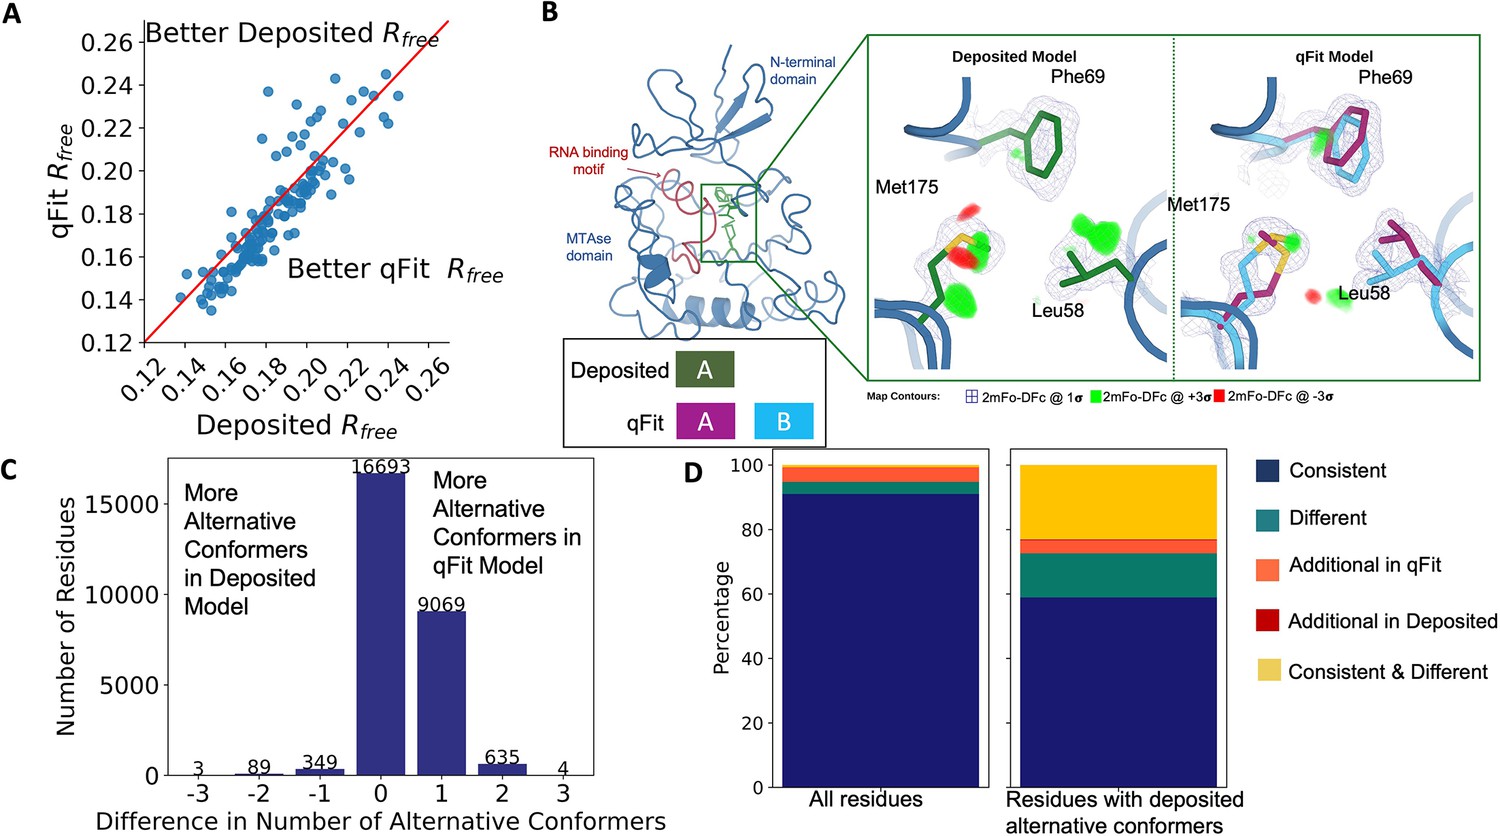
Multiconformer models created by qFit are better models than deposited single-conformer models.
(A) The distribution of Rfree value in deposited models versus qFit models. The qFit Rfree values improve in 73% of structures.(B) qFit identifies new alternative conformations adjacent to the RNA binding motif in the Pyrococcus horikoshii fibrillarin pre-rRNA processing protein (PDB: 1G8A). (Left) qFit multiconformer model with the region in the right panel highlighted in green and the adjacent RNA binding motif highlighted in red. Key domains in the fibrillarin protein are also annotated in blue. (Right) Comparison of the deposited versus qFit model in a region with several conformationally heterogeneous residues. qFit identified new rotamers for Leu58 (tp) and Met175 (ttp and mtp) (Lovell et al., 2000) and significantly different alternative conformations within the original rotameric well for Phe69. (C) The differences in the number of alternative conformations per residue in deposited models versus qFit models. qFit adds at least one additional alternative conformation in 31.7% of residues (n = 9998). (D) The distribution of rotamer assignment agreement between the deposited and qFit models for different (sub)sets of residues. (Left) All residues (n = 42,626). (Right) Only residues with alternative conformations in the deposited model (n = 970). See main text for definitions of categories.
Figure 2—figure supplement 1
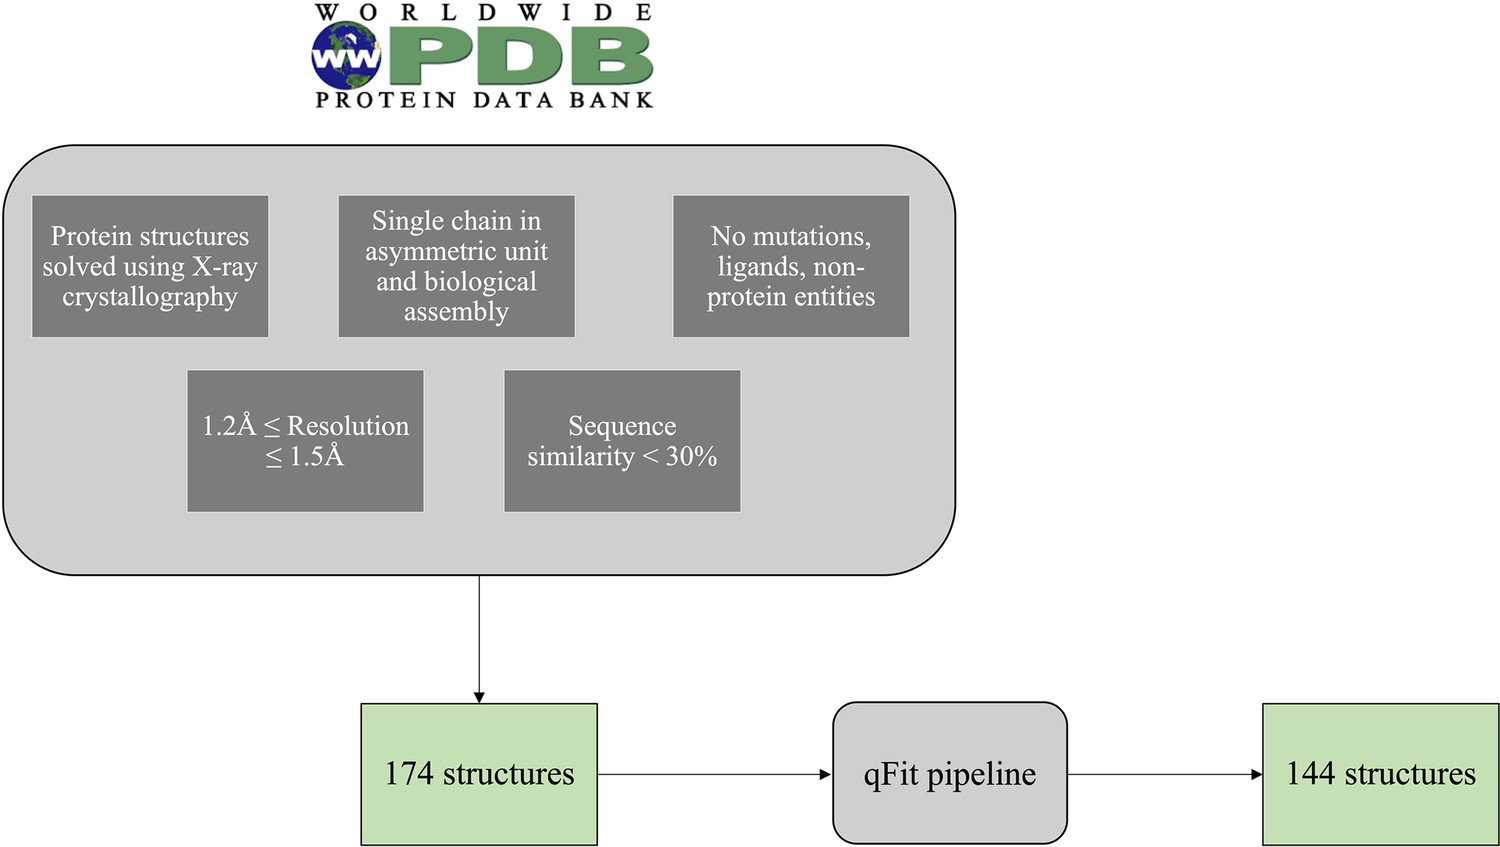
Flow diagram of the selection of the test set PDBs.
Figure 2—figure supplement 2
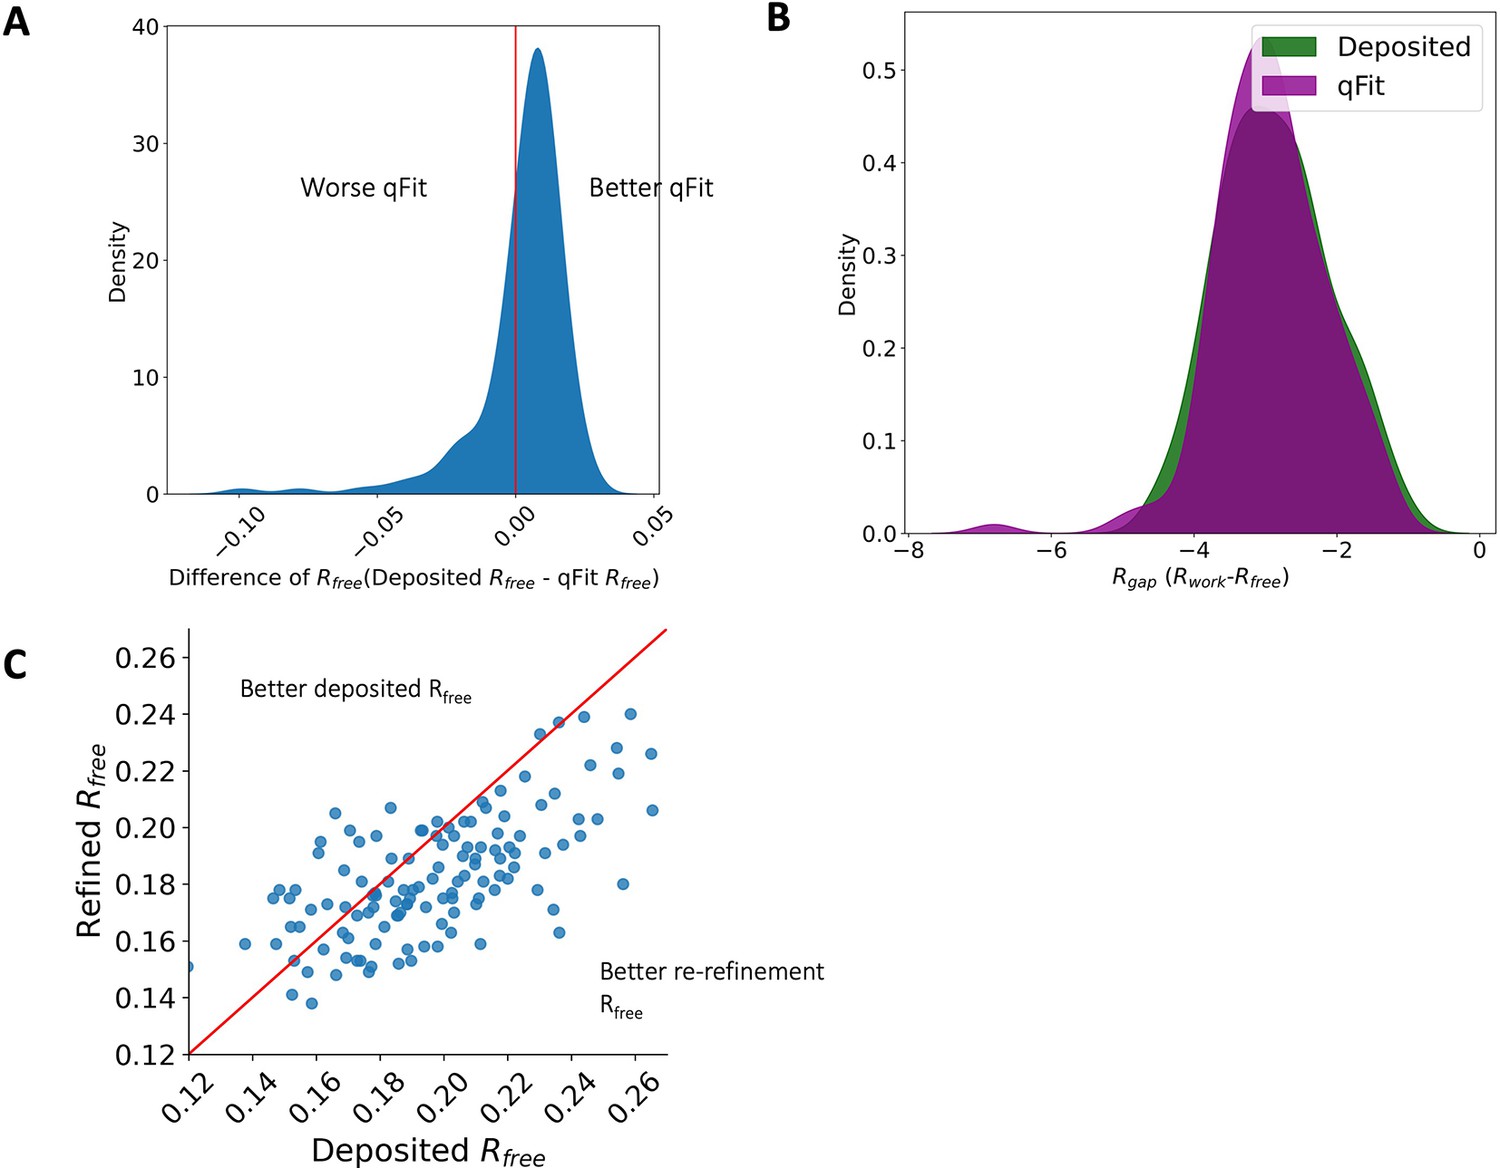
Rfree and R-gap distributions.
(A) Distribution of difference of Rfree between deposited and qFit models. The median difference in Rfree is 0.6%. Median deposited models Rfree: 18.1%, median qFit models Rfree: 17.5%. (B) Distribution of R-gap values between deposited and qFit models (median deposited model: 3.0%, median qFit model: 3.0%). (C) Distribution of Rfree value in PDB deposited models versus re-refined deposited models. In this article, deposited models refer to the re-refined deposited models.
Figure 2—figure supplement 3
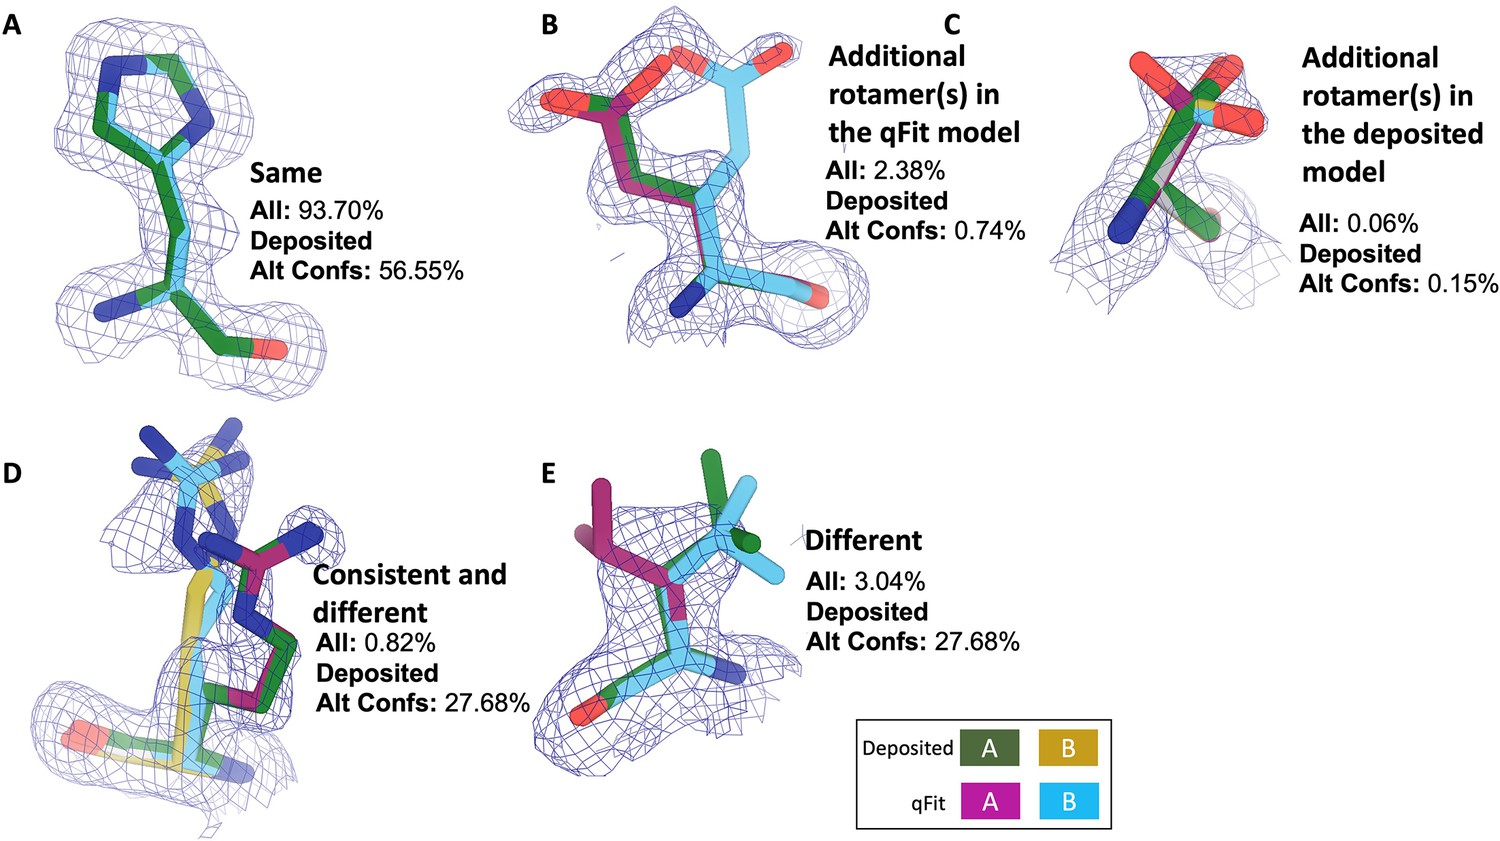
Examples of rotamer state categories.
Meshes represent 2Fo-Fc density at 1 σ. Green and yellow sticks represent deposited conformer(s). Blue and magenta sticks represent qFit conformer(s). (A) Same: the entire set of rotamers identified in the deposited and qFit models are the same (PDB: 1BN6, His199). (B) Additional rotamer(s) in the qFit model: deposited and qFit models share at least one rotamer, and at least one additional rotamer was identified in the qFit model (PDB: 3CX2, Glu165). (C) Additional rotamer(s) in the deposited model: deposited and qFit models share at least one rotamer, and at least one additional rotamer was identified in the deposited model (PDB: 4P48, Ser6). (D) Consistent and different: deposited and qFit models share at least one rotamer, and at least one unique additional rotamer was identified in both the deposited model and the qFit model (PDB: 3HP4, Arg81). (E) Different: the rotamers in the deposited and qFit models are all different (PDB: 1BN6, Glu110).
Figure 3 with 1 supplement
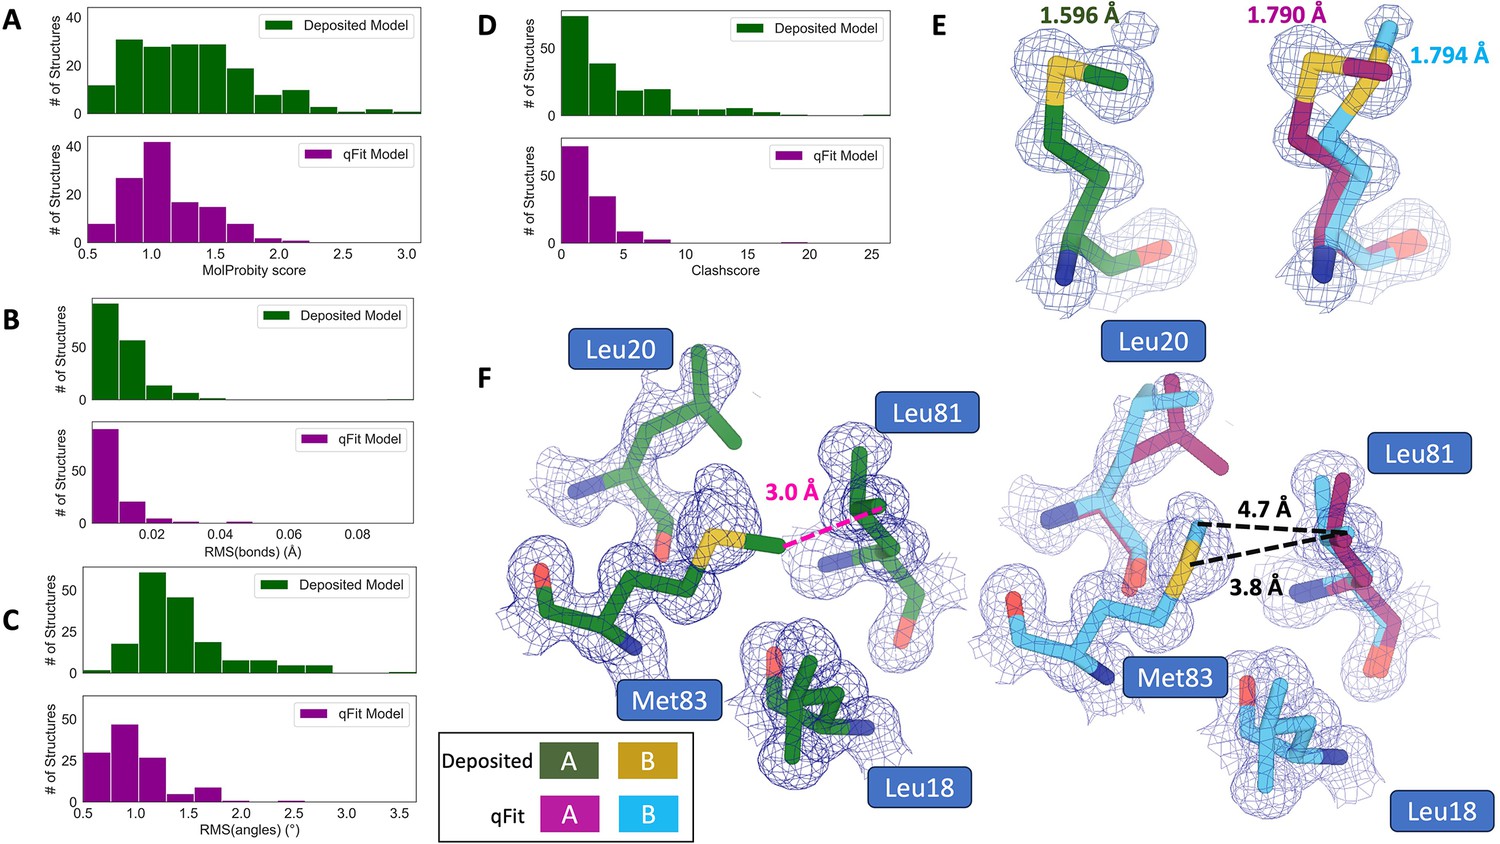
qFit improves some geometry metrics compared to deposited structures.
(A) Model MolProbity score (deposited model: 1.27 (median) [0.94–0.16] (interquartile range), qFit model: 1.09 (median) [0.90–1.30] (interquartile range)), p-value = 0.006 from two-sided t-test. (B) Model averaged root-mean-square deviation (RMSD) (Å) of idealized versus model bond lengths (deposited model: 0.010 [0.0070–0.015], qFit model: 0.0073 [0.005–0.011]), p-value = 0.002 from two-sided t-test. (C) Model averaged RMSD (Å) of idealized versus model bond angles (deposited model: 1.30 [1.14–1.57], qFit model: 0.91 [0.77–1.13]), p-value = 3.79e-16 from two-sided t-test. (D). Model clashscore (deposited model: 2.50 [1.30–5.92], qFit model: 1.80 [1.31–3.73]), p-value = 0.0028 from two-sided t-test. (E). Example of qFit (right, blue, and magenta) fixing bond length by appropriately modeling in a second conformation. Meshes represent 2Fo-Fc density at 1 σ. Met189 from deposited structure (PDB: 1VF8; left, green) has a Sδ-Cε bond length of 1.596 Å (7.8 σ from idealized length of 1.791 Å) (Williams et al., 2018). qFit models two alternative conformations, filling in unmodeled density, and fixing the Sδ-Cε bond length (1.790 Å for alternative conformation A and 1.794 Å for alternative conformation B). (F) Example of qFit (right, blue, and magenta) fixing a clash between Met83 and Leu81 from deposited structure (PDB: 6HEQ). Meshes represent density at 1 σ. In the deposited model (left, green), Met83 is not correctly fitted into density and is clashing with Leu81 (closest contact: 3.0 Å). qFit corrects this by improving the fit of Met83, leading to the closest contact being 3.8 Å.
Figure 3—figure supplement 1
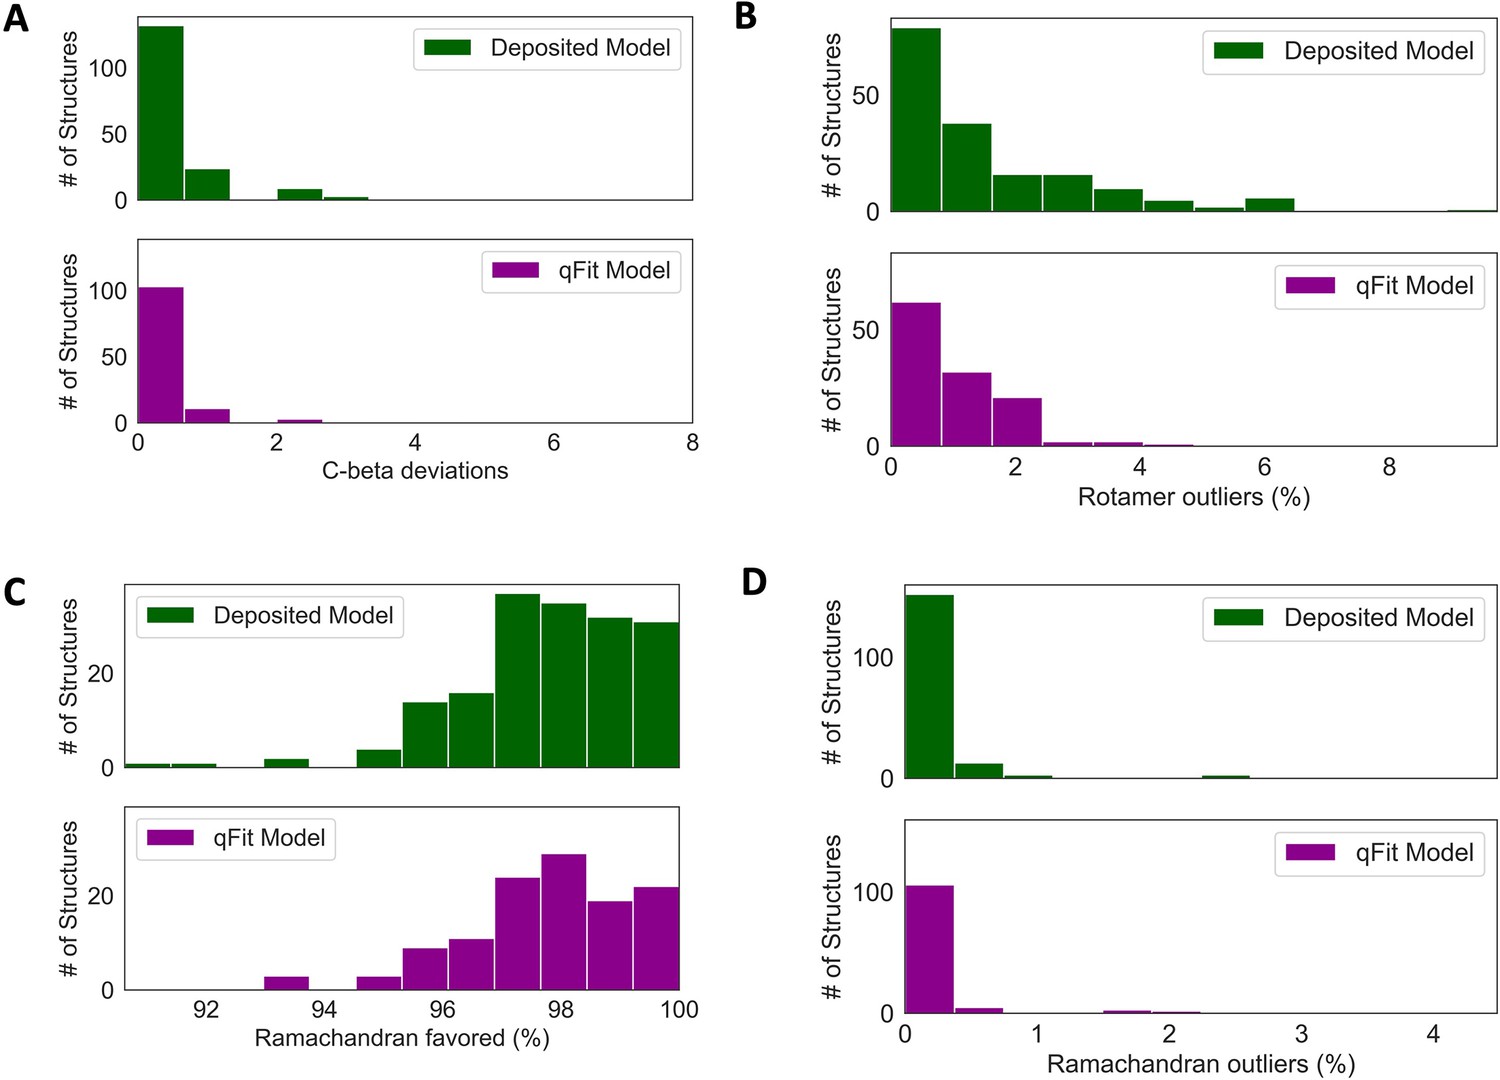
Deposited versus qFit model geometry.
(A) Count of number of Cβ deviation (>0.25 Å) per model (deposited model: 0.0 median [interquartile range: 0.0–0.0], qFit model: 0.0 median [interquartile range: 0.0–0.0]), p-value = 0.37 from two-sided t-test. (B) Median count of number of rotamer outliers per model (deposited model: 0.94 [0.00–2.12], qFit model: 0.81 [0.35–1.60]), p-value = 0.73 from two-sided t-test. (C) Percent of Ramachandran favored per model: deposited model (97.70 [96.90–98.93], qFit model: 98.0 [97.05–98.97]), p-value = 0.77 from two-sided t-test. (D) Percent of Ramachandran outliers per model (deposited model 0.0 [0.0–0.0], qFit model: 0.0 [0.0–0.0]), p-value = 0.57 from two-sided t-test.
Figure 4 with 3 supplements
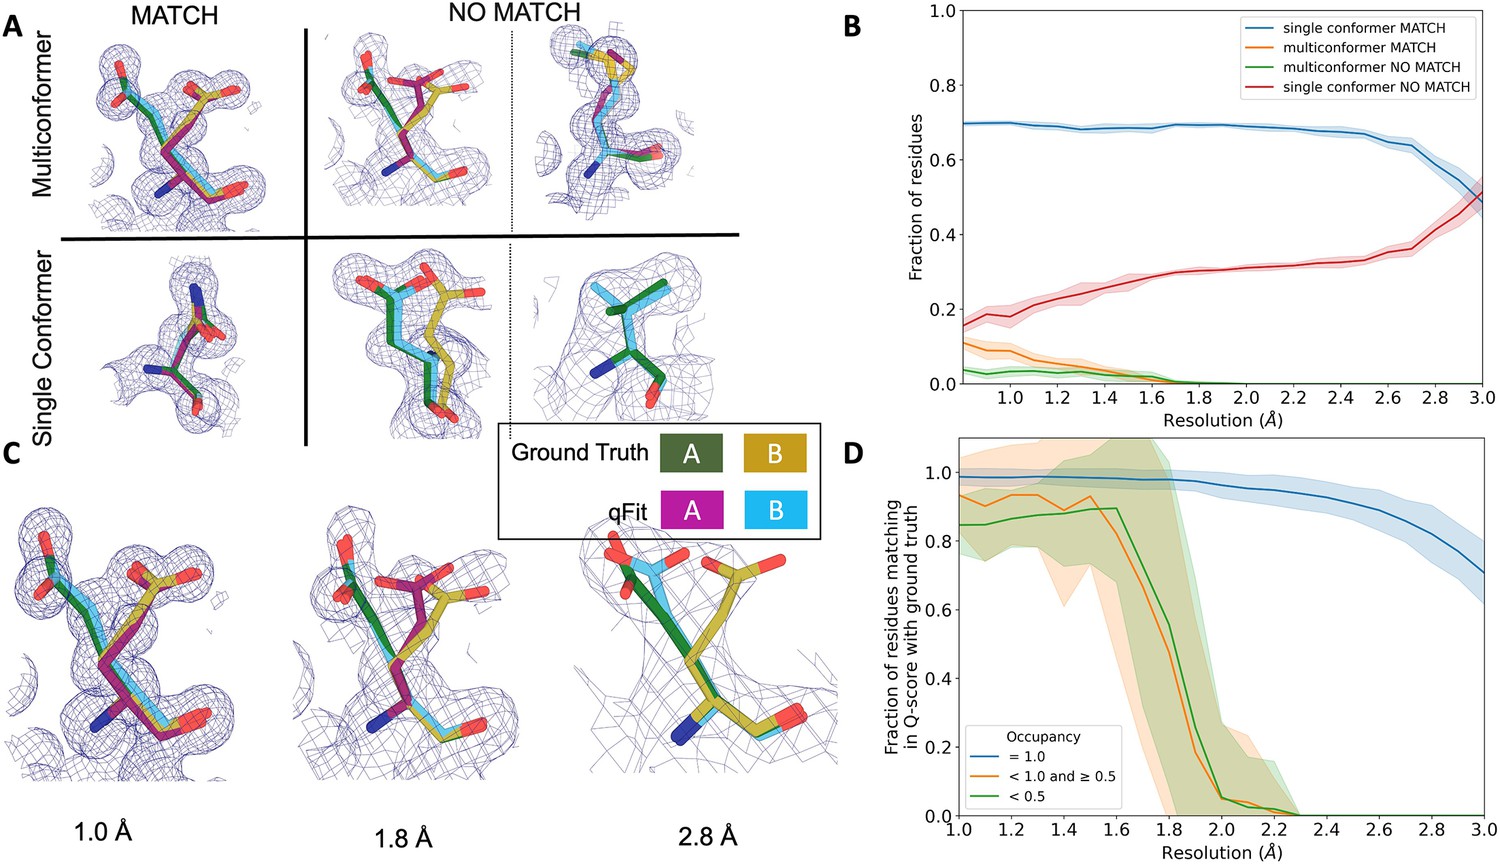
qFit performs best at high resolution of input dataset.
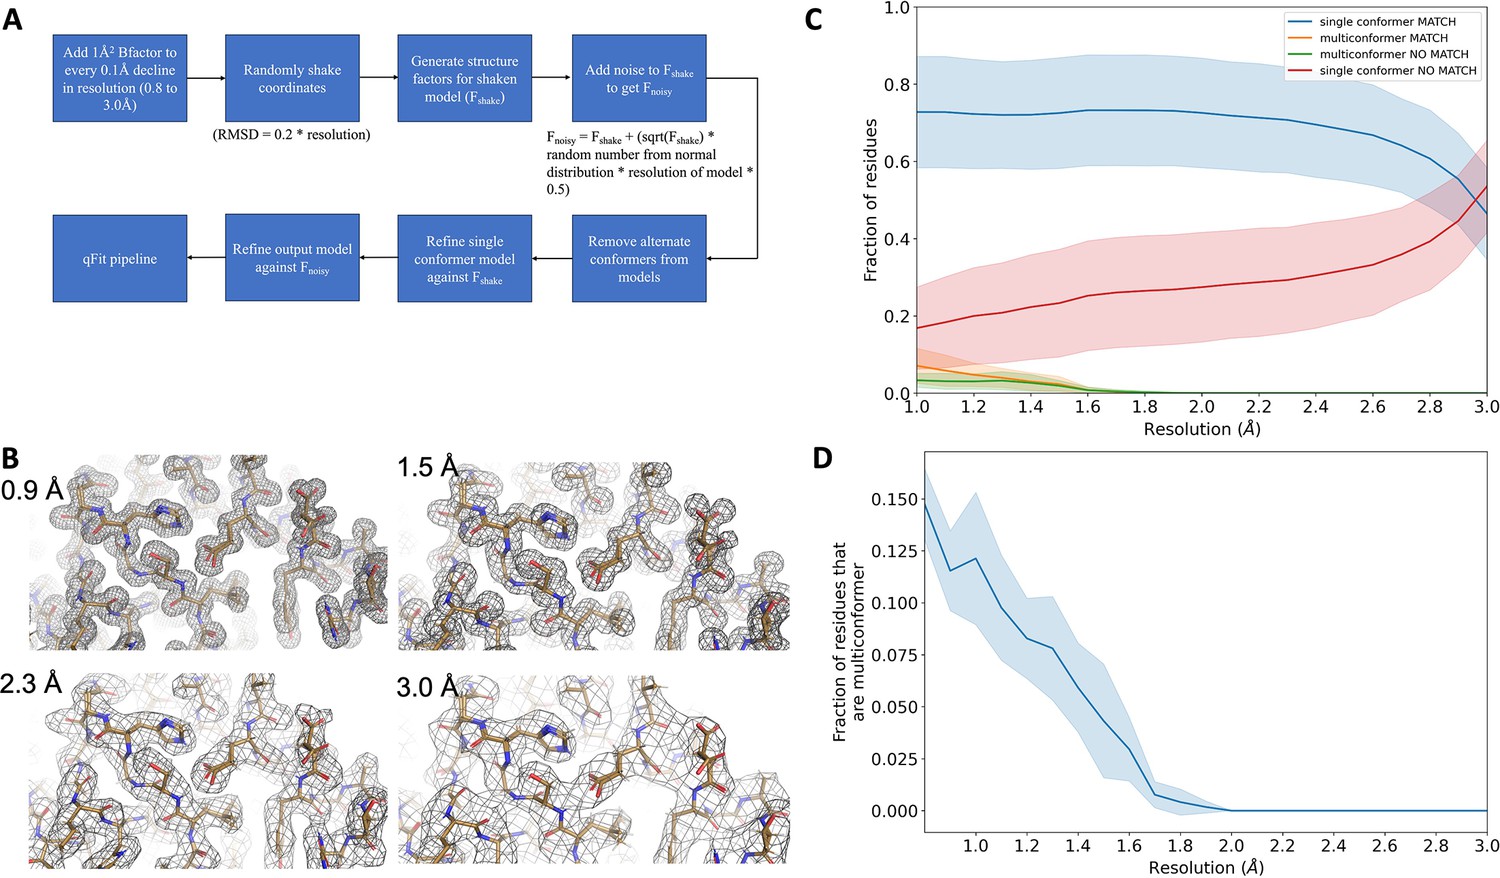
(A) Ground truth model residues are shown as green and yellow sticks; qFit model residues are shown as magenta, cyan, and gray. Meshes represent density at 1 σ. Multiconformer match: residue is multiconformer in qFit model with root-mean-square deviation (RMSD) < 0.5 Å from ground truth residue. qFit models two distinct alternate conformations which recapitulate the ground truth residue’s alternate conformations. Multiconformer no match: residue is multiconformer in qFit model with RMSD > 0.5 Å from ground truth residue. The example on the left has two alternate conformations in the ground truth. qFit models only one of them correctly. The example on the right is a single-conformation residue in ground truth but qFit models three alternate conformations. Single conformer match: residue is single-conformer in qFit model with RMSD < 0.5 Å from ground truth residue. Both ground truth model and qFit model have one distinct conformation and they align well. Single conformer no match: residue is single conformer in qFit model with RMSD > 0.5 Å from ground truth residue. The example on the left has two alternative conformations in the ground truth residue but only one conformation in the qFit residue. In the example on the right, the single conformer modeled by qFit does not align with the ground truth single conformer. (B) Proportion of all residues in the qFit models of 7KR0 that are modeled as multiconformer match (orange), single conformer match (blue), multiconformer no match (green), and single conformer no match (red) as a function of resolution of input synthetic data from the 7KR0 dataset. The shaded region denotes the 95% confidence interval. (C) Glu114 in the 7KR0 dataset modeled by qFit (cyan and magenta) compared to the ground truth structure (green and yellow) at different synthetic resolutions. Meshes represent density at 1 σ. (D) The fraction of residues in the qFit models of the qFit test dataset with a Q-score within 0.01 to that of the ground truth model as a function of resolution. In multiconformer residues, Q-score for every alternative conformation is calculated separately. Q-scores of residues (or) conformers which have matching occupancy (range) are compared. Occupancies of conformers were binned into three classes: occupancy equal to 1 (blue), 1 > occupancy ≥ 0.5 (orange) and occupancy < 0.5 (green).
Figure 4—figure supplement 1
Synthetic dataset generation and validation.
(A) Protocol for generating synthetic structure factors at various resolutions starting from the ground truth model. For the 7KR0 dataset, all the steps starting from random shaking of coordinates were done 10 times for each resolution. For the larger test dataset, all steps were only done once. (B) A visualization of synthetic maps generated for the models at varying resolution. The loss in detail of density is clearly visible with worsening resolution. (C) Proportion of all residues in qFit models which have been modeled as multiconformers in the 7KR0 dataset as a function of resolution. The shaded region around the line indicates the spread across 10 runs at every resolution step. (D) Proportion of all residues in the qFit models of qFit test dataset which are modeled as multiconformer match (orange), single conformer match (blue), multiconformer no match (green), and single conformer no match as a function of resolution of input data. The shaded region around the lines indicates the spread across the qFit test dataset which consists of 103 proteins.
Figure 4—figure supplement 2
Synthetic dataset statistics breakdown.
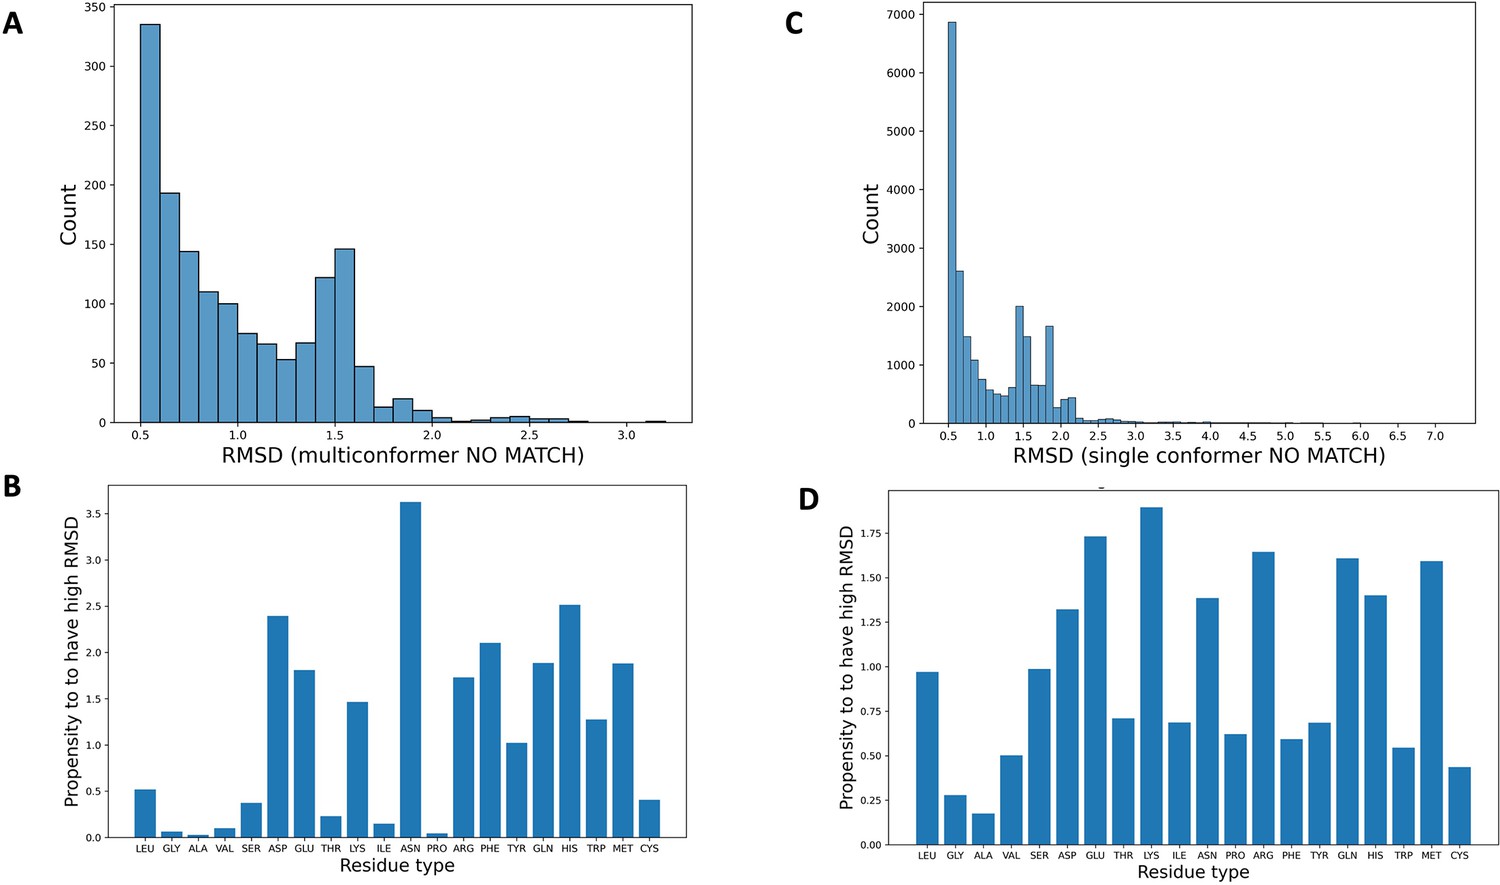
(A) The distribution of root-mean-square deviation (RMSD) between qFit residues and corresponding ground truth residues (qFit test set) whenever the RMSD is higher than the 0.5 Å cutoff, resulting in the qFit residues being classified as multiconformer no match. (B) The propensity of each residue type to be modeled with high RMSD from the ground truth (qFit test set), resulting in being classified as multiconformer no match. This propensity of a residue type x is calculated as the ratio between (i) proportion of residue type x among all the residues with a high RMSD and (ii) proportion of residue type x in the entire dataset. (C) The distribution of RMSD between qFit residues and corresponding ground truth residues (qFit test set) whenever the RMSD is higher than the 0.5 Å cutoff, resulting in the qFit residues being classified as single conformer no match. (D) The propensity of each residue type to be modeled with high RMSD from the ground truth (qFit test set), resulting in being classified as single conformer no match.
Figure 4—figure supplement 3
Comparison of Rfree statistic and occupancy across synthetic dataset.
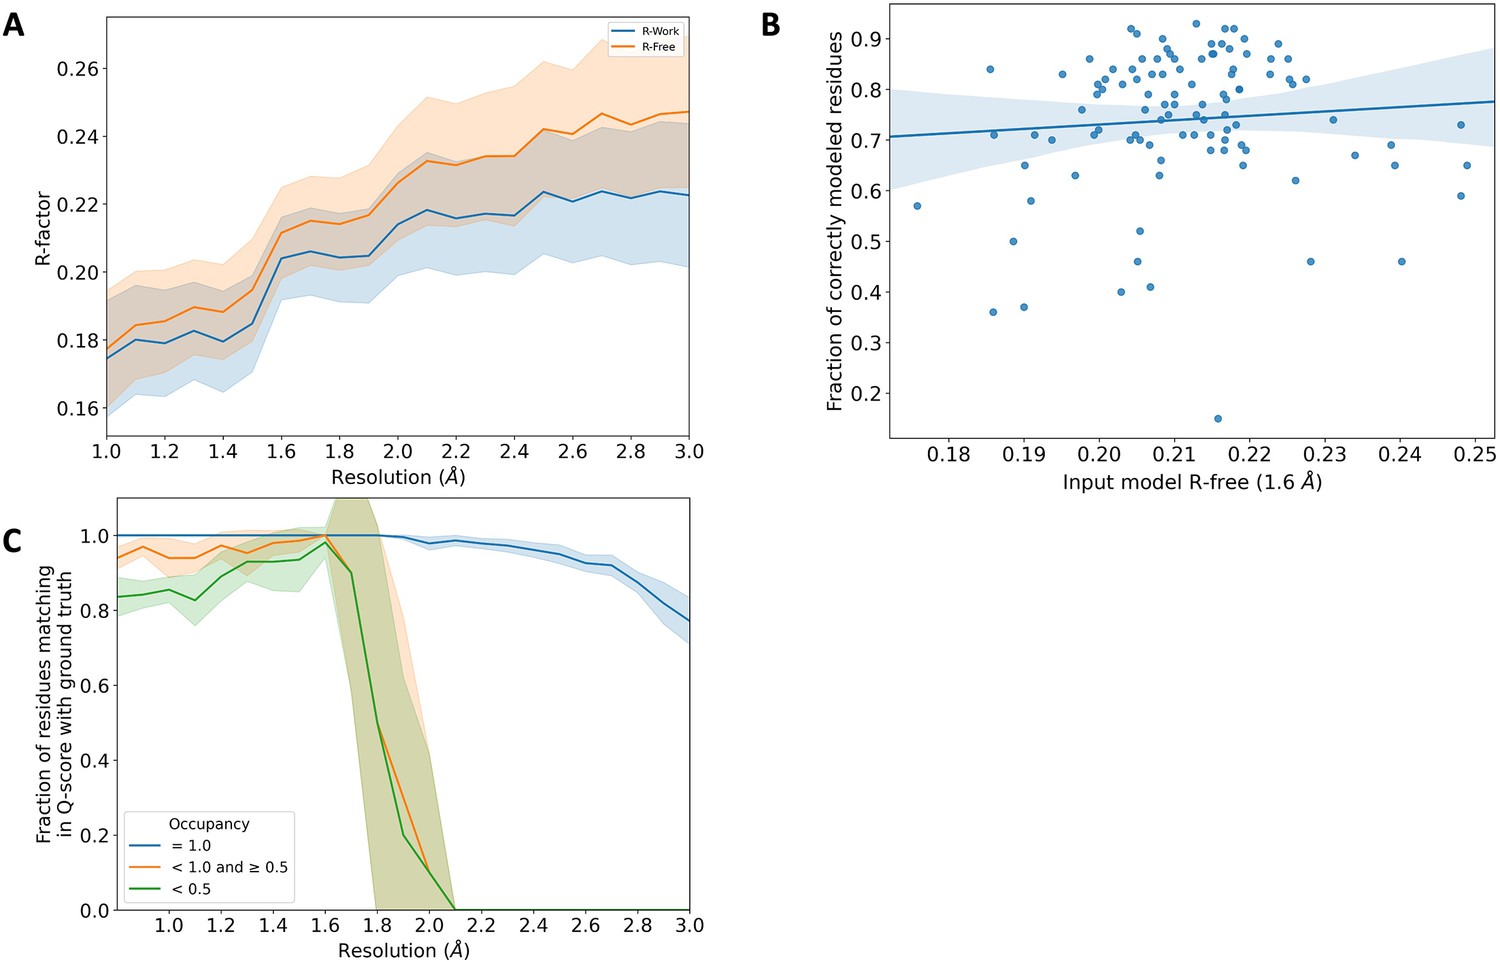
(A) Rwork (blue) and Rfree (orange) distribution of the input model from the qFit test dataset. These correspond to the models obtained after refining against Fnoisy structure factors (see Figure 4—figure supplement 1). The shaded region around the lines indicates the spread (standard deviation) across the qFit test dataset. (B) Fraction of correctly modeled qFit residues (match multiconformer + match single conformer) as a function of input model Rfree for all structures in the qFit test dataset at 1.6 Å resolution (input Rfree range: 0.17–0.25, n = 103). The shaded region denotes the 95% confidence interval. (C) The fraction of residues in the qFit models of the 7KR0 dataset with a Q-score within 0.01 of that of the ground truth model as a function of resolution. In multiconformer residues, Q-score for every alternate conformer is calculated separately. Q-scores of residues (or) conformations which have matching occupancy (range) are compared. Occupancy of conformations were binned into three classes: occupancy equal to 1 (blue), 1 > occupancy ≥ 0.5 (orange), and occupancy <0.5 (green).
Figure 5 with 1 supplement
qFit identifies alternative conformations in high-resolution cryo-EM models.
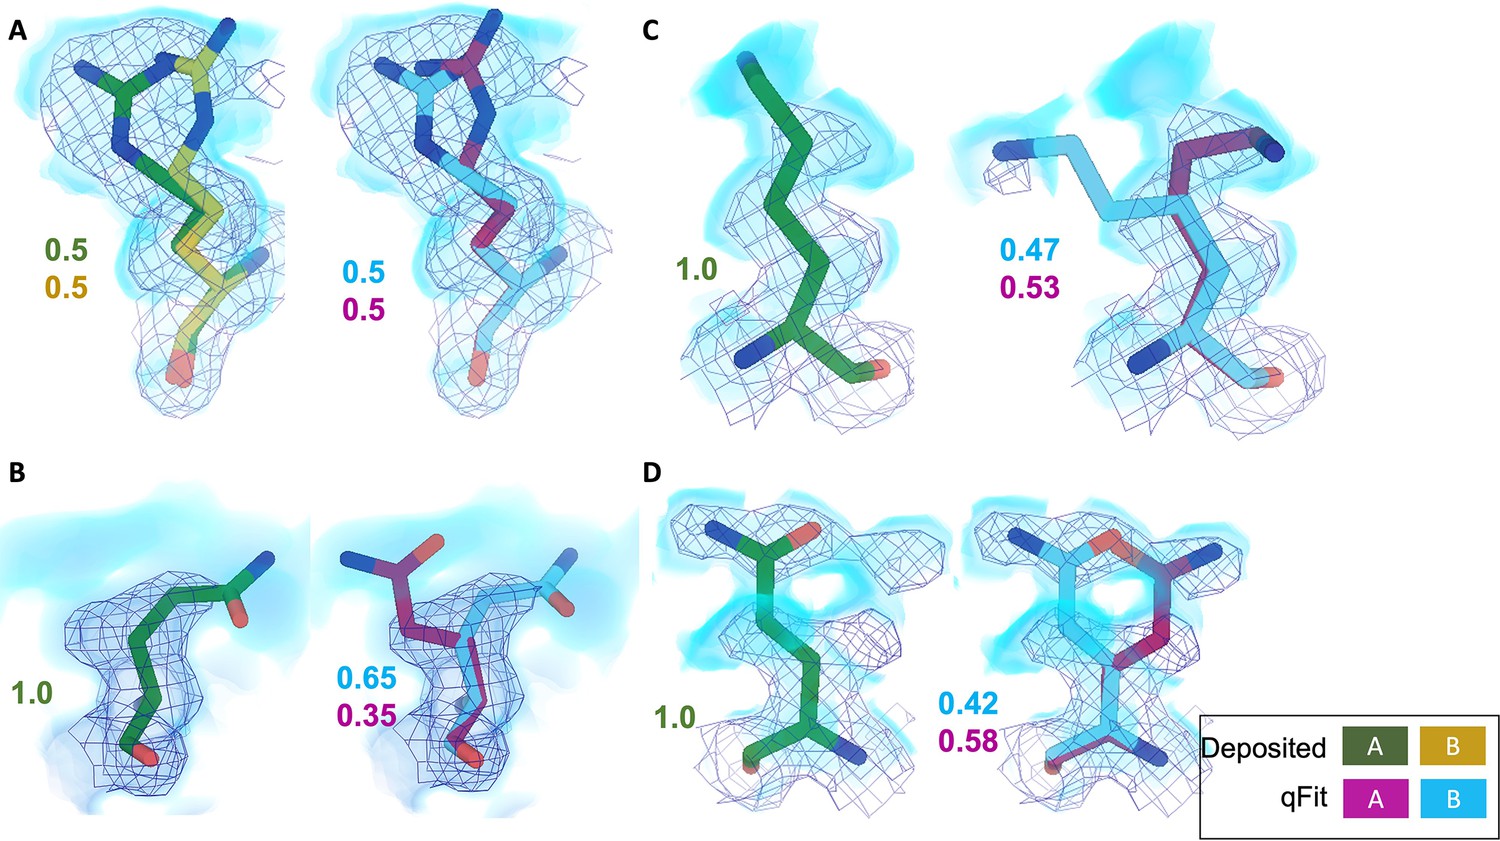
Meshes represent density at 1 σ, with blue volumes representing density at 0.5 σ. Green and yellow sticks represent deposited conformation(s). Cyan and magenta sticks represent qFit conformations. Occupancy is labeled based on each conformer. (A) qFit recapitulated the deposited alternative conformations of Arg22 (chain A) in apoferritin (PDB: 7A4M, resolution: 1.22 Å). (B) qFit identified a previously unmodeled alternative conformation of Glu14 (chain A) in apoferritin (PDB: 7A4M, resolution: 1.22 Å). (C) qFit identified a previously unmodeled alternative conformation of Lys49 (chain A) in a different structure of apoferritin (PDB: 6Z9E, resolution: 1.55 Å). (D) qFit identified a previously unmodeled alternative conformation of Gln403 (chain A) in adeno-associated virus (PDB: 7KFR, resolution: 1.56 Å).
Figure 5—figure supplement 1
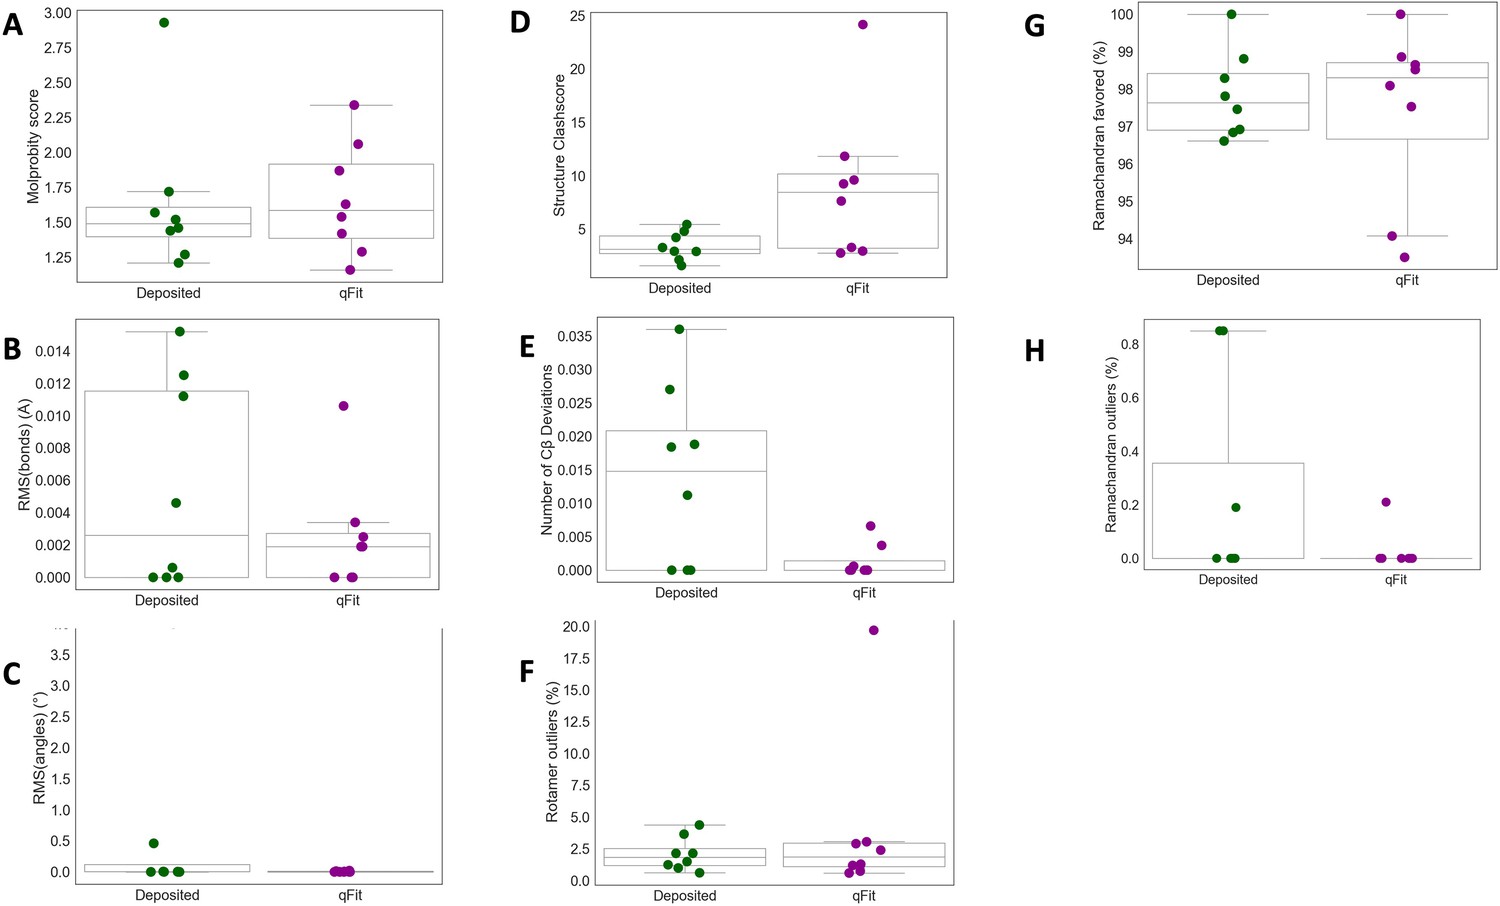
qFit improes some geometry metrics in cryo-EM models.
(A) MolProbity score (deposited model: 1.49 (median) [1.40–1.61] (interquartile range), qFit model: 1.59 (median) [1.39–1.92] (interquartile range)). (B) Model average of RMSD of model bond length from idealized bond length (Å) (deposited model: 0.00 [0.00–0.01], qFit model: 0.00 [0.00–0.00]). (C) Model average of RMSD of model bond angle from idealized bond angle (Å) (deposited model: 0.00 [0.00–0.11], qFit model: 0.00 [0.00–0.01]). (D) Number of residues with clashscore (deposited model: 3.15 [2.74–4.39], qFit model: 8.45 [3.22–10.17]). (E) Number of Cβ deviation (>0.25 Å) per model (deposited model: 0.02 [0.00–0.02], qFit model: 0.00 [0.00–0.00]). (F) Number of rotamer outliers per model (deposited model: 2.0 [2.0–2.0], qFit model: 2.0 [1.0–3.0]). (G) Percent of Ramachandran favored per model (deposited model: 97.6 [96.9–98.9], qFit model: 98.3 [96.7–98.7]).(H) Percent of Ramachandran outliers per model (deposited model: 0.0 [0.0–0.0], qFit model: 0.0 [0.0–0.0]).
Additional files
-
Supplementary file 1
High-resolution X-ray crystallography dataset information including PDB, R-free/R-work.
- https://cdn.elifesciences.org/articles/90606/elife-90606-supp1-v1.xlsx
-
Supplementary file 2
High-resolution cryo-EM dataset information including resolution, geometry information.
- https://cdn.elifesciences.org/articles/90606/elife-90606-supp2-v1.xlsx
-
MDAR checklist
- https://cdn.elifesciences.org/articles/90606/elife-90606-mdarchecklist1-v1.docx
Download links
A two-part list of links to download the article, or parts of the article, in various formats.
Downloads (link to download the article as PDF)
Open citations (links to open the citations from this article in various online reference manager services)
Cite this article (links to download the citations from this article in formats compatible with various reference manager tools)
Automated multiconformer model building for X-ray crystallography and cryo-EM
eLife 12:RP90606.
https://doi.org/10.7554/eLife.90606.3


