Novel sterol binding domains in bacteria
- Department of Chemistry and Sarafan ChEM-H, Stanford University, United States
- Department of Earth System Science, Stanford University, United States
- Department of Chemistry and Stanford Synchrotron Radiation Lightsource, Stanford University, United States
- Department of Microbiology and Immunology, Stanford University School of Medicine, United States
Figures
Figure 1
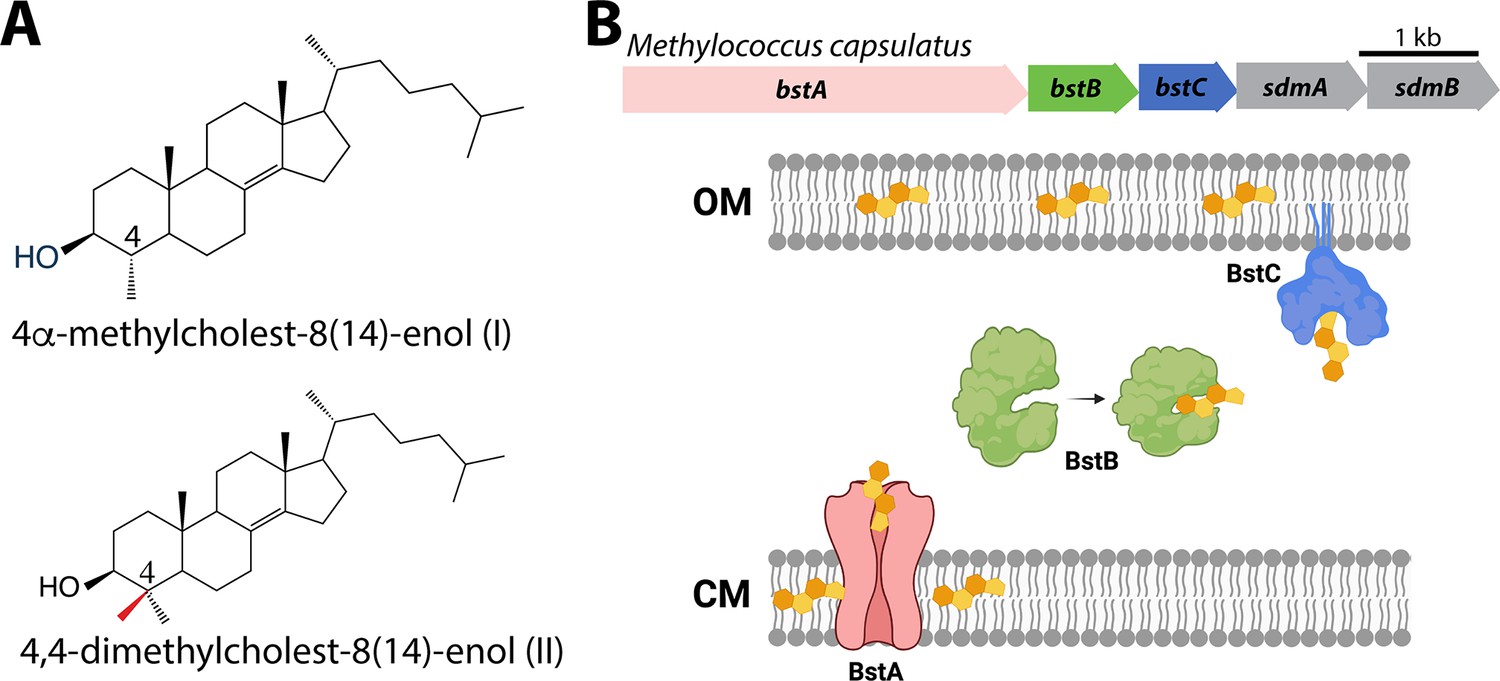
Sterols and their transport in Methylococcus capsulatus.
(A) Structures of C-4 methylated sterols synthesized by Methylococcus capsulatus. (B) Operon of sterol biosynthesis and transport genes and (top) and schematic description of their localization. OM: outer membrane; CM: cytoplasmic membrane.
Figure 2
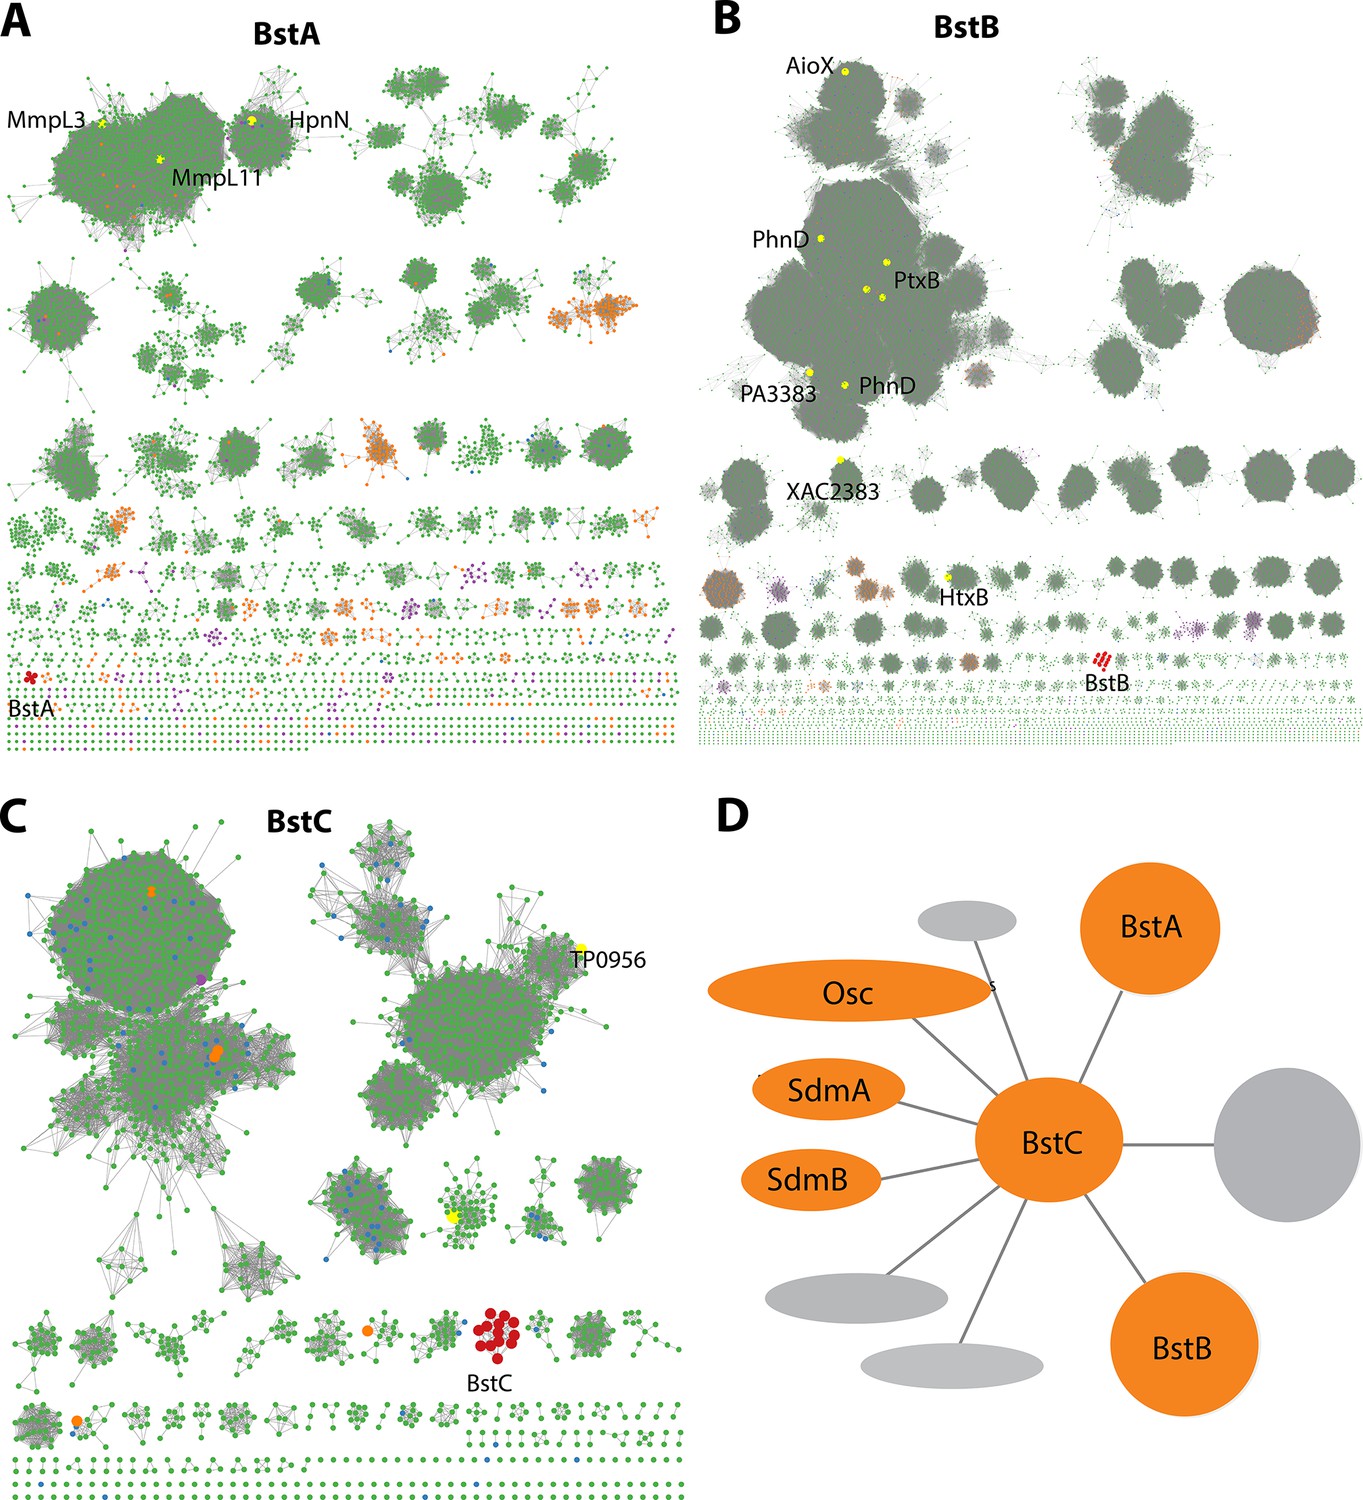
Bioinformatic analysis of Bst proteins.
(A–C): Protein sequence similarity networks (SSN) of BstA, BstB and BstC with the cutoff of 35%, 40%, and 40% sequence identity, respectively. Taxonomic distribution of Bst protein families showing their presence in bacterial (green), eukaryotic (purple), and archaeal (orange) genomes. (D) Genome neighborhood network of Bst proteins. Shown in circles and ovals are genes within 10 genes of BstC; colored in orange are those with identified or predicted roles in sterol synthesis and trafficking.
Figure 3 with 2 supplements
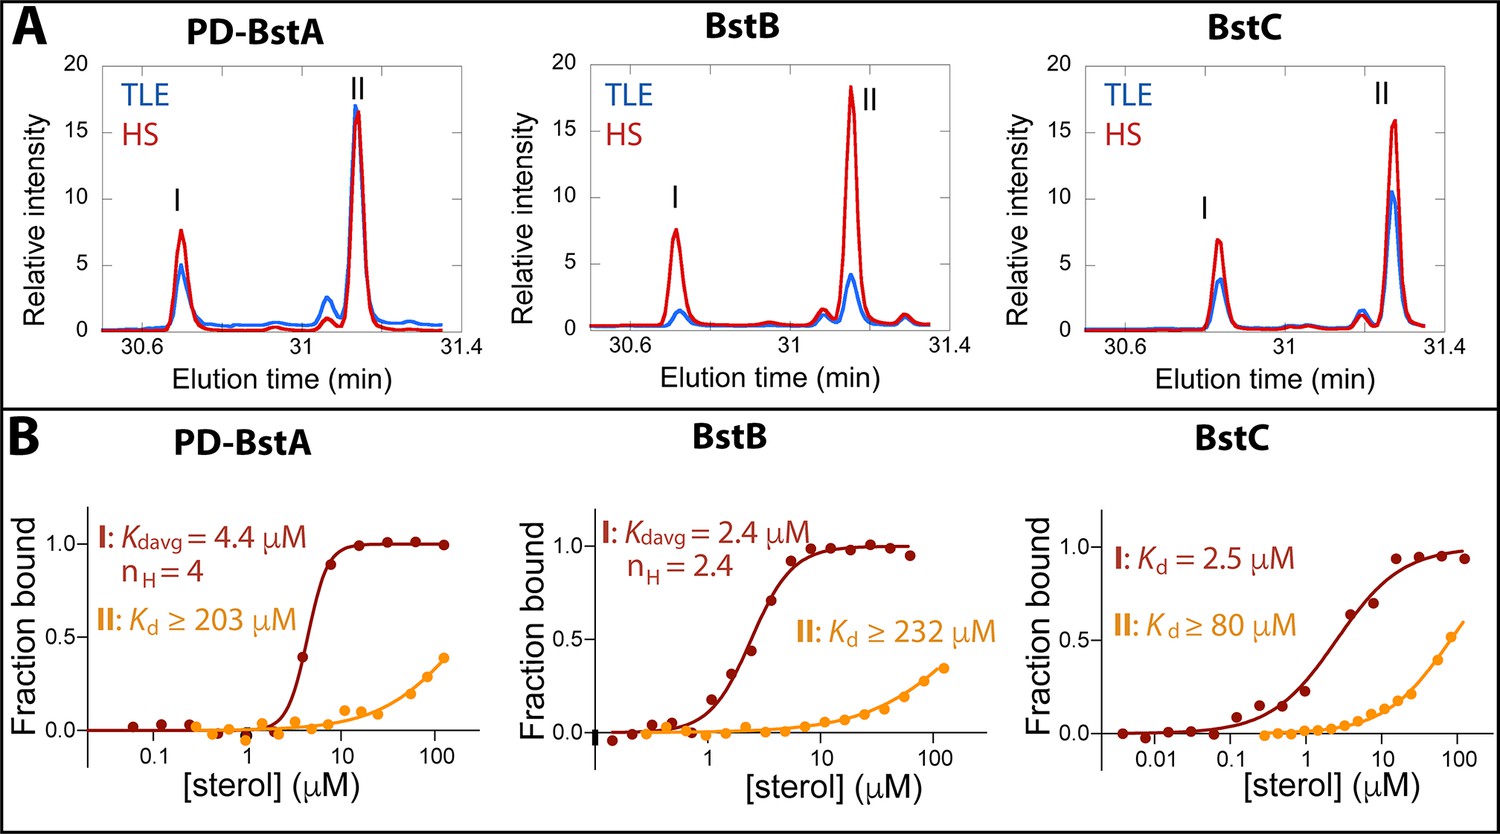
Binding of C-4 methylated sterols to transporter proteins.
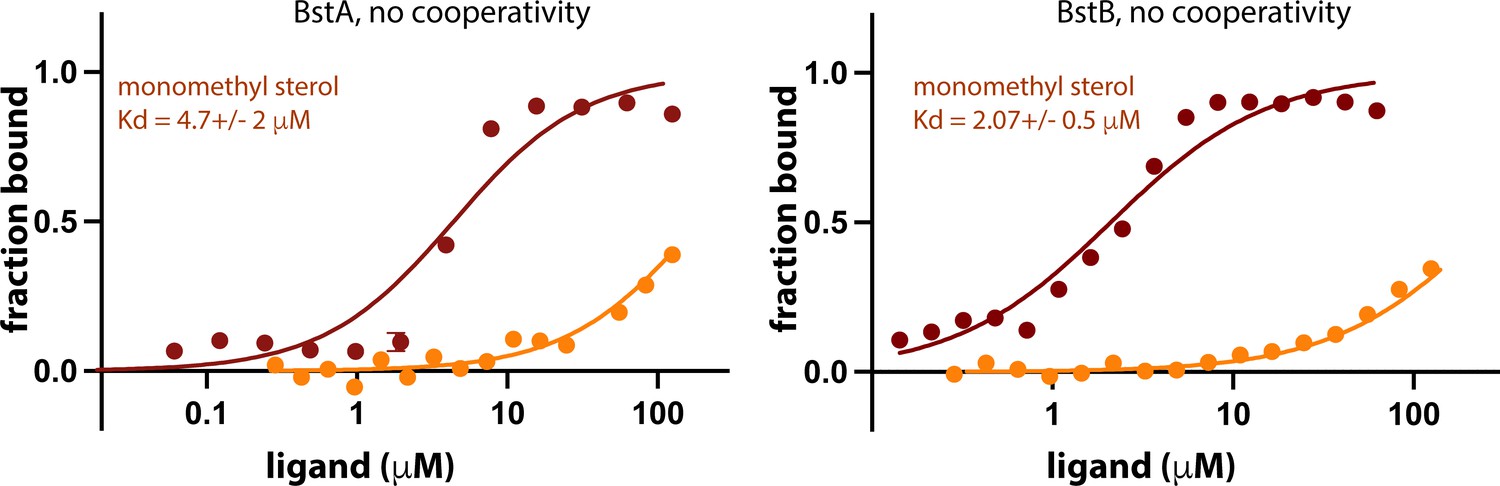
(A) GC chromatograms of sterols bound to purified (40 µM) M. capsulatus BstAPD, BstB, and BstC during protein-lipid pull-down assays. The proteins preferentially bind 4-monomethyl (I) and 4,4-dimethyl (II) sterols when incubated with the total lipid extract (TLE) and hydroxy lipid (HS) fraction from M. capsulatus. (B) MST analysis of the proteins (50 nM) binding to C-4 methylated sterols (3.8 nM –1125 mM). Equilibrium dissociation constants (Kd) and Hill coefficients (nH) are reported on the plots.
Figure 3—figure supplement 1
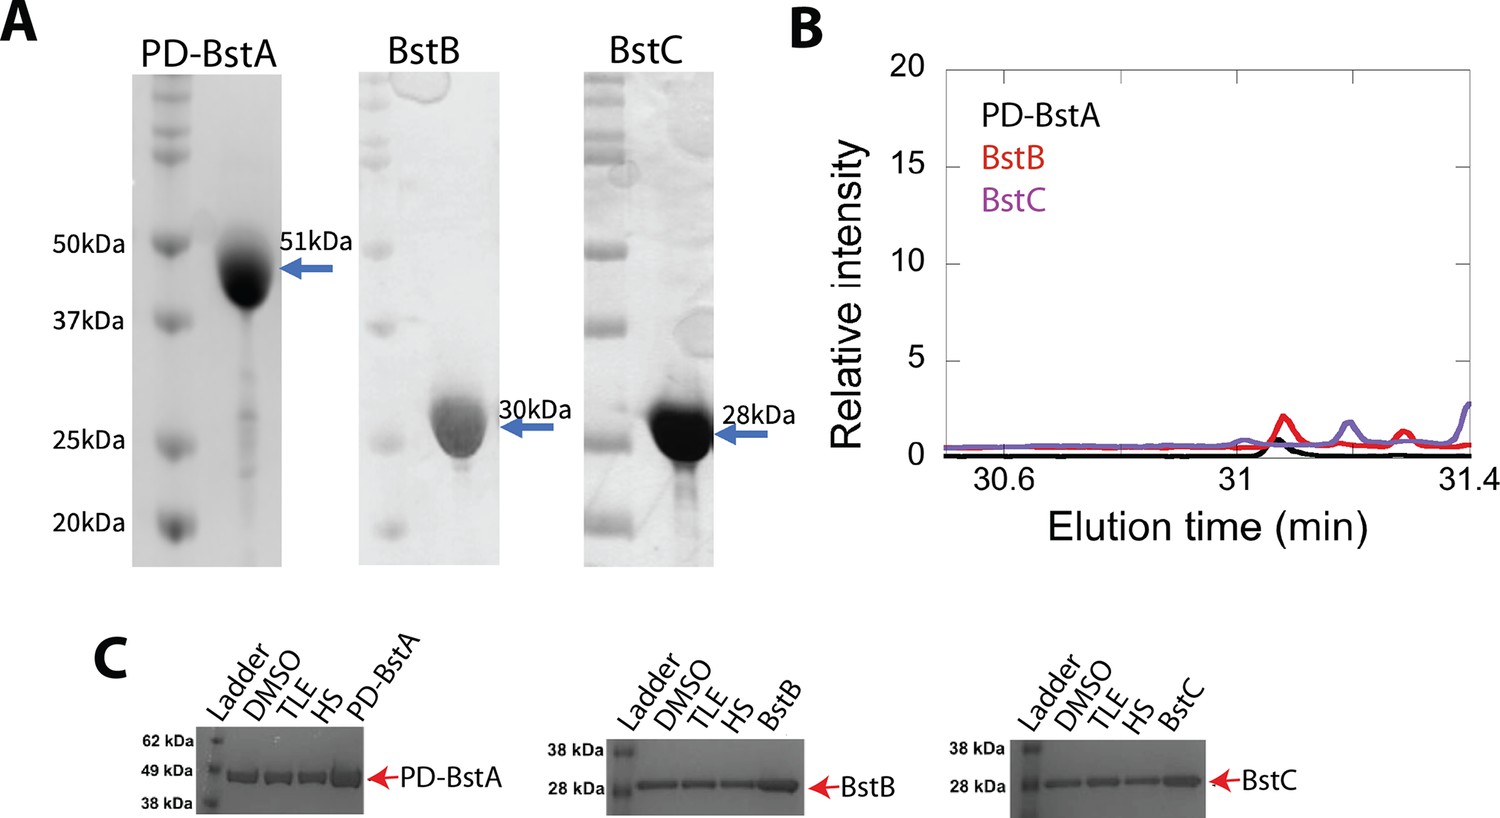
Purified BstABC proteins.
(A) SDS-PAGE gel of pure BstAPD, BstB, and BstC. All proteins are estimated to be more than 90% pure. (B) GC chromatograms of protein-lipid pull down control experiments (DMSO-treated samples) reveal that the proteins do not contain C4-methylsterols when M. capsulatus lipids (TLE or HS fraction) are not present. (C) SDS PAGE gels demonstrating that the samples analyzed in the protein-lipid pull down assays did contain BstAPD, BstB, and BstC.
-
Figure 3—figure supplement 1—source data 1
Raw purification gel of PD-BstA.
Original image of Figure 3—figure supplement 1A.
- https://cdn.elifesciences.org/articles/90696/elife-90696-fig3-figsupp1-data1-v1.zip
-
Figure 3—figure supplement 1—source data 2
Marked purification gel of PD-BstA.
Original image of Figure 3—figure supplement 1A marked to show the band depicted in the figure.
- https://cdn.elifesciences.org/articles/90696/elife-90696-fig3-figsupp1-data2-v1.zip
-
Figure 3—figure supplement 1—source data 3
Raw purification gel of BstB.
Original image of Figure 3—figure supplement 1A.
- https://cdn.elifesciences.org/articles/90696/elife-90696-fig3-figsupp1-data3-v1.zip
-
Figure 3—figure supplement 1—source data 4
Marked purification gel of BstB.
Original image of Figure 3—figure supplement 1A marked to show the band depicted in the figure.
- https://cdn.elifesciences.org/articles/90696/elife-90696-fig3-figsupp1-data4-v1.zip
-
Figure 3—figure supplement 1—source data 5
Raw purification gel of BstC.
Original image of Figure 3—figure supplement 1A.
- https://cdn.elifesciences.org/articles/90696/elife-90696-fig3-figsupp1-data5-v1.zip
-
Figure 3—figure supplement 1—source data 6
Marked purification gel of BstC.
Original image of Figure 3—figure supplement 1A marked to show the band depicted in the figure.
- https://cdn.elifesciences.org/articles/90696/elife-90696-fig3-figsupp1-data6-v1.zip
-
Figure 3—figure supplement 1—source data 7
Raw pulldown gel of PD-BstA.
Original image of Figure 3—figure supplement 1C.
- https://cdn.elifesciences.org/articles/90696/elife-90696-fig3-figsupp1-data7-v1.zip
-
Figure 3—figure supplement 1—source data 8
Raw pulldown gel of PD-BstA.
Original image of Figure 3—figure supplement 1C marked to show the bands depicted in the figure.
- https://cdn.elifesciences.org/articles/90696/elife-90696-fig3-figsupp1-data8-v1.zip
-
Figure 3—figure supplement 1—source data 9
Raw pulldown gel of BstB.
Original image of Figure 3—figure supplement 1C.
- https://cdn.elifesciences.org/articles/90696/elife-90696-fig3-figsupp1-data9-v1.zip
-
Figure 3—figure supplement 1—source data 10
Raw pulldown gel of BstB.
Original image of Figure 3—figure supplement 1C marked to show the bands depicted in the figure.
- https://cdn.elifesciences.org/articles/90696/elife-90696-fig3-figsupp1-data10-v1.zip
-
Figure 3—figure supplement 1—source data 11
Raw pulldown gel of BstC.
Original image of Figure 3—figure supplement 1C.
- https://cdn.elifesciences.org/articles/90696/elife-90696-fig3-figsupp1-data11-v1.zip
-
Figure 3—figure supplement 1—source data 12
Raw pulldown gel of BstC.
Original image of Figure 3—figure supplement 1C marked to show the bands depicted in the figure.
- https://cdn.elifesciences.org/articles/90696/elife-90696-fig3-figsupp1-data12-v1.zip
Figure 3—figure supplement 2

Binding of cholesterol (top) and lanosterol (bottom) to BstAPD, BstB, and BstC.
The data were acquired using the same conditions as reported for Figure 2. Each measurement was performed 3 times, but the average value reported as points and the standard deviation shown as error bars.
Figure 4 with 5 supplements
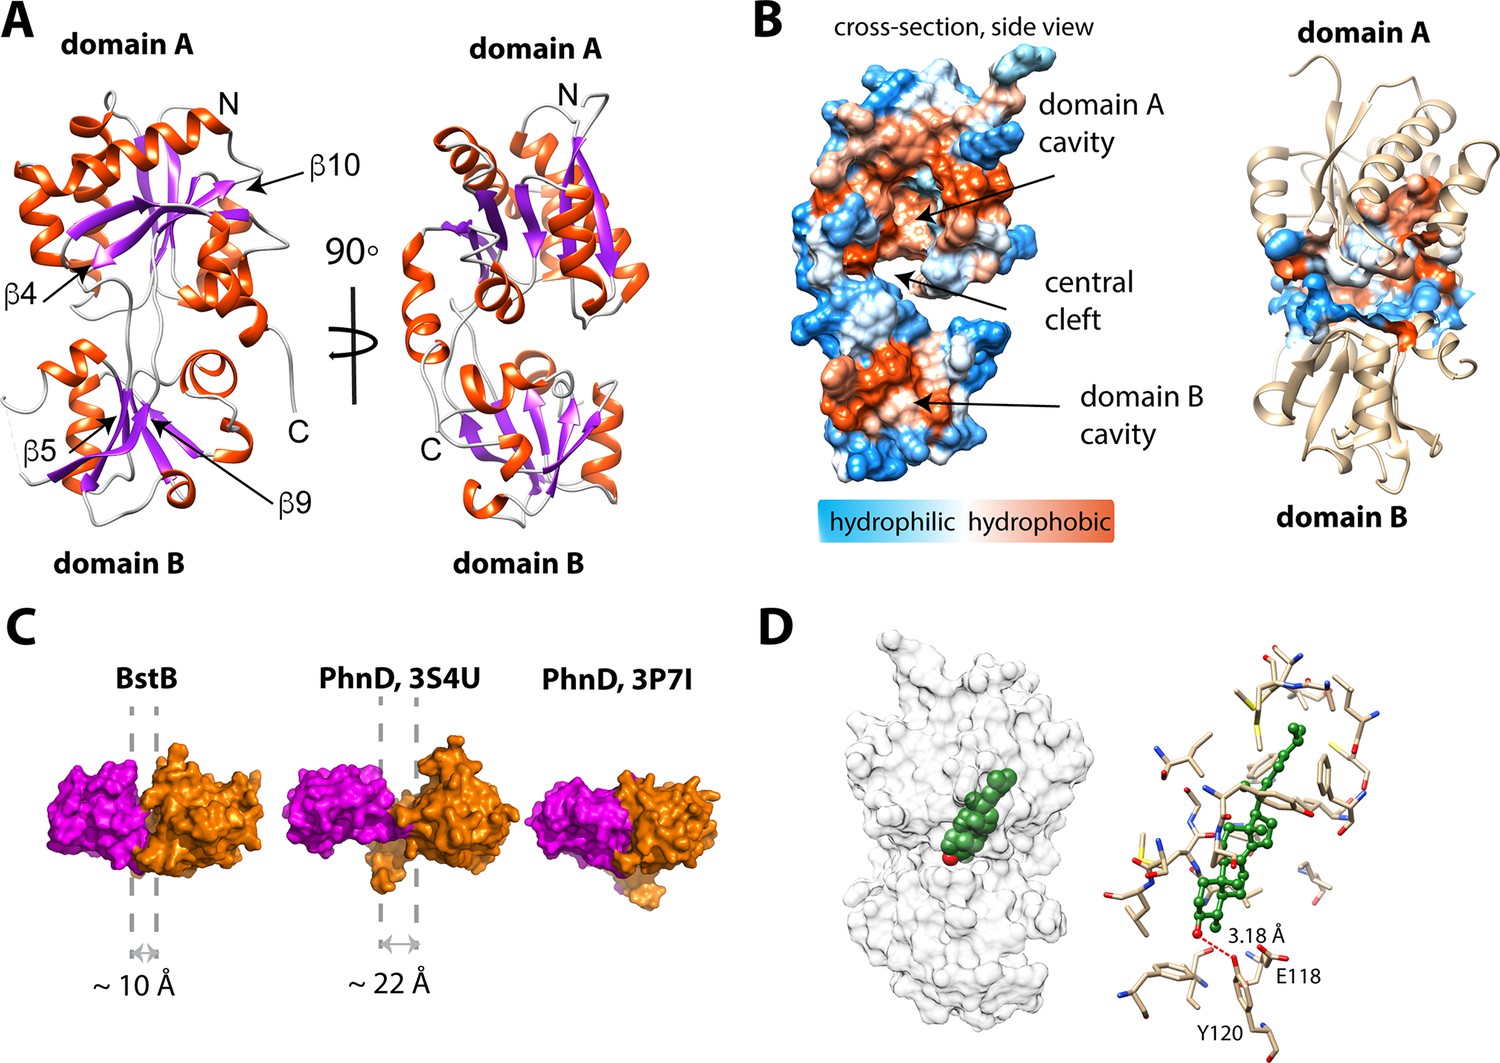
Structure of BstB.
(A) Cartoon representation of BstB with the α-helixes and β-strands colored in red and magenta, respectively. (B) Hydrophobicity representations of BstB show a cleft in the middle and a cavity in domain A. The cavity is dominatingly hydrophobic and open only to one side. (C) Comparison of the cleft between the two domains of BstB, apo-PhnD (3S4U), and liganded PhnD (3P7I). BstB displays a similar but narrower opening (~10 Å) compared to non-ligand PhnD (~22 Å). (D) Docking model of the structures of BstB with 4-monomethyl sterol. Left, the docking model is shown in surface representation with 80% transparency. Sterol is shown in sphere and colored in green with the hydroxyl group is colored in red; Right, docking complex of MonoA. The surrounding residues are shown in stick and ball. Hydrogen bonds between the hydroxyl group of the sterol and Tyr120 is shown in the red dashed line.
Figure 4—figure supplement 1
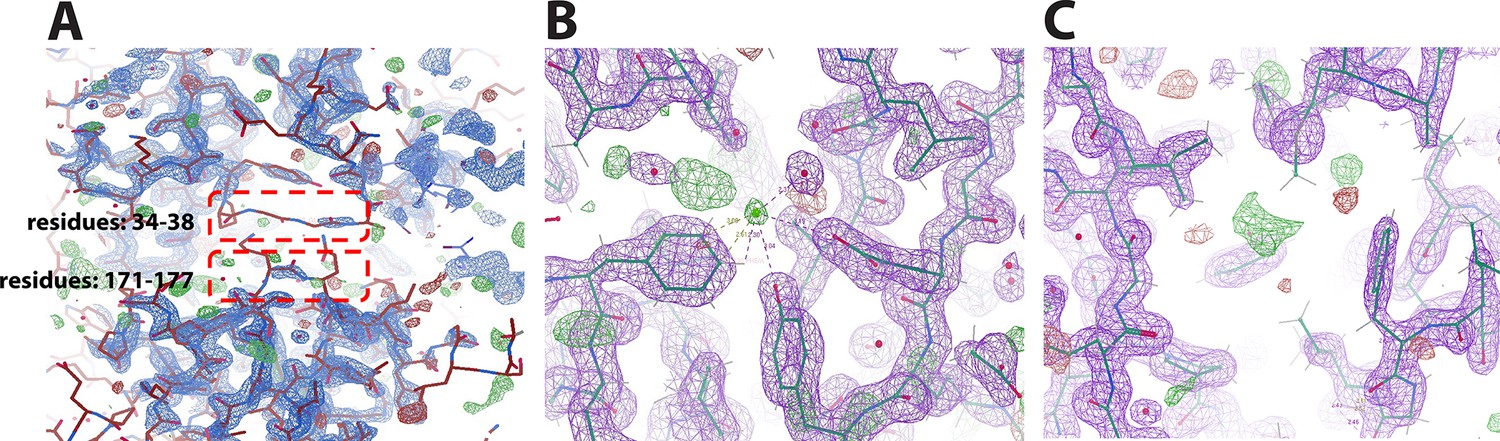
A portion of the 2Fo − Fc electron density omit map contoured at 2 σ and the Fo−Fc electron density omit map contoured at 3σ (green mesh) of BstB.
(A) Loops (residues 34–38 and 171–177) are shown in red boxes. The poor density of these loops could be due to protein flexibility. (B) The modeled chloride forms polar interactions with the surrounding Glu118, Tyr120, and Phe150. (C) Unmodeled density found in the cavity where the aliphatic tail of the sterol is positioned in the docking model.
Figure 4—figure supplement 2
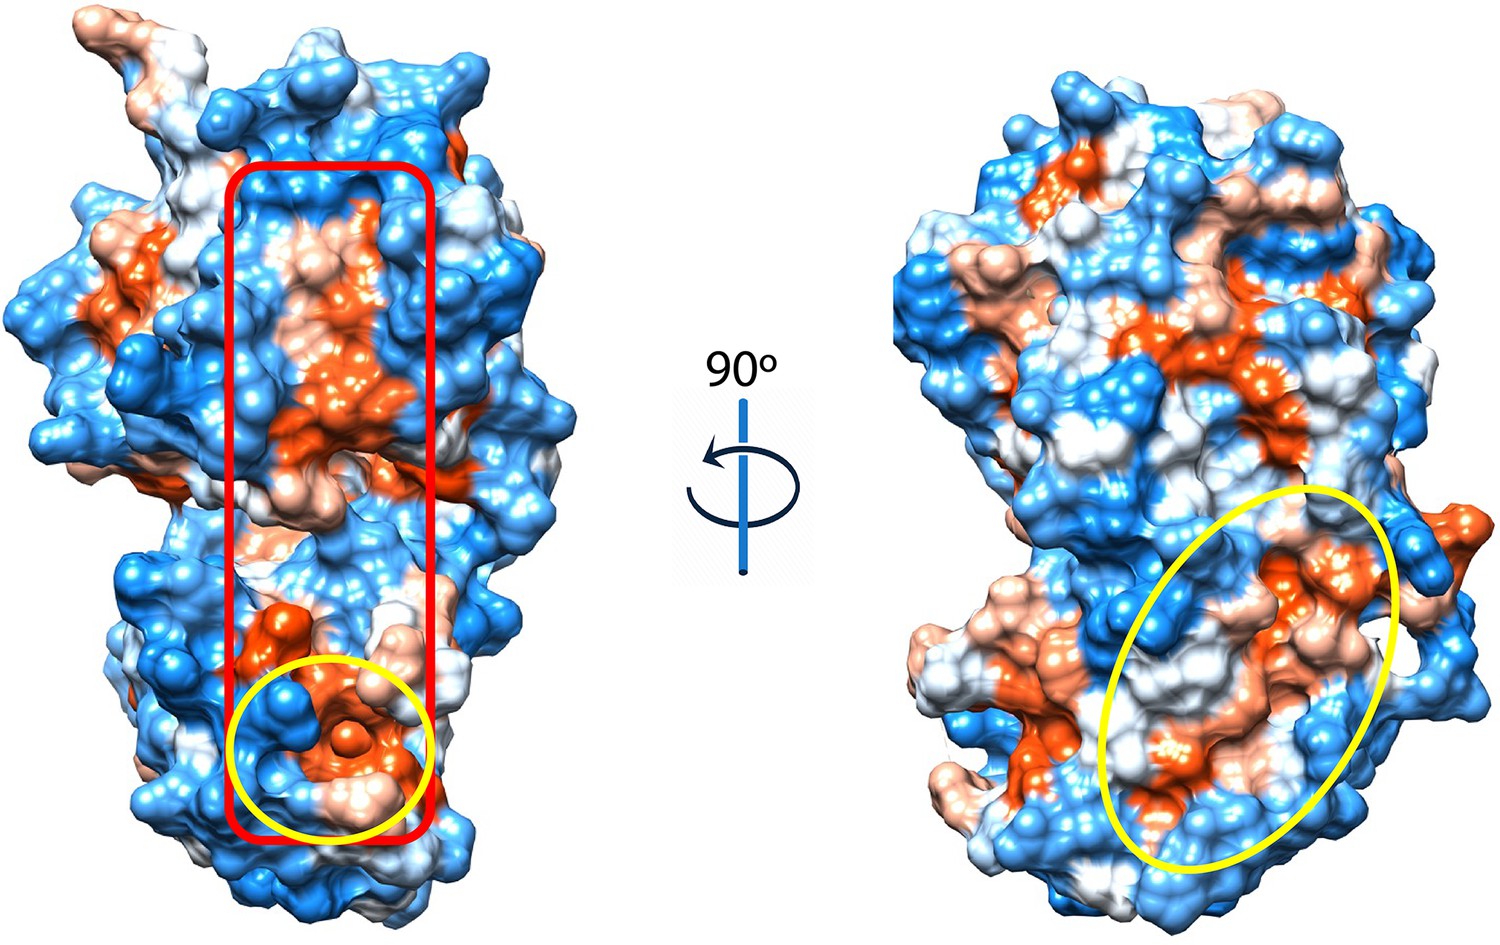
Hydrophobicity representation of the BstB structure shows a second hydrophobic pocket located in domain B below the missing loop (202-204).
The pocket (circled) has an area of 172 Å2 and a volume of 117 Å3 and may function as a second substrate binding site. The surface in red box is the potential interface after substrate binding.
Figure 4—figure supplement 3
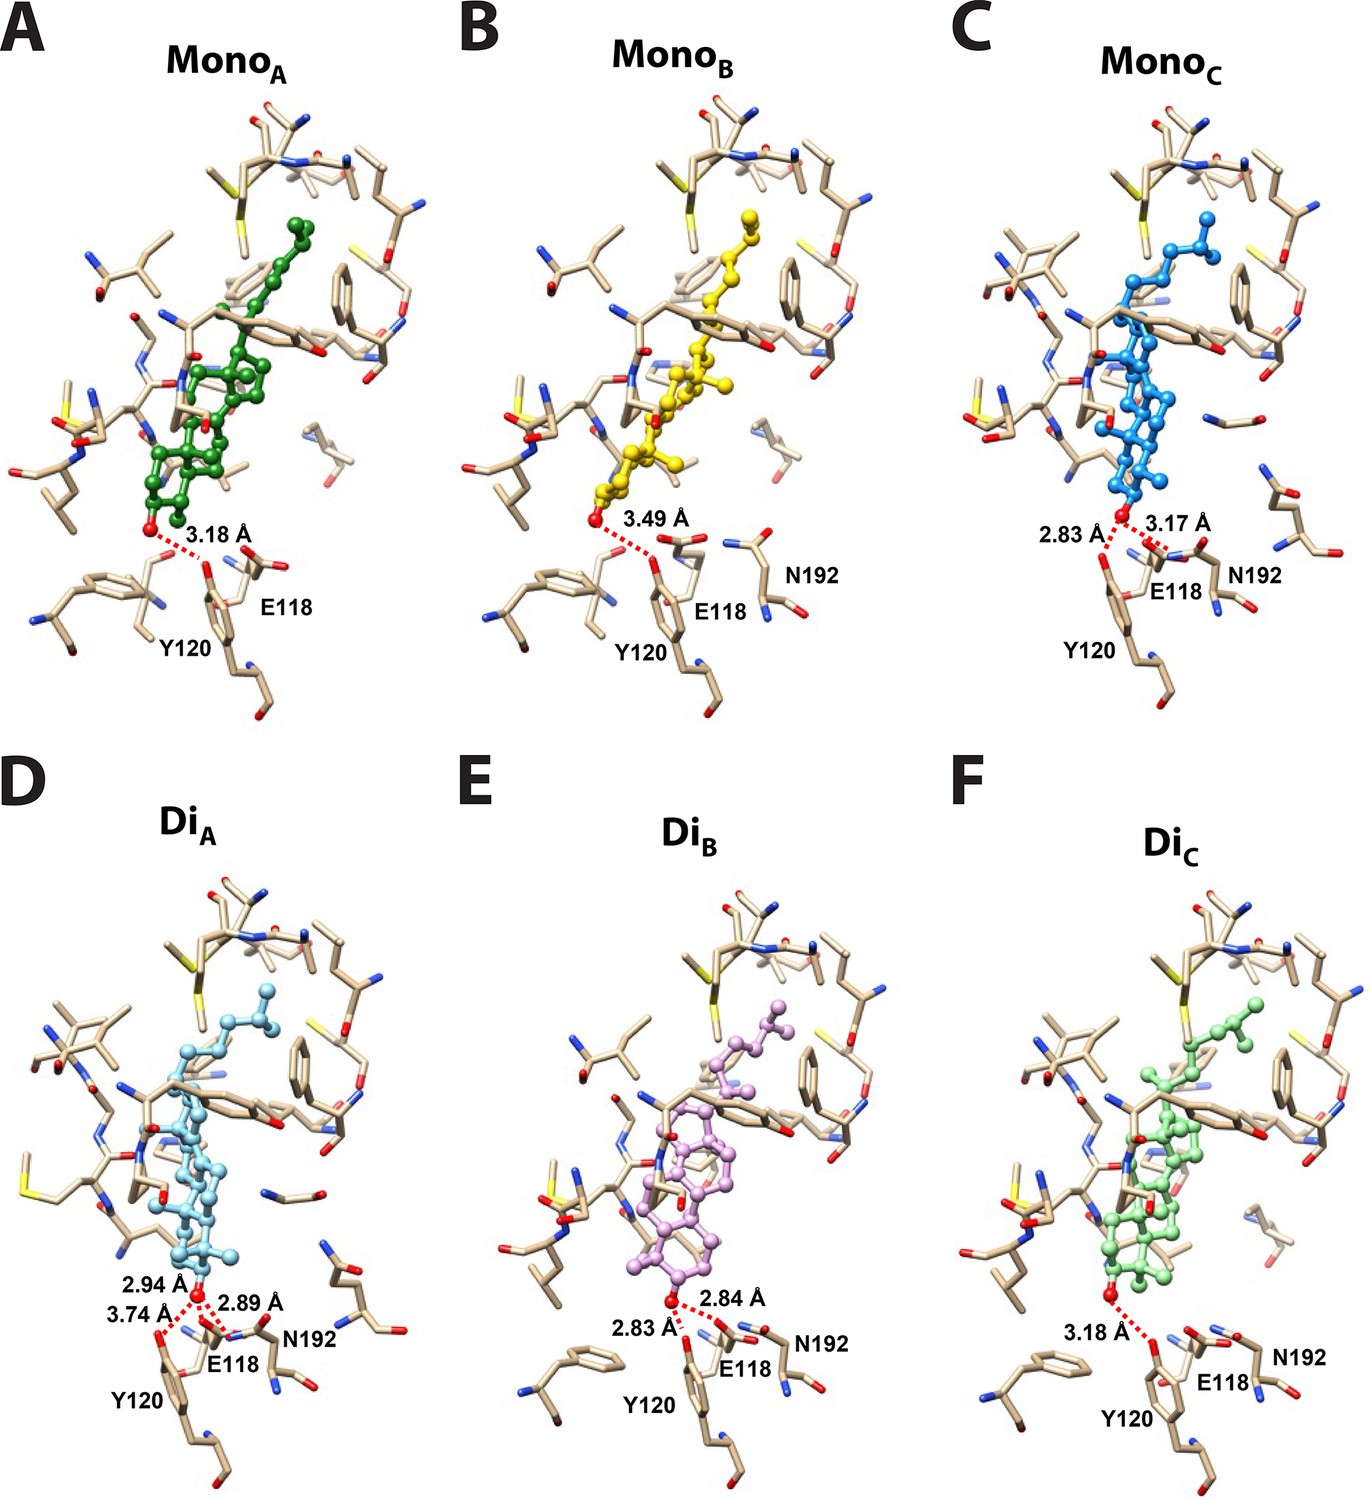
Docking models of 4-monomethyl sterol and 4,4-dimethyl sterol in BstB structure.
(A–C) Energetically favored poses of 4-monomethylsterol. (D–F) Energetically favored poses of 4,4-dimethylsterol. Sterols are shown in ball and stick with the hydroxyl group is colored in red; the surrounding residues are shown in sticks and colored in tan. Hydrogen bonds between the hydroxyl group of the sterol and surrounding residues are shown as red dashed lines.
Figure 4—figure supplement 4
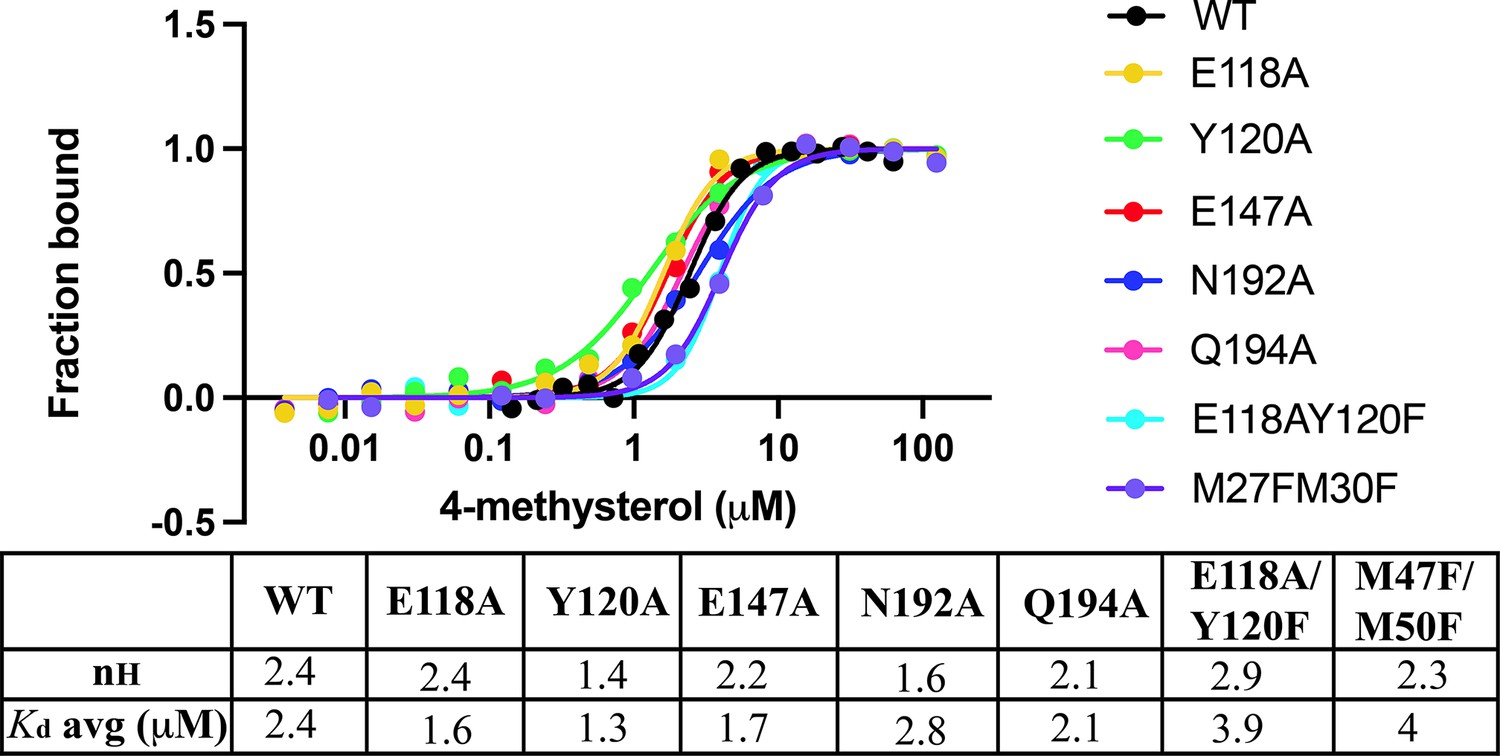
MST binding curves of BstB variants with 4-monomethyl sterol.
Figure 4—figure supplement 5
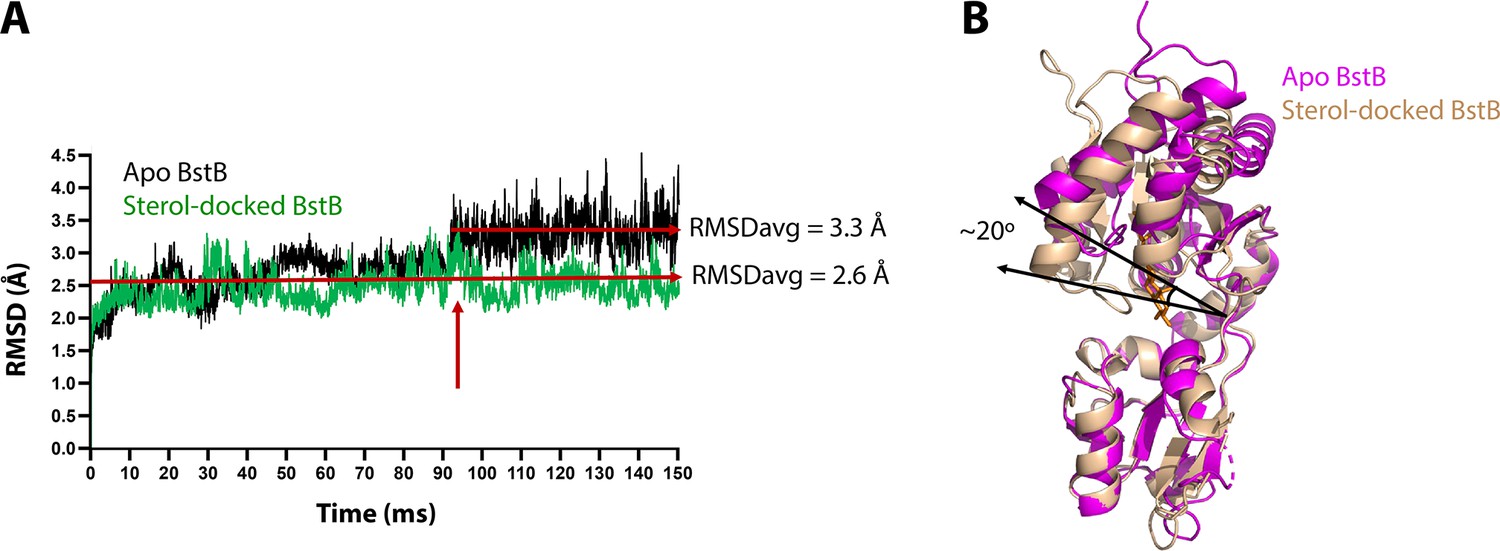
MD simulation of apo-BstB and sterol-docked BstB.
(A) RMSD vs time plot for the MD simulation on the apo-BstB and docking complex with 4-monomethyl sterol. The trajectory of apo-BstB is in black while that of the docking complex is depicted in green. (B) Superposition of the apo-BstB structure with the monomethyl sterol-docked complex.
Figure 5 with 6 supplements
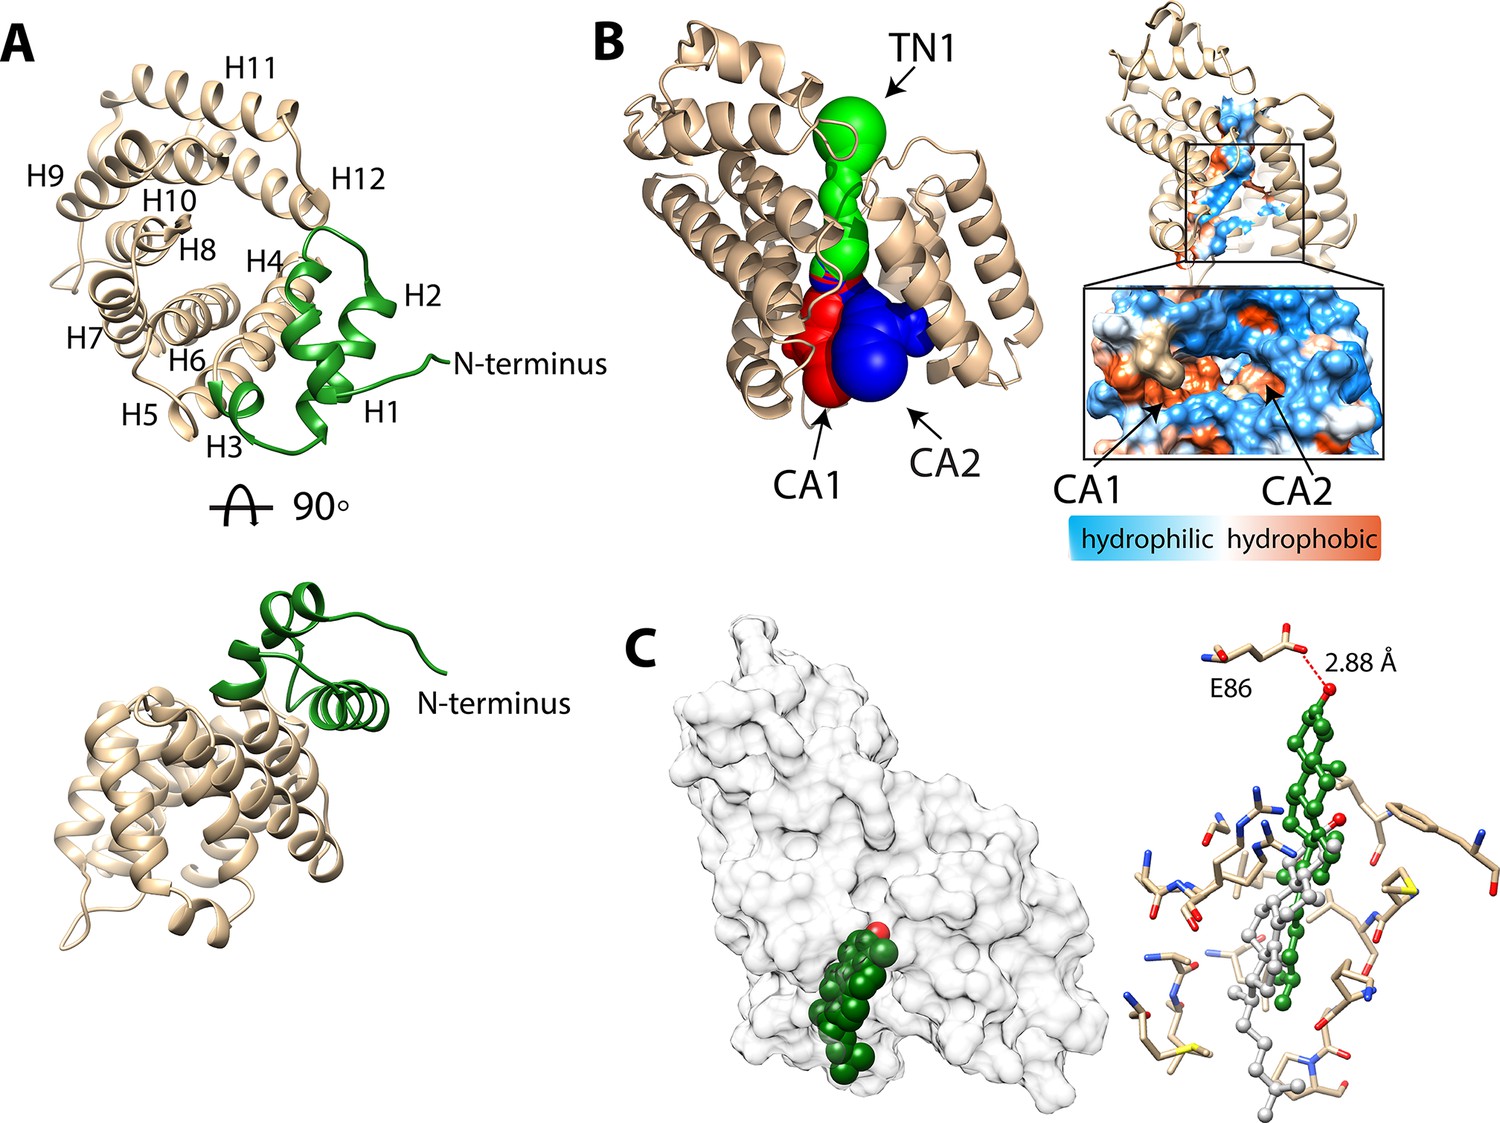
Structure of BstC.
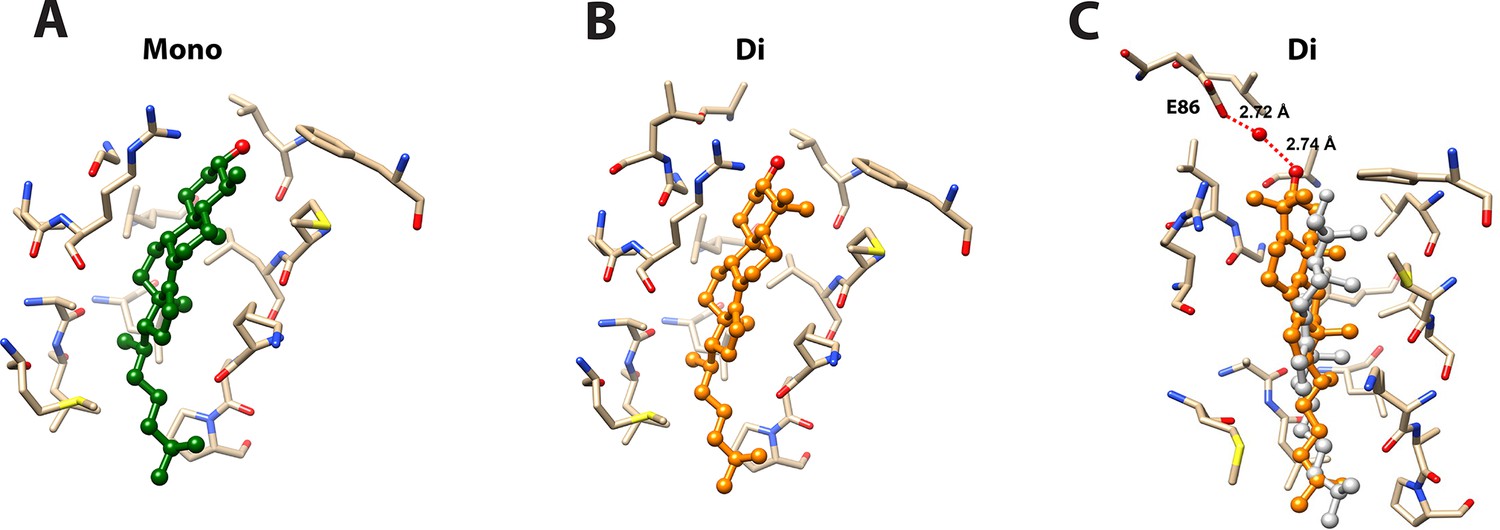
(A) Cartoon representation of BstC. The two α-helixes at the N-terminus are colored in green. Two monomers (RMSD of 0.656 Å for all Cαs) with 180 rotational symmetry exist in the asymmetric unit. (B) A representation of cavities BstC (left, with Tunnel 1 colored in green, Cavity 1 in red, and Cavity 2 in blue) alongside hydrophobicity representation of the cavities (right). (C) Docking model of the structures of BstC with 4-monomethyl sterol. Left, the docking model is shown in surface representation with 80% transparency. Sterol is shown in sphere and colored in green with the hydroxyl group is colored in red; Right, docking complex before and after MD simulation. The surrounding residues are shown in stick and ball. The sterol prior to the MD simulation is colored in grey and while green shows its position after the simulation. A hydrogen bond between the hydroxyl group of the sterol and Glu86 is shown as a red dashed line.
Figure 5—figure supplement 1
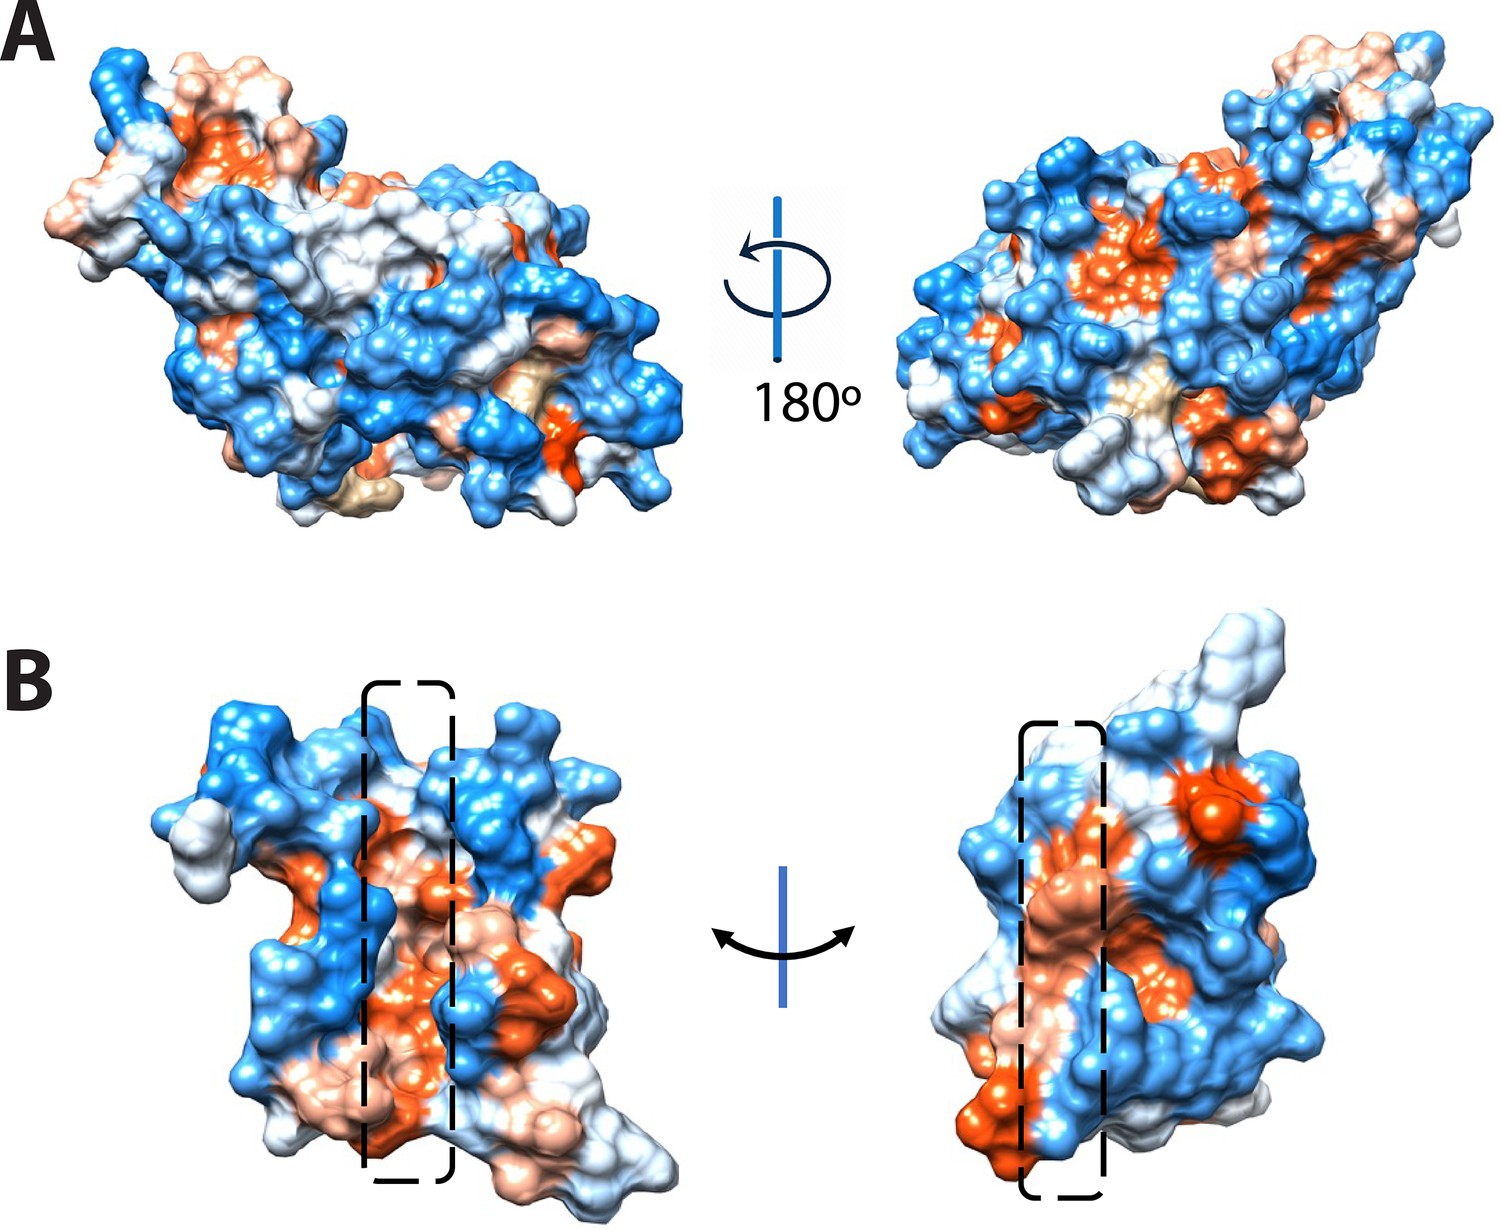
Hydrophobicity representations of the BstC structure on (A) the exterior surface and (B) the cross-section of the side view of the tunnel in BstC structure.
TN1 exhibits hybrid hydrophobicity, with the sides horizontal to cavities being hydrophobic while the vertical sides are more hydrophilic.
Figure 5—figure supplement 2

Electrostatic calculation shows that most of the surface, including the N-terminal (A) and C-terminal (B) terminal faces, exhibits strong negative charge.
Figure 5—figure supplement 3
Structural comparison of BstC and Tp0956.
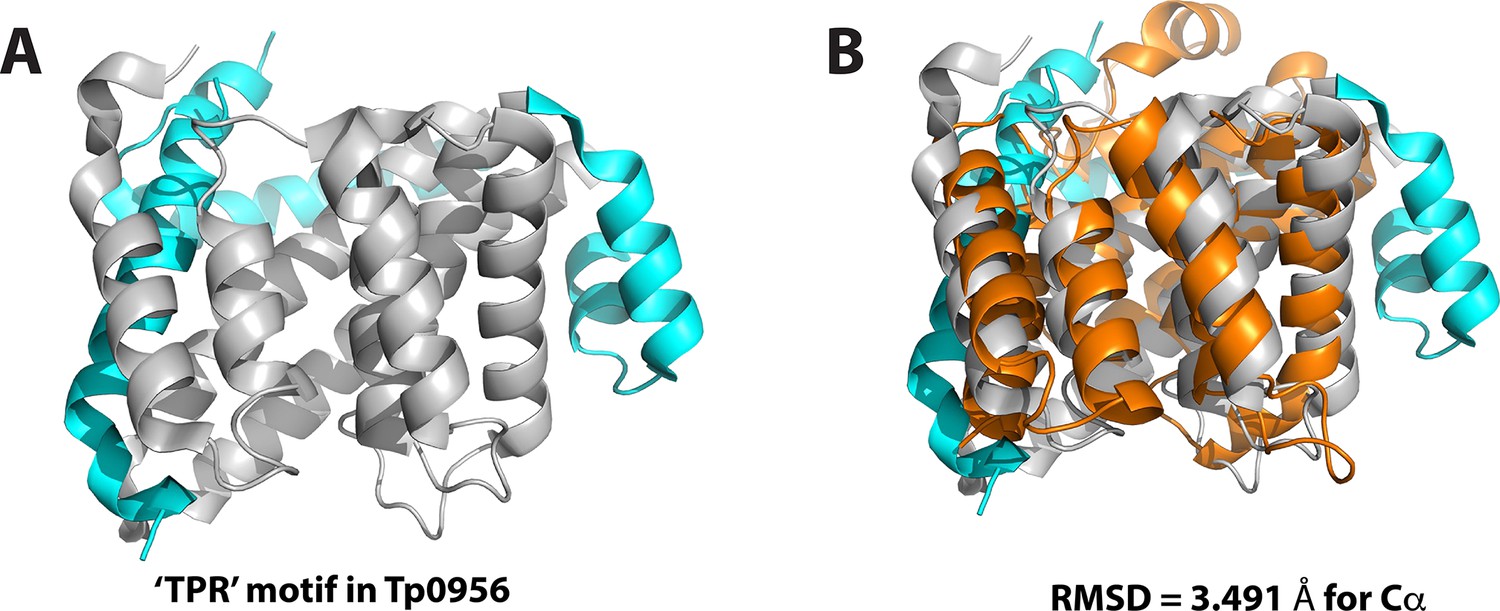
(A) Cartoon depiction of Tp0956 (PDB 3U64), the structural homolog of BstC. The protein contains four helical hairpins that are similar to tetratricopeptide repeat (TPR) motifs, which are hallmarks of proteins that engage in protein–protein interactions. The TPR motif was colored in grey. (B) Superposition of the BstC structure with Tp0956 (RMSD of 3.491 Å for all Cαs). BstC is colored in orange.
Figure 5—figure supplement 4

Size exclusion chromatography (SEC, left) and SEC-multiangle light scattering (MALS, middle and right) analysis of BstC.
Two peaks are observed in the SEC chromatogram, with SEC-MALS revealing that they correspond to monomeric and dimeric BstC.
Figure 5—figure supplement 5
Docking models of 4-monomethyl sterol and 4,4-dimethyl sterol in BstC structure.
(A) Energetically favored poses of 4-monomethyl sterol. The sterol is colored in green. (B) Energetically favored poses of 4,4-dimethylsterol. The sterol is colored in orange (C) Docking complex of 4,4-dimethylsterol before and after MD simulation. The sterol prior to the MD simulation is colored in grey and while orange shows its position after the simulation. Sterols are shown in ball and stick with the hydroxyl group is colored in red; the surrounding residues are shown in sticks and colored in tan. Water-mediated hydrogen bonding between the hydroxyl group of the sterol and E86 is highlighted.
Figure 5—figure supplement 6

MST analysis of the BstC variants (50 nM) binding to sterols.
(A) The E86G and E86W variants bind to C4-mono-methyl sterol with Kds of 11.2±2.93 μM and 250.4±538.4 μM (B, C) No interaction was detected between BstC E86 variants and other sterols.
Figure 6
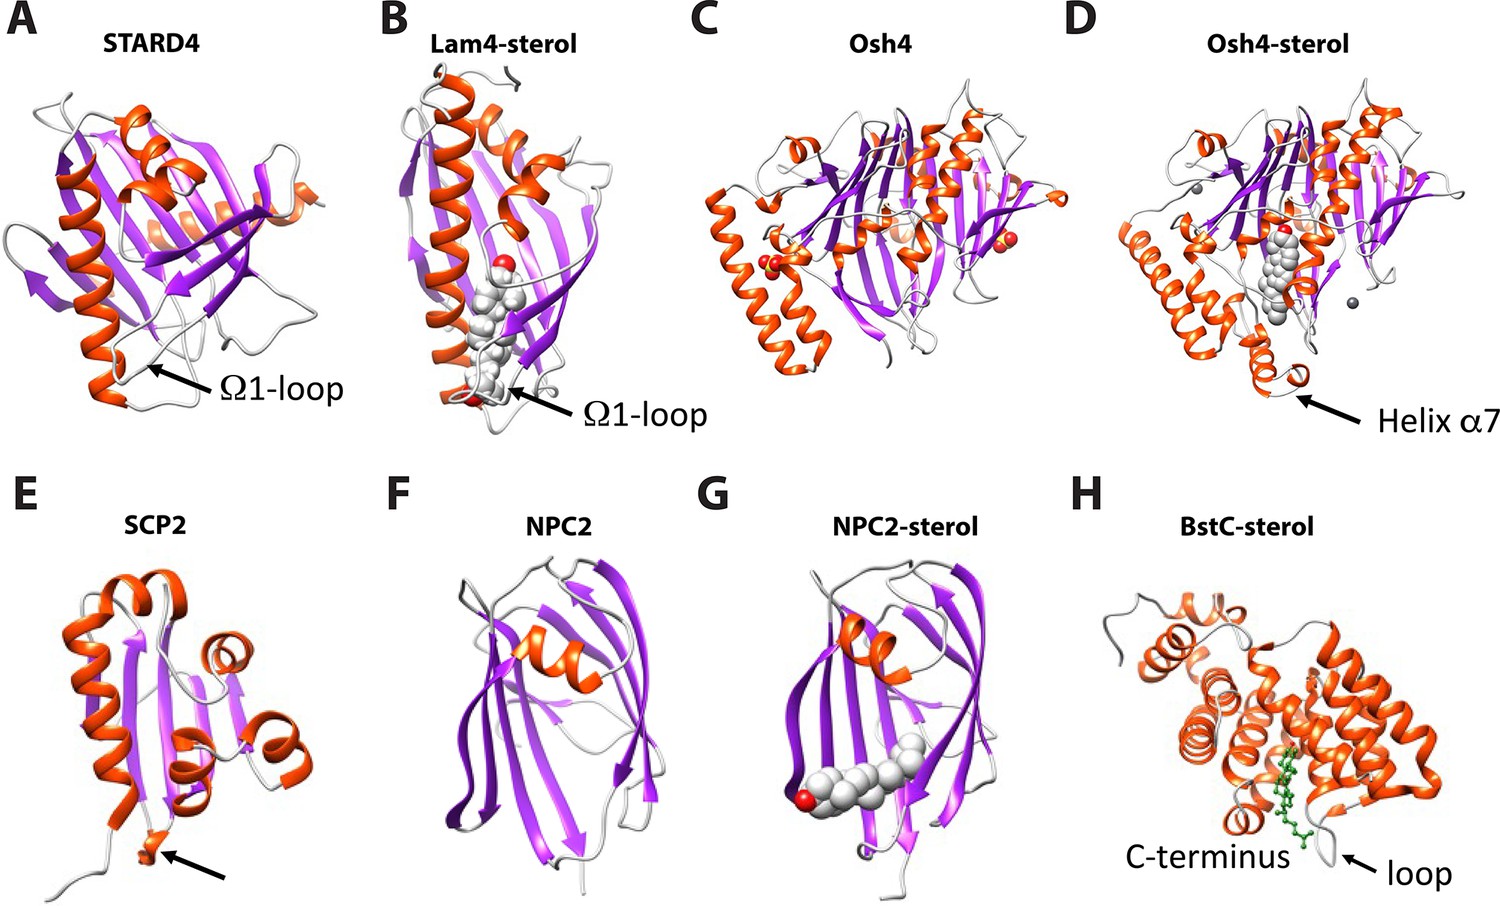
Structural comparison of eukaryotic sterol-binding proteins.
(A) Apo human STARD4 (PDB 6L1D). (B) Yeast Lam4 bound to 25-hydroxycholesterol (PDB 6BYM). The Ω1-loop is depicted in structures that possess it. (C–D) Yeast apo- (C), PDB 1ZI7 and cholesterol-bound (D), PDB 1ZHY Osh4. The N-terminal helix α7 in Osh4, which is missing in the apo-Osh4 structure, may work similar to the Ω1-loop. (E) The non-specific LTP, rabbit SCP2 (PDB 1C44); (F) apo- (PDB 6R4M) and (G) ergosterol-bound (PDB 6R4N) NPC2. All structures are shown in cartoon representation with the α-helixes and β-strands colored in red and magenta, respectively. The bound sterol substrates are depicted in grey spheres with the hydroxyl group(s) colored in red. (H) The Ω1-like loop in BstC docked complex with monomethyl sterol.
Author response image 1
Videos
Video 1
150 ns molecular dynamics simulation of the apo-BstB structure.
Video 2
150 ns molecular dynamics simulation of the monoc-docked BstB complex.
Tables
Table 1
Available structural information in the SSN of different pfam members.
| Superfamily | Pfam | Protein | PDB | Organism |
|---|---|---|---|---|
| MMPL | PF03176 | HpnN | 5khs | Burkholderia multivorans |
| MMPL | PF03176 | MmpL3 | 6ajf | Mycobacterium smegmatis |
| MMPL | PF03176 | MmpL11 | 4y0l | Mycobacterium tuberculosis |
| Phosphonate-bd | PF12974 | AioX | 6esk | Pseudorhizobium banfieldiae |
| Phosphonate-bd | PF12974 | PhnD | 5lq5 | Prochlorococcus marinus |
| Phosphonate-bd | PF12974 | PtxB | 5lv1 | Prochlorococcus marinus |
| Phosphonate-bd | PF12974 | PtxB | 5o2k | Pseudomonas stutzeri |
| Phosphonate-bd | PF12974 | PtxB | 5jvb | Trichodesmium erythraeum |
| Phosphonate-bd | PF12974 | PA3383 | 3n5l | Pseudomonas aeruginosa |
| Phosphonate-bd | PF12974 | PhnD | 3qk6 | Escherichia coli |
| Phosphonate-bd | PF12974 | XAC2383 | 5ub3 | Xanthomonas axonopodis pv. citri |
| Phosphonate-bd | PF12974 | HtxB | 5me4 | Pseudomonas stutzeri |
| TatT | PF16811 | Tp0956 | 3u64 | Treponema pallidum (strain Nichols) |
Table 2
Protein sequences and primers.
| NAME | SEQUENCE | PRIMERS |
|---|---|---|
| BstA | MNIPHLAALAAERFARRPWRVLALAMALSALSL WAVSRLPVHTSRQALLPHDNAVAQRFDAFLDK FGAASDLIVVLEGAPPDELKPFADELATALAAEP EIAQATARLDLRFVLEHAYLAVTPERLGTLAGVL EKFGAGAIPEDSSQVDATLGRLLQWLEGAPAM PAAGIDLPTVEVGLKLLGASLDEWHRWLSAGE VPAALDWTRLLAGLGGSEIANDGYFVSRDGRM YFLFVHPASASEDFTAIGPFVEKVRTVAADRAAR ARAAGRTAPKVGLTGLPAIEYEEHVSIRHDIALVV GSAAGLIVLLILVVVRSWRWALVIFVPMGLGVLW SLGLALVTIGHLTLITASFIAVLFGLGADYGIFTSAR IAEERRRGKPLTEAIGAGMGASFQAVFTAGGASV VIFGALATVDFPGFSELGLVAAKGVMLILVSTWLV QPALYALLPPKLAPLPAAASAGAIEPGRMPFRGS VAVILVAGALATAAFGIGSGYELPFDYDVLSLLPK DSESAYYQNRMVAESDYQAEVVIFTAPDLEEAR RIAAEAGRLGSVAKVQSLMDLFPPDADARALEA RRIGELADDGYAVRLARLAAIGLPEGTFGRVRTI LEKGGDFIDQSQELAFSAGHSGLVAALEDVRGR LDAVRSAIEADPVQARERSERFFRMLLSAAERG VALLAEWRQARPITPAQLPPALRDRFFAADGTVA VYAFPAKTVYDPANLDRLMQEIYGVSPDATGFPA THQVFSKSVVESFTHGTREAVTVCLLWLALVLRN WRGFVLASMPLLIGGGWMLGLMALCGIRYNYAN IIALPLVIALAVDYGVWFSQRWFDLKDRSLTQINRV AGGVIGLAAGTELAGLGAITLANYRGVSSLGVNI TVGLLCCLAATLWVAPAIGQLLDSRKKP | pET20b-Forward: GAAGGAGATATACATATGAACATCCCCCATTTGGCCGCTC pET20b-Reverse: GTGGTGGTGGTGCTCGAGTGGTTTCTTTCTTGAATCGAGAAGC pET28a-Forward: AGAATCTTTATTTTCAGGGCCATAACATTCCGCACCTGGCGGC pET28a-Reverse: CTCAGTGGTGGTGGTGGTGGTGCTCGAGCTTAGGTTTCTTACGGCTGTCCAG |
| BstAPD | MAVAQRFDAFLDKFGAASDLIVVLEGAPPDELKP FADELATALAAEPEIAQATARLDLRFVLEHAYLAV TPERLGTLAGVLEKFGAGAIPEDSSQVDATLGRL LQWLEGAPAMPAAGIDLPTVEVGLKLLGASLDE WHRWLSAGEVPAALDWTRLLAGLGGSEIANDG YFVSRDGRMYFLFVHPASASEDFTAIGPFVEKVR TVAADRAARARAAGRTAPKVGLTGSGSGSGSES AYYQNRMVAESDYQAEVVIFTAPDLEEARRIAAE AGRLGSVAKVQSLMDLFPPDADARALEARRIGE LADDGYAVRLARLAAIGLPEGTFGRVRTILEKGG DFIDQSQELAFSAGHSGLVAALEDVRGRLDAVR SAIEADPVQARERSERFFRMLLSAAERGVALLA EWRQARPITPAQLPPALRDRFFAADGTVAVYAF PAKTVYDPANLDRLMQEIYGV | pET28a-Forward1: CTTTATTTTCAGGGCCATATGGCGGTGGCGCAACGTTTCGAC pET28a-Reverse1: AGTACGCGCTCTCGCTACCGCTACCGCTGCCGCTACCGGTCAGACCAACTTTCGGC pET28a-Forward2: GTTGGTCTGACCGGTAGCGGCAGCGGTAGCGGTAGCGAGAGCGCGTACTATCAGAAC pET28a-Reverse2: CTCAGTGGTGGTGGTGGTGGTGCTCGAGTCACACACCATAAATTTCCTG |
| BstB | MTDKITCFSLLAALLAPFVPAQAGAPAPVVVCY PGGAVNERDADQAMDAMLRVVERVGQWPEKS FSSVFTAKVADCGKLMAEMKPAFAITSLALYLDM RGQYDLVPVVQPRIDGRTSERYRVVAKQGRFH DMDELKGRTLGGTMLDEPAFLGKIVFAGKYDPE KDFALQPSRQAIRALRSLDKGELDAVVLNEQQF AGLSALQLASPVETVFTSAEIPLMGVVANARLTS AQERARFAQALETLCADPEGRKLCDLFGIQSFV AVDPTVFDPMARLWLARN | pET20b-Forward: GAAGGAGATATACATATGGGCGCCCCCGCACCG pET20b-Reverse: GTGGTGGTGGTGCTCGAGGTTCCGCGCCAGCCA pET28a-Forward: CGAGAATCTTTATTTTCAGGGCCATGGCGCCCCCGCACCGGTGGTC pET28a-Reverse: CTCAGTGGTGGTGGTGGTGGTGCTCGAGTTAGTTCCGCGCCAGCCAGAG |
| BstC | MRLFAAGILAGVLAGCGGLHRDGTPAGPSAGC PRLTAAALSAGQDALGPSSETQELECALDFLRG SDDPALRRSSLGSRICLHLAERNSDPAERARFA REGVERAEAALAQGGEDDGAVHYYLAANLGLA VRDDMTAALANLHRLEHESEAAVKLSPDFDDG GPLRLLGMLYLKAPAWPAGMGDGDKALDLLGQ AVERHPGHPLNHLFYAEALWEVNGESESRRVE EEMAAGWRLLESGSWGYNKQIWKREFADLRQ EIGAPAR | pET20b-Forward: GAAGGAGATATACATATGTGCGGCGGTCTTCAC pET20b-Reverse: GTGGTGGTGGTGCTCGAGCCTAGCGGGCGCCCC pET28a-Forward: ATCTTTATTTTCAGGGCCATTGCGGCGGTCTTCACCGCGATG pET28a-Reverse: CTCAGTGGTGGTGGTGGTGGTGCTCGAGTTACCTAGCGGGCGCCCCGAT |
-
The signal peptides in BstB and BstC are shown in bold.
Table 3
Data collection and refinement statistics.
| apo-BstB(SeMet) | apo-BstC(SeMet) | |
|---|---|---|
| Resolution range | 38.4–1.6 (1.657–1.6) | 28.63–1.91 (1.978–1.91) |
| Space group | P 21 21 21 | P 1 21 1 |
| Unit cell (a, b, c; a, b, g) | 39.882, 40.355, 142.263; 90, 90, 90 | 55.083, 57.257, 85.825; 90, 97.26, 90 |
| Total reflections | 606476 (60185) | 200826 (19731) |
| Unique reflections | 31071 (3061) | 41329 (4084) |
| Multiplicity | 19.5 (19.7) | 4.9 (4.8) |
| Completeness (%) | 97.81 (93.74) | 99.91 (99.98) |
| Mean I/sigma(I) | 30.96 (2.07) | 11.09 (2.78) |
| Wilson B-factor | 22.86 | 15.59 |
| R-merge | 0.07677 (1.462) | 0.1267 (0.6131) |
| R-meas | 0.07881 (1.501) | 0.1423 (0.6891) |
| R-pim | 0.01755 (0.3345) | 0.06419 (0.3117) |
| CC1/2 | 1 (0.745) | 0.994 (0.762) |
| CC* | 1 (0.924) | 0.999 (0.93) |
| Reflections used in refinement | 30,554 (2873) | 41,317 (4084) |
| Reflections used for R-free | 1964 (184) | 1996 (198) |
| R-work | 0.2038 (0.2892) | 0.174 (0.2389) |
| R-free | 0.2234 (0.2749) | 0.207 (0.2675) |
| CC(work) | 0.955 (0.786) | 0.948 (0.879) |
| CC(free) | 0.948 (0.725) | 0.939 (0.834) |
| Number of non-hydrogen atoms | 2117 | 4036 |
| macromolecules | 1974 | 3546 |
| solvent | 142 | 355 |
| Protein residues | 257 | 464 |
| RMS(bonds) | 0.010 | 0.012 |
| RMS(angles) | 1.03 | 1.28 |
| Ramachandran favored (%) | 99.21 | 100.00 |
| Ramachandran allowed (%) | 0.79 | 0.00 |
| Ramachandran outliers (%) | 0.00 | 0.00 |
| Rotamer outliers (%) | 0.97 | 0.00 |
| Clashscore | 2.28 | 1.39 |
| Average B-factor | 33.82 | 19.33 |
| macromolecules | 33.84 | 18.22 |
| ligands | 30.00 | 27.28 |
| solvent | 33.49 | 27.44 |
| Number of TLS groups | 3 | 1 |
-
Statistics for the highest-resolution shell are shown in parentheses.
Table 4
Residues involved in forming the cavity of BstB.
| Domain | SeqID | AA | Domain | SeqID | AA |
|---|---|---|---|---|---|
| A | 29 | Val | A | 115 | Arg |
| A | 31 | Val | A | 117 | Ser |
| A | 33 | Tyr | A | 118 | Glu |
| A | 34 | Pro | B | 120 | Tyr |
| A | 35 | Gly | B | 143 | Thr |
| A | 36 | Gly | B | 144 | Met |
| A | 37 | Ala | B | 146 | Asp |
| A | 38 | Val | B | 147 | Glu |
| A | 39 | Asn | B | 150 | Phe |
| A | 40 | Glu | B | 171 | Ser |
| A | 43 | Ala | B | 172 | Arg |
| A | 44 | Asp | B | 173 | Gln |
| A | 46 | Ala | B | 174 | Ala |
| A | 47 | Met | B | 175 | Ile |
| A | 48 | Asp | B | 192 | Asn |
| A | 49 | Ala | B | 193 | Glu |
| A | 50 | Met | B | 194 | Gln |
| A | 51 | Leu | B | 195 | Gln |
| A | 53 | Val | B | 217 | Ile |
| A | 54 | Val | A | 218 | Pro |
| A | 67 | Ser | A | 219 | Leu |
| A | 69 | Phe | A | 221 | Gly |
| A | 71 | Ala | A | 222 | Val |
| A | 73 | Val | A | 223 | Val |
| A | 89 | Ile | A | 237 | phe |
| A | 90 | Thr | A | 241 | Leu |
| A | 91 | Ser | A | 244 | Leu |
| A | 92 | Leu | A | 253 | Leu |
| A | 93 | Ala | A | 254 | Cys |
| A | 94 | Leu | A | 256 | Leu |
| A | 95 | Tyr | A | 257 | Phe |
| A | 106 | Pro | A | 258 | Gly |
| A | 108 | Val | A | 259 | Ile |
| A | 109 | Gln | A | 262 | Phe |
| A | 110 | Pro | A | 270 | Phe |
| A | 112 | Ile |
Table 5
Docking and molecular dynamics results for BstB.
| ICM docking results | Hydrogen bonds in docked poses | Hydrogen bonds after MD | |||||||||
|---|---|---|---|---|---|---|---|---|---|---|---|
| energies (kcal/mol)* | distance (Å) | bond persistence (%) | |||||||||
| Ligand | Pose | Score† | Hbond | Hphob | VwInt | Glu118 | Tyr120 | Asn192 | Glu118 | Tyr120 | Asn192 |
| Mono | A | –17.7 | –0.94 | –9.62 | –25.60 | - | 3.18 | - | 95 | 3 | - |
| B | –20.4 | –0.69 | –9.50 | –26.10 | - | 3.49 ‡ | - | 95 | 2 | 1 | |
| C | –16.9 | –2.77 | –9.32 | –23.73 | - | 2.83 | 3.17 | 85 | - | 11 | |
| Di | A | –20.3 | –4.53 | –9.48 | –23.22 | 2.94 | 2.74 | 2.89 | 12 | 12 | 57 |
| B | –27.8 | –4.64 | –9.74 | –28.74 | 2.84 | 2.83 | - | 94 | 10 | 1 | |
| C | –17.2 | –1.99 | –9.94 | –24.13 | - | 3.18 | - | - | - § | - | |
-
*
Energies for hydrogen bonding (Hbond), hydrophobic interactions (Hphob) and van der Waals interactions (VwInt).
-
†
The score has no units. More negative numbers are indicative of stronger binding.
-
‡
This distance could be considered too long to be a hydrogen bond.
-
§
This pose loses the hydrogen bond with Tyr120 but gains a hydrogen bond with the carbonyl oxygen of Pro34 which then persists for 95% of the MD simulation.
Table 6
Residues involved in forming the hydrophobic cavity in BstC.
| Tunnel1 | Chamber2 | Chamber3 |
|---|---|---|
| ASP 45 | GLY 128 | LEU 129 |
| PRO 49 | LEU 129 | ARG 132 |
| LEU 82 | ARG 132 | LEU 167 |
| HIS 83 | MET 135 | MSE 170 |
| GLU 86 | ALA 138 | LYS 174 |
| TYR 121 | LEU 139 | LEU 207 |
| TYR 122 | LEU 142 | PHE 208 |
| LEU 129 | LEU 145 | GLU 211 |
| ARG 132 | LEU 167 | GLU 251 |
| ASP 160 | MSE 170 | ASP 254 |
| ARG 166 | LEU 171 | LEU 255 |
| LEU 167 | LYS 174 | |
| LEU 204 | PHE 208 | |
| TRP 241 | ||
| ASN 244 | ||
| TRP 248 |
Additional files
Download links
A two-part list of links to download the article, or parts of the article, in various formats.
Downloads (link to download the article as PDF)
Open citations (links to open the citations from this article in various online reference manager services)
Cite this article (links to download the citations from this article in formats compatible with various reference manager tools)
Novel sterol binding domains in bacteria
eLife 12:RP90696.
https://doi.org/10.7554/eLife.90696.3


