Eugenol mimics exercise to promote skeletal muscle fiber remodeling and myokine IL-15 expression by activating TRPV1 channel
- Key Laboratory for Animal Disease-Resistance Nutrition of China Ministry of Education, Institute of Animal Nutrition, Sichuan Agricultural University, China
Figures
Figure 1 with 1 supplement
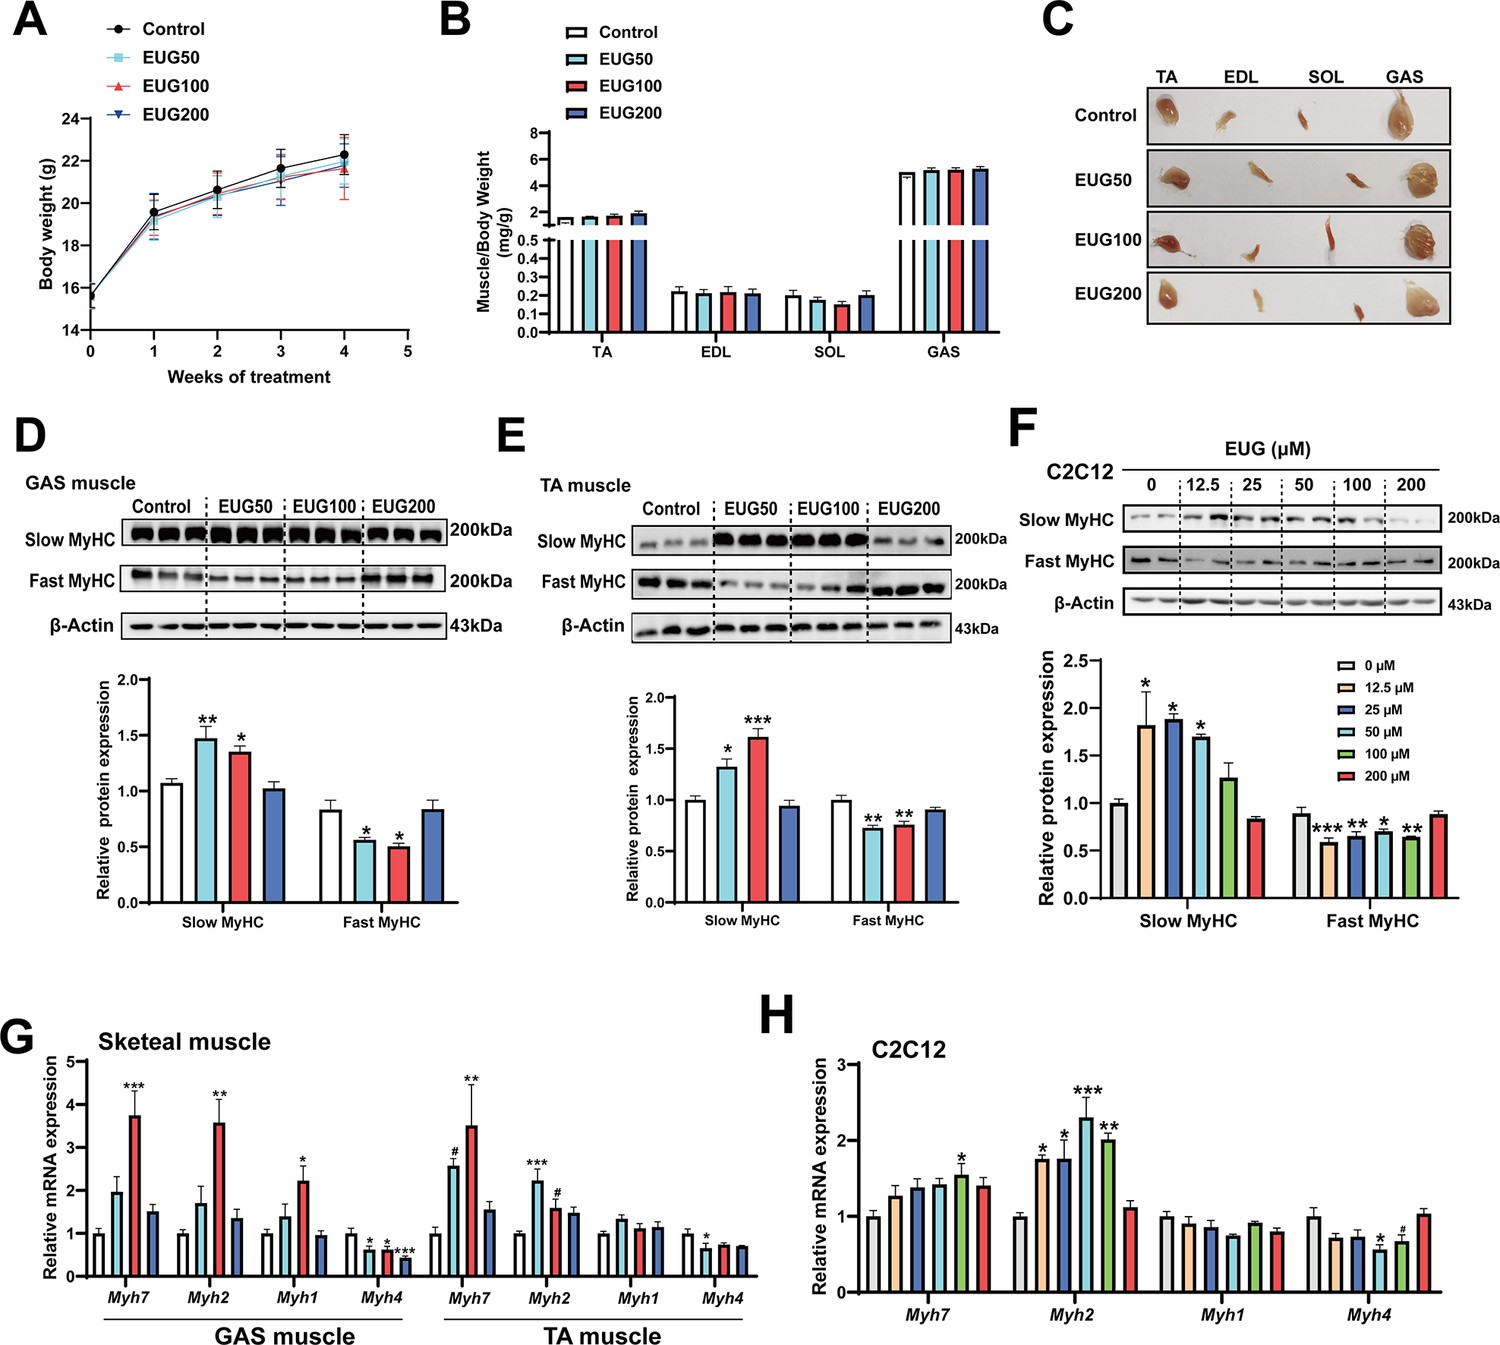
Eugenol promotes the transformation of fast-to-slow muscle fiber.
(A) The body weight of the mice. (B, C) Skeletal muscle weight and representative images of skeletal muscle. (D–F) The protein expression of muscle fiber type in gastrocnemius (GAS) and tibialis anterior (TA) muscle and in C2C12 myotubes. (G, H) The mRNA expression of muscle fiber type in GAS and TA muscle and in C2C12 myotubes. For A, N=20 per group. For B, N=14 per group. For D and E, N=3 per group. For F and H, N=4 per group. For G, N=6 per group. One-way ANOVA test was used to determine statistical significance. *p<0.05, **p<0.01, and ***p<0.001.
-
Figure 1—source data 1
The body weight of the mice (Figure 1A).
- https://cdn.elifesciences.org/articles/90724/elife-90724-fig1-data1-v1.xlsx
-
Figure 1—source data 2
Skeletal muscle weight (Figure 1B).
- https://cdn.elifesciences.org/articles/90724/elife-90724-fig1-data2-v1.xlsx
-
Figure 1—source data 3
Representative images of skeletal muscle (Figure 1C).
- https://cdn.elifesciences.org/articles/90724/elife-90724-fig1-data3-v1.pdf
-
Figure 1—source data 4
Original files for the western blot analysis (Figure 1D).
- https://cdn.elifesciences.org/articles/90724/elife-90724-fig1-data4-v1.zip
-
Figure 1—source data 5
PDF containing Figure 1D and original scans of the relevant western blot analysis, with cropped areas.
- https://cdn.elifesciences.org/articles/90724/elife-90724-fig1-data5-v1.pdf
-
Figure 1—source data 6
Original files for the western blot analysis (Figure 1E).
- https://cdn.elifesciences.org/articles/90724/elife-90724-fig1-data6-v1.zip
-
Figure 1—source data 7
PDF containing Figure 1E and original scans of the relevant western blot analysis, with cropped areas.
- https://cdn.elifesciences.org/articles/90724/elife-90724-fig1-data7-v1.pdf
-
Figure 1—source data 8
Original files for the western blot analysis (Figure 1F).
- https://cdn.elifesciences.org/articles/90724/elife-90724-fig1-data8-v1.zip
-
Figure 1—source data 9
PDF containing Figure 1F and original scans of the relevant western blot analysis, with cropped areas.
- https://cdn.elifesciences.org/articles/90724/elife-90724-fig1-data9-v1.pdf
-
Figure 1—source data 10
The mRNA expression of muscle fiber type in gastrocnemius (GAS) and tibialis anterior (TA) muscle (Figure 1G).
- https://cdn.elifesciences.org/articles/90724/elife-90724-fig1-data10-v1.xlsx
-
Figure 1—source data 11
The mRNA expression of muscle fiber type in C2C12 myotubes (Figure 1H).
- https://cdn.elifesciences.org/articles/90724/elife-90724-fig1-data11-v1.xlsx
Figure 1—figure supplement 1
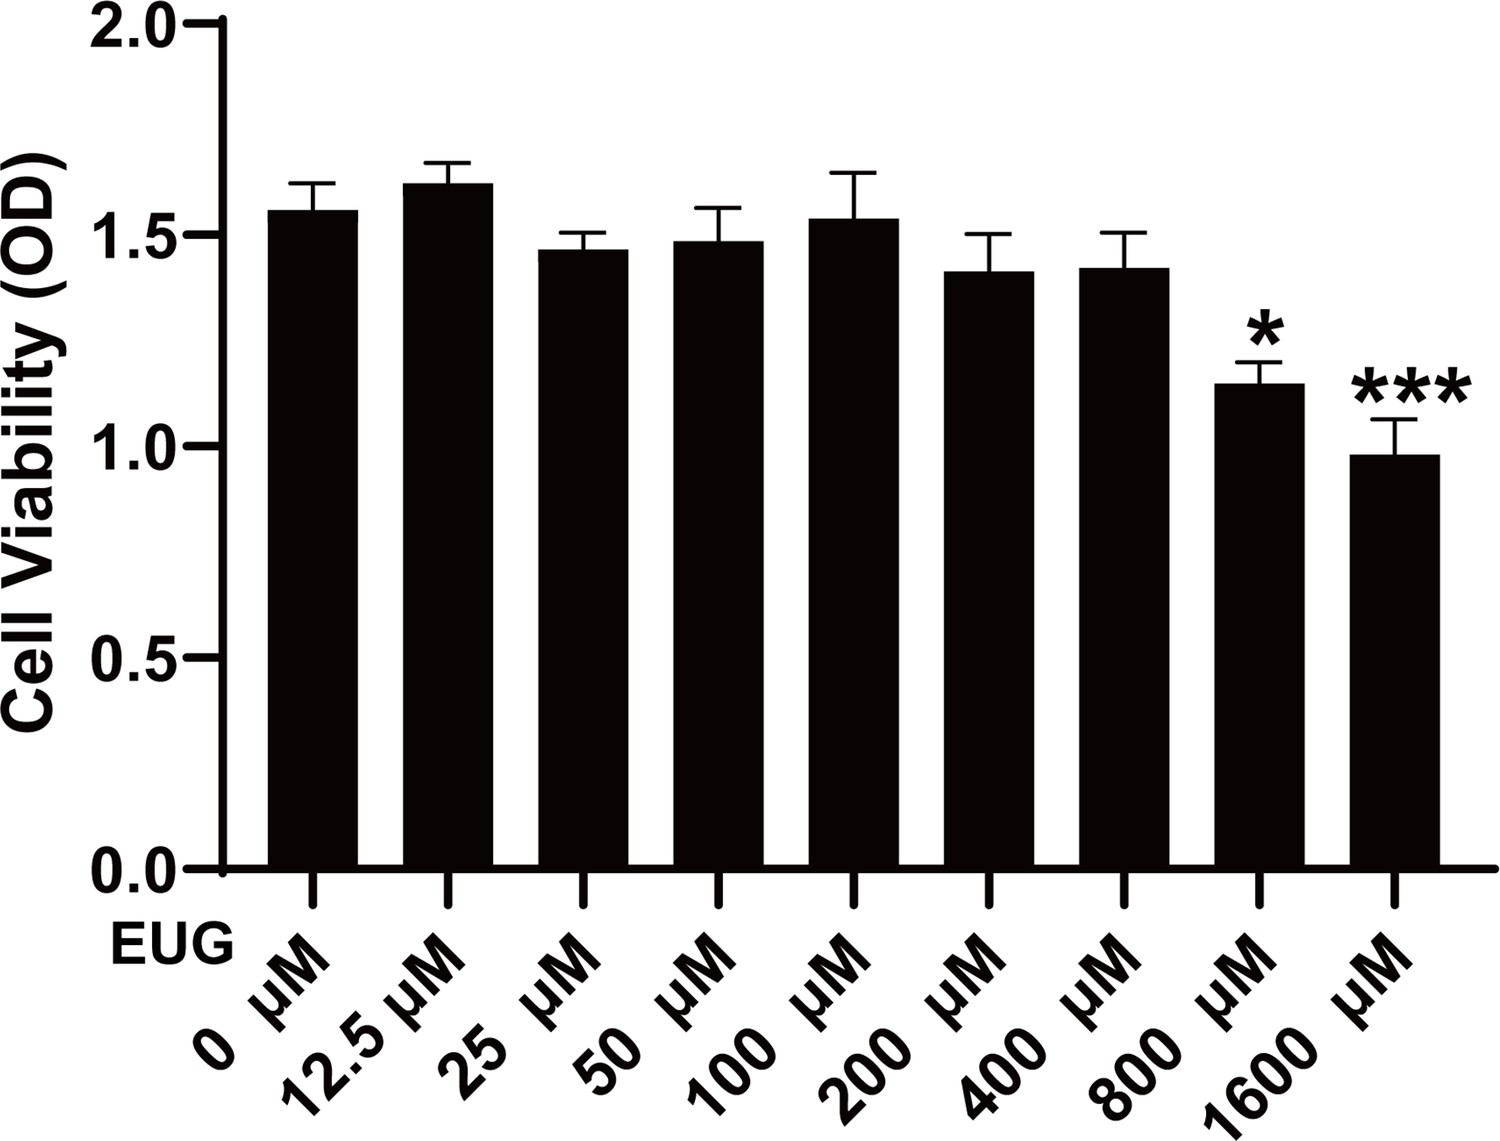
Effect of eugenol on C2C12 cell viability.
Cells were treated with 0, 12.5, 25, 50, 100, 200 μM eugenol (EUG) for 1 day after 4 days of differentiation. The C2C12 cell viability was measured using CCK-8 kit. N=5 per group. One-way ANOVA test was used to determine statistical significance. *p<0.05, **p<0.01, and ***p<0.001.
-
Figure 1—figure supplement 1—source data 1
The C2C12 cell viability was measured using CCK-8 kit.
- https://cdn.elifesciences.org/articles/90724/elife-90724-fig1-figsupp1-data1-v1.xlsx
Figure 2
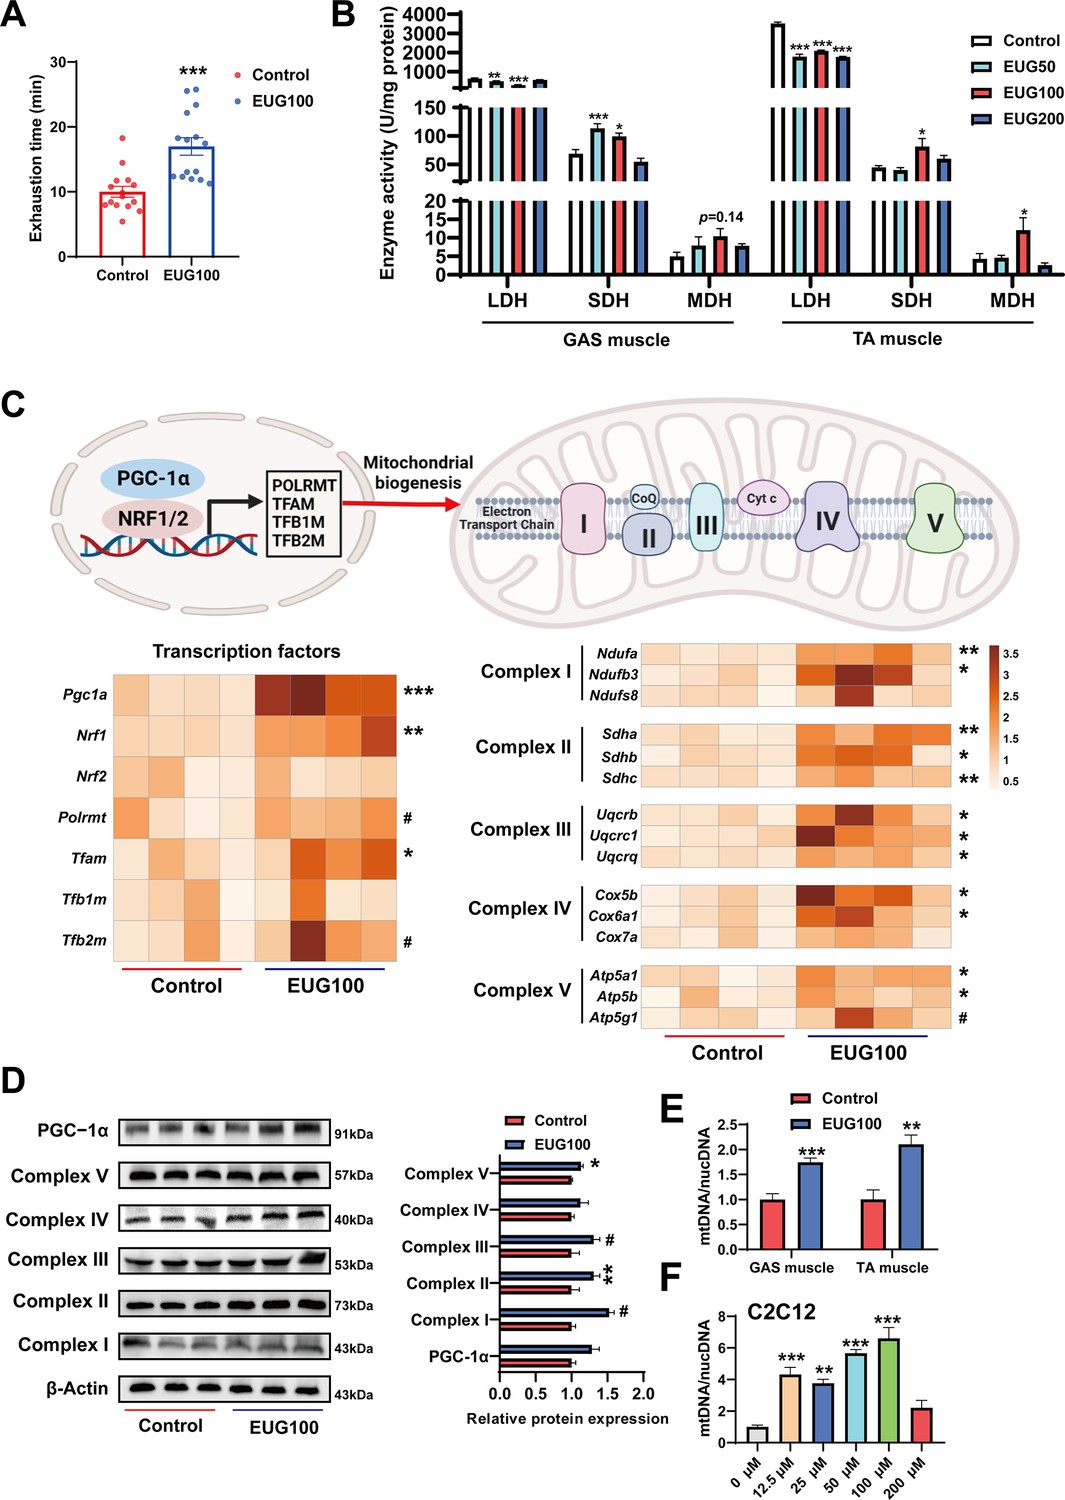
Eugenol promotes oxidative metabolism activity, mitochondrial function, and endurance performance of mice.
(A) The effect of eugenol on exhausting swimming time in mice. (B) The effect of eugenol on metabolism enzymes activity in gastrocnemius (GAS) and tibialis anterior (TA) muscle. (C) The heatmap for the mRNA expression of genes encoding mitochondrial complex components and transcription factors controlling mitochondrial biogenesis in GAS muscle. Color gradient represents relative mRNA expression with darker colors indicating higher expression. (D) Protein expression of mitochondrial electron transport complexes in GAS muscle. Complex I (NDUFA1), complex II (SDHA), complex III (UQCRC1), complex IV (MTCO1), and complex V (ATP5B). (E) mtDNA copy number in muscles. (F) mtDNA copy number in C2C12 myotubes. For A, N=15 per group. For B, N=6 per group. For C and F, N=4 per group. For D, N=3 per group. For E, N=6 per group. One-way ANOVA test was used to determine statistical significance for B and F, student’s t-test was used to determine statistical significance for other panels. #p<0.1, *p<0.05, **p<0.01, and ***p<0.001.
-
Figure 2—source data 1
Exhausting swimming time in mice (Figure 2A).
- https://cdn.elifesciences.org/articles/90724/elife-90724-fig2-data1-v1.xlsx
-
Figure 2—source data 2
Metabolism enzymes activity in gastrocnemius (GAS) and tibialis anterior (TA) muscle (Figure 2B).
- https://cdn.elifesciences.org/articles/90724/elife-90724-fig2-data2-v1.xlsx
-
Figure 2—source data 3
The mRNA expression of genes encoding mitochondrial complex components and transcription factors controlling mitochondrial biogenesis in gastrocnemius (GAS) muscle (Figure 2C).
- https://cdn.elifesciences.org/articles/90724/elife-90724-fig2-data3-v1.xlsx
-
Figure 2—source data 4
Original files for the western blot analysis (Figure 2D).
- https://cdn.elifesciences.org/articles/90724/elife-90724-fig2-data4-v1.zip
-
Figure 2—source data 5
PDF containing Figure 2D and original scans of the relevant western blot analysis, with cropped areas.
- https://cdn.elifesciences.org/articles/90724/elife-90724-fig2-data5-v1.pdf
-
Figure 2—source data 6
mtDNA copy number in muscles (Figure 2E).
- https://cdn.elifesciences.org/articles/90724/elife-90724-fig2-data6-v1.xlsx
-
Figure 2—source data 7
mtDNA copy number in C2C12 myotubes (Figure 2F).
- https://cdn.elifesciences.org/articles/90724/elife-90724-fig2-data7-v1.xlsx
Figure 3
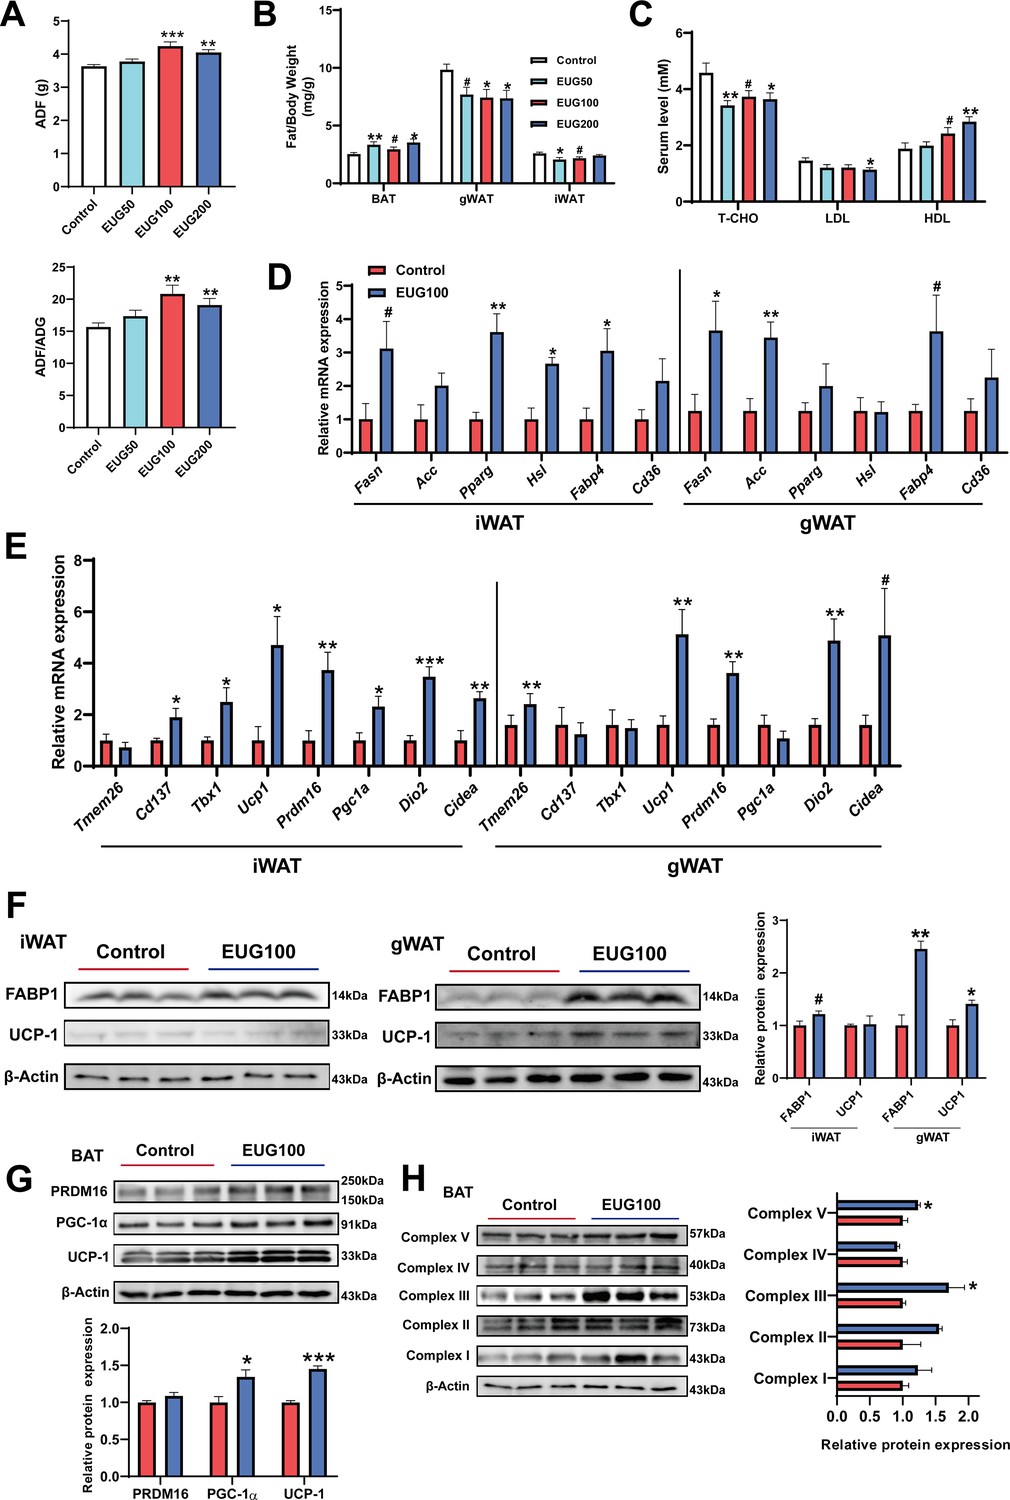
Eugenol enhances lipolysis and thermogenesis.
(A) The average daily feed intake (ADF) and the ration of ADF to average daily weight gain (ADG). (B) Tissue weight of adipose weight. (C) The level of T-CHO, LDL, and HDL in serum. (D) The mRNA expression of genes related to lipolysis, lipogenesis, and lipid transport in inguinal white adipose tissue (iWAT) and gonadal white adipose tissue (gWAT). (E) The mRNA expression of genes related to adipose browning and thermogenesis in iWAT and gWAT. (F) The protein expression of FABP1 and UCP1 in iWAT and gWAT. (G) The expression of protein related to adipose browning and thermogenesis in brown adipose tissue (BAT). (H) The protein expression of mitochondrial electron transport complexes in BAT. For A, N=20 per group. For B, N=14 per group. For C, N=8 per group. For D and E, N=6 per group. For F and H, N=3 per group. One-way ANOVA test was used to determine statistical significance for A-C, student’s t-test was used to determine statistical significance for other panels. #p<0.1, *p<0.05, **p<0.01, and ***p<0.001.
-
Figure 3—source data 1
The average daily feed intake (ADF) and the ration of ADF to average daily weight gain (ADG) (Figure 3A).
- https://cdn.elifesciences.org/articles/90724/elife-90724-fig3-data1-v1.xlsx
-
Figure 3—source data 2
Tissue weight of adipose weight (Figure 3B).
- https://cdn.elifesciences.org/articles/90724/elife-90724-fig3-data2-v1.xlsx
-
Figure 3—source data 3
The level of T-CHO, LDL, and HDL in serum (Figure 3C).
- https://cdn.elifesciences.org/articles/90724/elife-90724-fig3-data3-v1.xlsx
-
Figure 3—source data 4
The mRNA expression of genes related to lipolysis, lipogenesis, and lipid transport in inguinal white adipose tissue (iWAT) and gonadal white adipose tissue (gWAT) (Figure 3D).
- https://cdn.elifesciences.org/articles/90724/elife-90724-fig3-data4-v1.xlsx
-
Figure 3—source data 5
The mRNA expression of genes related to adipose browning and thermogenesis in inguinal white adipose tissue (iWAT) and gonadal white adipose tissue (gWAT) (Figure 3E).
- https://cdn.elifesciences.org/articles/90724/elife-90724-fig3-data5-v1.xlsx
-
Figure 3—source data 6
Original files for the western blot analysis (Figure 3F).
- https://cdn.elifesciences.org/articles/90724/elife-90724-fig3-data6-v1.zip
-
Figure 3—source data 7
PDF containing Figure 3F and original scans of the relevant western blot analysis, with cropped areas.
- https://cdn.elifesciences.org/articles/90724/elife-90724-fig3-data7-v1.pdf
-
Figure 3—source data 8
Original files for the western blot analysis (Figure 3G).
- https://cdn.elifesciences.org/articles/90724/elife-90724-fig3-data8-v1.zip
-
Figure 3—source data 9
PDF containing Figure 3G and original scans of the relevant western blot analysis, with cropped areas.
- https://cdn.elifesciences.org/articles/90724/elife-90724-fig3-data9-v1.pdf
-
Figure 3—source data 10
Original files for the western blot analysis (Figure 3H).
- https://cdn.elifesciences.org/articles/90724/elife-90724-fig3-data10-v1.zip
-
Figure 3—source data 11
PDF containing Figure 3H and original scans of the relevant western blot analysis, with cropped areas.
- https://cdn.elifesciences.org/articles/90724/elife-90724-fig3-data11-v1.pdf
Figure 4 with 3 supplements
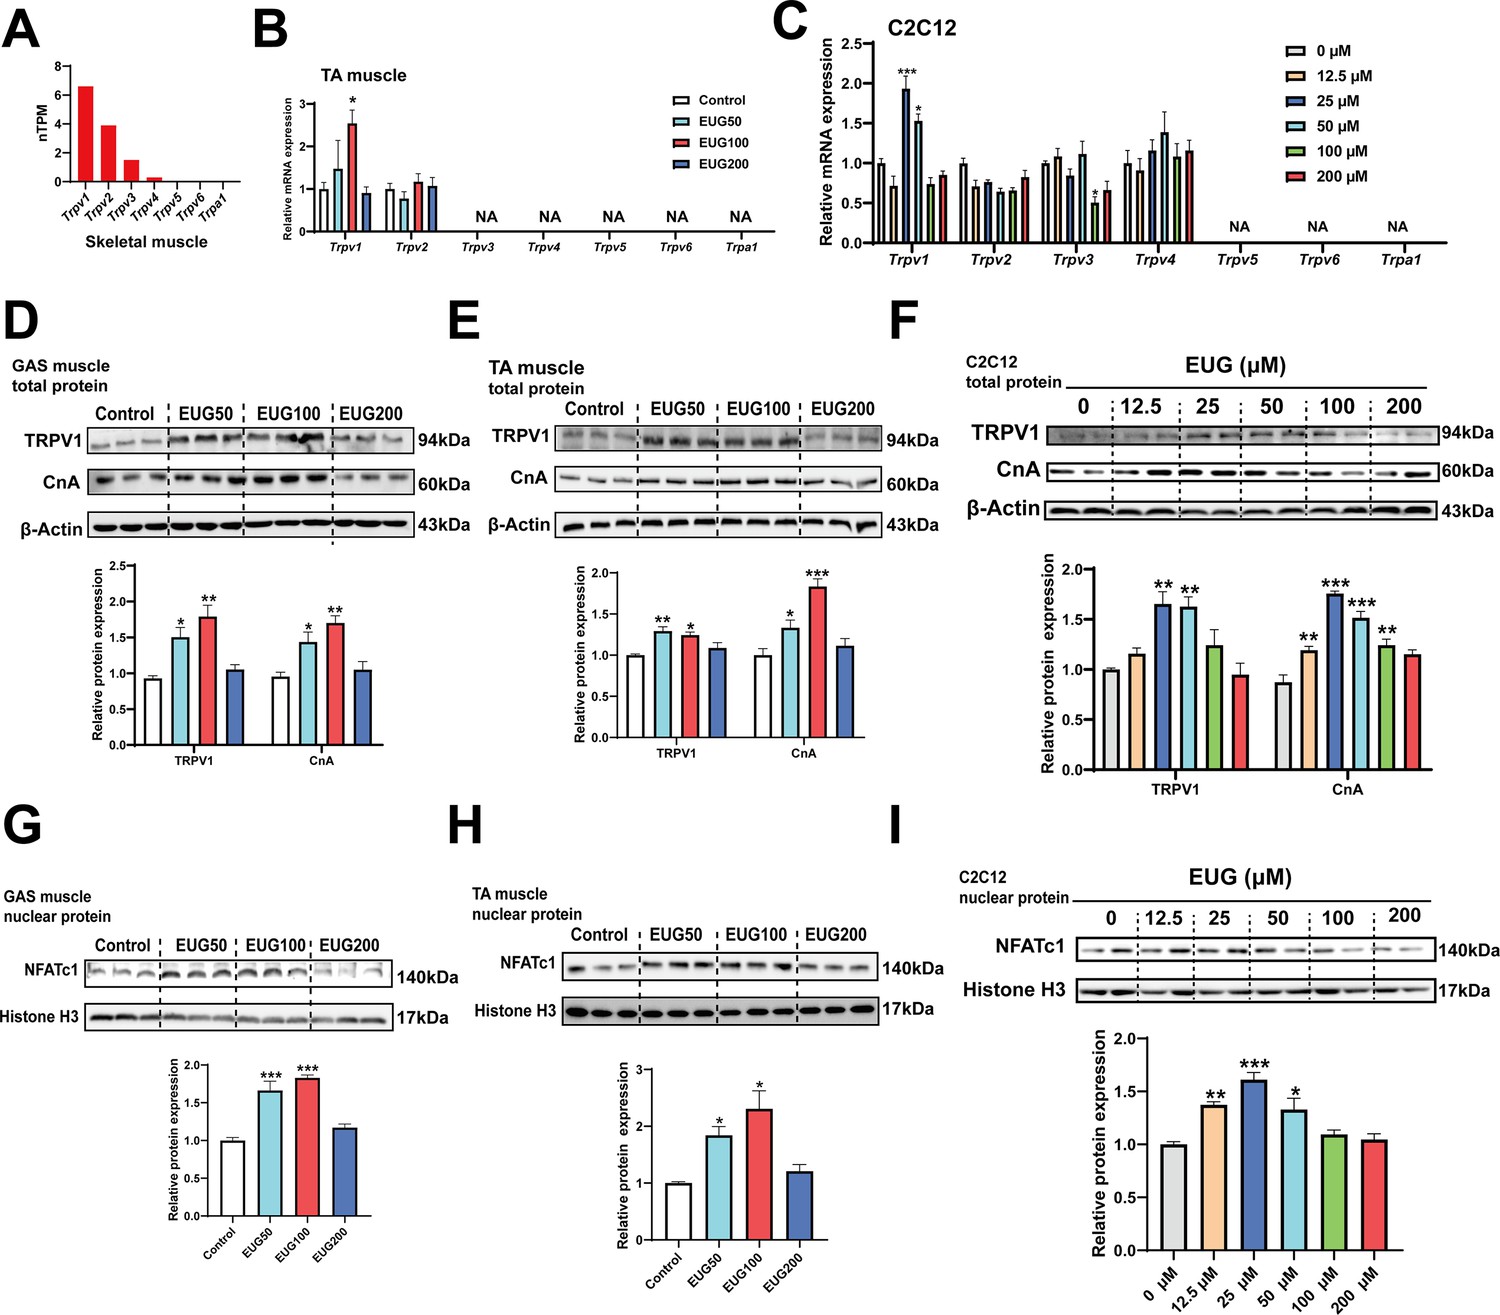
Eugenol activated TRPV1-mediated CaN/NFATc1 signaling pathway.
(A) The gene expression profile of transient receptor potential (TRP) channels in skeletal muscle was obtained from the GTEx dataset in The Human Protein Atlas (https://www.proteinatlas.org/). (B, C) The mRNA expression of TRP channels in tibialis anterior (TA) muscle and C2C12 myotubes. (D–F) The TRPV1 and CnA protein expression in gastrocnemius (GAS) and TA muscle and in C2C12 myotubes. (G–I) The protein expression of NFATc1 in GAS and TA muscle and in C2C12 myotubes. For B, N=6 per group. For C, F, and I, N=4 per group. For D, E and G, H, N=3 per group. One-way ANOVA test was used to determine statistical significance. *p<0.05, **p<0.01, and ***p<0.001.
-
Figure 4—source data 1
The gene expression profile of transient receptor potential (TRP) channels in skeletal muscle (Figure 4A).
- https://cdn.elifesciences.org/articles/90724/elife-90724-fig4-data1-v1.xlsx
-
Figure 4—source data 2
The mRNA expression of transient receptor potential (TRP) channels in tibialis anterior (TA) muscle (Figure 4B).
- https://cdn.elifesciences.org/articles/90724/elife-90724-fig4-data2-v1.xlsx
-
Figure 4—source data 3
The mRNA expression of transient receptor potential (TRP) channels in C2C12 myotubes (Figure 4C).
- https://cdn.elifesciences.org/articles/90724/elife-90724-fig4-data3-v1.xlsx
-
Figure 4—source data 4
Original files for the western blot analysis (Figure 4D).
- https://cdn.elifesciences.org/articles/90724/elife-90724-fig4-data4-v1.zip
-
Figure 4—source data 5
PDF containing Figure 4D and original scans of the relevant western blot analysis, with cropped areas.
- https://cdn.elifesciences.org/articles/90724/elife-90724-fig4-data5-v1.pdf
-
Figure 4—source data 6
Original files for the western blot analysis (Figure 4E).
- https://cdn.elifesciences.org/articles/90724/elife-90724-fig4-data6-v1.zip
-
Figure 4—source data 7
PDF containing Figure 4E and original scans of the relevant western blot analysis, with cropped areas.
- https://cdn.elifesciences.org/articles/90724/elife-90724-fig4-data7-v1.pdf
-
Figure 4—source data 8
Original files for the western blot analysis (Figure 4F).
- https://cdn.elifesciences.org/articles/90724/elife-90724-fig4-data8-v1.zip
-
Figure 4—source data 9
PDF containing Figure 4F and original scans of the relevant western blot analysis, with cropped areas.
- https://cdn.elifesciences.org/articles/90724/elife-90724-fig4-data9-v1.pdf
-
Figure 4—source data 10
Original files for the western blot analysis (Figure 4G).
- https://cdn.elifesciences.org/articles/90724/elife-90724-fig4-data10-v1.zip
-
Figure 4—source data 11
PDF containing Figure 4G and original scans of the relevant western blot analysis, with cropped areas.
- https://cdn.elifesciences.org/articles/90724/elife-90724-fig4-data11-v1.pdf
-
Figure 4—source data 12
Original files for the western blot analysis (Figure 4H).
- https://cdn.elifesciences.org/articles/90724/elife-90724-fig4-data12-v1.zip
-
Figure 4—source data 13
PDF containing Figure 4H and original scans of the relevant western blot analysis, with cropped areas.
- https://cdn.elifesciences.org/articles/90724/elife-90724-fig4-data13-v1.pdf
-
Figure 4—source data 14
Original files for the western blot analysis (Figure 4I).
- https://cdn.elifesciences.org/articles/90724/elife-90724-fig4-data14-v1.zip
-
Figure 4—source data 15
PDF containing Figure 4I and original scans of the relevant western blot analysis, with cropped areas.
- https://cdn.elifesciences.org/articles/90724/elife-90724-fig4-data15-v1.pdf
Figure 4—figure supplement 1
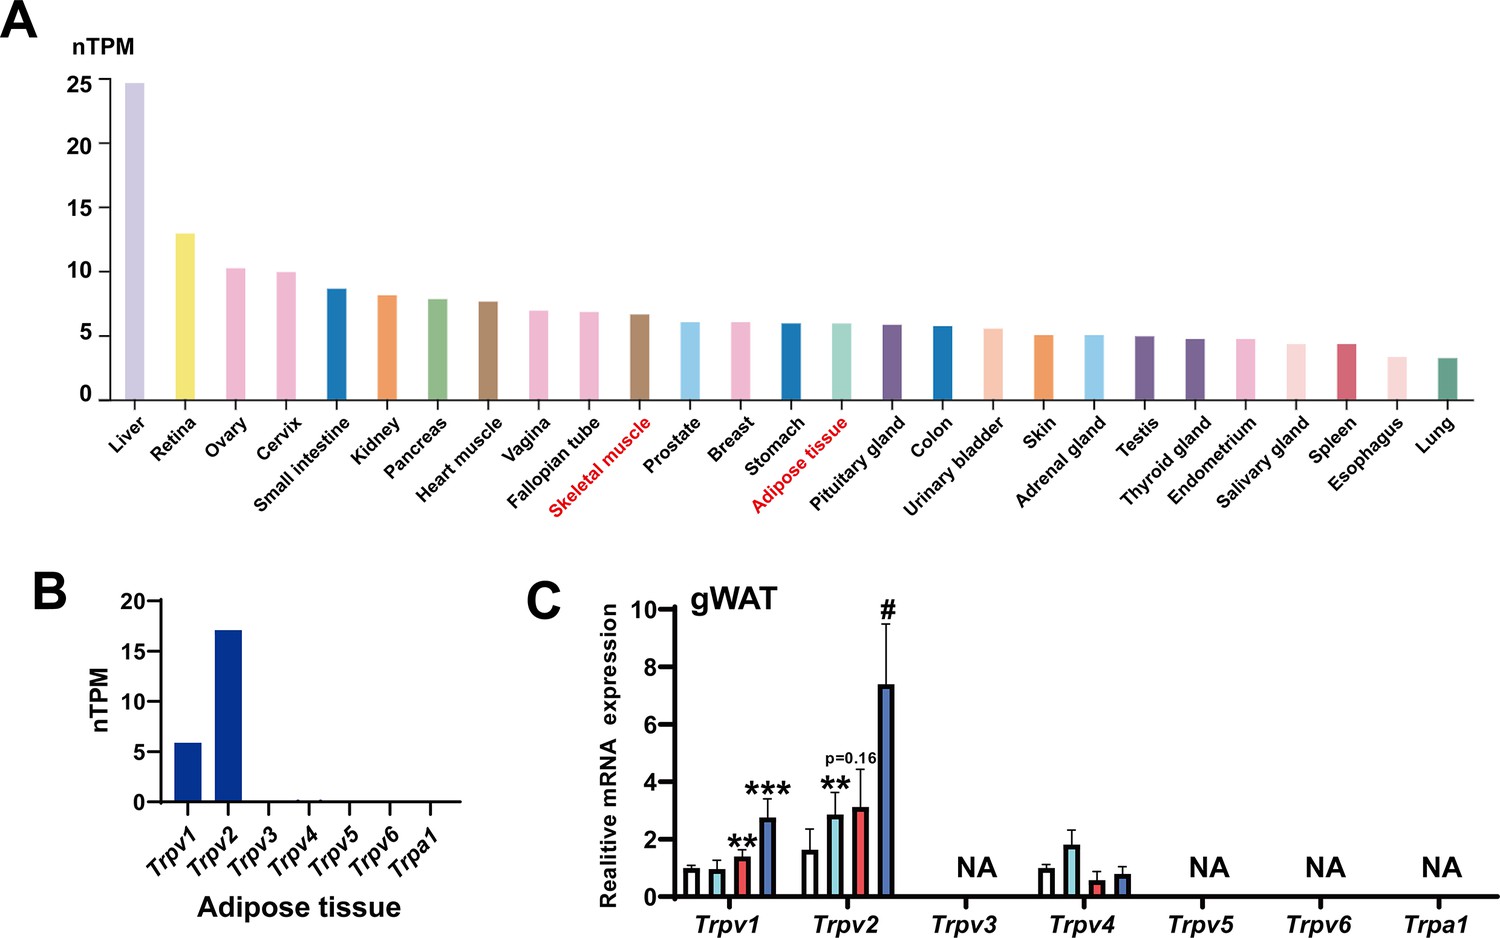
Transient receptor potential (TRP) channels expression profiles and Trpv1 mRNA expression in adipose tissue.
The gene expression profile was obtained from the GTEx dataset in The Human Protein Atlas (https://www.proteinatlas.org/). (A) TRPV1 expression profiles in tissues. (B) TRP channels expression profiles in adipose tissue. (C) The mRNA expression of TRP channels in adipose tissue. For C, N=6 per group. One-way ANOVA test was used to determine statistical significance. #p<0.1, *p<0.05, **p<0.01, and ***p<0.001.
-
Figure 4—figure supplement 1—source data 1
Transient receptor potential (TRP) channels expression profiles in adipose tissue (Figure 4—figure supplement 1B).
- https://cdn.elifesciences.org/articles/90724/elife-90724-fig4-figsupp1-data1-v1.xlsx
-
Figure 4—figure supplement 1—source data 2
The mRNA expression of transient receptor potential (TRP) channels in adipose tissue (Figure 4—figure supplement 1C).
- https://cdn.elifesciences.org/articles/90724/elife-90724-fig4-figsupp1-data2-v1.xlsx
Figure 4—figure supplement 2
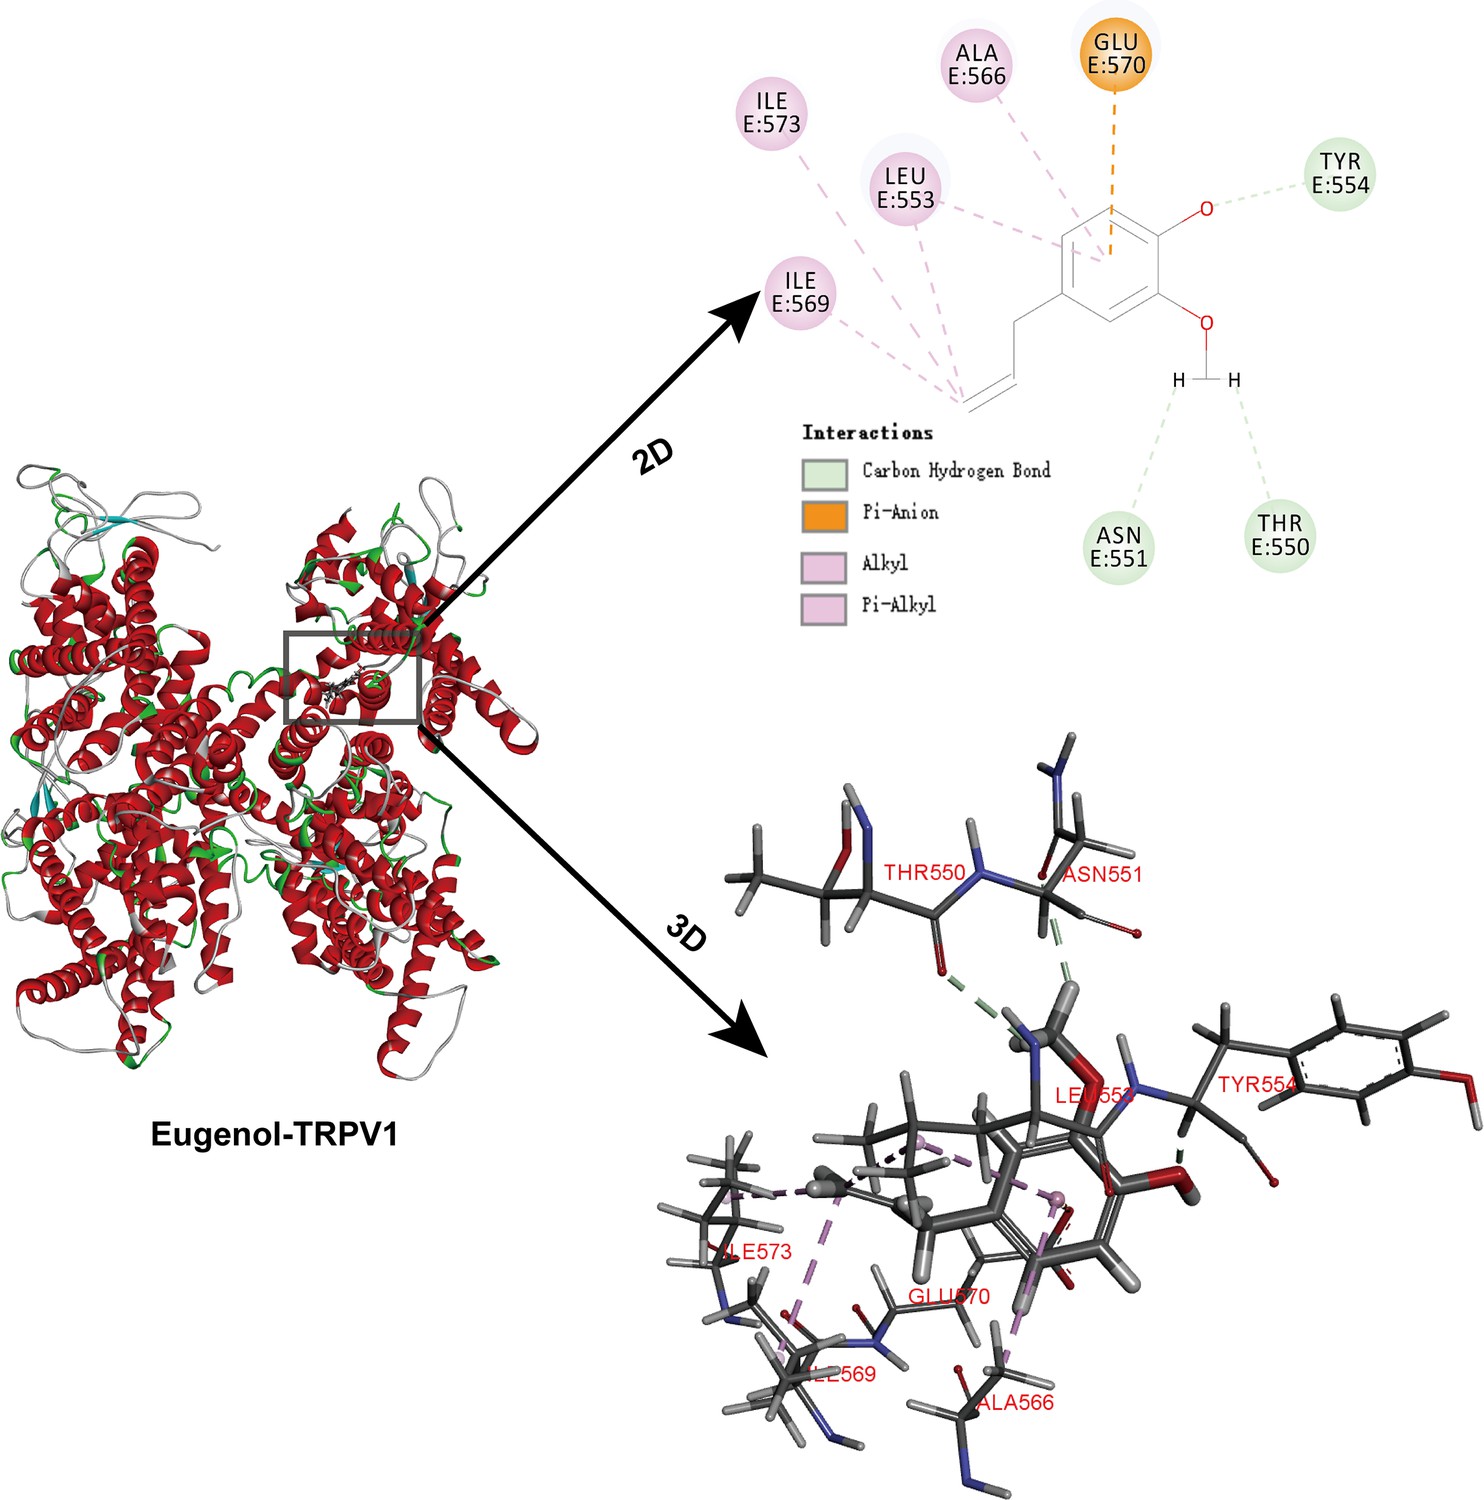
Molecular docking for eugenol and TRPV1.
The capsaicin binding sites (TYR511, SER512, THR550, and GLU570) were selected as the binding pocket. The figure showed TRPV1 amino acid residues interacting with eugenol and the intermolecular force.
Figure 4—figure supplement 3
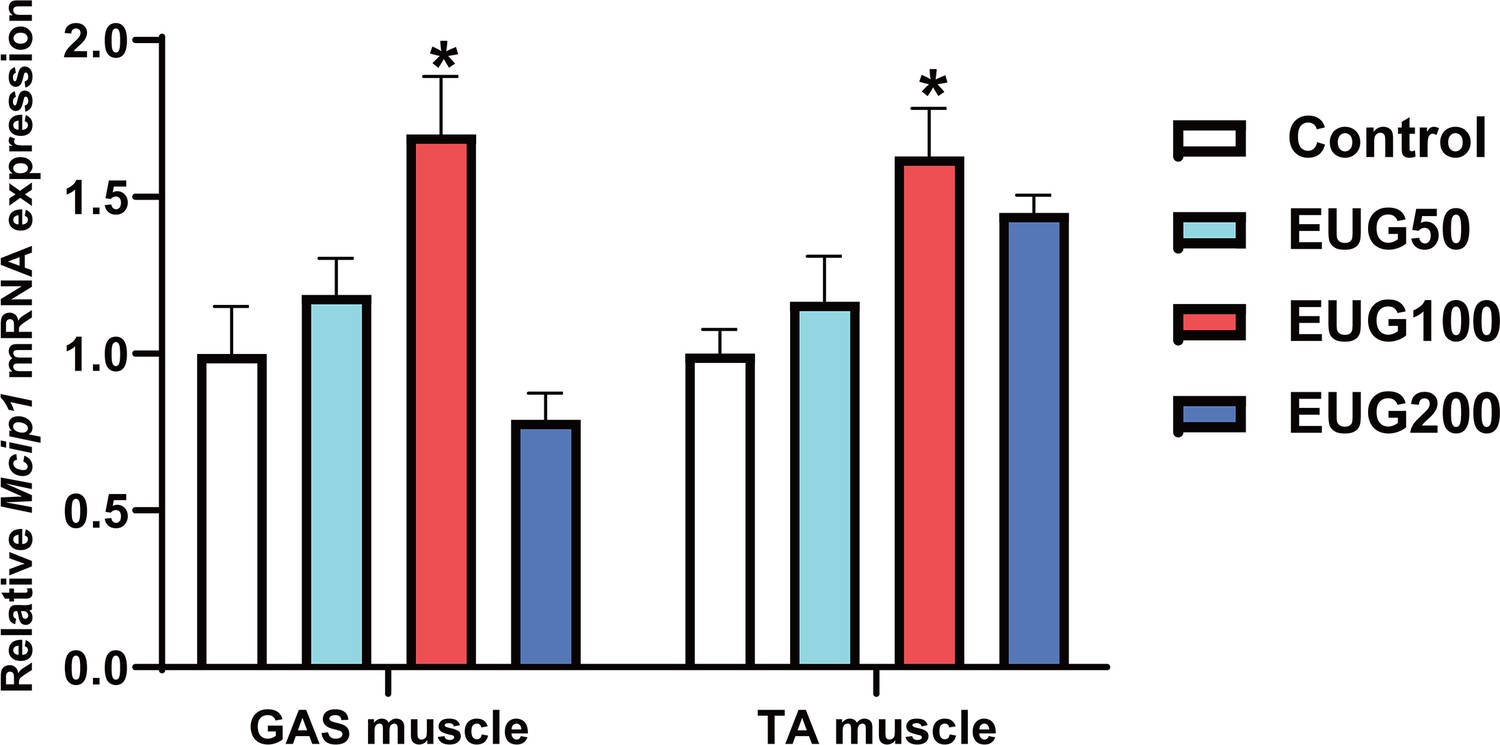
The mRNA expression of Mcip1.
N=6 per group. One-way ANOVA test was used to determine statistical significance. *p<0.05, **p<0.01, and ***p<0.001.
-
Figure 4—figure supplement 3—source data 1
The mRNA expression of Mcip1.
- https://cdn.elifesciences.org/articles/90724/elife-90724-fig4-figsupp3-data1-v1.xlsx
Figure 5
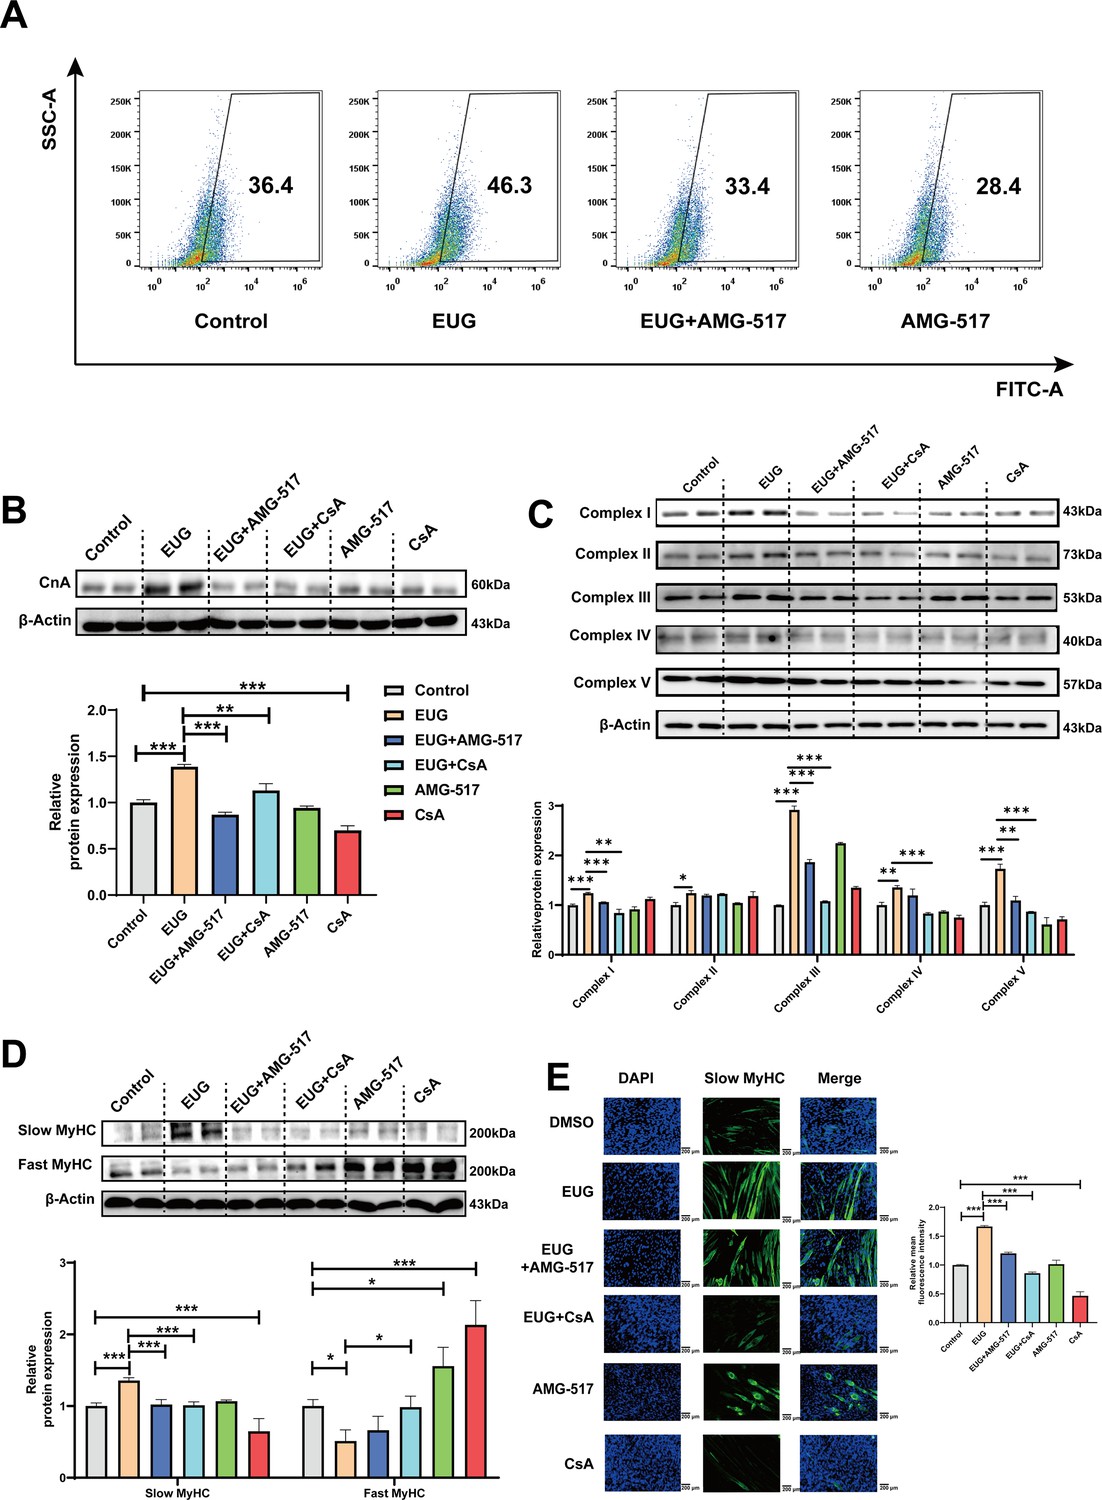
Eugenol promotes fast-to-slow muscle fiber transformation by activating TRPV1-mediated CaN/NFATc1 signaling pathway.
C2C12 myotubes were treated by 25 μM eugenol and 1 μM TRPV1 inhibitor AMG-517 or 0.5 μM CaN inhibitor cyclosporine A (CsA) for 1 day after 4 days of differentiation. (A) The flow cytometry assay was used to detect Ca2+ levels in C2C12 myotubes; FITC means the fluo-4 fluorescence and SSC means side scatter. (B) Western blot was used to detect CnA protein expression in C2C12 myotubes. (C) Western blot was used to detect mitochondrial electron transport complexes protein expression in C2C12 myotubes. (D) Western blot was used to detect slow myosin heavy chain (MyHC) and fast MyHC protein expression in C2C12 myotubes. (E) Representative immunofluorescence images of slow MyHC (green fluorescence) and relative mean fluorescence intensity quantification. Magnification: ×200. For A–D, N=4 per group. One-way ANOVA test was used to determine statistical significance. *p<0.05, **p<0.01, and ***p<0.001.
-
Figure 5—source data 1
The flow cytometry assay (Figure 5A).
- https://cdn.elifesciences.org/articles/90724/elife-90724-fig5-data1-v1.zip
-
Figure 5—source data 2
Original files for the western blot analysis (Figure 5B).
- https://cdn.elifesciences.org/articles/90724/elife-90724-fig5-data2-v1.zip
-
Figure 5—source data 3
PDF containing Figure 5B and original scans of the relevant western blot analysis, with cropped areas.
- https://cdn.elifesciences.org/articles/90724/elife-90724-fig5-data3-v1.pdf
-
Figure 5—source data 4
Original files for the western blot analysis (Figure 5C).
- https://cdn.elifesciences.org/articles/90724/elife-90724-fig5-data4-v1.zip
-
Figure 5—source data 5
PDF containing Figure 5C and original scans of the relevant western blot analysis, with cropped areas.
- https://cdn.elifesciences.org/articles/90724/elife-90724-fig5-data5-v1.pdf
-
Figure 5—source data 6
Original files for the western blot analysis (Figure 5D).
- https://cdn.elifesciences.org/articles/90724/elife-90724-fig5-data6-v1.zip
-
Figure 5—source data 7
PDF containing Figure 5D and original scans of the relevant western blot analysis, with cropped areas.
- https://cdn.elifesciences.org/articles/90724/elife-90724-fig5-data7-v1.pdf
-
Figure 5—source data 8
Representative immunofluorescence images of slow myosin heavy chain (MyHC) (Figure 5E).
- https://cdn.elifesciences.org/articles/90724/elife-90724-fig5-data8-v1.zip
Figure 6
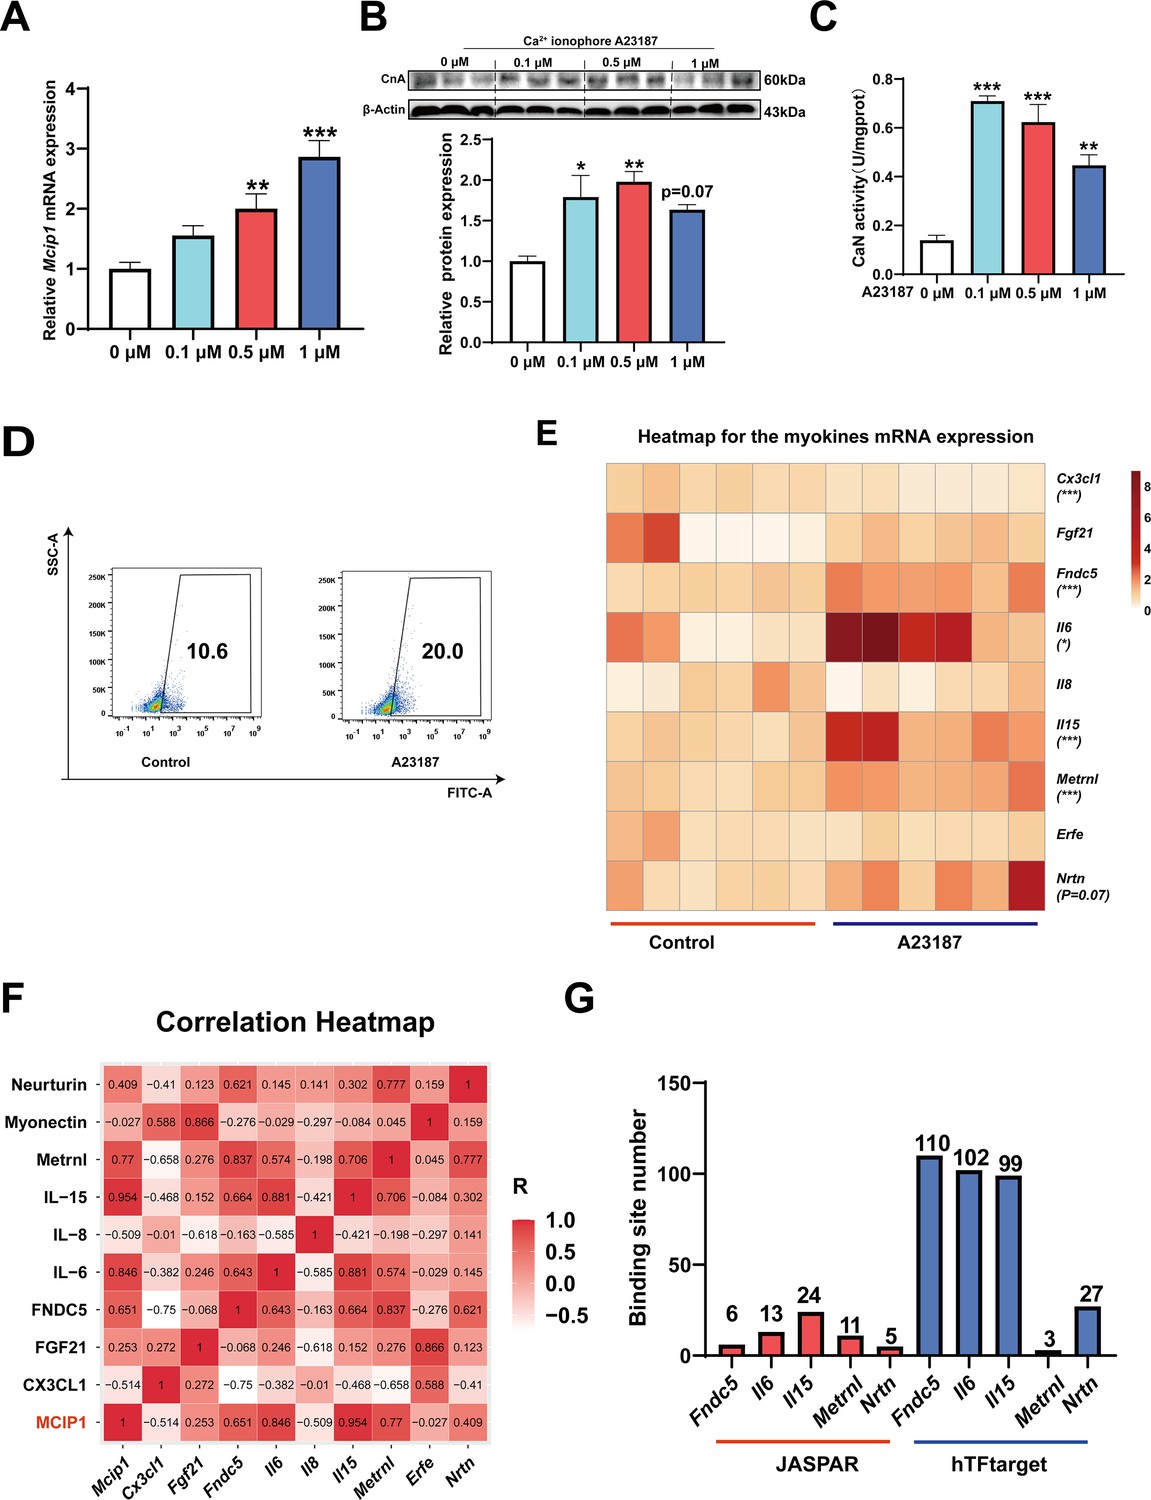
The myokines controlled by calcineurin (CaN).
C2C12 myotubes were treated for 16 hr with 0, 0.1, 0.5, and 1 μM Ca2+ ionophore after 2 days of differentiation. (A) The mRNA expression of Mcip1. (B) The protein expression of CnA. (C) The enzyme activity of CaN. (D) Fluo-4 was used to stain the Ca2+ and the flow cytometry assay was used to detect Ca2+ fluorescence in C2C12 myotubes in control and 0.5 μM A23187 groups. (E) The heatmap for the myokines mRNA expression in control and 0.5 μM A23187 groups. Color gradient represents relative mRNA expression with darker colors indicating higher expression. (F) Correlation analysis of gene expression values of myokines and MCIP1 gene performed by linear regression with Pearson’s correlation coefficient (r). Color gradient represents correlation coefficient with darker colors indicating higher positive correlation. (G) The number of binding sites for transcription factors NFATc1 were predicted by hTFtarget and JASPAR. For A, N=6 per group. For B and C, N=3 per group. For D, N=4 per group. For E, N=6 per group. One-way ANOVA test was used to determine statistical significance for A-C, student’s t-test was used to determine statistical significance for other panels. *p<0.05, **p<0.01, and ***p<0.001.
-
Figure 6—source data 1
The mRNA expression of Mcip1 (Figure 6A).
- https://cdn.elifesciences.org/articles/90724/elife-90724-fig6-data1-v1.xlsx
-
Figure 6—source data 2
Original files for the western blot analysis (Figure 6B).
- https://cdn.elifesciences.org/articles/90724/elife-90724-fig6-data2-v1.zip
-
Figure 6—source data 3
PDF containing Figure 6B and original scans of the relevant western blot analysis, with cropped areas.
- https://cdn.elifesciences.org/articles/90724/elife-90724-fig6-data3-v1.pdf
-
Figure 6—source data 4
The enzyme activity of calcineurin (CaN) (Figure 6C).
- https://cdn.elifesciences.org/articles/90724/elife-90724-fig6-data4-v1.xlsx
-
Figure 6—source data 5
The flow cytometry assay (Figure 6D).
- https://cdn.elifesciences.org/articles/90724/elife-90724-fig6-data5-v1.zip
-
Figure 6—source data 6
The myokines mRNA expression (Figure 6E).
- https://cdn.elifesciences.org/articles/90724/elife-90724-fig6-data6-v1.xlsx
-
Figure 6—source data 7
Correlation analysis of gene expression values (Figure 6F).
- https://cdn.elifesciences.org/articles/90724/elife-90724-fig6-data7-v1.xlsx
Figure 7 with 1 supplement
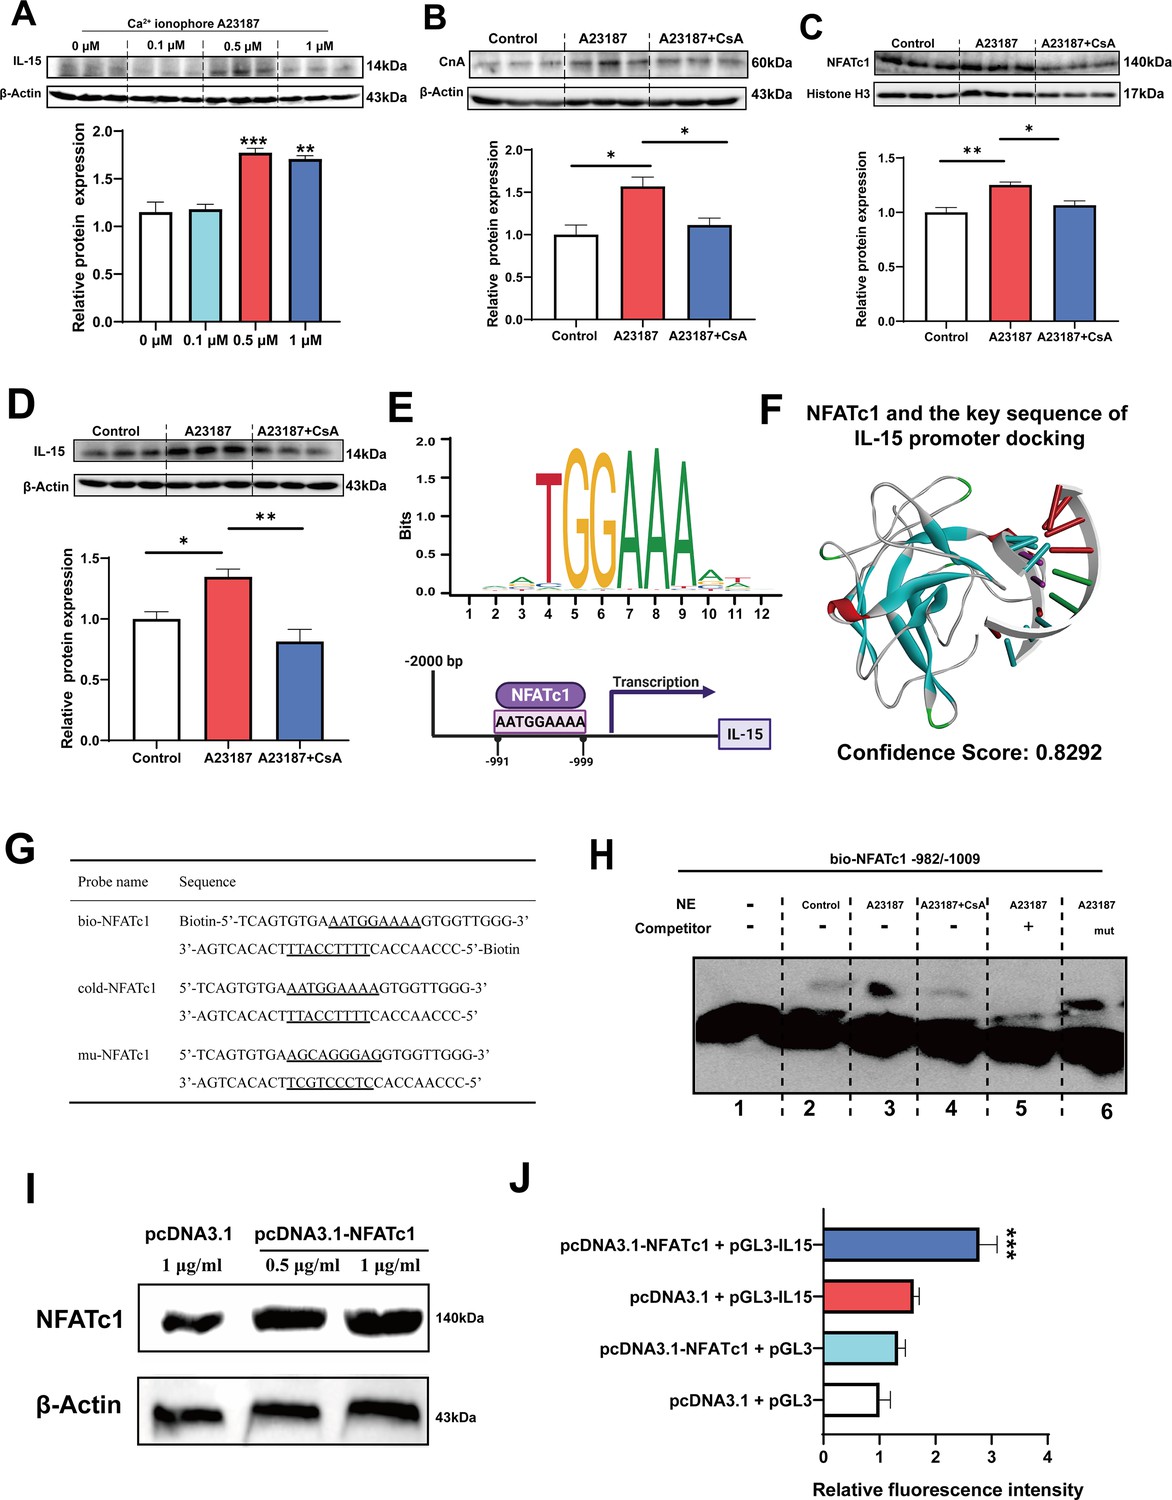
The myokine IL-15 expression depends on CaN/NFATc1 signaling pathway.
(A) C2C12 myotubes were treated for 16 hr with 0, 0.1, 0.5, and 1 μM Ca2+ ionophore after 2 days of differentiation. The protein expression of IL-15. (B–D) C2C12 myotubes were treated by 0.5 μM A23187 and 0.5 μM cyclosporine A (CsA) for 16 hr after 2 days of differentiation. The protein expression of CnA, NFATc1, and IL-15. (E) Sequence logo of NFATc1 motif and the predicted NFATc1 binding sites in the promoter region of IL-15. (F) NFATc1 and the key sequence of IL-15 (5’-AATGAAAA-3’) docking. Confidence scores above 0.7 indicate high probability of binding, scores between 0.5 and 0.7 suggest possible binding, and scores below 0.5 indicate unlikely binding. (G) The probe sequence of NFATc1. The underline represents the predicted binding site of NFATc1, bio-NFATc1 means oligonucleotide probes that labeled with biotin at the 5’ end, cold-NFATc1 means oligonucleotide probes that did not label with biotin, mu-NFATc1 means oligonucleotide probes that were mutated at the binding site. (H) Nuclear protein extracts (NE) with NFATc1 probe were used for electrophoretic mobility shift assay (EMSA). (I) The protein expression of NFATc1 after transfecting 1 μg/mL pcDNA3.1 vector, 0.5 μg/mL or 1 μg/mL pcDNA3.1-NFATc1 in HEK293T cells. (J) The relative luciferase intensity referred to the ratio between firefly luciferase intensity and Renilla luciferase intensity. For A–D, N=3 per group. For J, N=6 per group. One-way ANOVA test was used to determine statistical significance. *p<0.05, **p<0.01, and ***p<0.001.
-
Figure 7—source data 1
Original files for the western blot analysis (Figure 7A).
- https://cdn.elifesciences.org/articles/90724/elife-90724-fig7-data1-v1.zip
-
Figure 7—source data 2
PDF containing Figure 7A and original scans of the relevant western blot analysis, with cropped areas.
- https://cdn.elifesciences.org/articles/90724/elife-90724-fig7-data2-v1.pdf
-
Figure 7—source data 3
Original files for the western blot analysis (Figure 7B).
- https://cdn.elifesciences.org/articles/90724/elife-90724-fig7-data3-v1.zip
-
Figure 7—source data 4
PDF containing Figure 7B and original scans of the relevant western blot analysis, with cropped areas.
- https://cdn.elifesciences.org/articles/90724/elife-90724-fig7-data4-v1.pdf
-
Figure 7—source data 5
Original files for the western blot analysis (Figure 7C).
- https://cdn.elifesciences.org/articles/90724/elife-90724-fig7-data5-v1.zip
-
Figure 7—source data 6
PDF containing Figure 7C and original scans of the relevant western blot analysis, with cropped areas.
- https://cdn.elifesciences.org/articles/90724/elife-90724-fig7-data6-v1.pdf
-
Figure 7—source data 7
Original files for the western blot analysis (Figure 7D).
- https://cdn.elifesciences.org/articles/90724/elife-90724-fig7-data7-v1.zip
-
Figure 7—source data 8
PDF containing Figure 7D and original scans of the relevant western blot analysis, with cropped areas.
- https://cdn.elifesciences.org/articles/90724/elife-90724-fig7-data8-v1.pdf
-
Figure 7—source data 9
Original files for the electrophoretic mobility shift assay (EMSA) analysis (Figure 7H).
- https://cdn.elifesciences.org/articles/90724/elife-90724-fig7-data9-v1.zip
-
Figure 7—source data 10
PDF containing Figure 7H and original scans of the relevant electrophoretic mobility shift assay (EMSA) analysis, with cropped areas.
- https://cdn.elifesciences.org/articles/90724/elife-90724-fig7-data10-v1.pdf
-
Figure 7—source data 11
Original files for the western blot analysis (Figure 7I).
- https://cdn.elifesciences.org/articles/90724/elife-90724-fig7-data11-v1.zip
-
Figure 7—source data 12
PDF containing Figure 7I and original scans of the relevant western blot analysis, with cropped areas.
- https://cdn.elifesciences.org/articles/90724/elife-90724-fig7-data12-v1.pdf
-
Figure 7—source data 13
The ratio between firefly luciferase intensity and Renilla luciferase intensity (Figure 7J).
- https://cdn.elifesciences.org/articles/90724/elife-90724-fig7-data13-v1.xlsx
Figure 7—figure supplement 1
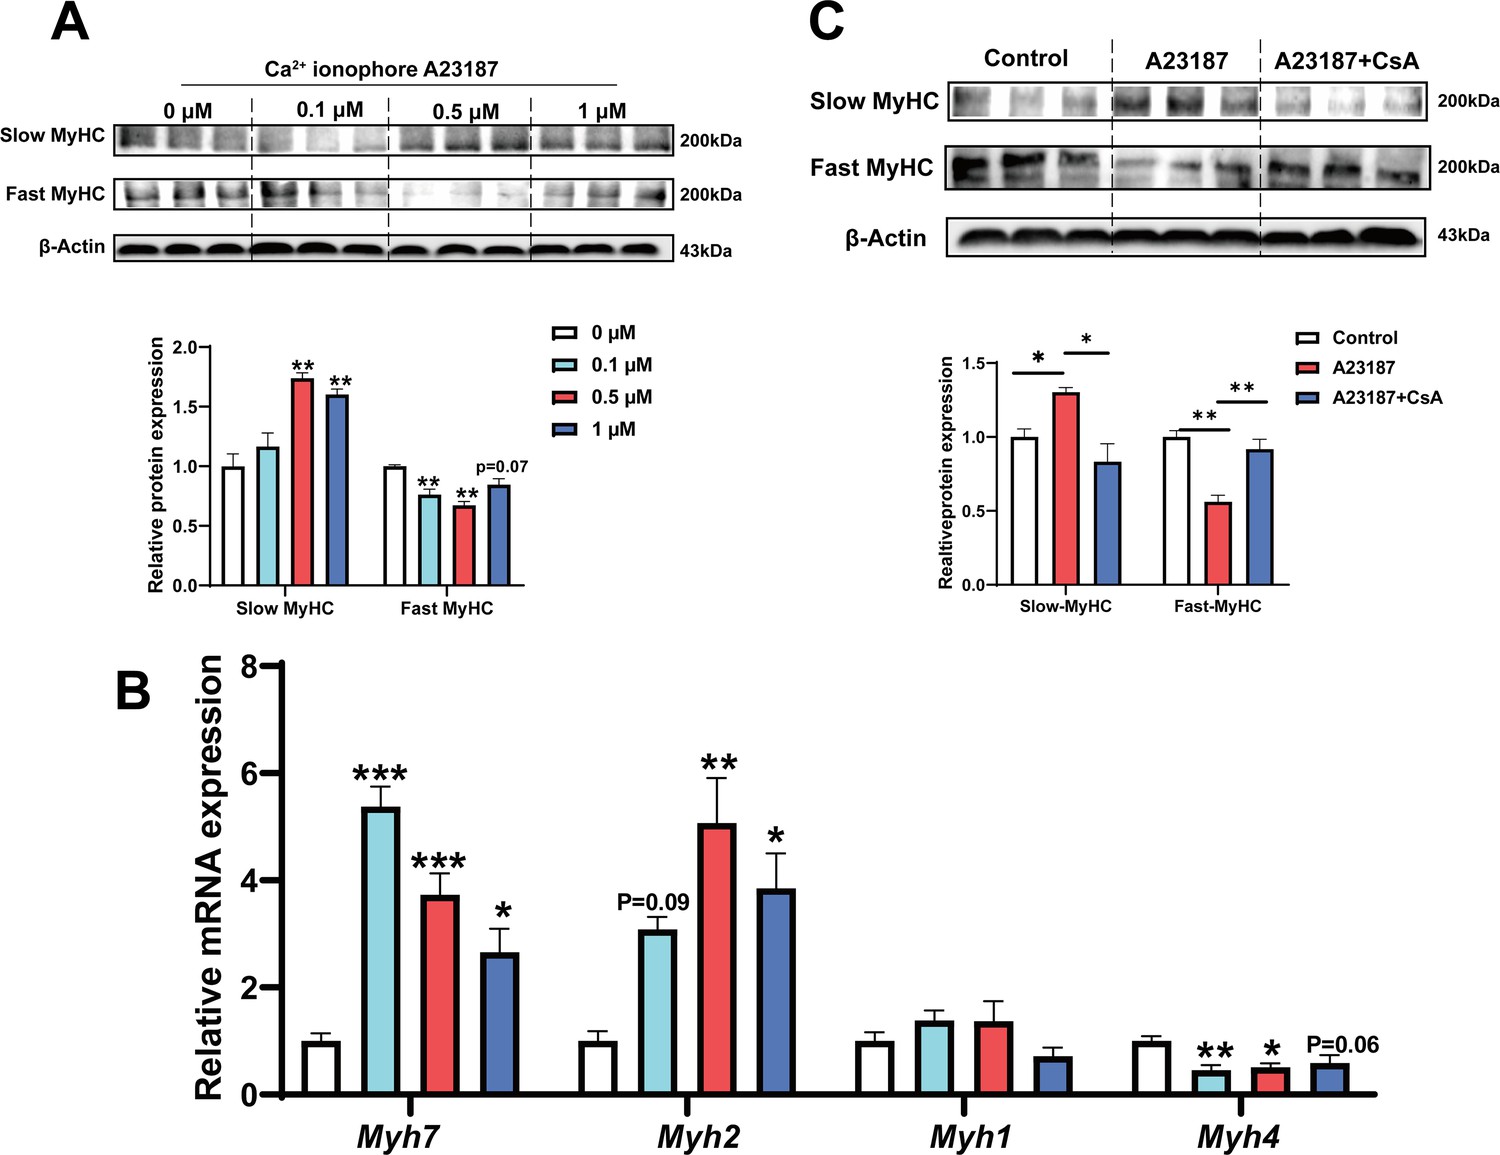
Ca2+ ionophore A23187 promotes the transformation of fast-to-slow muscle fiber by calcineurin (CaN) signaling pathway.
(A–C) The mRNA and protein expression of muscle fiber type in C2C12 myotubes. For B, N=6 per group. For A and C, N=3 per group. One-way ANOVA test was used to determine statistical significance. *p<0.05, **p<0.01, and ***p<0.001.
-
Figure 7—figure supplement 1—source data 1
Original files for the western blot analysis (Figure 7—figure supplement 1A).
- https://cdn.elifesciences.org/articles/90724/elife-90724-fig7-figsupp1-data1-v1.zip
-
Figure 7—figure supplement 1—source data 2
PDF containing Figure 7—figure supplement 1A and original scans of the relevant western blot analysis, with cropped areas.
- https://cdn.elifesciences.org/articles/90724/elife-90724-fig7-figsupp1-data2-v1.pdf
-
Figure 7—figure supplement 1—source data 3
The mRNA expression of muscle fiber type in C2C12 myotubes (Figure 7—figure supplement 1B).
- https://cdn.elifesciences.org/articles/90724/elife-90724-fig7-figsupp1-data3-v1.xlsx
-
Figure 7—figure supplement 1—source data 4
Original files for the western blot analysis (Figure 7—figure supplement 1C).
- https://cdn.elifesciences.org/articles/90724/elife-90724-fig7-figsupp1-data4-v1.zip
-
Figure 7—figure supplement 1—source data 5
PDF containing Figure 7—figure supplement 1C and original scans of the relevant western blot analysis, with cropped areas.
- https://cdn.elifesciences.org/articles/90724/elife-90724-fig7-figsupp1-data5-v1.pdf
Figure 8
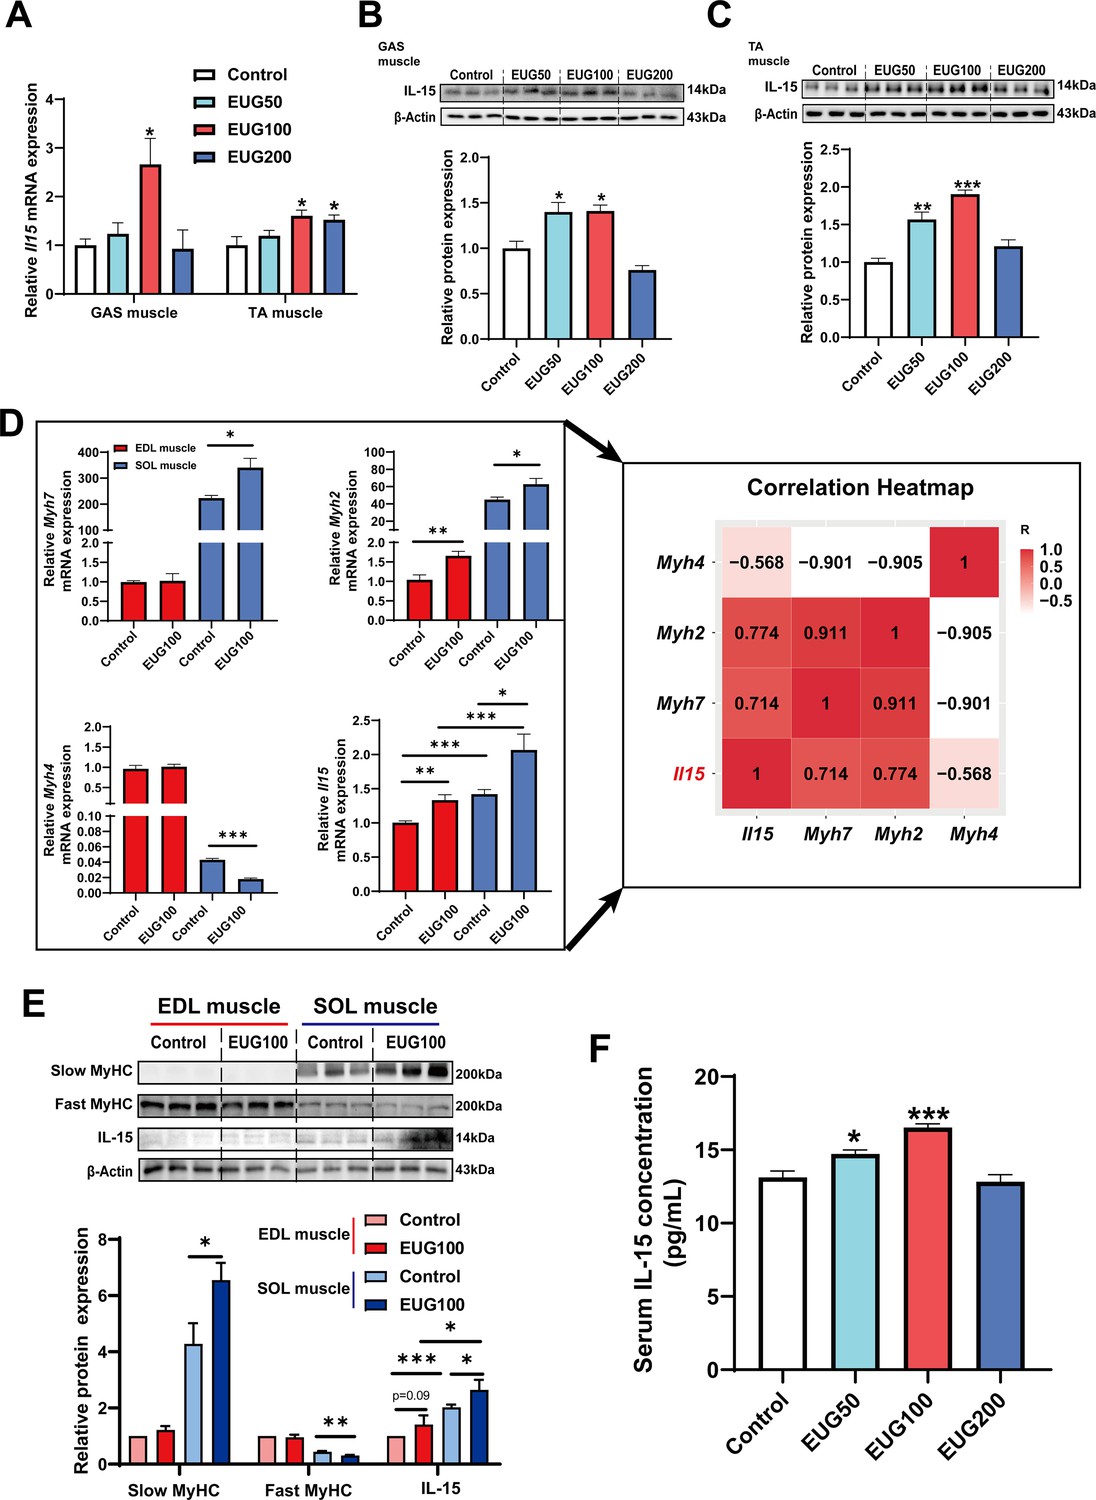
Eugenol promotes the expression and secretion of IL-15 in skeletal muscle of mice.
(A) The IL-15 mRNA expression in gastrocnemius (GAS) and tibialis anterior (TA) muscle. (B, C) The IL-15 protein expression in GAS and TA muscle. (D) Left: The mRNA expression of Myh7, Myh2, Myh4, and Il15 in extensor digitorum longus (EDL) and soleus (SOL) muscle of mice. Right: Correlation analysis of gene expression values performed by linear regression with Pearson’s correlation coefficient (r). Color gradient represents correlation coefficient with darker colors indicating higher positive correlation. (E) The protein expression of slow myosin heavy chain (MyHC), fast MyHC, and IL-15. (F) The concentration of IL-15 in serum. For A and D, N=6 per group. For B and C and E, N=3 per group. For F, N=8 per group. One-way ANOVA test was used to determine statistical significance. *p<0.05, **p<0.01, and ***p<0.001.
-
Figure 8—source data 1
The IL-15 mRNA expression in gastrocnemius (GAS) and tibialis anterior (TA) muscle (Figure 8A).
- https://cdn.elifesciences.org/articles/90724/elife-90724-fig8-data1-v1.xlsx
-
Figure 8—source data 2
Original files for the western blot analysis (Figure 8B).
- https://cdn.elifesciences.org/articles/90724/elife-90724-fig8-data2-v1.zip
-
Figure 8—source data 3
PDF containing Figure 8B and original scans of the relevant western blot analysis, with cropped areas.
- https://cdn.elifesciences.org/articles/90724/elife-90724-fig8-data3-v1.pdf
-
Figure 8—source data 4
Original files for the western blot analysis (Figure 8C).
- https://cdn.elifesciences.org/articles/90724/elife-90724-fig8-data4-v1.zip
-
Figure 8—source data 5
PDF containing Figure 8C and original scans of the relevant western blot analysis, with cropped areas.
- https://cdn.elifesciences.org/articles/90724/elife-90724-fig8-data5-v1.pdf
-
Figure 8—source data 6
The mRNA expression and correlation analysis of gene expression values (Figure 8D).
- https://cdn.elifesciences.org/articles/90724/elife-90724-fig8-data6-v1.xlsx
-
Figure 8—source data 7
Original files for the western blot analysis (Figure 8E).
- https://cdn.elifesciences.org/articles/90724/elife-90724-fig8-data7-v1.zip
-
Figure 8—source data 8
PDF containing Figure 8E and original scans of the relevant western blot analysis, with cropped areas.
- https://cdn.elifesciences.org/articles/90724/elife-90724-fig8-data8-v1.pdf
-
Figure 8—source data 9
The concentration of IL-15 in serum (Figure 8F).
- https://cdn.elifesciences.org/articles/90724/elife-90724-fig8-data9-v1.xlsx
Figure 9 with 1 supplement
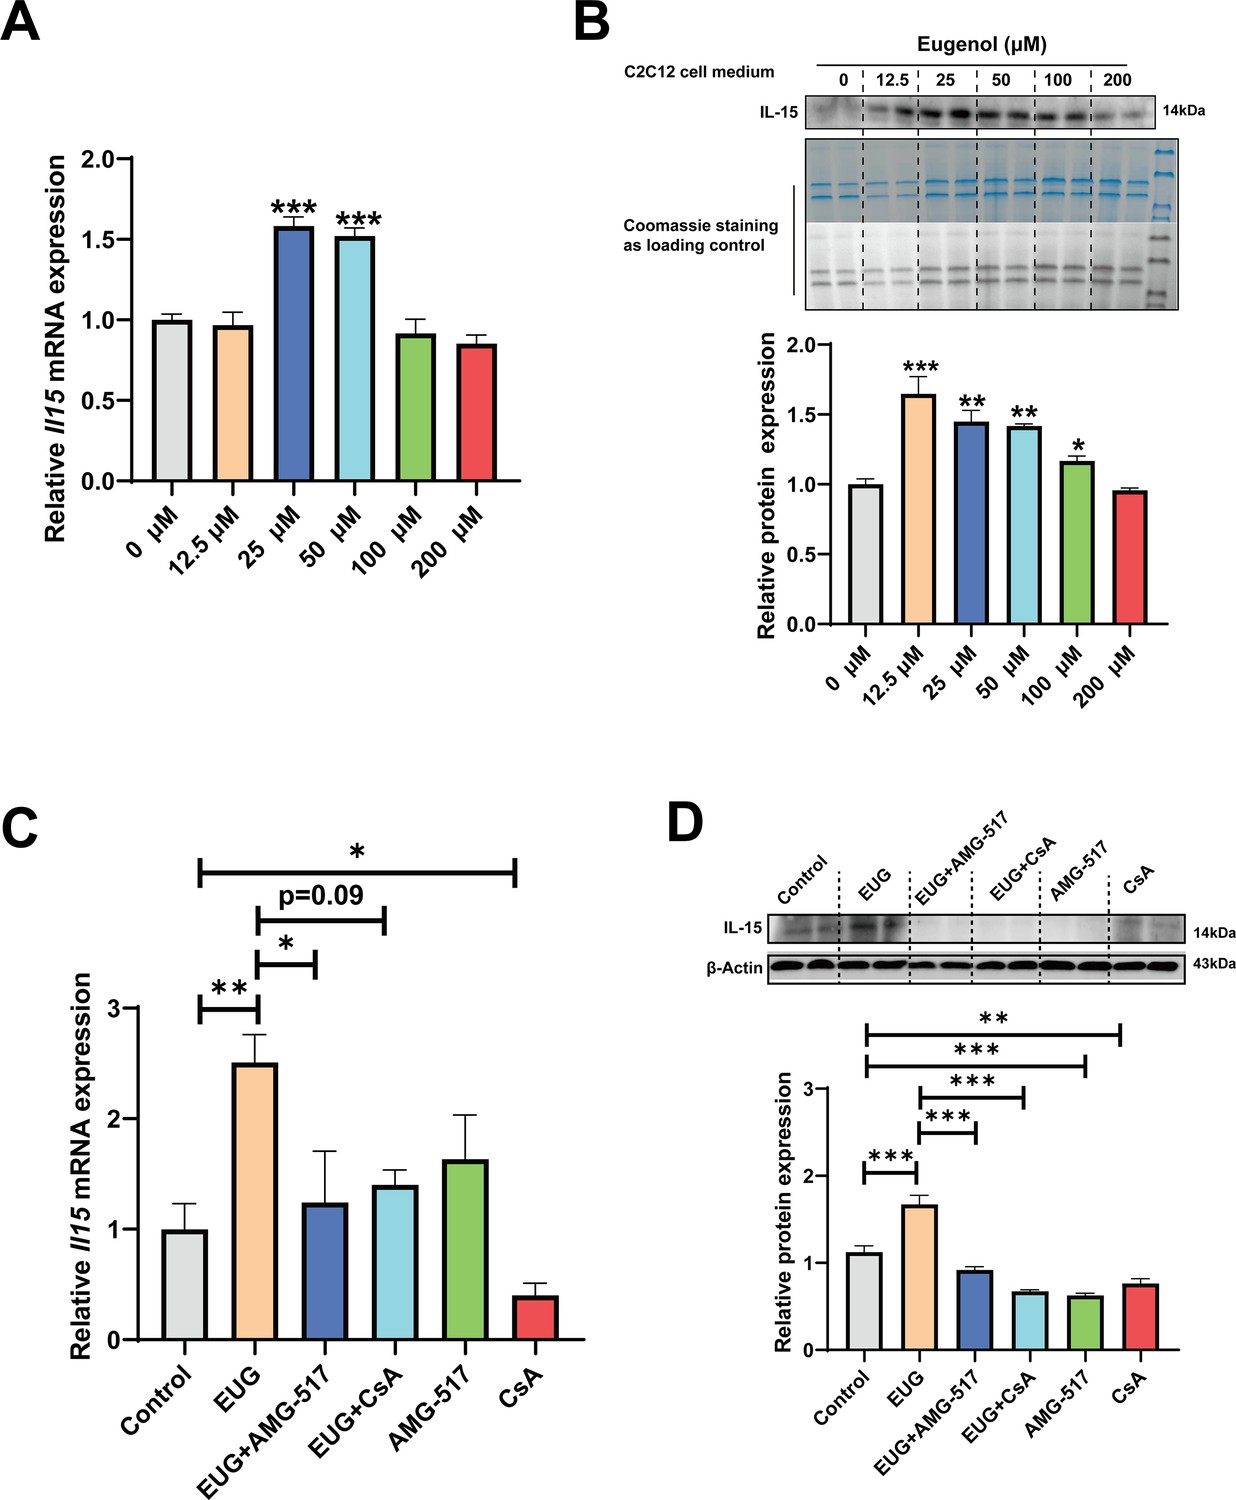
Eugenol promotes IL-15 level through TRPV1-mediated CaN/NFATc1 signaling pathway.
C2C12 myotubes were treated by 0–200 eugenol for 1 day after 4 days of differentiation. (A) The effect of eugenol on Il15 mRNA expression in C2C12 myotubes. (B) The effect of eugenol on IL-15 protein expression in the C2C12 cell medium. Coomassie staining as loading control. (C, D) C2C12 myotubes were treated by 25 μM eugenol and 1 μM TRPV1 inhibitor AMG-517 or 0.5 μM calcineurin (CaN) inhibitor cyclosporine A (CsA) for 1 day after 4 days of differentiation. The mRNA and protein expression of IL-15. N=4 per group. One-way ANOVA test was used to determine statistical significance. *p<0.05, **p<0.01, and ***p<0.001.
-
Figure 9—source data 1
IL-15 mRNA expression in C2C12 myotubes (Figure 9A).
- https://cdn.elifesciences.org/articles/90724/elife-90724-fig9-data1-v1.xlsx
-
Figure 9—source data 2
Original files for the western blot analysis (Figure 9B).
- https://cdn.elifesciences.org/articles/90724/elife-90724-fig9-data2-v1.zip
-
Figure 9—source data 3
PDF containing Figure 9B and original scans of the relevant western blot analysis, with cropped areas.
- https://cdn.elifesciences.org/articles/90724/elife-90724-fig9-data3-v1.pdf
-
Figure 9—source data 4
IL-15 mRNA expression in C2C12 myotubes (Figure 9C).
- https://cdn.elifesciences.org/articles/90724/elife-90724-fig9-data4-v1.xlsx
-
Figure 9—source data 5
Original files for the western blot analysis (Figure 9D).
- https://cdn.elifesciences.org/articles/90724/elife-90724-fig9-data5-v1.pdf
-
Figure 9—source data 6
PDF containing Figure 9D and original scans of the relevant western blot analysis, with cropped areas.
- https://cdn.elifesciences.org/articles/90724/elife-90724-fig9-data6-v1.zip
Figure 9—figure supplement 1
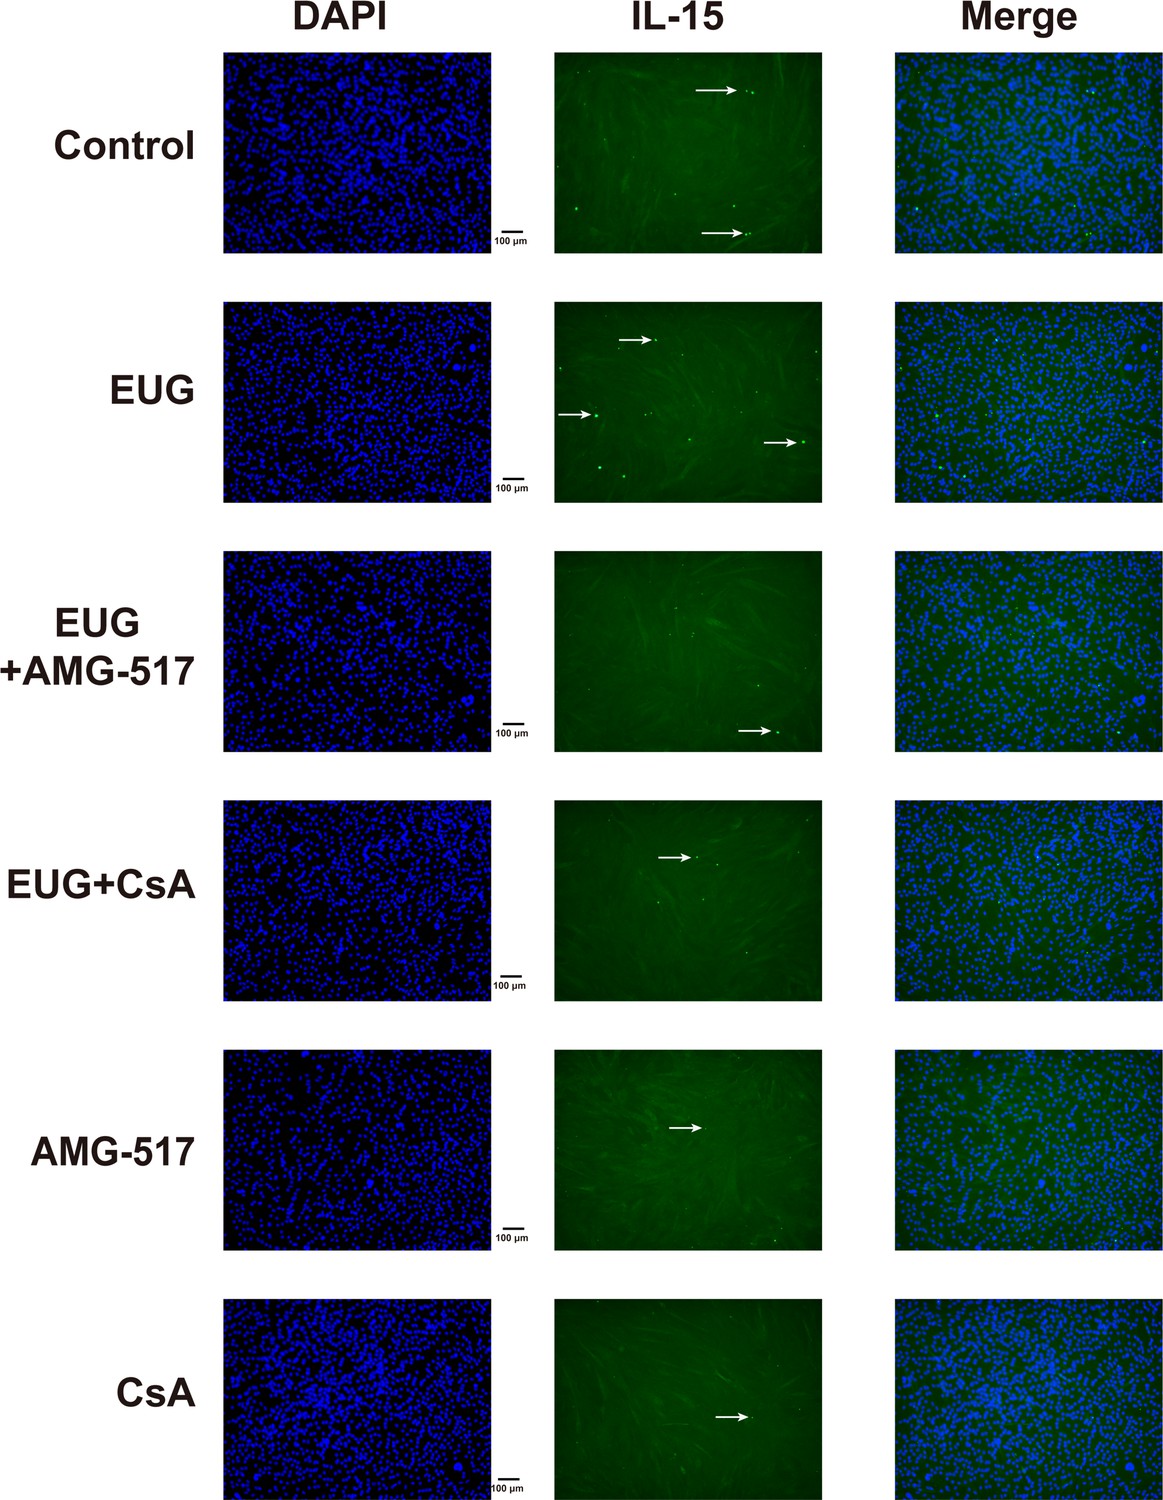
Representative immunofluorescence images of IL-15.
IL-15 (green fluorescence) and 4,6-diamidino-2-phenylindole (DAPI) (blue fluorescence). Magnification: ×200.
Author response image 1
Green: Slow MyHC; Red: Fast MyHC.
Author response image 2
Author response image 3
Tables
Table 1
Myokines to be tested in our study.
| Myokines | References | |
|---|---|---|
| Myokines that improve metabolic homeostasis | CX3CL1, FGF21, FNDC5, IL-6, IL-8, IL-15 | Whitham and Febbraio, 2016 |
| Metrnl, FGF21, FNDC5, Myonectin (Erfe) | Eckel, 2019 | |
| Myokines that improve endurance capacity and promote fast-to-slow muscle fiber transformation | FNDC5 | Men et al., 2021 |
| IL-13 | Knudsen et al., 2020 | |
| IL-15 | Quinn et al., 2013 | |
| Neurturin (Nrtn) | Correia et al., 2021 |
Author response table 1
| Lane1 | Lane2 | Lane3 | Lane4 | Lane5 | Lane6 | |
|---|---|---|---|---|---|---|
| beta-Actin | 1.000 | 0.853 | 0.821 | 0.859 | 0.816 | 0.812 |
| Complex I | 1.000 | 0.739 | 0.867 | 0.917 | 1.034 | 1.150 |
| Complex V | 1.000 | 0.879 | 0.856 | 0.949 | 0.947 | 0.985 |
| Complex I/ beta-Actin | 1.000 | 0.867 | 1.056 | 1.068 | 1.268 | 1.415 |
| Complex V/ beta-Actin | 1.000 | 1.031 | 1.043 | 1.105 | 1.161 | 1.213 |
Author response table 2
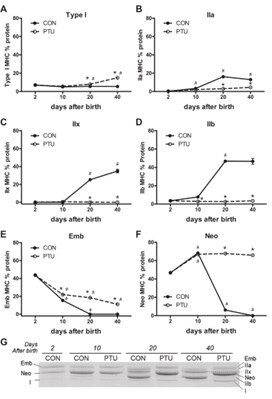
Developmental change of proportions of muscle fiber types in Longissimus dorsi muscle determined by histochemical analysis for myosin adenosine triphosphatase activity (%).
Least squares means and pooled standard errors (n = 3). MHC, myosin heavy chain; ND, not detected. *p<0.10, **p<0.01 Least square means followed by different letters on the same row are significantly different (p<0.05).
| d 1 | d 12 | d 26 | d 45 | d 75 | Pooled SE | ||
|---|---|---|---|---|---|---|---|
| MHC 1 | 7.2 | 8.2 | 12.1 | 14.8 | 11.2 | 1.8 | * |
| MHC 2 a | 92.8a | 23.2b | 18.6b | 4.1c | 3.1c | 4.3 | ** |
| MHC 2 x or 2b | ND | 68.6b | 69.3b | 81.1ab | 85.7a | 4.8 | ** |
Additional files
-
MDAR checklist
- https://cdn.elifesciences.org/articles/90724/elife-90724-mdarchecklist1-v1.docx
-
Supplementary file 1
The primer sequences used in the study.
- https://cdn.elifesciences.org/articles/90724/elife-90724-supp1-v1.docx
Download links
A two-part list of links to download the article, or parts of the article, in various formats.
Downloads (link to download the article as PDF)
Open citations (links to open the citations from this article in various online reference manager services)
Cite this article (links to download the citations from this article in formats compatible with various reference manager tools)
Eugenol mimics exercise to promote skeletal muscle fiber remodeling and myokine IL-15 expression by activating TRPV1 channel
eLife 12:RP90724.
https://doi.org/10.7554/eLife.90724.3


