Engineering multifunctional rhizosphere probiotics using consortia of Bacillus amyloliquefaciens transposon insertion mutants
- Key Lab of Organic-based Fertilizers of China and Jiangsu Provincial Key Lab for Solid Organic Waste Utilization, Nanjing Agricultural University, China
- College of Life Science, Nanjing Agricultural University, China
- Department of Microbiology, University of Helsinki, Finland
Figures
Figure 1 with 4 supplements
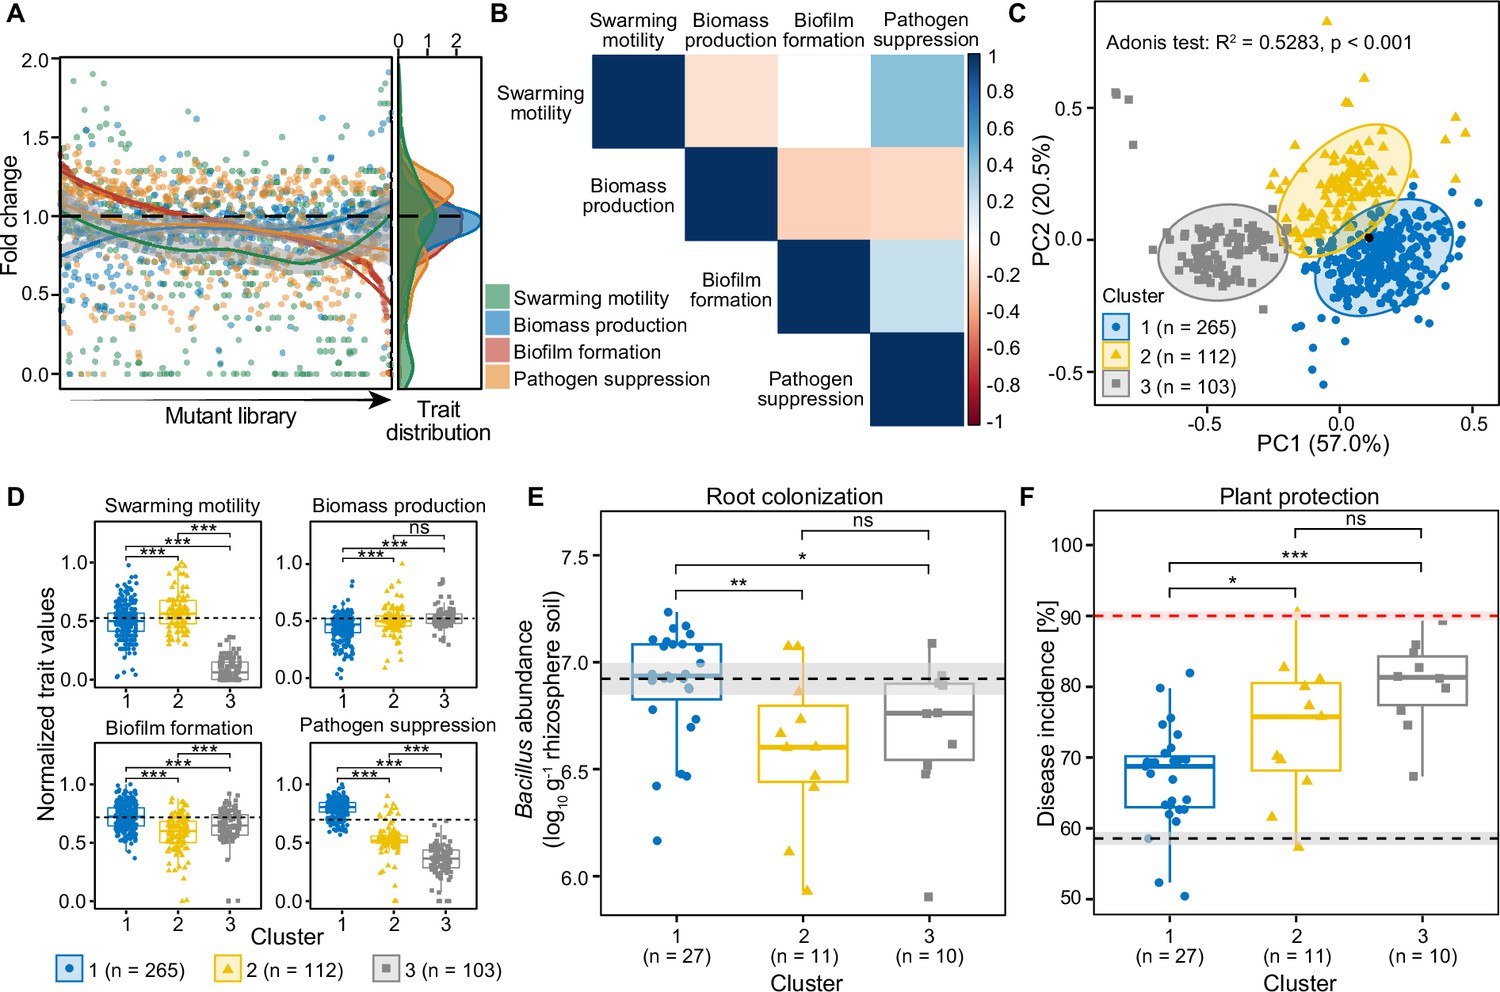
The effects of transposon insertions on the traits of 479 B. amyloliquefaciens T-5 mutants measured in vitro and in vivo.
(A) shows distribution of fold changes regarding mutants’ swarming motility, biomass production, biofilm formation, and pathogen suppression relative to the wild-type strain (black dashed line equaling 1). (B) displays pairwise covariance matrix between individual traits, where red cells indicate negative trait correlations (trade-offs) and blue cells positive traits correlations; white cells indicate no correlation between the given traits. (C) shows principal coordinates analysis showing the clustering of all mutants and the wild-type (black point). Mutants were assigned to different clusters based on K-means algorithm of four measured traits. (D) shows mean trait differences between clusters based on unpaired two-samples Wilcoxon test. The wild-type was assigned in the cluster 1 based on K-means clustering and its trait values are shown as dashed black lines. (E) displays root colonization of representative 47 B. amyloliquefaciens mutants from clusters 1–3 relative to the wild-type strain (black dashed line) based on cell densities in the root system 30 days post pathogen inoculation (dpi). (F) shows plant protection of representative 47 B. amyloliquefaciens mutants from clusters 1–3 relative to the wild-type strain (black dashed line), and negative ‘pathogen-only’ control (red dashed line), quantified as bacterial wilt disease incidence 30 dpi. Shaded areas in (E and F) represent the mean ± SEM. Since (D) displays the normalized trait values, variation for the wild-type strain is not shown. Pairwise differences in (D–F) were analyzed using unpaired two-samples Wilcoxon test: *** denotes for statistical significance at p<0.001; ** denotes for statistical significance at p<0.01; * denotes for statistical significance at p<0.05; ns denote for no significance.
Figure 1—figure supplement 1

The effects of transposon insertions on the traits of 1999 mutants included in the original library measured in vitro.
(A) shows the distribution of fold changes regarding mutants’ swarming motility, biomass production, biofilm formation and pathogen suppression relative to the wild-type strain (dashed black line equaling 1). Of these mutants, around 64.5% showed reduction in swarming motility, 76.2% in biomass production, 84.5% in biofilm formation, and 85.5% in pathogen suppression compared to the wild-type strain. (B) shows pairwise covariance matrix between individual traits, where the red cells indicate negative trait correlations (trade-offs) and the blue cells positive traits correlations; white cells indicate no correlation between given traits.
Figure 1—figure supplement 2

Optimal number of K-means clusters suggested by gap statistic method.
Figure 1—figure supplement 3
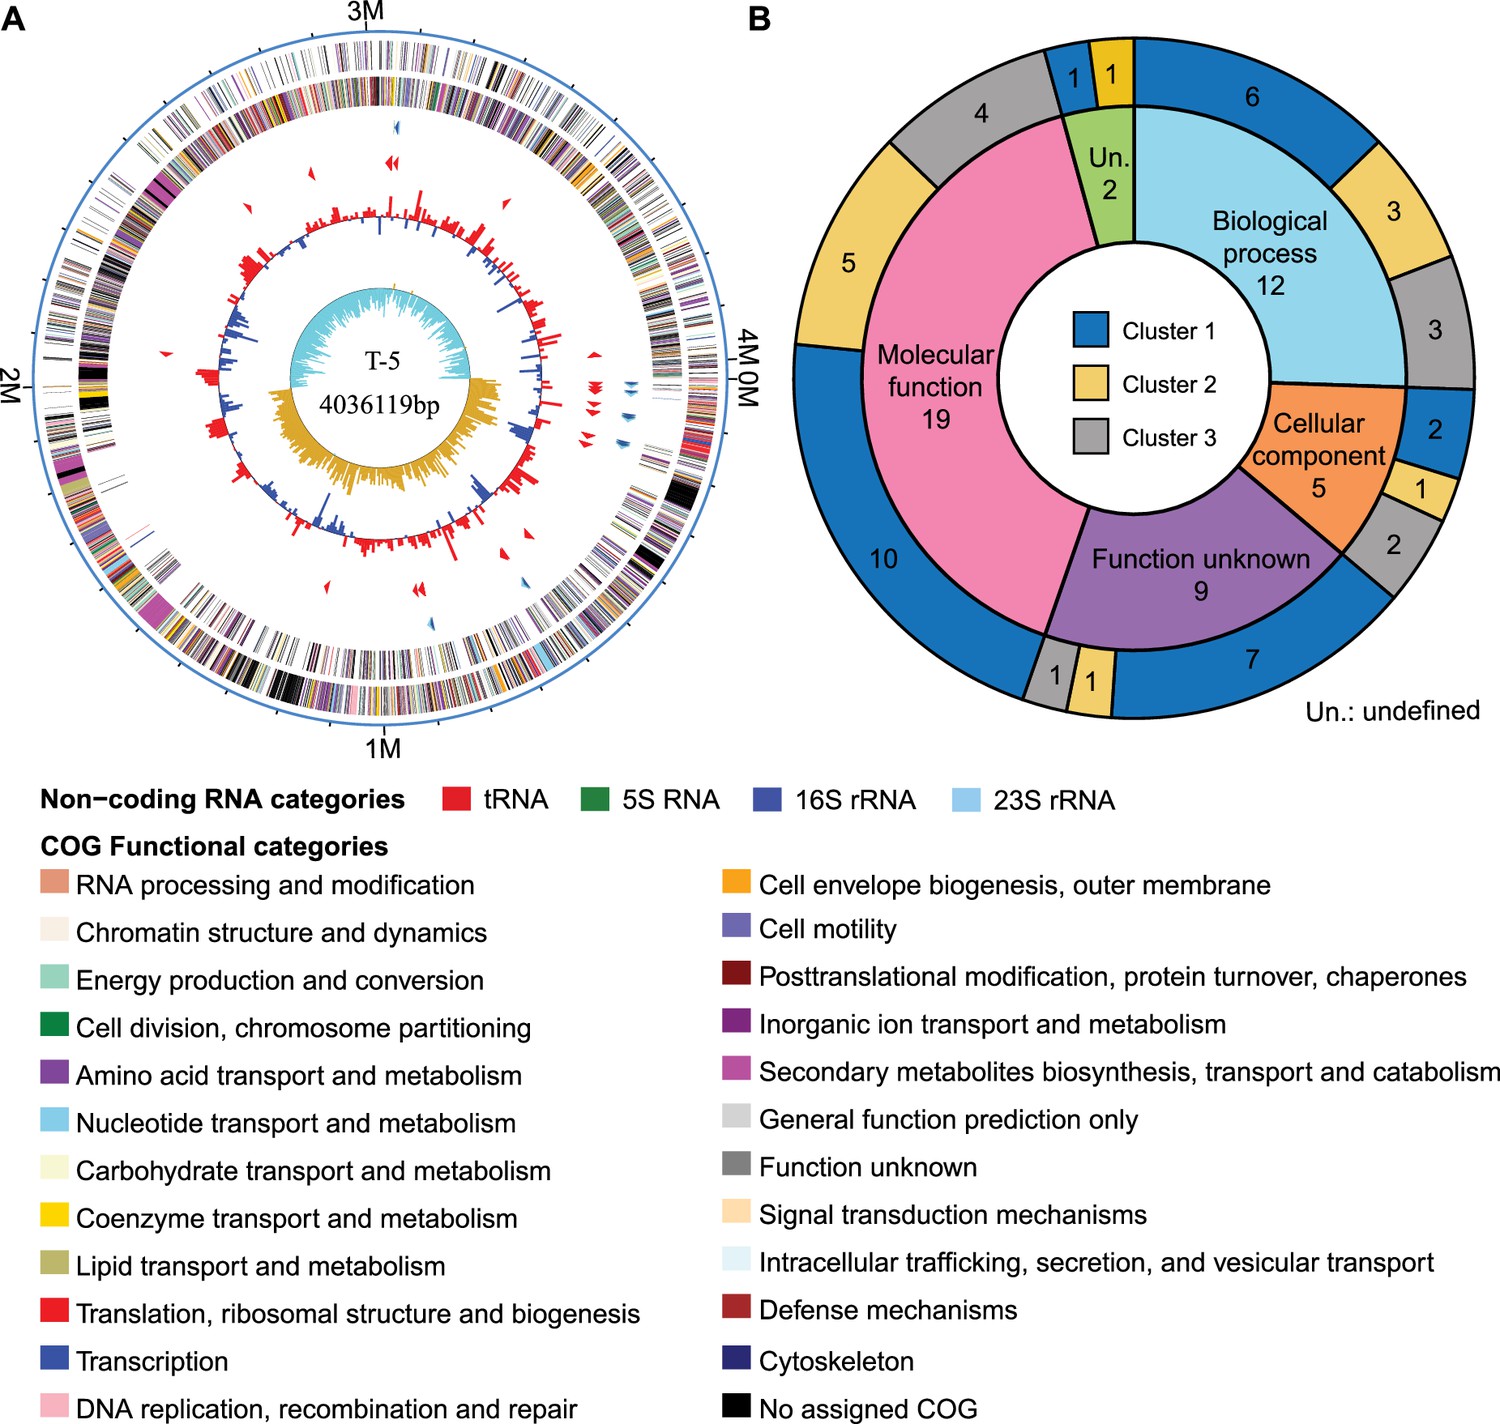
Identification of disrupted genes of 47 transposon insertion mutants based on B. amyloliquefaciens T-5 reference genome.
(A) shows graphical circular map of B. amyloliquefaciens T-5 genome. Moving from the outside to the center, different circles denote for: genes of the forward strand (colored by COG categories), genes of the reverse strand (colored by COG categories), RNA genes (tRNAs green, rRNAs red, other RNAs black), GC content and GC skew. (B) shows the distribution of disrupted gene functions of a subset of 47 mutants based on GO categories and K-means cluster identity (detailed gene sequences of the disrupted genes is provided in Supplementary file 1c).
Figure 1—figure supplement 4

Positive and linear relationships between optical density (OD600 nm) and cell counts (colony forming units [CFUs]) of wild-type (black), M78 (representative mutant with decreased biomass production, red) and M109 (representative mutant with increased biomass production, blue) strains.
Figure 2
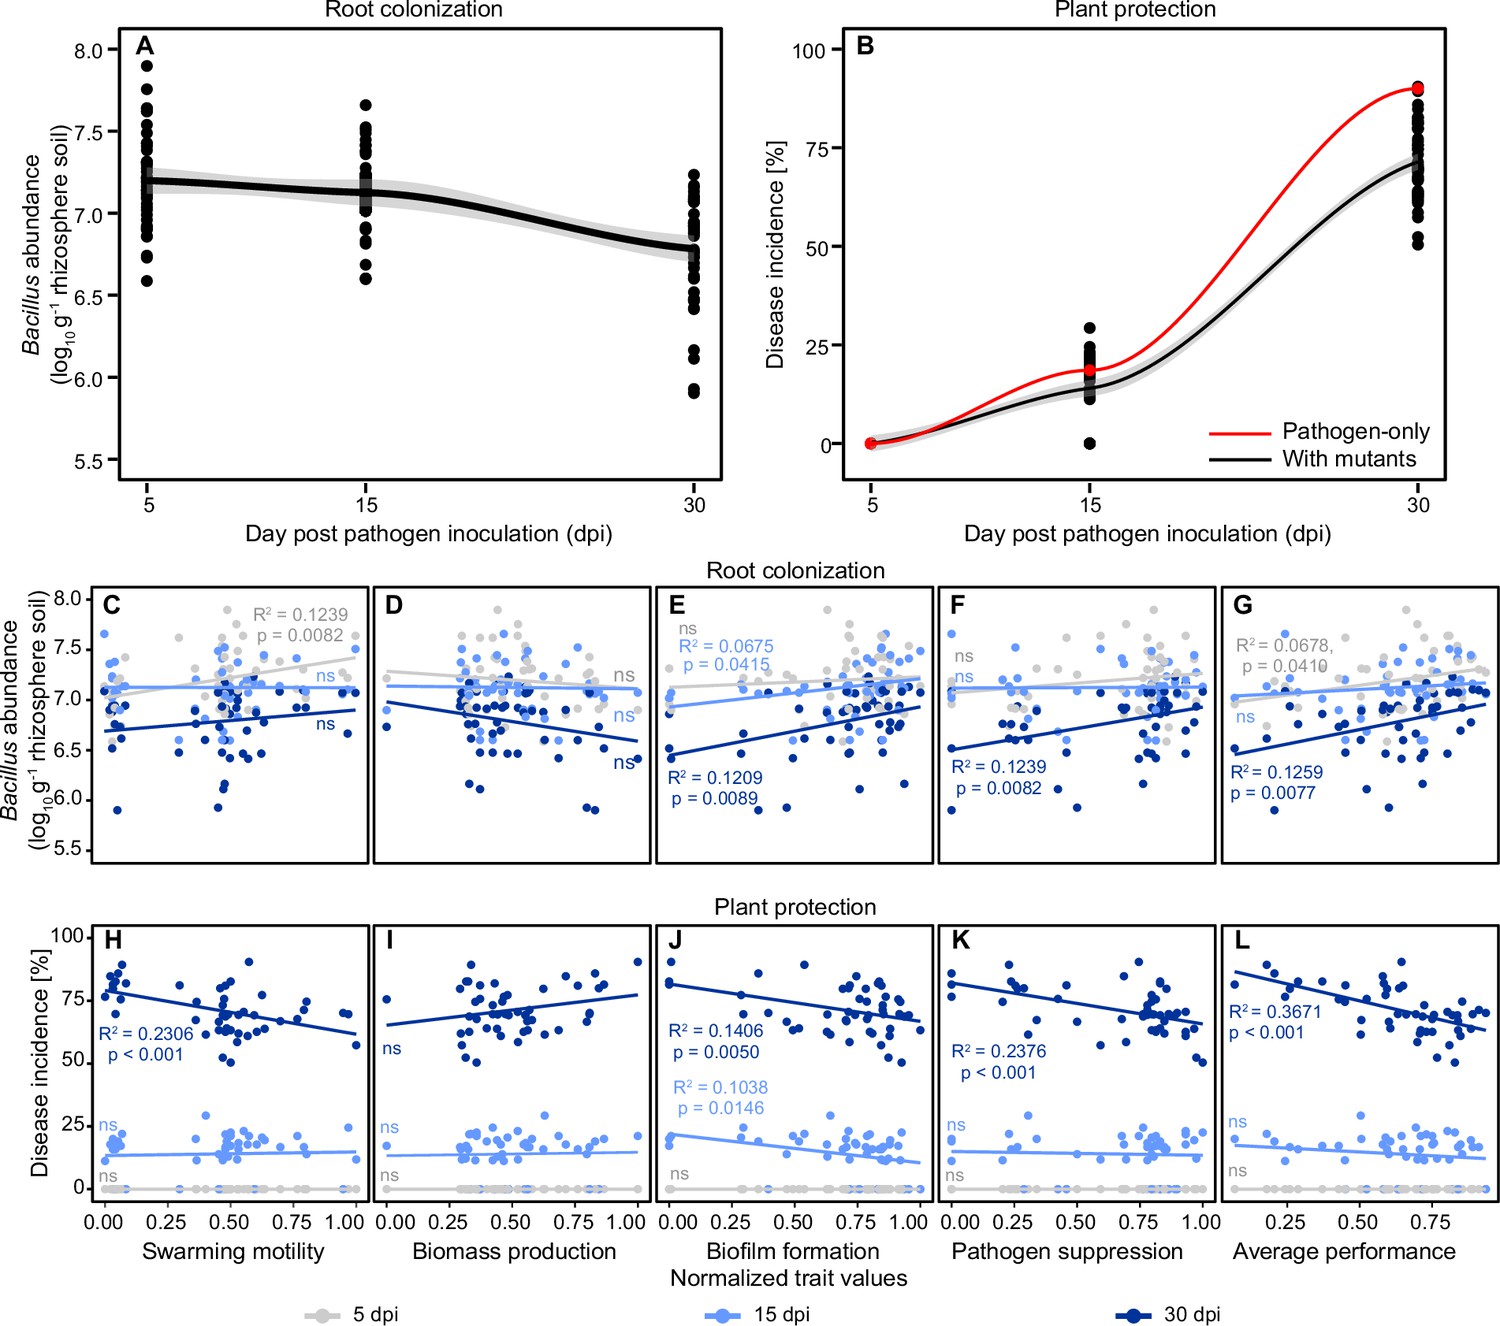
Regression analysis explaining root colonization and plant protection of representative 47 B. amyloliquefaciens mutants based on their trait values measured in vitro at different sampling time points.
(A and B) show the dynamics of root colonization and plant protection, respectively. The red and black lines in (B) show the disease incidence of pathogen-only control and B. amyloliquefaciens mutant treatments, respectively. (C–G) and (H–L) show root colonization and plant protection, respectively, correlated with different traits at 5 days post pathogen inoculation (dpi) (gray), 15 dpi (light blue), and 30 dpi (dark blue) time points. Significant relationships and R-squared values are shown in panels with colors corresponding to the sampling time points (‘ns’ denotes for non-significant relationship).
Figure 3 with 5 supplements
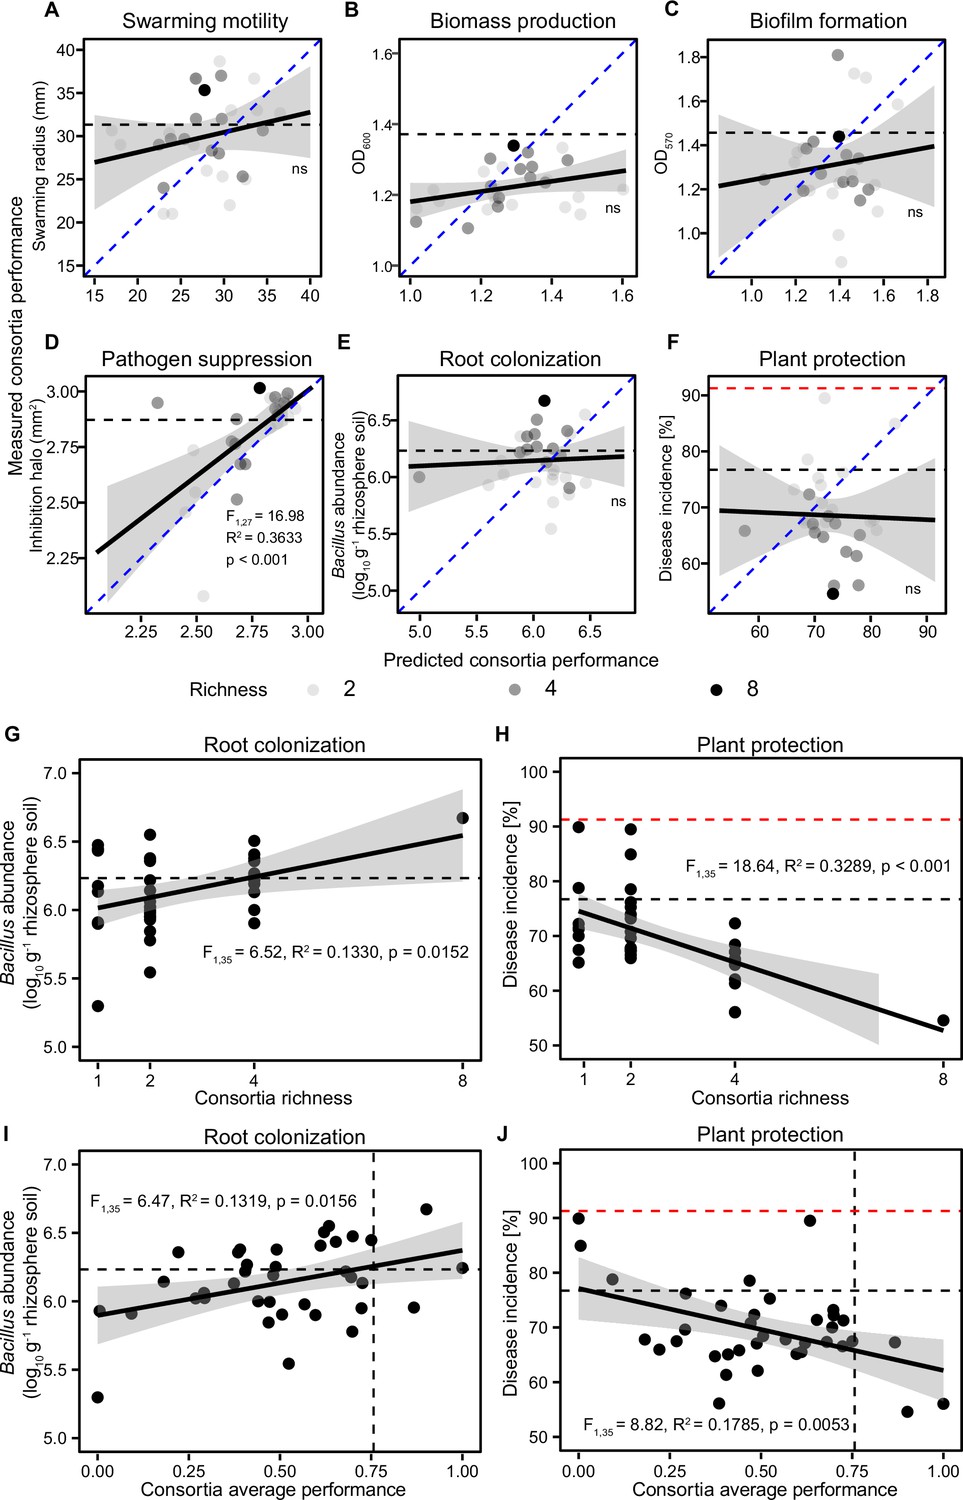
The relationships between predicted and observed consortia performance measured in vitro and correlations between plant performance, consortia richness, and consortia average performance measured in vivo.
(A–F) show correlations between predicted and observed consortia performance regarding swarming motility, biomass production, biofilm formation, pathogen suppression, root colonization, and plant protection, respectively (blue dashed lines show 1:1 theoretical fit and solid black lines show the fitted regression between predicted and observed values). (G and H) show regression models where root colonization and plant protection were explained by B. amyloliquefaciens consortia richness, respectively. (I and J) show regression models where root colonization and plant protection were explained by B. amyloliquefaciens consortia average performance measured in vitro, respectively. In all panels, the black dashed lines show the performance of the wild-type strain, while red dashed lines in (F, H, and J) show the disease incidence of pathogen-only control treatment. In all panels, shaded areas show the confidence interval around the mean.
Figure 3—figure supplement 1
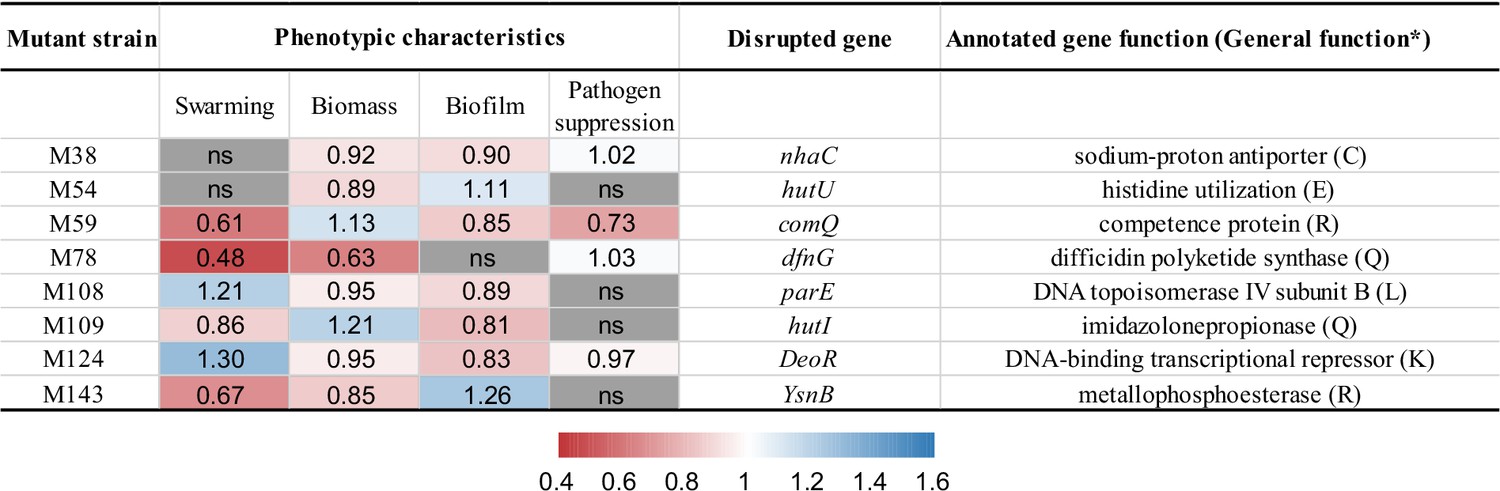
Phenotypic characteristics of the eight B. amyloliquefaciens mutants used for assembly of consortia richness gradient.
Blue, red, and gray cells denote for normalized trait values of mutants that showed increase, decrease, or no change (ns) relative to the wild-type strain (Student’s t-test at p<0.05; see details in Supplementary file 2c). The rightmost column (*) shows the functional categories (based on clusters of orthologous genes; COG) of different genes in parentheses, where capital letters denote for: C: energy production and conversion; E: amino acid transport and metabolism; R: general function prediction only; Q: secondary metabolites biosynthesis, transport, and catabolism; L: replication, recombination, and repair; K: transcription.
Figure 3—figure supplement 2

Pairwise interactions between eight mutants used in diversity-ecosystem functioning experiment based on supernatant culture assays (A) and agar overlay spot assays (B).
In (A), Y-axis denotes the growth of different mutants on their own (diagonal) and other mutants’ supernatant (mutants on X-axis) relative to growth in the fresh 50% LB; the magnitude is shown as color gradient from red (negative effects) to blue (positive effects). In (B), no inhibition halos were found when mutants were spotted on top of each soft agar overlays.
Figure 3—figure supplement 3

The performance of single mutants and mutant consortia relative to wild-type strain regarding four traits measured in vitro and root colonization and plant protection measured in vivo.
Panels show: (A) swarming motility, (B) biomass production, (C) biofilm formation, (D) pathogen suppression, (E) root colonization, and (F) plant protection. In (A–F), the black vertical dashed lines represent the performance of the wild-type strain, while the vertical red line in (F) represents pathogen-only control treatment; shaded areas represent the mean ± SEM; consortia richness gradient is shown on a grayscale as symbol colors from light to dark (low to high richness). Mean differences between consortia and the wild-type strain were analyzed using Student’s t-test (n=3): *** denotes for statistical significance at p<0.001; ** denotes for statistical significance at p<0.01; * denotes for statistical significance at p<0.05. Left panel key shows the ‘trait specialism’ of eight mutants (colored circles) and the composition of each consortium; consortia richness increases when moving from top to bottom.
Figure 3—figure supplement 4
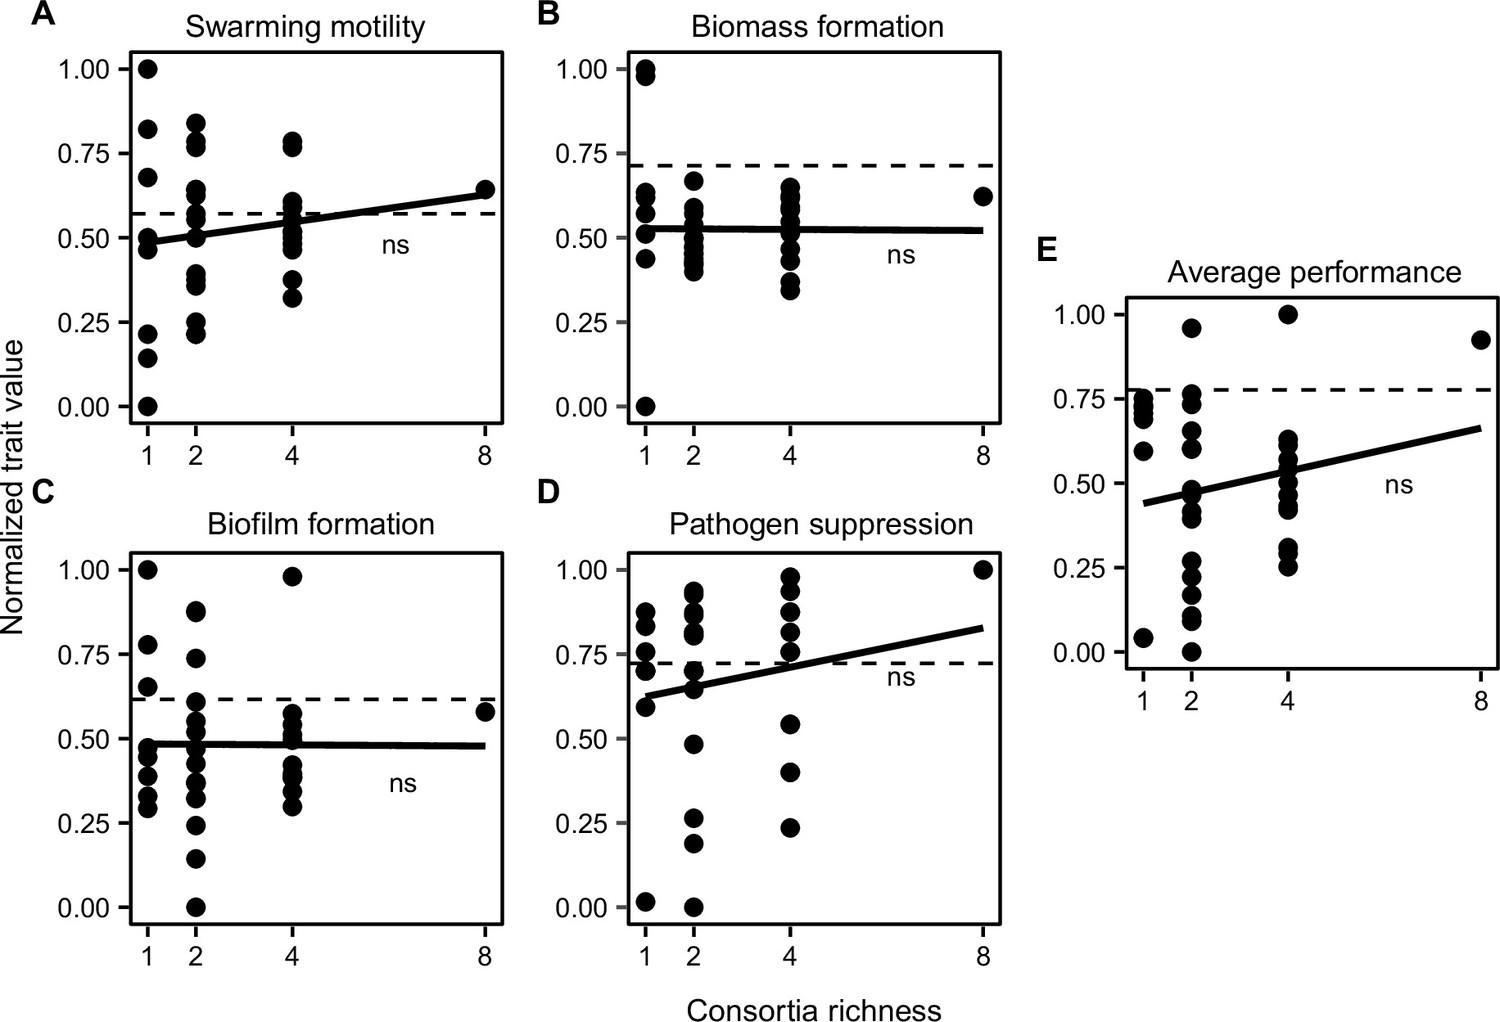
The relationship between B. amyloliquefaciens mutant consortia richness and measured consortia trait performance in vitro.
The panels denote for swarming motility (A), biomass production (B), biofilm formation (C), and pathogen suppression (D), and consortia average performance (E; mean of all traits). In all panels, Y-axis show the normalized trait values, the black dashed line represents the performance of the wild-type strain, and solid black line shows the fitted regression; ns denotes for non-significant relationship.
Figure 3—figure supplement 5
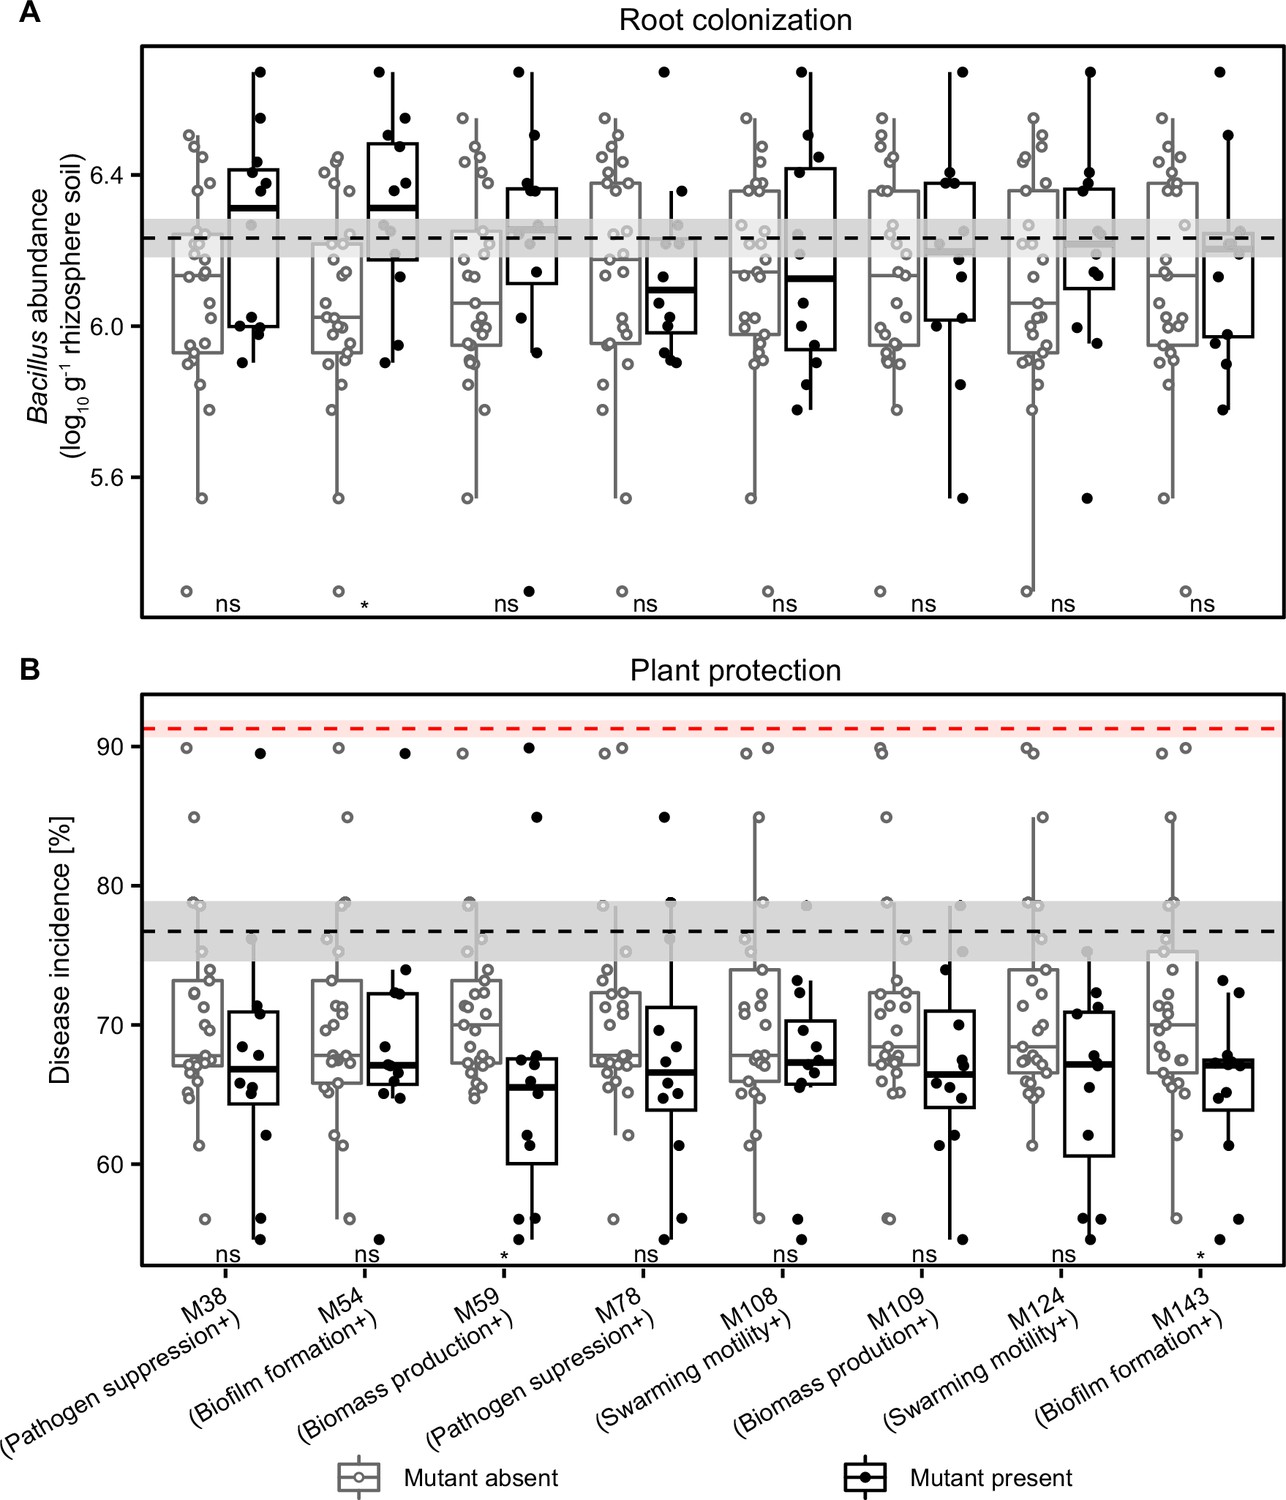
Analysis of mutant identity effects on consortia performance in vivo.
The mutant identity effects were analyzed comparing consortia root colonization (A) and plant protection (B) in the absence (n=25) and presence (n=12) of each mutant. In both panels, the black dashed lines represent the performance of the wild-type strain, while red dashed line in (B) represents disease incidence in pathogen-only control treatment. Shaded areas represent the mean ± SEM. The mutants’ ‘trait specialism’ is shown in parentheses on X-axis. Differences were analyzed using unpaired two-sample Wilcoxon test, where * denotes for statistical significance at p<0.05; ns denotes for no significant (see details in Supplementary file 2e).
Figure 4
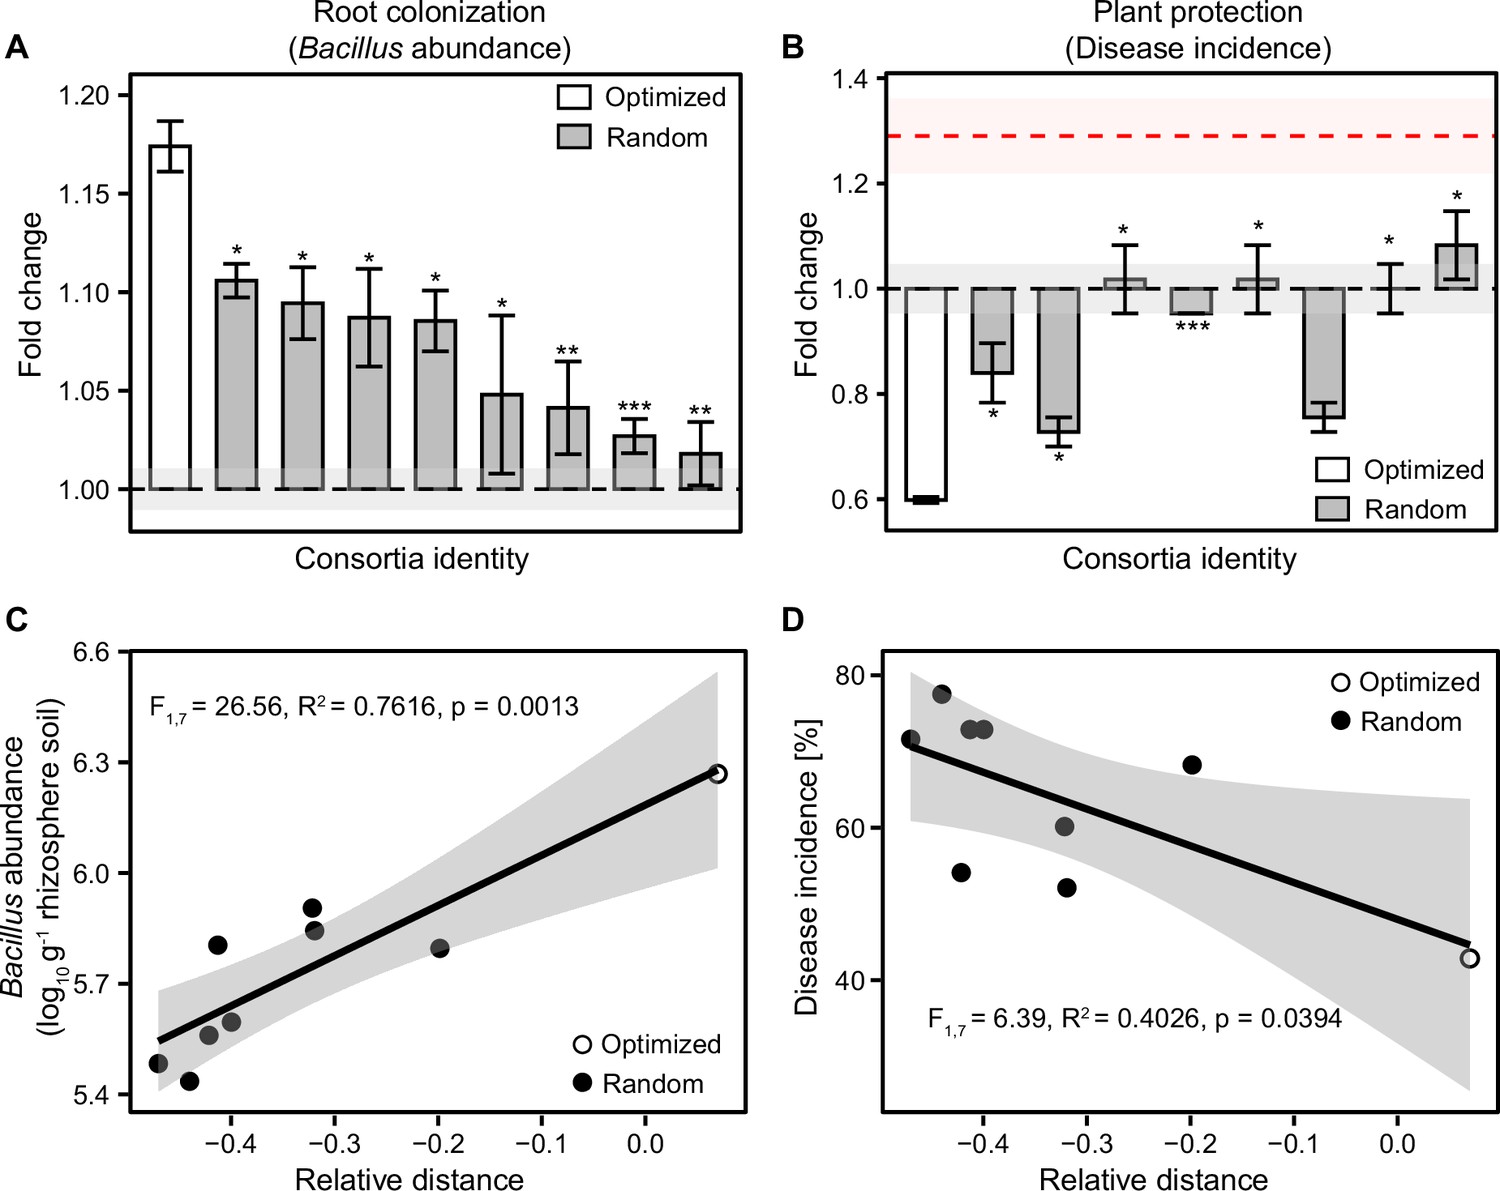
Optimized and randomly assembled 8-mutant consortia show contrasting effects on root colonization and plant protection.
(A–B) compare differences between optimized (white bar) and randomly assembled (gray bars) B. amyloliquefaciens 8-mutant consortia on root colonization and plant performance based on Student’s t-test (n=3): *** denotes for statistical significance at p<0.001; ** denotes for statistical significance at p<0.01; * denotes for statistical significance at p<0.05. In both (A and B), Y-axes show the consortia performance as a fold change relative to wild-type strain and shaded areas represent the mean ± SEM. (C–D) show positive and negative correlations between consortia relative performance (calculated based on average performance and trait deviance, see Materials and methods) with root colonization (C) and disease incidence (D); optimized and randomly assembled 8-mutant consortia are shown as white and black circles, respectively (shaded area shows the confidence interval around the mean).
Tables
Table 1
Analysis of variance (ANOVA) table summarizing the effects of mutant traits measured in vitro on the root colonization and plant protection.
Separate models were run for each dependent variable at different time points (5, 15, and 30 days post pathogen inoculation [dpi]) and all response variables were treated as continuous variables (bacterial abundances were log-transformed before the analysis). Table data represent only the most parsimonious models based on the Akaike’s information criterion (AIC) where ‘NA’ denotes variables that were not retained in the final models, ‘df’ denotes degrees of freedom, and ‘R2’ denotes total variance explained by regression coefficient of determination. The arrows represent the direction of coefficient values: ↑: coefficient >0; ↓: coefficient <0. Significant effects (p<0.05) are highlighted in bold.
| Day post pathogen inoculation (dpi) | |||||||||
|---|---|---|---|---|---|---|---|---|---|
| 5 dpi | 15 dpi | 30 dpi | |||||||
| Mutant trait | df | F | p | df | F | p | df | F | p |
| Root colonization (Bacillus abundance – log CFU g–1 rhizosphere soil) | |||||||||
| Swarming motility | 1 | 5.32 | 0.0259↑ | 1 | 0.006 | 0.9404↑ | 1 | 0.008 | 0.9302↑ |
| Biomass production | 1 | 0.46 | 0.5032↓ | 1 | 0.58 | 0.4512↑ | 1 | 0.07 | 0.7886↓ |
| Biofilm formation | 1 | 0.69 | 0.4103↑ | 1 | 4.34 | 0.0433↑ | 1 | 5.64 | 0.0220↑ |
| Pathogen suppression | 1 | 2.04 | 0.1609↓ | 1 | 0.006 | 0.9410↓ | 1 | 8.10 | 0.0068↑ |
| No. of residuals | 43 | R2=0.0875 | 43 | R2=0.0193 | 43 | R2=0.1730 | |||
| AIC: 16.18 | AIC: 3.82 | AIC: 25.06 | |||||||
| Plant protection (disease incidence [%]) | |||||||||
| Swarming motility | NA | NA | 1 | 0.34 | 0.5620↑ | 1 | 6.89 | 0.0119↓ | |
| Biomass production | NA | NA | 1 | 0.94 | 0.3369↓ | 1 | 0.23 | 0.6339↑ | |
| Biofilm formation | NA | NA | 1 | 5.71 | 0.0213↓ | 1 | 12.34 | 0.0016↓ | |
| Pathogen suppression | NA | NA | 1 | 0.14 | 0.7090↓ | 1 | 20.90 | <0.001↓ | |
| No. of residuals | NA | 43 | R2=0.0625 | 43 | R2=0.4294 | ||||
| NA | AIC: –101.24 | AIC: –112.38 | |||||||
Additional files
-
Supplementary file 1
Phenotypic trait data and genetic information of used B. amyloliquefaciens T-5 transposon insertion mutants.
(a) The profile of the 1999 mutants and the wild-type T-5. (b) The profile of the 479 mutants and the wild-type T-5. (c) The profile of the selected mutants used in the single mutant greenhouse experiment.
- https://cdn.elifesciences.org/articles/90726/elife-90726-supp1-v2.xlsx
-
Supplementary file 2
Supplementary tables for this paper.
(a) Comparison of in vitro traits between mutants belonging to three clusters using unpaired two-samples Wilcoxon test. Significant effects (p<0.05) are highlighted in bold. (b) Comparison of root colonization and plant protection between mutants belonging to three clusters using unpaired two-samples Wilcoxon test. Significant effects (p<0.05) are highlighted in bold and dpi denotes for days post-pathogen inoculation. (c) Comparison of trait values of eight mutants used for the assembly of consortia richness gradient relative to the wild-type strain based on Student’s t-test. Significant differences are shown in bold and arrows show increase (upward) and decrease (downward) in trait values. (d) p-Values for comparing the biomass production of each mutant strain on its own or other strains’ supernatant compared to fresh 50% LB based on Student’s t-test. Significant differences are shown in bold and arrows show facilitative (upward) and antagonistic (downward) interactions between the mutants. The magnitude of these interactions is shown in Figure 3—figure supplement 1 as a heatmap. (e) Comparison of mutant identity effects on consortia root colonization and plant protection based on the absence and presence of each mutant in consortia. Significant effects (p<0.05) are highlighted in bold based on unpaired two-samples Wilcoxon test. (f) Comparison of the mutant identity effects and consortia richness on root colonization and plant protection. Richness was fitted sequentially after mutant identity effects (presence or absence in consortia). Both response variables were treated as continuous variables and Bacillus abundance data was log-transformed before the analysis. Significant effects (p<0.05) are highlighted in bold. (g) Bacterial strains and plasmid used in this study. (h) Primers used in this study.
- https://cdn.elifesciences.org/articles/90726/elife-90726-supp2-v2.docx
-
MDAR checklist
- https://cdn.elifesciences.org/articles/90726/elife-90726-mdarchecklist1-v2.pdf
-
Source data 1
Source data used in this paper.
- https://cdn.elifesciences.org/articles/90726/elife-90726-data1-v2.xlsx
Download links
A two-part list of links to download the article, or parts of the article, in various formats.
Downloads (link to download the article as PDF)
Open citations (links to open the citations from this article in various online reference manager services)
Cite this article (links to download the citations from this article in formats compatible with various reference manager tools)
Engineering multifunctional rhizosphere probiotics using consortia of Bacillus amyloliquefaciens transposon insertion mutants
eLife 12:e90726.
https://doi.org/10.7554/eLife.90726


