The zinc-finger transcription factor Sfp1 imprints specific classes of mRNAs and links their synthesis to cytoplasmic decay
- Department of Molecular Microbiology, Rappaport Faculty of Medicine, Technion-Israel Institute of Technology, Israel
- Instituto Biotecmed, Facultad de Biológicas, Universitat de València, Spain
- Instituto de Biomedicina de Sevilla, Universidad de Sevilla-CSIC-Hospital Universitario Virgen del Rocío, and Departamento de Genética, Facultad de Biología, Universidad de Sevilla, Spain
- Centre for Engineering Biology, School of Biological Sciences, University of Edinburgh, United Kingdom
Figures
Figure 1 with 1 supplement
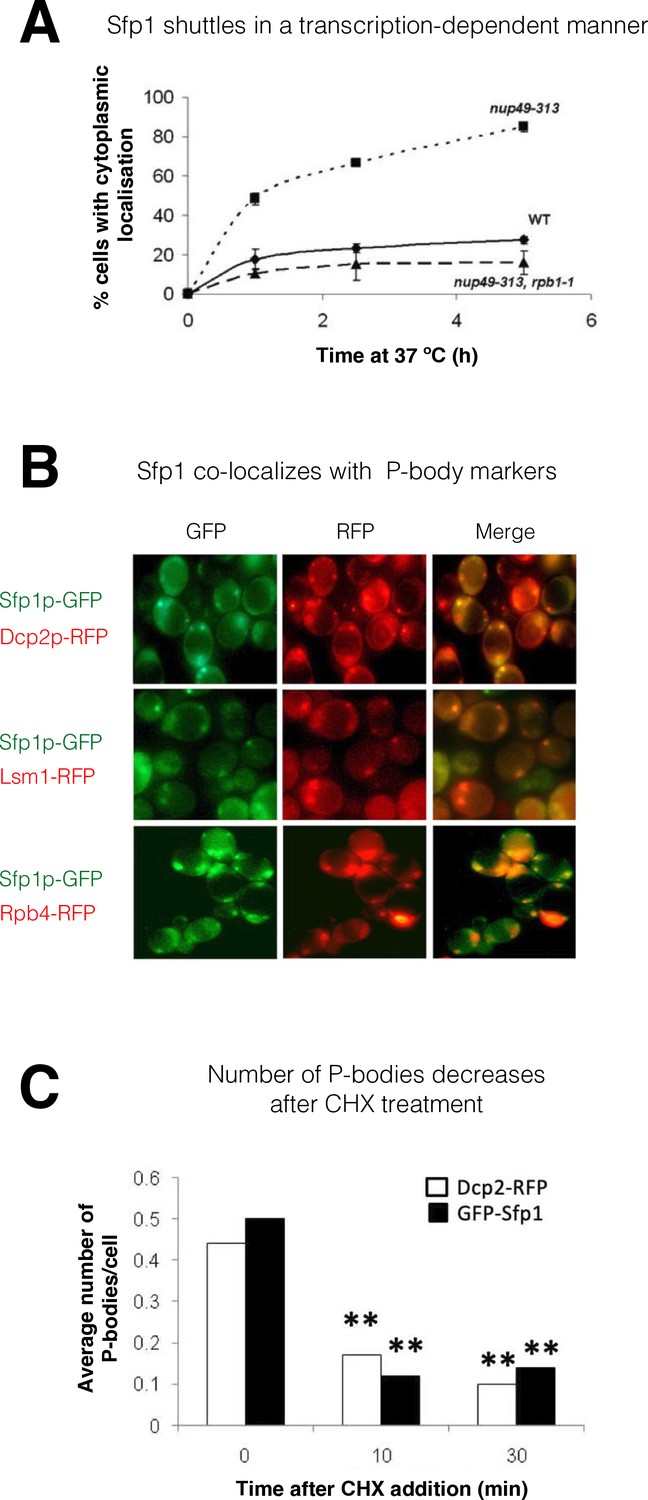
Split-finger protein 1 (Sfp1) shuttles in a transcription-dependent manner and localizes to P-bodies.
(A) Shuttling assay. The assay used the temperature-sensitive (ts) nup49-313 mutant and was performed as reported (Lee et al., 1996; Selitrennik et al., 2006). Wild-type (WT, yMS119), nup49-313(ts) (yMS1), and nup49-313(ts) rpb1-1(ts) cells expressing GFP-Sfp1 were allowed to proliferate under optimal conditions at 24 °C. Cycloheximide (CHX) (50 μg/ml) was then added, and the cultures were shifted to 37 °C (to inhibit Nup49-313 and Rpb1-1). The proportion of cells expressing cytoplasmic GFP-Sfp1 was plotted as a function of time (n>200). Error bars represent the standard deviation of three replicates. (B) GFP-Sfp1 is co-localized with P-bodies markers. Cells expressing the indicated fluorescent proteins were allowed to proliferate till the mid-logarithmic phase, followed by 24- hr starvation in a medium lacking glucose and amino acids. Live cells were inspected under the fluorescent microscope. White arrows mark P-bodies. (C) The number of GFP-Sfp1-containing foci per cell decreases in response to cycloheximide (CHX) treatment. CHX (50 μg/ml) was added to exponentially proliferating cultures for the indicated time. Cells were then shifted to starvation medium as in B; Average of two replicates is shown. Student’s t-test between time 0 and the indicated time points was performed; **p<0.001 (n≥240).
Figure 1—figure supplement 1
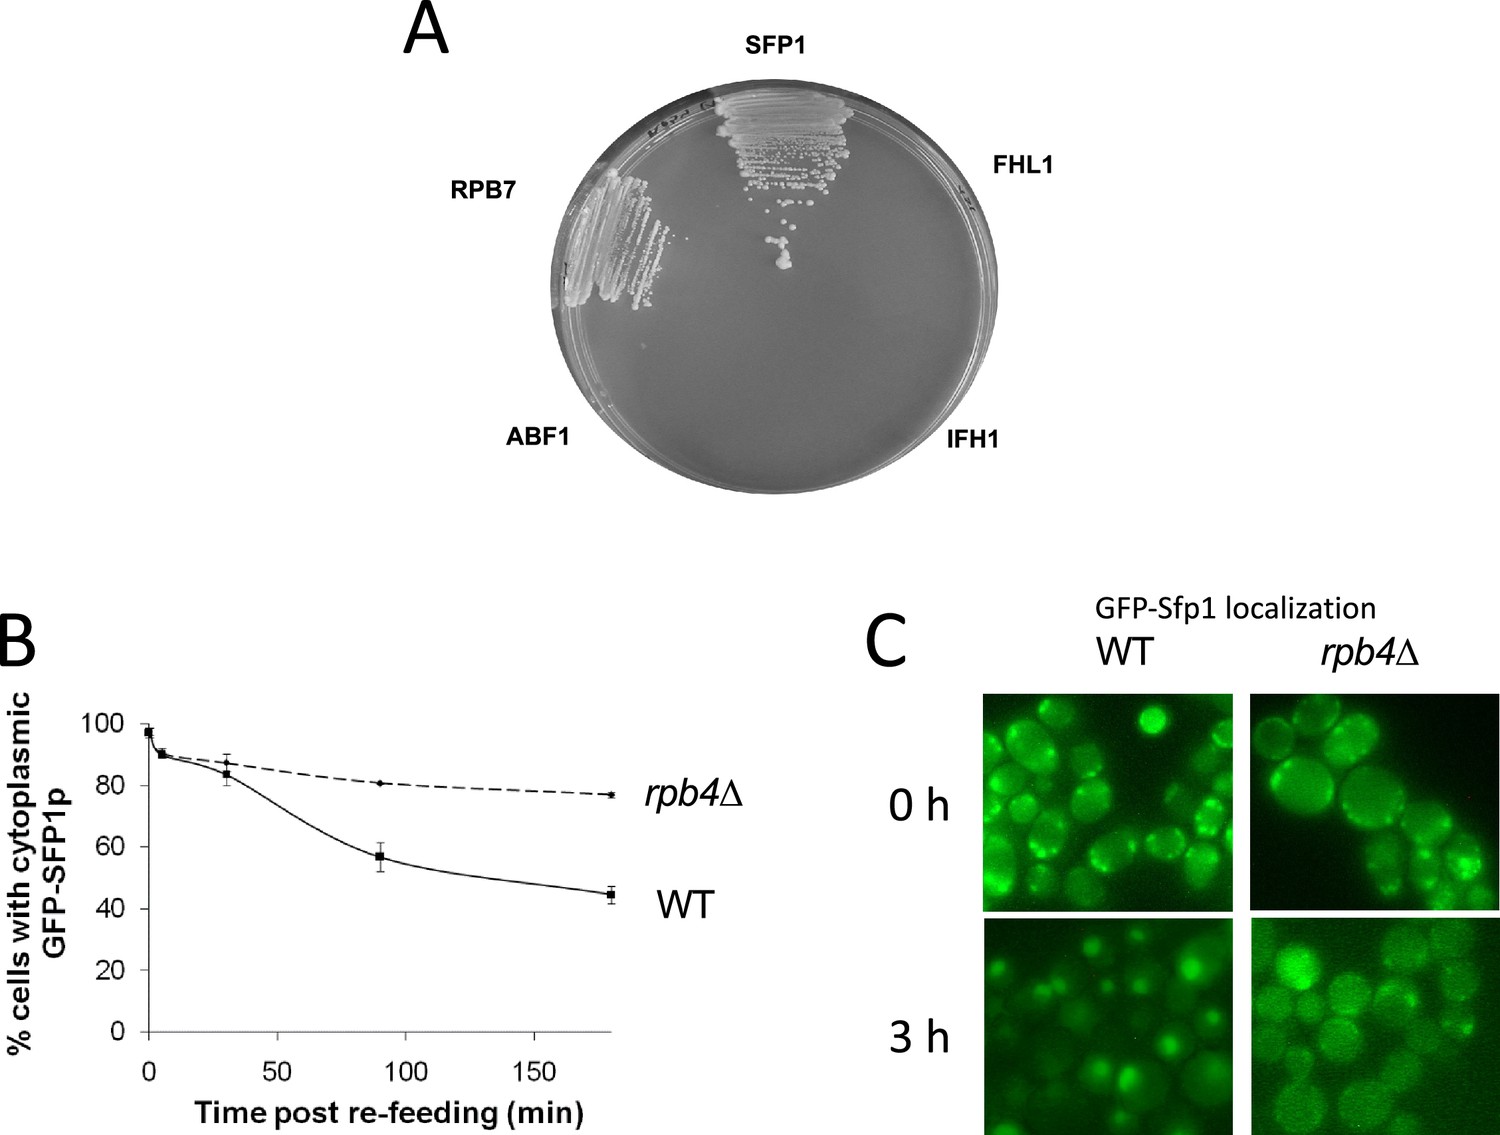
Split-finger protein 1 (Sfp1) binds Rpb4 and its efficient import is dependent on RPB4.
(A) RPB4 forms two hybrid interactions with SFP1, but not with FHL1, IFH1, or ABF1. Two-hybrid interaction, using Rpb4 as the bait and the indicated proteins as the preys, was determined by growth on plates lacking leucine, tryptophan, adenine, and histidine supplemented with 5 mM of 3-amino-1,2,4-triazole (Uetz et al., 2000). We verified that the growth on the indicator plates was dependent on both plasmids by evicting one plasmid at a time from each of the positive clones (results not shown). (B) GFP-Sfp1 shuttles by a transcription-dependent mechanism. Shuttling of GFP-Sfp1 was determined using nup49-313(ts) mutant cells that are defective in protein import at elevated temperatures (Lee et al., 1996). Wild-type (WT, yMS119), nup49-313(ts) (yMS1) and nup49-313 rpb1-1(ts) (yMC4) cells (whose transcription is blocked following a temperature increase to 37 °C) expressing GFP-Sfp1 24 °C. During the mid-log phase, cycloheximide (CHX) (50 μg/ml) was added and the cultures were divided into two samples. One was incubated for at 24 °C and the other at 37 °C. To monitor export kinetics, samples were examined microscopically at the indicated time points, and photographs of random fields were taken. Cells were classified into those exhibiting nuclear or whole-cell (i.e. cytoplasmic) localization of GFP-Sfp1 (n>200). The proportion of cells exhibiting cytoplasmic localization was plotted as a function of time. Bars represent the standard deviation of three replicates. (C) Examples of the results at 0 or 3 hr post re-feeding. Note that, in sated cells, no foci were observed (C).
Figure 2 with 1 supplement
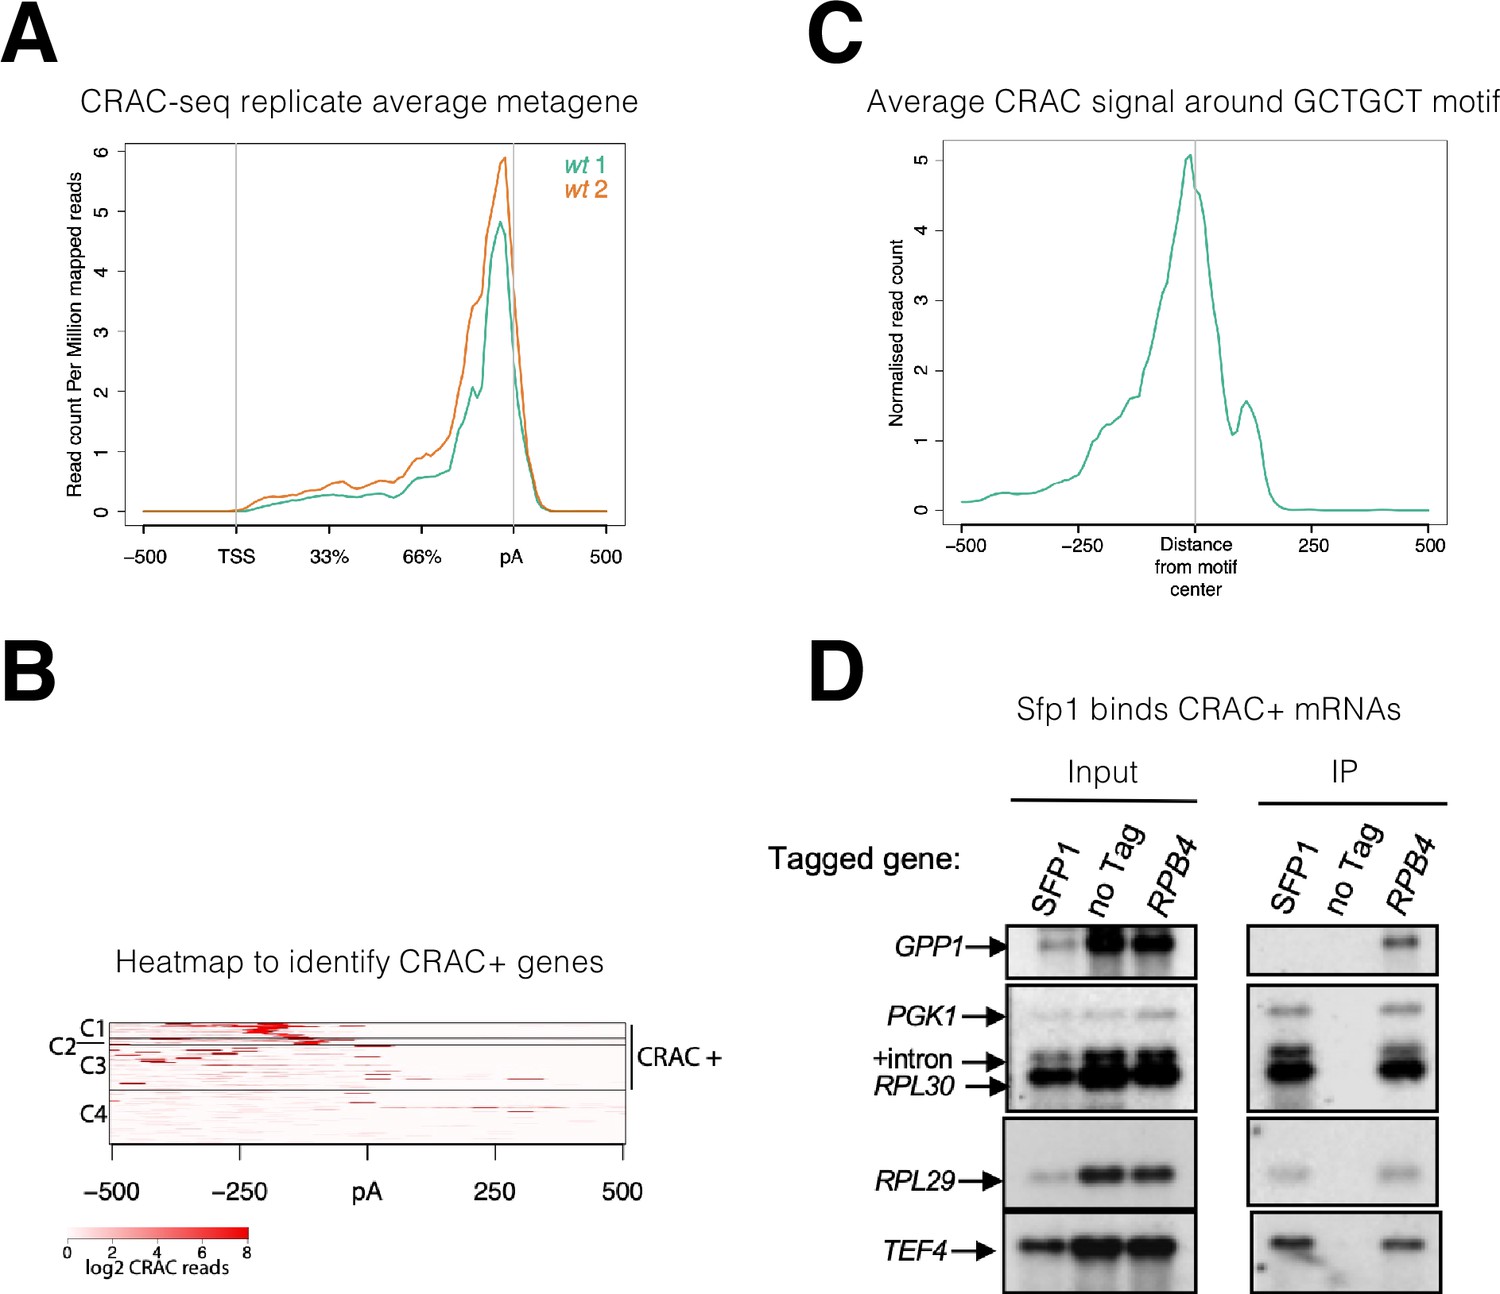
Split-finger protein 1 (Sfp1) binds a group of mRNAs around GCTGCT motif.
(A) Metagene profile of cross-linking and analysis of cDNA (CRAC) analysis in two wild-type replicates. RPKMs plot around the average metagene region of all yeast genes. The 5’UTR and 3’UTR are shown in real scale in base pairs (bp) whereas the transcribed region is shown as a percentage scale to normalize different gene lengths. (B) Heatmap representation of CRAC reads around the polyadenylation site (pA) for the top 600 genes with the highest number of CRAC reads. The genes with high CRAC signal density upstream of the pA site are considered as CRAC+ (n=262), indicated on the right. The chosen cut-off was somewhat arbitrary; additional analyses shown in the subsequent figures indicate that this choice was biologically significant. (C) Average metagene analysis of two replicates of the CRAC + signal in genes containing a GCTGCT motif in a region ±500 bp around the motif. CRAC reads were aligned by the center of the motif. (D) Sfp1 pulls down CRAC + mRNAs. The extracts of isogenic cells, expressing the indicated tandem affinity purification tag (TAP), were subjected to tandem affinity purification (Puig et al., 2001), in the presence of RNase inhibitors. The RNA was extracted and was analyzed by Northern blot hybridization, using the probes indicated on the left. Note that the ‘SFP1’ lane in the input panel was underloaded. ‘+intron’ denotes the position of intron-containing RPL30 RNA.
Figure 2—figure supplement 1
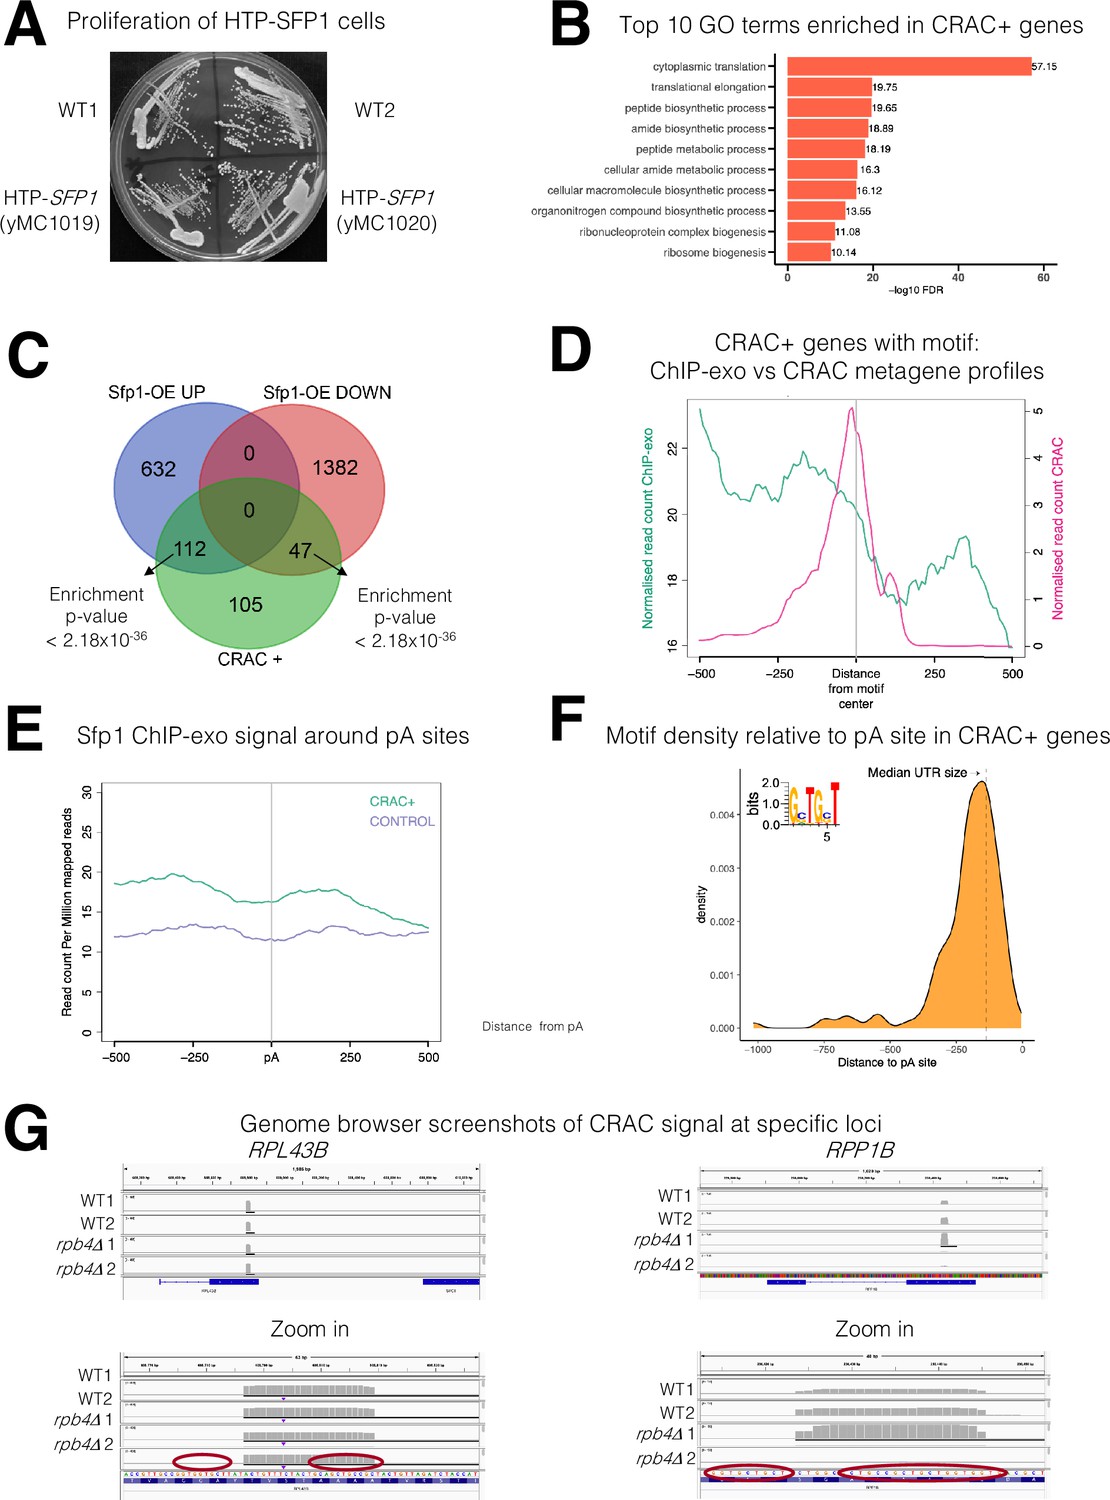
Various features of Sfp1-RNA interaction.
(A) His6-TEV-Protein A (HTP)-tagging does not affect yeast strain growth. HTP-tagged strains were streaked on the YPD plate. Photo was taken after 2 days at 30 °C. Two individual cell lines, obtained during strain construction, are shown; both were used in this study as replicates. (B) Gene ontology terms were most significantly enriched in the 262 CRAC + genes. (C) Overlaps between the genes activated by Sfp1 and the set of genes whose mRNA products are bound by Sfp1. Overlap between CRAC + genes and genes whose expression was reported to be sensitive (either positively – ‘Up’ or negatively – ‘Down’) to Sfp1 overexpression ‘Sfp1-OE’ (Albert et al., 2019). Statistical figures, using hypergeometric tests, are indicated. (D) The Sfp1 ChIP-exo signal drops downstream of the GCTGCT motif. Comparison of average metagene profiles of cross-linking and analysis of cDNA (CRAC) (pink) and chromatin immunoprecipitation (ChIP)-exo (green) signals for genes with a GCTGCT motif (n=163). (E) Sfp1 ChIP-exo signal around the polyadenylation site (pA) sites of control genes as compared with CRAC + ones. Average metagene profile of Sfp1 ChIP-exo signals around the pA sites of CRAC + and CRAC control genes, as described in A. (F) Distribution of the distances of the GCTGCT motifs found in CRAC+ genes from to their corresponding pA sites. The motif logo is shown inserted inside the plot and the dashed vertical line indicates the length of the median 3’ UTR. (G) Genome browser screenshots of the CRAC signals in the indicated gene loci. Bottom panels are zoom-in versions of the upper panels. Circles indicate the GCTGCT motif. Note that the Cs at positions 2 and 5 can be replaced with G (see inset in F).
Figure 3
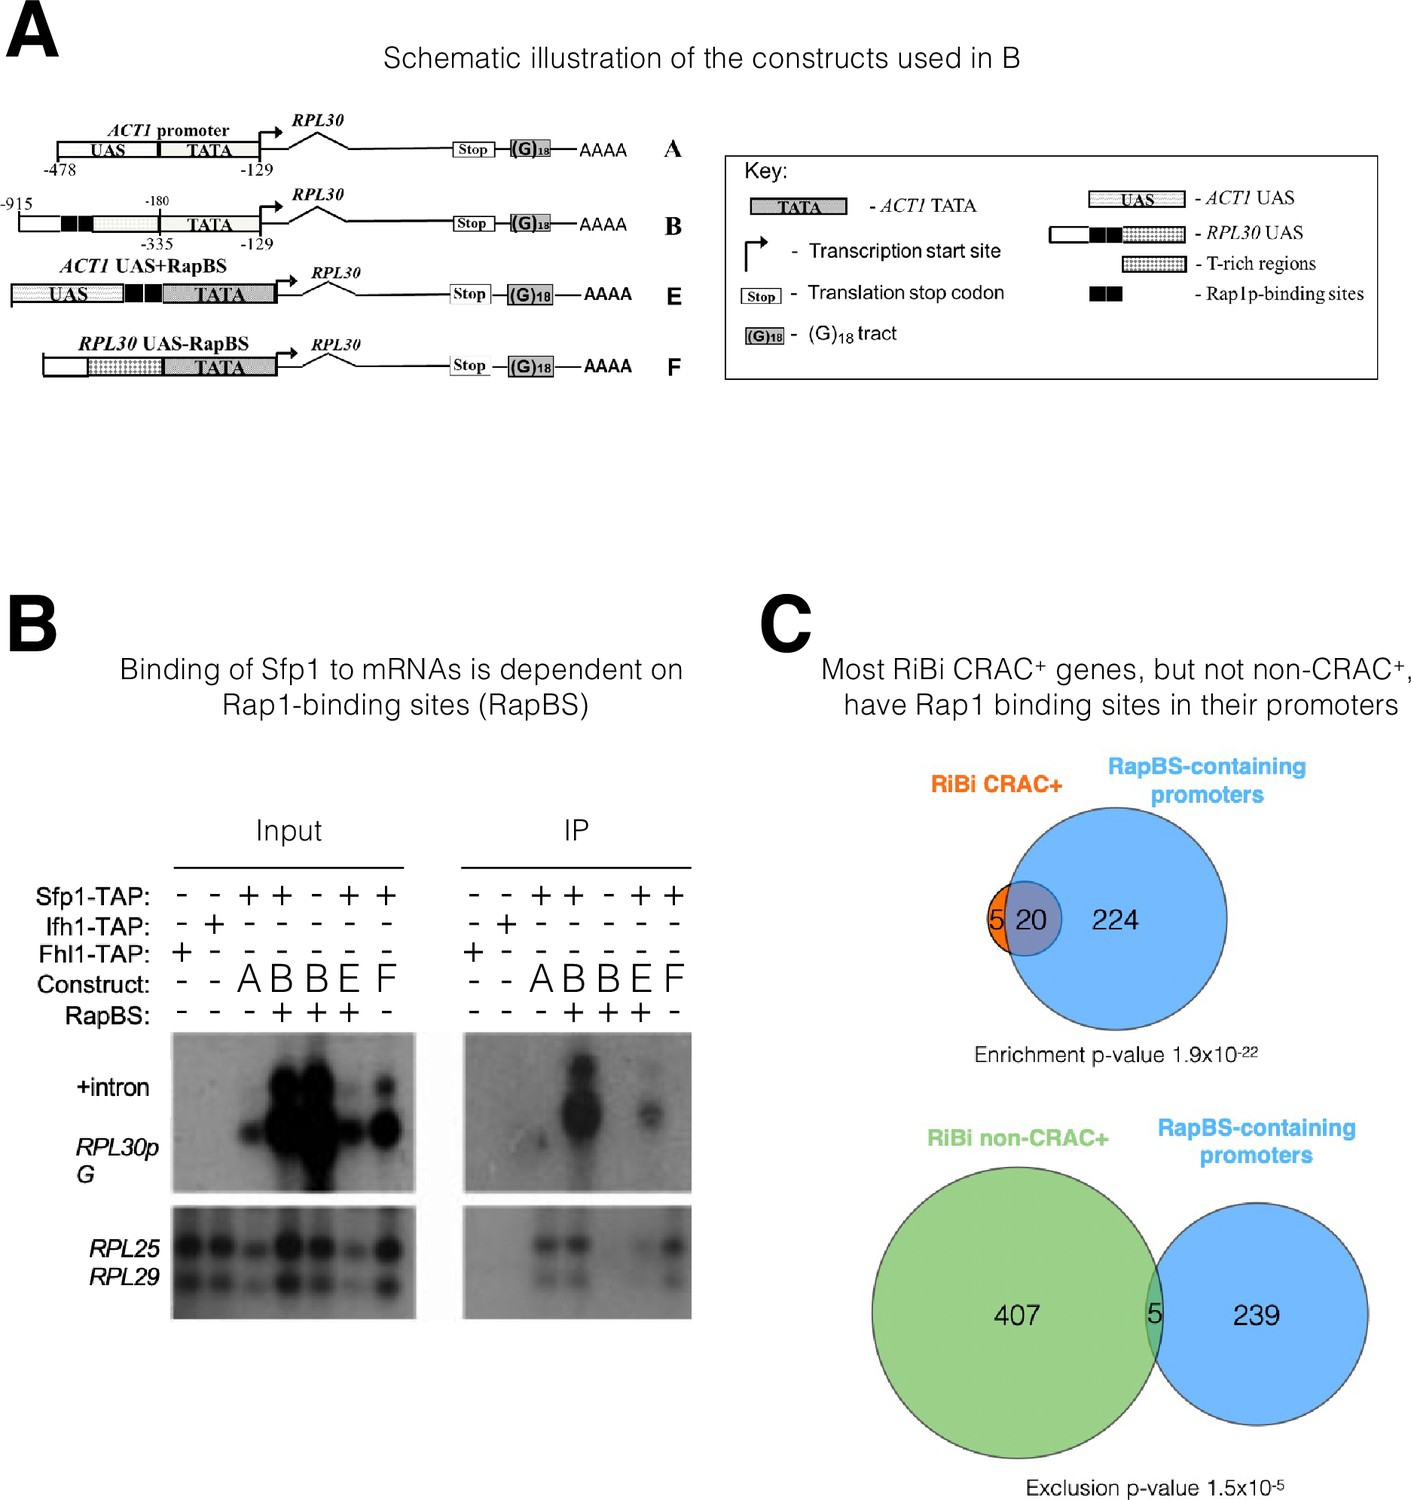
The mRNA-binding specificity of split-finger protein 1 (Sfp1) depends on the Rap1 binding site (RapBS) within the promoter.
(A) Constructs used in this study. The constructs were described previously (Bregman et al., 2011). To differentiate construct-encoded mRNAs from endogenous ones, we inserted an oligo(G)18 in the 3’ untranslated region. The constructs are identical except for the nature of their upstream activating sequence (UAS), located upstream of the ACT1 core promoter that includes the TATA box (designated ‘TATA’). The nucleotide boundaries of the RPL30 sequences are depicted above the constructs, and those of the ACT1 sequences are depicted below the constructs. The numbering referes to the translation start codon. These constructs encode identical mRNA (Bregman et al., 2011). (B) Binding of Sfp1 to mRNA is dependent on the RapBS. Extracts of cells, expressing the indicated constructs, were subjected to RNA immunoprecipitation (RIP), using tandem affinity purification (TAP) of the indicated TAP-tagged proteins. RIP was followed by Northern blot hybridization using the probes indicated at the left. After the membrane was hybridized with oligo(C)18-containing probes (to detect RPL30pG mRNA; see Bregman et al., 2011), the membrane was hybridized with probes to detect endogenous RPL25 and RPL29 mRNAs.+Intron represents the intron-containing RPL30pG RNA (C) Most RiBi CRAC + genes have Rap1 binding sites (RapBS) in their promoters. Only 25 RiBi genes (including RiBi-like) are defined as CRAC+. Upper panel: Venn diagram showing the overlap between these genes and genes carrying promoters with RapBS. Lower panel: Venn diagram showing the overlap between all RiBi (+RiBi like) genes excluding CRAC+ (‘non-CRAC+’) and genes carrying promoters with RapBS. Data on Rap1 bound promoters were obtained from Lieb et al., 2001. A hypergeometric test was applied to calculate the p-values, indicated underneath each diagram. Note that p-values were significant for both inclusion (upper diagram) and exclusion (lower diagram).
Figure 4 with 2 supplements
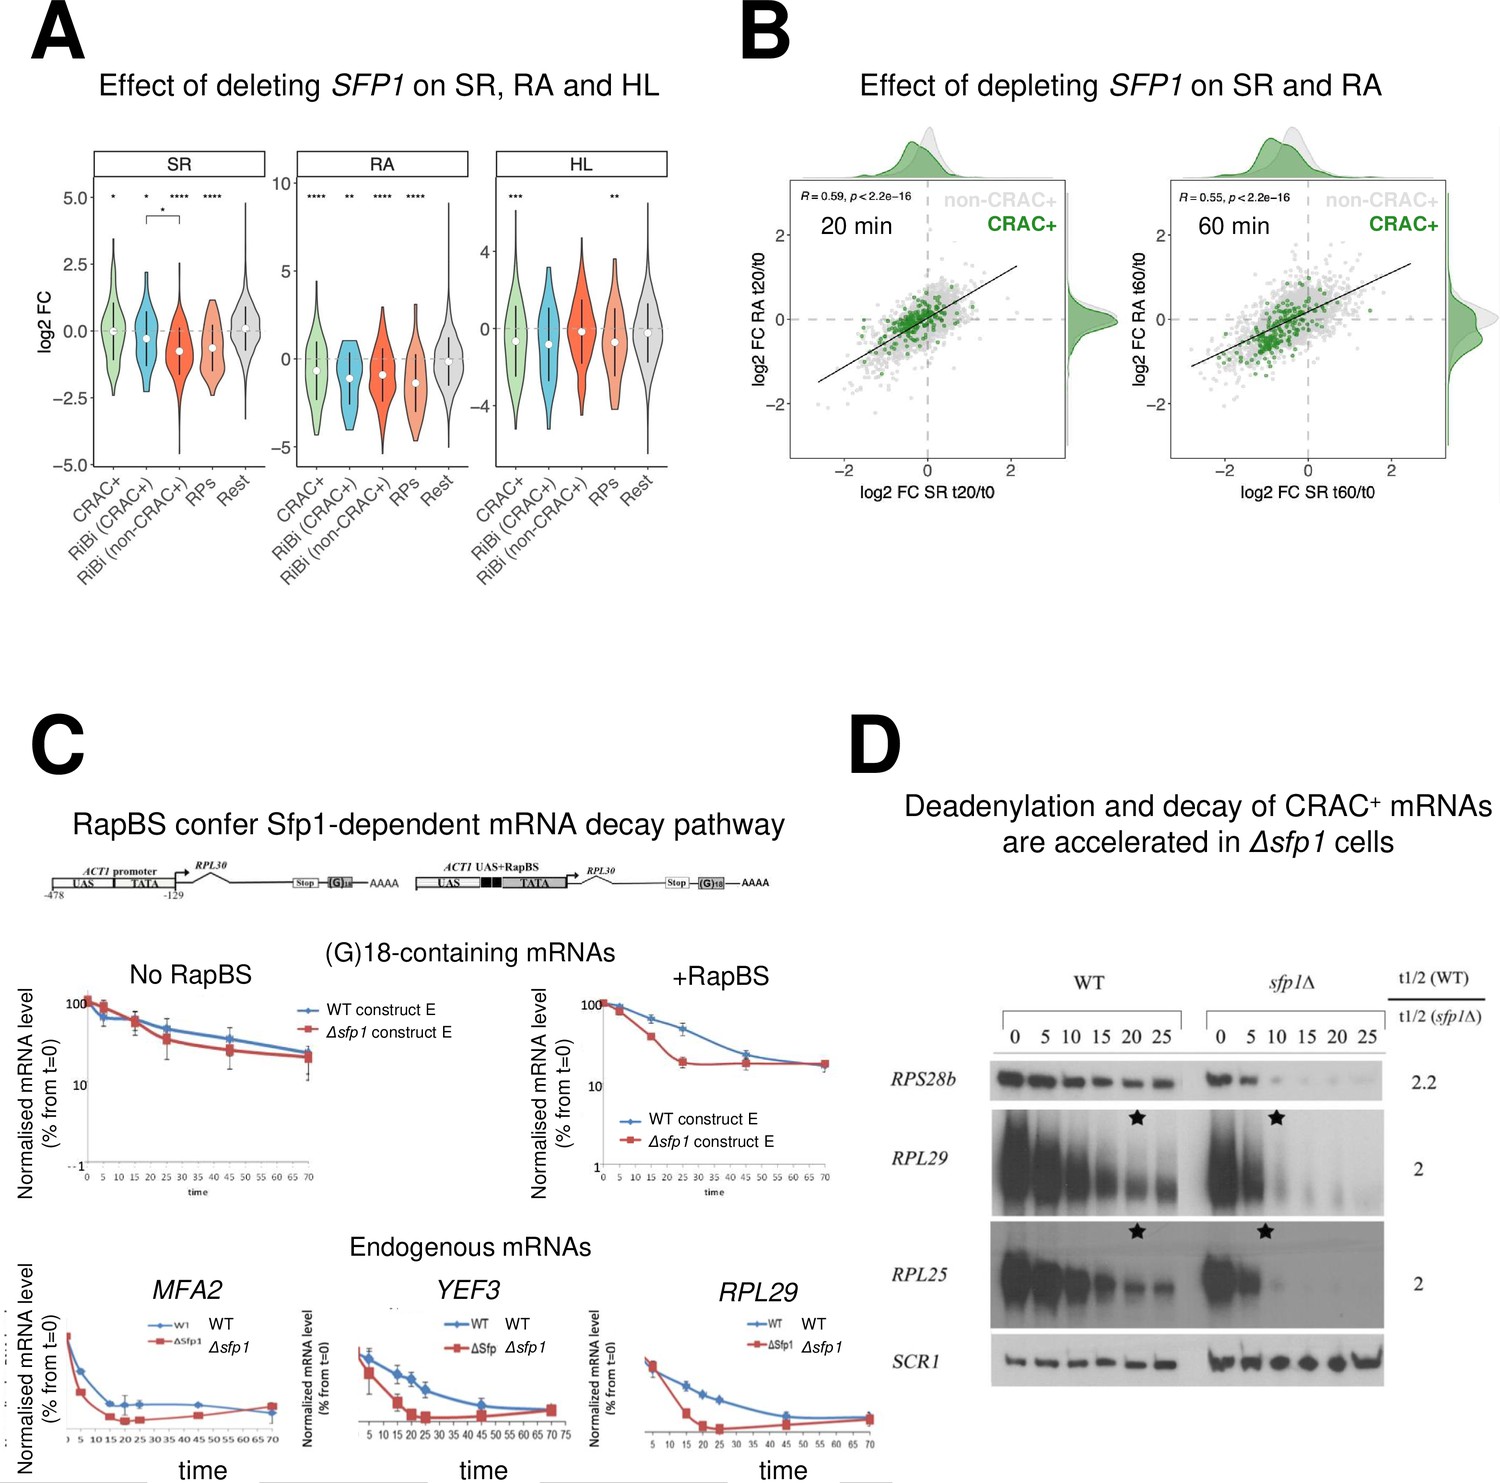
Split-finger protein 1 (Sfp1) is required for efficient transcription of CRAC + genes and stabilizes the deadenylation-dependent pathway of their mRNAs’ decay.
(A) Sfp1 deletion affects SR (RNA synthesis rate), RA (mRNA Abundance), and HL (mRNA half-life) differently for different subsets of genes. CRAC+ (n=262), RiBi (including RiBi-like) CRAC+ (n=25), RiBi (+RiBi like) excluding CRAC+ (RiBi (non-CRAC+) (n=411), RPs (n=129)). Statistical analyses were performed using the Wilcoxon test. Asterisks indicate significant results (*p<0.05; **p<0.01; ***p<0.001; ****p<0.0001). Unless indicated otherwise, statistical comparisons were performed using the ‘Rest’ group (all detectable genes exclusing CRAC + ones) as a reference. In addition, RiBi CRAC + and RiBi non-CRAC +are compared against each other. (B) Sfp1 depletion rapidly affects SR and RA of CRAC + genes. Scatterplot of changes in SR vs changes in RA at 20 min. (left) or 60 min. (right) after depleting Sfp1-degron by auxin. CRAC + genes are highlighted in green. Spearman correlation values and the significance of the linear adjustment for the whole dataset are indicated inside the plot. Density curves are drawn on the margins of the plot to help evaluate the overlap between dots. (C) RapBS confers the Sfp1-dependent mRNA decay pathway. Shown is the quantification of Northern blot hybridization results of mRNA decay assay (Methods), performed with wild-type (WT) or Δsfp1 cells that carried the indicated constructs (described in Bregman et al., 2011 and schematically shown at the top). The membrane was probed sequentially with an oligo(C)18-containing probe, to detect the construct-encoded mRNA, and with probes to detect endogenous mRNAs. mRNA levels were normalized to the Pol III transcript SCR1 mRNA (Methods). The band intensity at time 0, before transcription inhibition, was defined as 100% and the intensities at the other time points (min) were calculated relative to time 0. Error bars indicate the standard deviation of the mean values of three independent replicates (for (G)18-containing mRNAs), or of 12 replicates (for endogenous mRNAs). (D) The deadenylation rate of CRAC + mRNAs and the subsequent decay of the deadenylated RNAs is accelerated in sfp1Δ cells. Transcription was blocked as described in section C (Methods). RNA samples were analyzed using the polyacrylamide Northern technique (Sachs and Davis, 1989), using the probes indicated on the left, all are CRAC+. Half-lives were determined and the indicated ratios are depicted on the right. The asterisk (*) indicates the time point at which deadenylation is estimated to be complete.
Figure 4—figure supplement 1
Split-finger protein 1 (Sfp1) stabilizes CRAC + mRNAs.
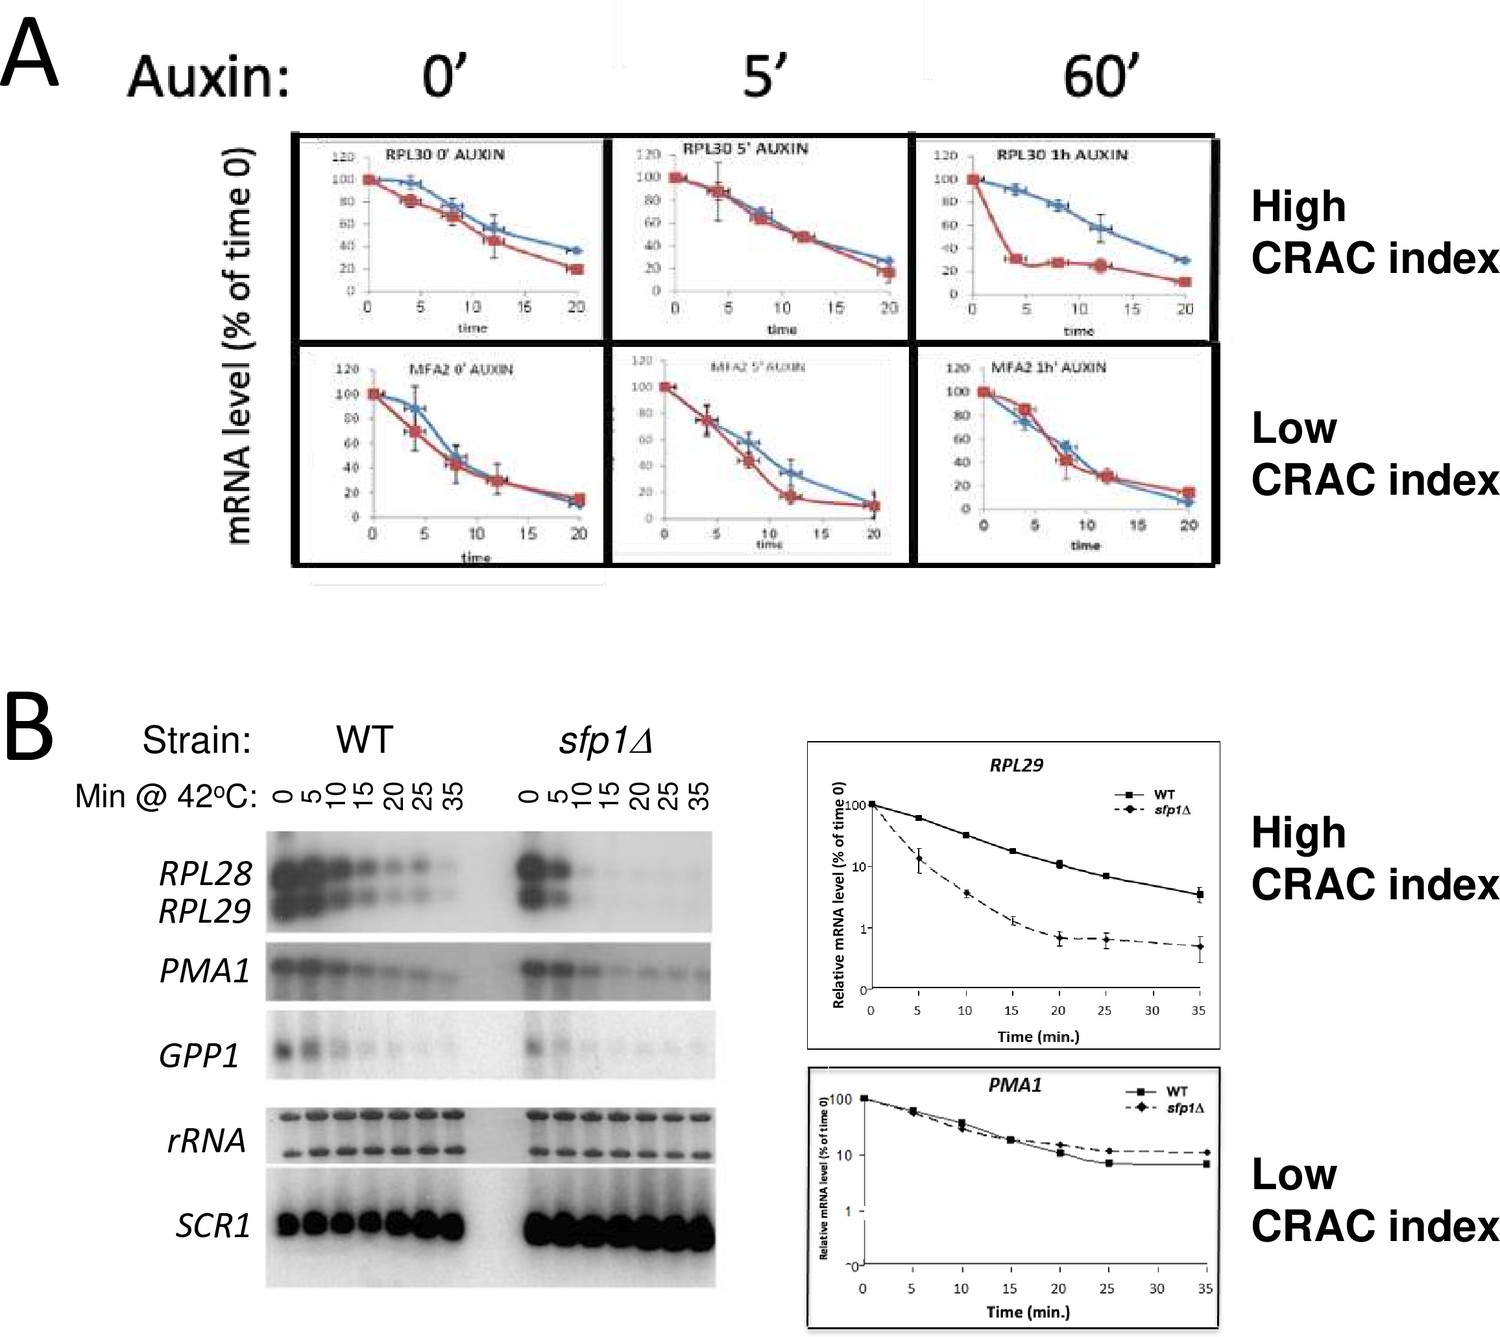
(A) Depletion of Sfp1 by ‘auxin-induced degron (AID)’ destabilized RPL30 mRNA having a high CRAC index, but not PMA1, having the lowest CRAC index. Cells expressing AID-SFP1 or isogenic WT strain were allowed to proliferate under optimal environmental conditions. Auxin was added and cells were incubated for the duration indicated above the graphs. Transcription was then blocked by adding thiolutin and mRNA decay assay was performed (see Methods). (B) Sfp1 stabilizes CRAC + mRNAs during heat shock (HS). Cells of the indicated strains were allowed to proliferate under optimal environmental conditions. At the mid-log phase, the cultures were shifted to 42 °C, to inactivate transcription (Lotan et al., 2005 and references therein). mRNA decay assay was performed and quantified as described in Methods. The same membrane was reacted sequentially by the indicated radioactive probes. Note the logarithmic scale of the graphs.
Figure 4—figure supplement 2
Split-finger protein 1 (Sfp1) binds CRAC + gene bodies.
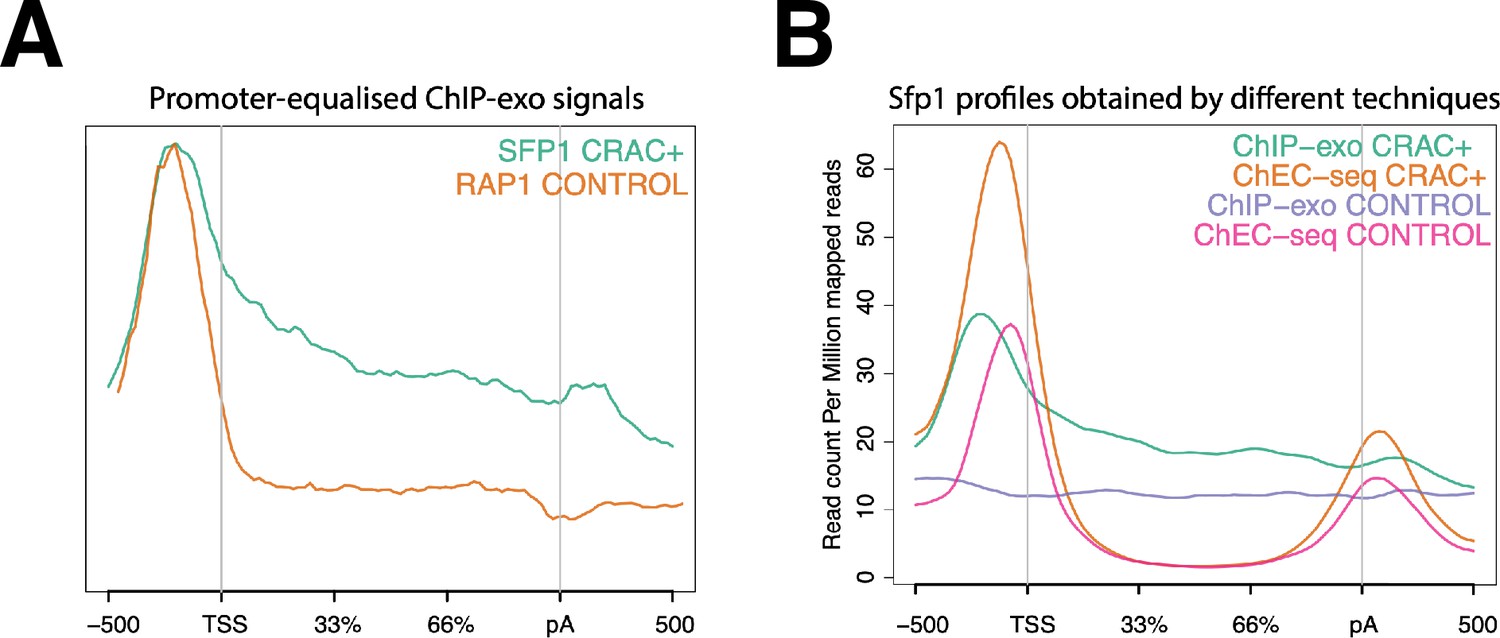
(A) Comparison of the average metagene profile of Sfp1 and Rap1 obtained by chromatin immunoprecipitation (ChIP)-exo (Reja et al., 2015), focusing on CRAC + genes. The original plots were artificially modified to equalize the heights of the profiles by their maximums to show that Sfp1 has higher gene body occupancy than Rap1. (B) Comparison of the average metagene profile of Sfp1 occupancy obtained by two alternative methodologies: ChIP-exo by Reja et al., 2015 and ChEC-seq by Albert et al., 2019.
Figure 5
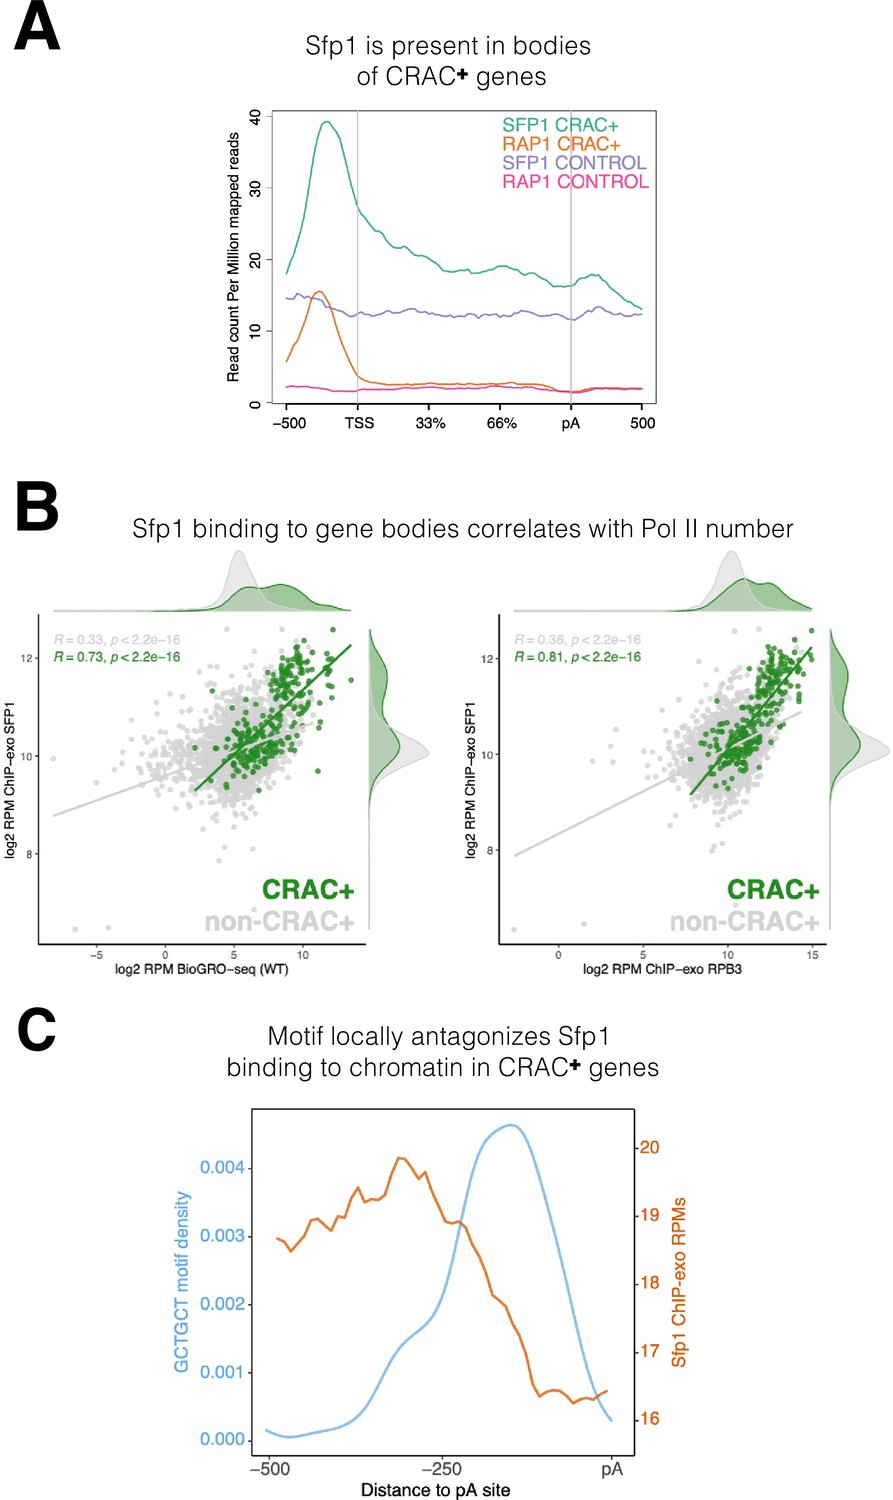
Binding features of split-finger protein 1 (Sfp1) to chromatin.
(A) Sfp1 is present in the bodies of CRAC + genes. Average metagene of Sfp1 and Rap1 chromatin immunoprecipitation (ChIP)-exo signal, obtained from Reja et al., 2015, for CRAC + genes (n=262) and CRAC-CONTROL genes (a subset of 262 non-CRAC + genes randomly selected from the entire genome, but excluding ribosomal protein (RP) and ribosome Biogenesis biogenesis (RiBi) genes). See also the plot with alternative scaling in Figure 4—figure supplement 2A. (B) Left panel: Positive correlation between Sfp1 binding to gene bodies and transcriptional activity. Scatterplot comparing Sfp1 binding to gene bodies (measured by ChIP-exo, Reja et al., 2015) versus the density of actively elongating RNA polymerase II (pol II) (measured by BioGRO-seq; Begley et al., 2021) in CRAC + genes (n=262). Spearman correlation is indicated at the bottom of the plot. Right panel: Correlation between Sfp1 binding to the bodies of all genes (n=4777 that were in the dataset) and transcription rate. Spearman correlation for all genes (including CRAC+) or for all genes exclusing CRAC + genes are indicated at the top of the plot. (C) The Sfp1 ChIP-exo signal drops downstream of the GCTGCT motif. Comparison of average metagene profiles of cross-linking and analysis of cDNA (CRAC) (blue) and ChIP-exo (orange) signals for genes with a GCTGCT motif (n=163).
Figure 6
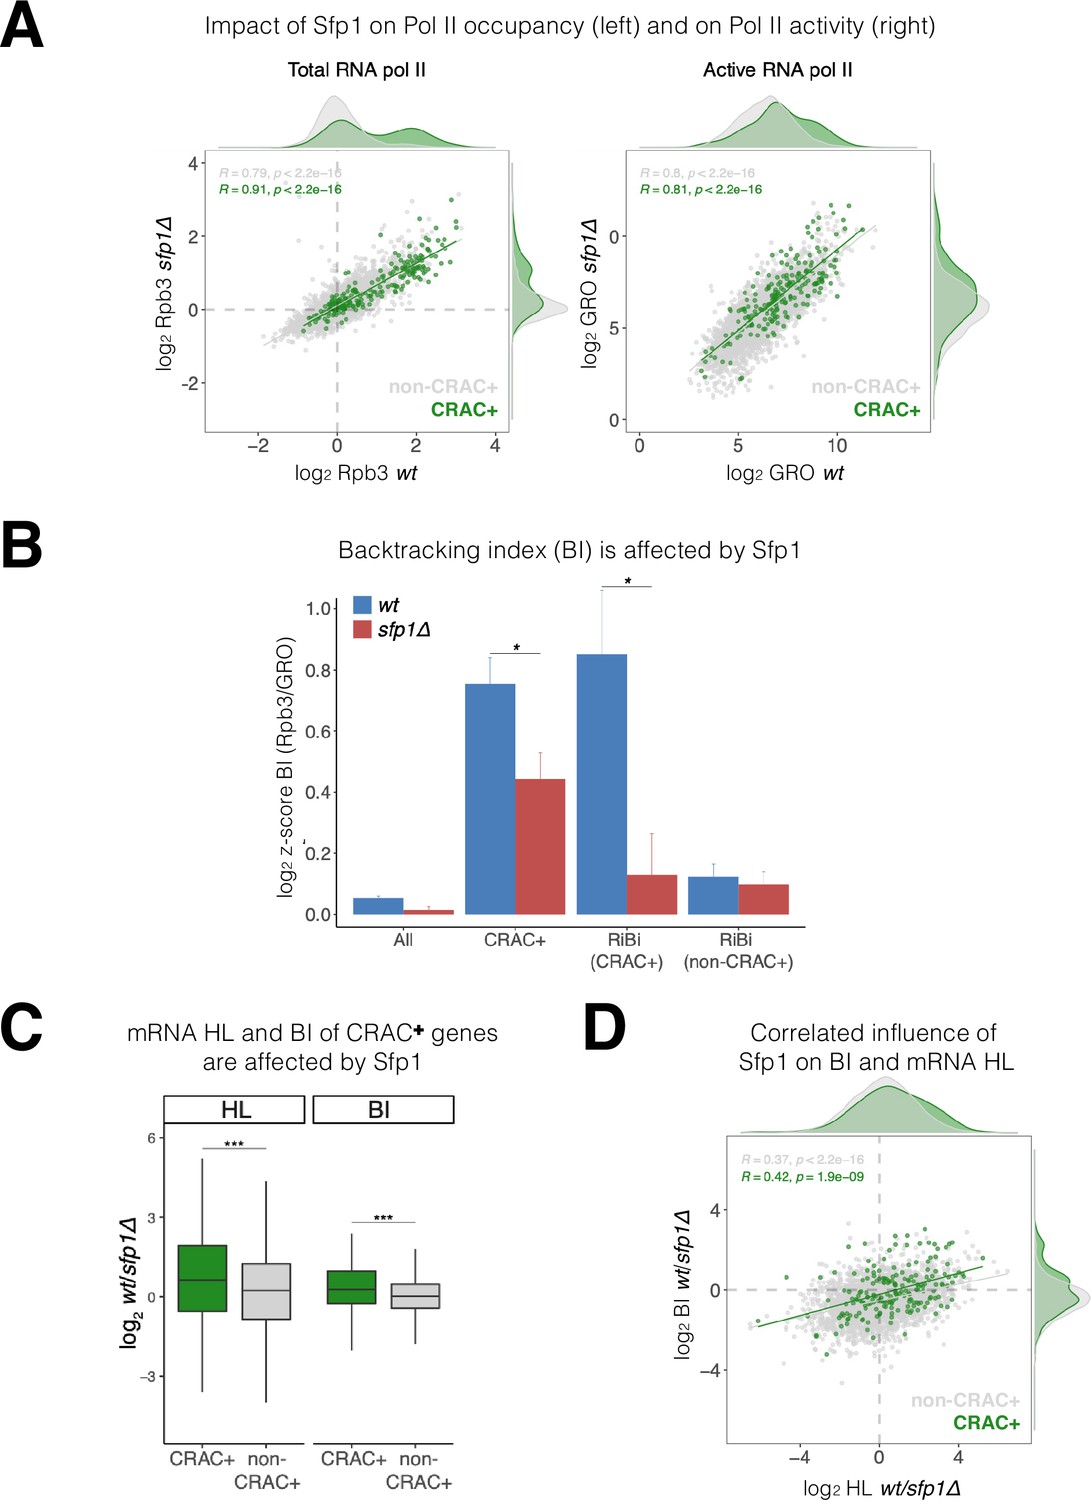
Split-finger protein 1 (Sfp1) induces polymerase II (Pol II) backtracking, preferentially in CRAC + genes.
(A) Sfp1 differently affects Pol II occupancy (left) and Pol II activity (right). Pol II levels were measured by Rpb3 chromatin immunoprecipitation (ChIP) and its activity by genomic run-on (GRO), in wild-type (WT) (BY4741) and its isogenic sfp1Δ strain, growing exponentially in YPD. Anti Rpb3 (rabbit polyclonal) ChIP on chip experiments using Affymetrix GeneChip S. cerevisiae Tiling 1.0 R custom arrays as described in Methods. For each gene, the average of signals corresponding to tiles covering 5’ and 3’ ends (250 bp) were calculated. Green dots represent the CRAC + genes; gray dot – non-CRAC+. The tendency line, its equation, Pearson R, and its p-value of the statistically significant deviation from the null hypothesis of no correlation are shown in gray, for the whole dataset, and in green, for the CRAC + genes. (B) Sfp1 promotes Pol II backtracking of CRAC +genes. Backtracking index (BI), defined as the ratio of Rpb3-ChIP to GRO signals, is shown for different gene sets, indicated below, comparing WT and sfp1∆ strains. In order to compare data obtained from different types of experiments the values were normalized by the median and standard deviation (z-score). The bars represent standard errors. Statistical significance of the differences between the averages of the indicated samples was estimated using a two-tailed Student’s t-test (* means <0.01). (C) mRNA HL and BI of CRAC + mRNAs/genes are affected by Sfp1. Box and whisker plots showing the effect of Sfp1 on mRNA HL and Pol II BI. A comparison between CRAC+ (green) and all genes excluding CRAC + ones (‘non-CRAC+’ gray) genes is shown. Half-lives (HL) were calculated from the mRNA abundance (RA) and synthesis rates (SR), using the data shown in Figure 4A. The statistical significance of the differences between the averages of the CRAC + and non-CRAC + was estimated using a two-tailed Student’s t-test (***p<0.0001). (D) mRNA HL and BI are correlated via Sfp1: correlation between Sfp1-dependence of BI and mRNA HL ratios. Data from C were represented in a scatter plot. Linear regression equations are shown for all (gray) and CRAC + genes (green). Pearson correlation coefficient, R, and the p-value of the statistically significant deviation from the null hypothesis of no correlation (R=0) are also indicated. All statistical correlations were determined using the ggpubr package in R.
Figure 7 with 1 supplement
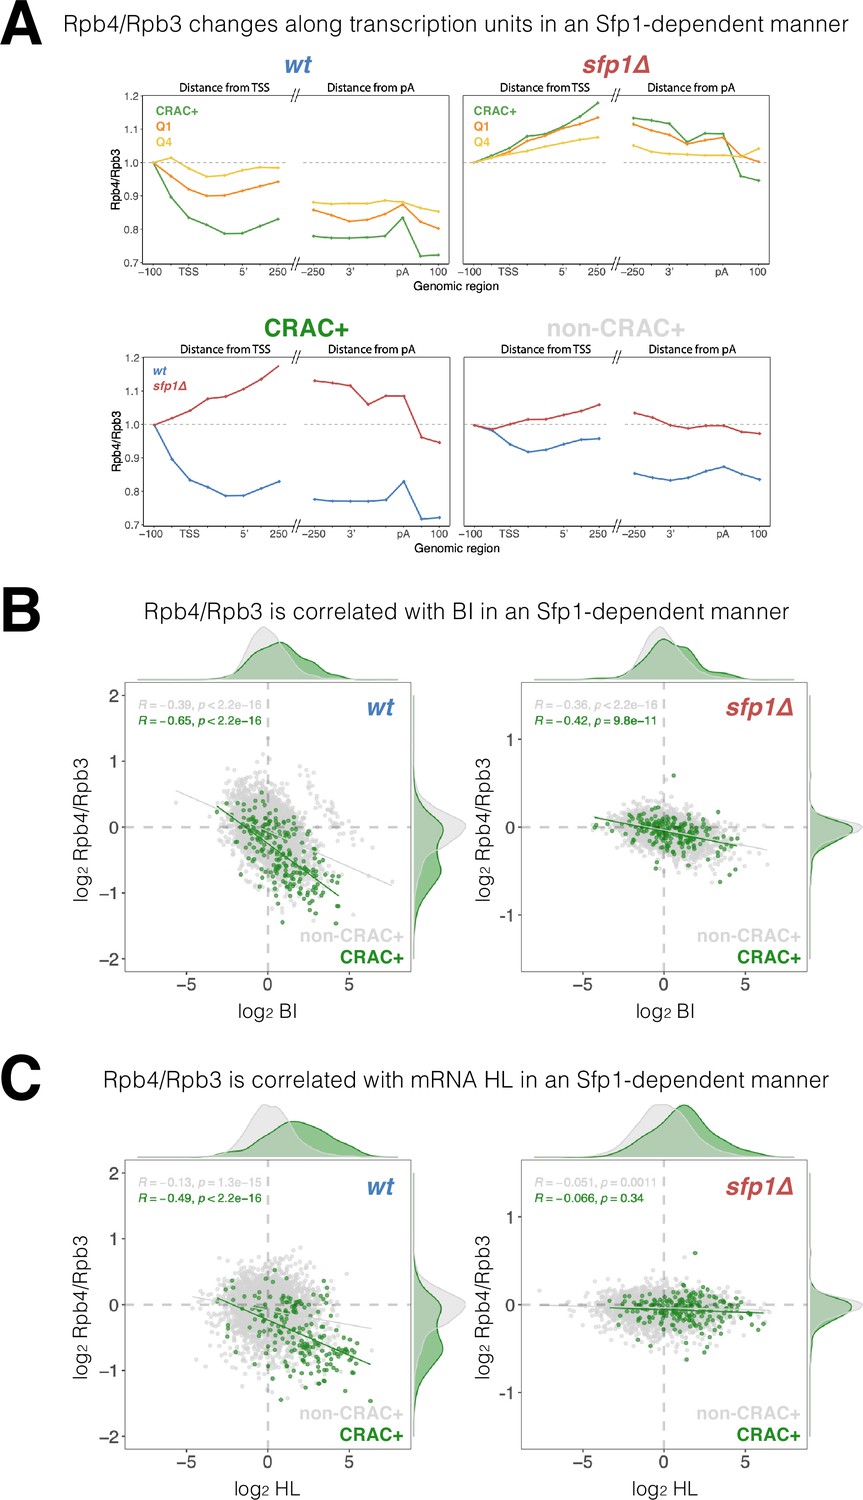
Split-finger protein 1 (Sfp1) alters Rpb4 stoichiometry/configuration within the polymerase II (Pol II) elongation complex and this alteration is linked to mRNA stabilization.
(A) The Rpb4 stoichiometry/configuration changes along the transcription units in an Sfp1-mediated manner. Top left panel - the values of Rpb3 and Rpb4 were obtained from chromatin immunoprecipitation (ChIP) on chip experiments, either against Rpb3 or against Rpb4-Myc in LMY3.1 cells proliferated exponentially in YPD. Rpb4-ChIP/ Rpb3-ChIP ratios were calculated and averages for the indicated gene sets were obtained for positions ranging from –100 to +250 (relative to TSS) and from –250 to +100 (relative to pA sites). Average ratios were normalised to the TSS –100 position, in order to represent profiles of Rpb4-ChIP changes after Pol II recruitment to promoters. Top right panel –profiles of Rpb4-ChIP/Rpb3-ChIP ratios were obtained as in the top left panel, but from sfp1∆ strain (LMY7.1). Bottom left panel - Rpb4-ChIP/Rpb3-ChIP profiles of CRAC + genes: comparing WT (blue) and sfp1∆ (red) strains. Bottom right panel - Rpb4-ChIP/Rpb3-ChIP profiles of rest of the genes (all detectable genes excluding CRAC + ones): comparing WT (blue) and sfp1∆ (red) strains. (B) Correlation between the Rpb4-ChIP/Rpb3-ChIP ratios and Pol II BI in WT (left panel) or in sfp1Δ cells (right panel). For each gene, the average of Rpb4-ChIP/Rpb3-ChIP values corresponding to positions from TSS to + 250 and from –250 to pA sites were calculated. BI values are taken from Figure 6C. Linear regression equations are shown for all (gray) and CRAC + genes (green). Pearson correlation coefficients, R, and the p-values of the statistically significant deviation from the null hypothesis of no correlation (R=0), are also shown. All statistical correlations were determined using the ggpubr package in R. (C) Correlation between the Rpb4-ChIP/Rpb3-ChIP ratios and mRNA HL in WT or sfp1Δ cells. Values of Rpb4-ChIP/Rpb3-ChIP ratios ere determined as in B. mRNA HL was indirectly calculated from mRNA abundance and transcription rates taken from the data used in Figure 4A and is shown in arbitrary units. CRAC + genes are depicted in green. R was calculated as in B.
Figure 7—figure supplement 1
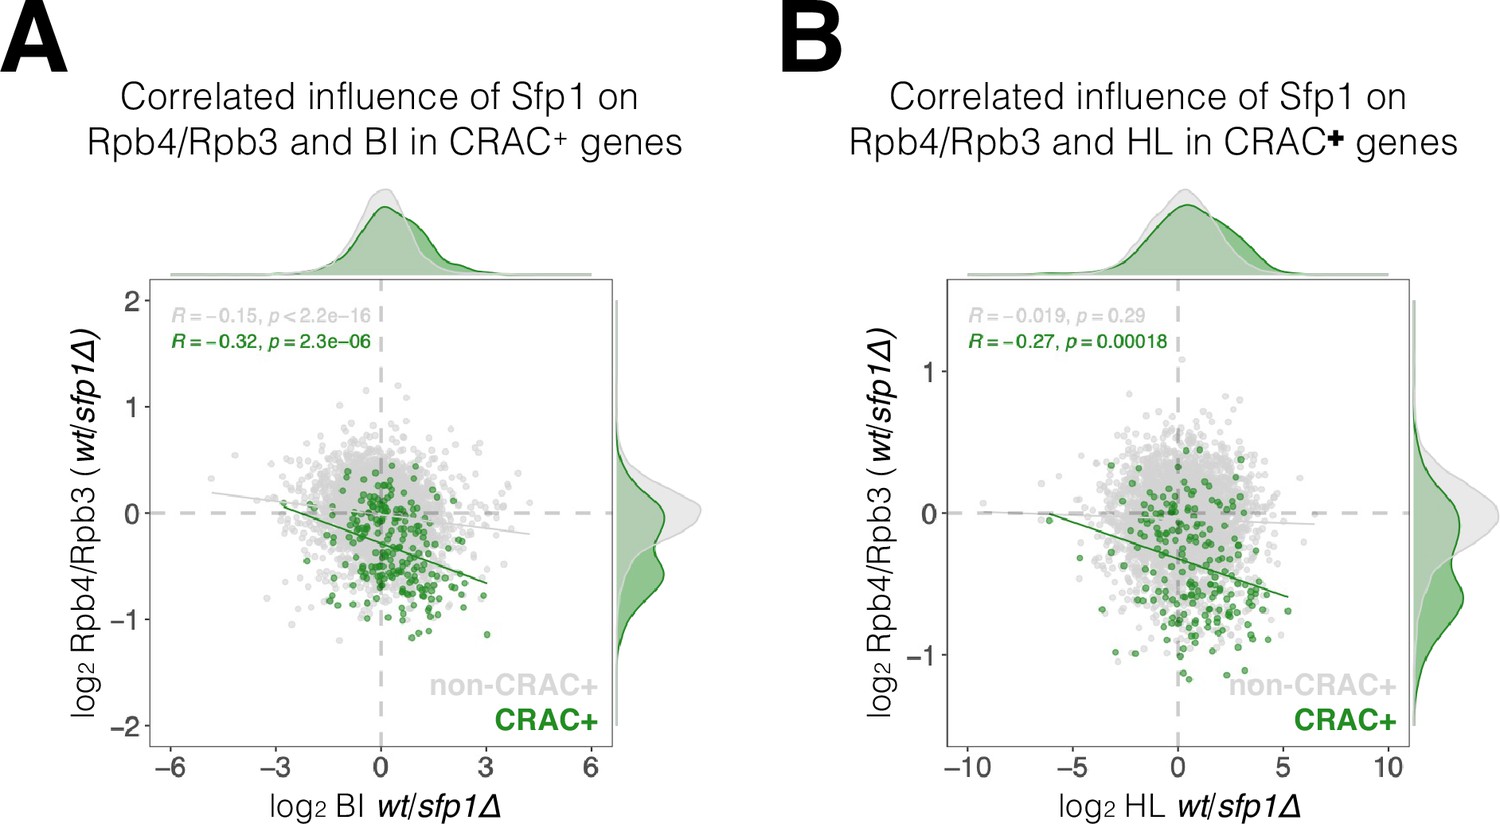
Correlation between the effects of split-finger protein 1 (Sfp1) on Rpb4-ChIP/Rpb3-ChIP ratios, on RNA polymerase II (Pol II) BI, and on mRNA HL.
(A) WT/sfp1∆ ratios for Rpb4-ChIP/Rpb3-ChIP and Pol II BI were calculated from values represented in Figure 7B and C, and represented in a scatter plot. CRAC + genes are depicted in green. Linear regression equations are shown for all (gray) and CRAC + genes (green). Spearman correlation coefficient and p-value calculated by the stat_cor function of the ggpubr package in R. Correlation coefficients and p-values of statistical significance are also shown. Note that the correlation between Sfp1 effects in BI and Rpb4-ChIP/Rpb3-ChIP ratio was triple in CRAC + than in cross-linking and analysis of cDNA (CRAC)- genes. (B) WT/sfp1∆ ratios for Rpb4-ChIP/Rpb3-ChIP and mRNA HL were calculated from values represented in Figure 7B and C, and represented in a scatter plot. CRAC + genes are depicted in green. The effect of Sfp1 on the Rpb4ChIP/Rpb3-ChIP ratio correlated with its effect of mRNA HL in CRAC + genes, whereas in CRAC- genes no correlation was detected. Linear regression equations are shown for all (gray) and CRAC + genes (green). Correlation coefficients and p values of statistical significance were done as in Figure 7B.
Figure 8
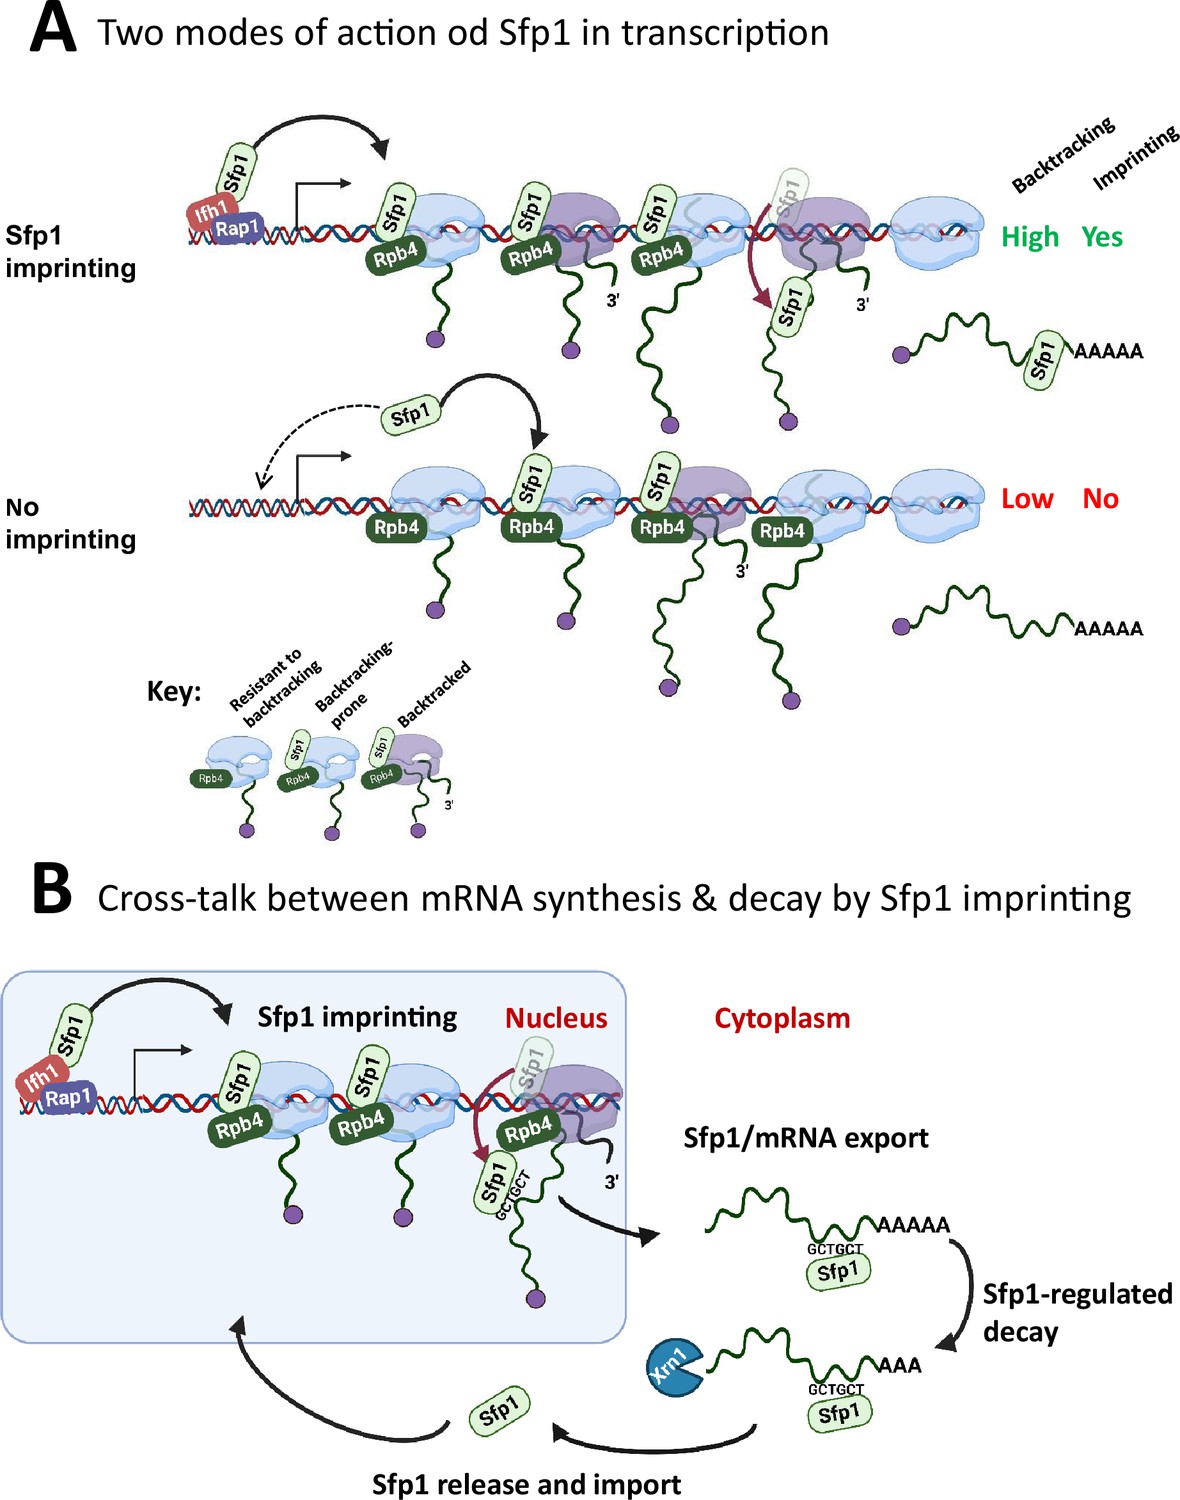
A model for split-finger protein 1 (Sfp1) functions in yeast.
(A) Two modes of action of Sfp1 in transcription: CRAC + genes recruit Sfp1 to their promoters, whereas non-CRAC + genes recruit Sfp1 from the nuclear space directly to RNA polymerase II (Pol II). Upper panel represents CRAC + genes that recruit Sfp1 to their promoters. We discovered that Sfp1 appears to accompany Pol II of CRAC + genes, in a manner proportional to the number of transcriptionally active Pol II (Figure 5A–B). Its binding to all Pol II molecules, including backtracked Pol II, is even more apparent (Figure 5B). In addition, we found that CRAC + genes are enriched with Rap1-binding sites (Figure 3). We, therefore, propose that, following binding to Rap1-containing promoters, Sfp1 binds Pol II. Specifically, it binds to Rpb4 (and possibly other Pol II subunits) and accompanies it until imprinting. This interaction influences Pol II configuration (Figure 7A–D) and increases the likelihood of Pol II to undergo backtracking (Figure 6B). Lower panel represents non-CRAC + genes that also interact with Sfp1 (Figure 5A CONTROL, Figure 5B). We propose that promoters of non-CRAC +genes recruit Sfp1 poorly (relative to CRAC + promoters), except for small group of promoters, e.g., of RiBi genes lacking Rap1 binding site (RapBS). The dashed arrow represents this minor group. For the majority of these genes, the nuclear Sfp1 interacts directly with their elongating Pol II, as its interaction correlates with the extent of chromatin-bound Pol II (Figure 5B). This weak interaction also changes Pol II configuration (Figure 7A, ‘non-CRAC+’) and increases the propensity of Pol II to backtrack (Figure 7B). However, it either does not result in imprinting or results in rare imprinting events that went undetected by our cross-linking and analysis of cDNA (CRAC) assay. (B) Sfp1 mediates cross-talk between mRNA synthesis and decay via imprinting. The backtracked configuration, induced by Sfp1 (A), is compatible with a movement of Sfp1 from Pol II to its transcripts (see text), which is enhanced in case the GCTGCT motif is localized near Sfp1 (Figure 5C). Following co-transcriptional RNA binding, Sfp1 accompanies the mRNA to the cytoplasm and stabilizes the mRNAs. Following mRNA degradation, Sfp1 is imported back into the nucleus to initiate a new cycle. The model proposes that the specificity of Sfp1-RNA interaction is determined, in part, by the promoter (Figure 3A–B). Nevertheless, promoter binding is necessary, but not sufficient for RNA binding. See text for more details.
Author response image 1

A snapshot of IGV GPP1 locus showing that all the reads are anti-sense pointing at the opposite direction of the gene (the gene arrows [white arrows over blue, at the bottom] are pointing to the right whereas the reads’ orientations are pointing to the left).
Additional files
-
MDAR checklist
- https://cdn.elifesciences.org/articles/90766/elife-90766-mdarchecklist1-v1.pdf
-
Supplementary file 1
Yeast strains used in this study.
- https://cdn.elifesciences.org/articles/90766/elife-90766-supp1-v1.pdf
-
Supplementary file 2
Yeast strains used in this study.
- https://cdn.elifesciences.org/articles/90766/elife-90766-supp2-v1.xlsx
Download links
A two-part list of links to download the article, or parts of the article, in various formats.
Downloads (link to download the article as PDF)
Open citations (links to open the citations from this article in various online reference manager services)
Cite this article (links to download the citations from this article in formats compatible with various reference manager tools)
The zinc-finger transcription factor Sfp1 imprints specific classes of mRNAs and links their synthesis to cytoplasmic decay
eLife 12:RP90766.
https://doi.org/10.7554/eLife.90766.4


