The stability of the primed pool of synaptic vesicles and the clamping of spontaneous neurotransmitter release rely on the integrity of the C-terminal half of the SNARE domain of syntaxin-1A
- Department of Neurophysiology, Charité-Universitätsmedizin Berlin, Humboldt-Universität zu Berlin, Berlin Institute of Health, Germany
- NeuroCure Excellence Cluster, Germany
Figures
Figure 1 with 1 supplement
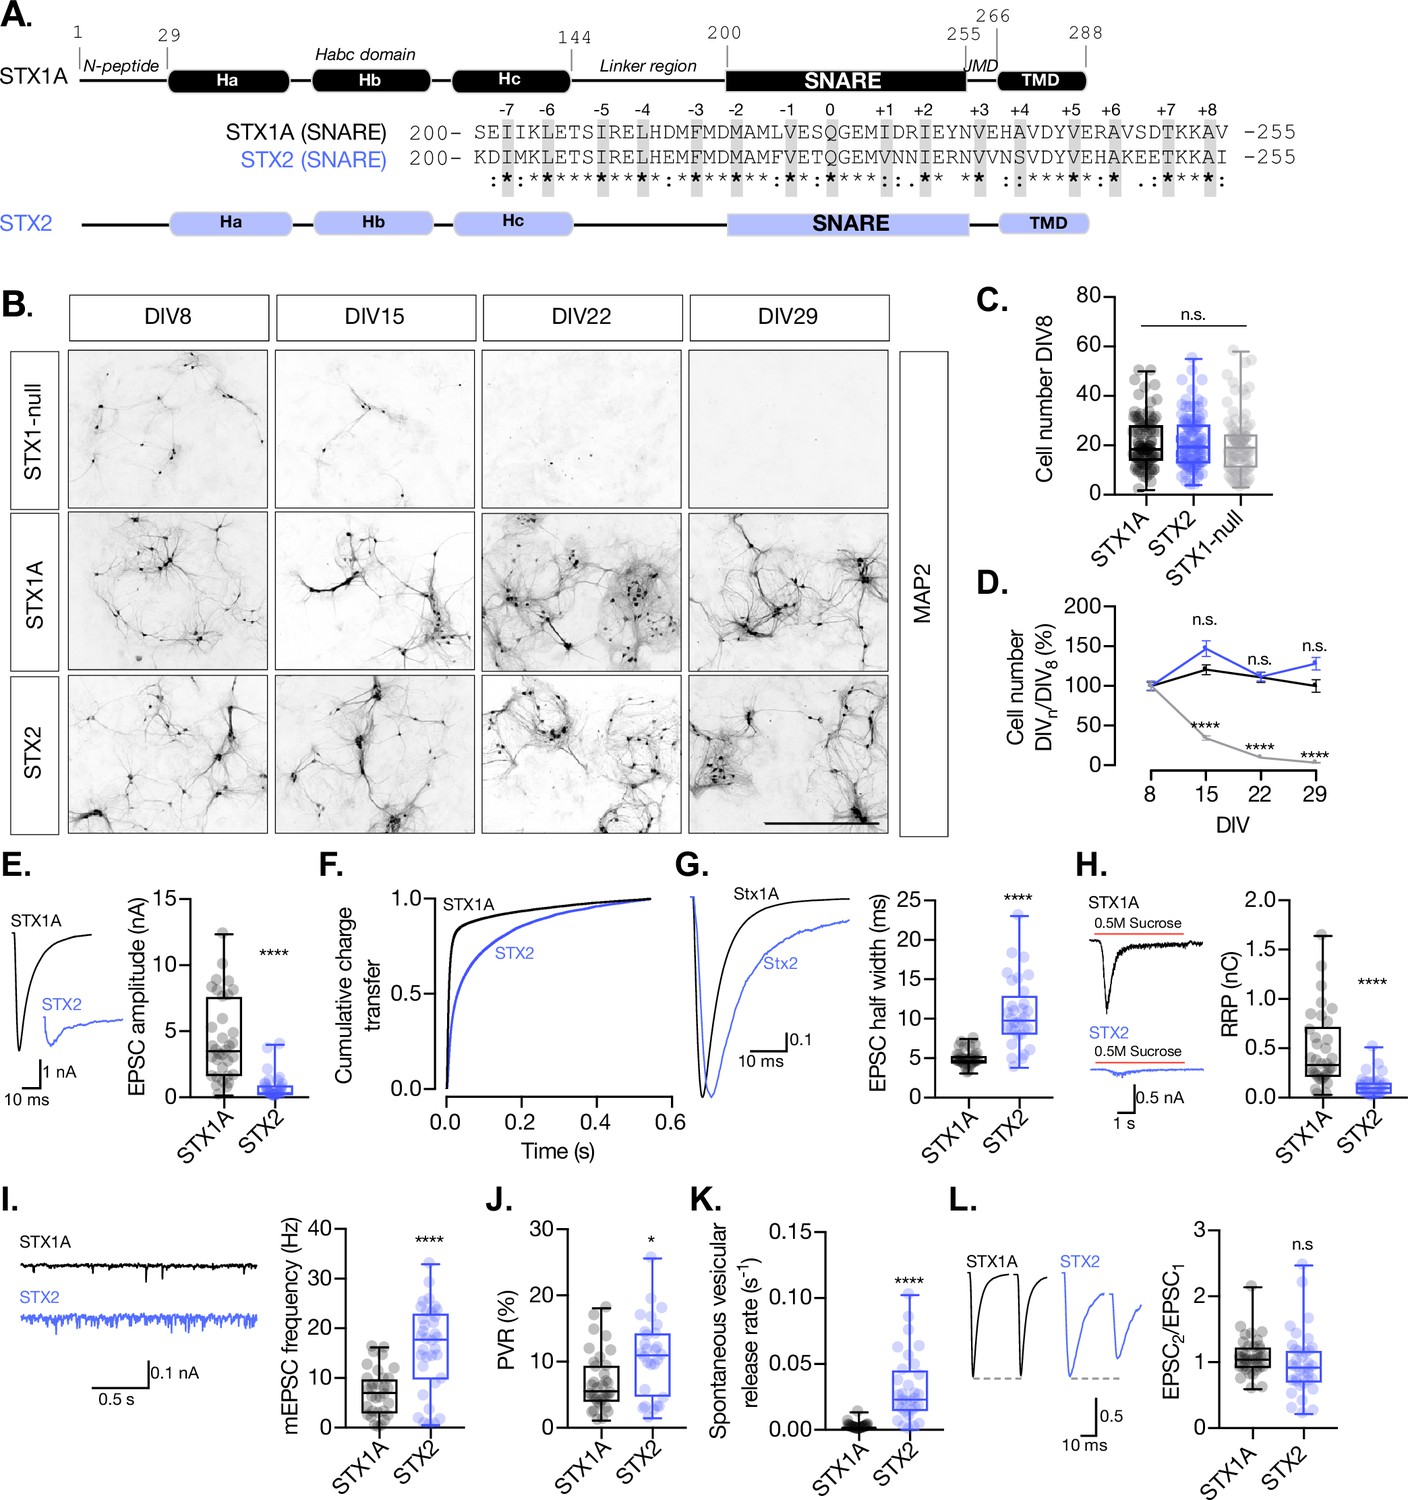
STX2 supports neuronal viability but does not rescue synchronous evoked release, the readily releasable pool (RRP), or the clamping of spontaneous release.
(A) STX1A and STX2 domain structure scheme and SNARE domain sequence alignment (68% homology). Layers are highlighted in gray. (B) Example images of high-density cultured STX1-null hippocampal neurons rescued with GFP (STX1-null), STX1A, or STX2 (from top to bottom) at days in vitro (DIV)8, DIV15, DIV22, and DIV29 (from left to right). Immunofluorescent labeling of MAP2. Scale bar: 500 μm. (C) Quantification of total number of neurons at DIV8 of each group. (D) Quantification of the percentage of the surviving neurons at DIV8, DIV15, DIV22, and DIV29 normalized to the number of neurons at DIV8 in the same group. (E) Example traces (left) and quantification of excitatory postsynaptic current (EPSC) amplitude (right) from autaptic Stx1A-null hippocampal mouse neurons rescued with STX1A or STX2. (F) Quantification of the cumulative charge transfer of the EPSC from the onset of the response until 0.55 s after. (G) Example traces of normalized EPSC to their peak amplitude (left) and quantification of the half-width of the EPSC (right). (H) Example traces (left) and quantification of the response induced by a 5 s 0.5 M application of sucrose, which represents the RRP of vesicles. (I) Example traces (left) and quantification of the frequency of the miniature EPSC (mEPSC) (right). (J) Quantification of the vesicle release probability (PVR) as the ratio of the EPSC charge over the RRP charge (PVR). (K) Quantification of the spontaneous vesicular release rate as the ratio between the mEPSC frequency and number of vesicles in the RRP. (L) Example traces (left) and the quantification of a 40 Hz paired-pulse ratio (PPR). In (D), data points represent mean ± SEM. In (D, E–L), data is shown as a whisker-box plot. Each data point represents single observations, middle line represents the median, boxes represent the distribution of the data, and external data points represent outliers. In (C, D), significances and p-values of data were determined by nonparametric Kruskal–Wallis test followed by Dunn’s post hoc test; *p≤0.05, **p≤0.001, ***p≤0.001, ****p≤0.0001. In (E–L), significances and p-values of data were determined by nonparametric Mann–Whitney test and unpaired two-tailed t-test; *p≤0.05, **p≤0.01, ***p≤0.001, ****p≤0.0001. All data values are summarized in Figure 1—source data 1.
-
Figure 1—source data 1
Quantification of the neuronal density at different time intervals and quantification of neurotransmitter release parameters of STX1-null neurons transduced with STX1A and STX2.
- https://cdn.elifesciences.org/articles/90775/elife-90775-fig1-data1-v1.xlsx
Figure 1—figure supplement 1
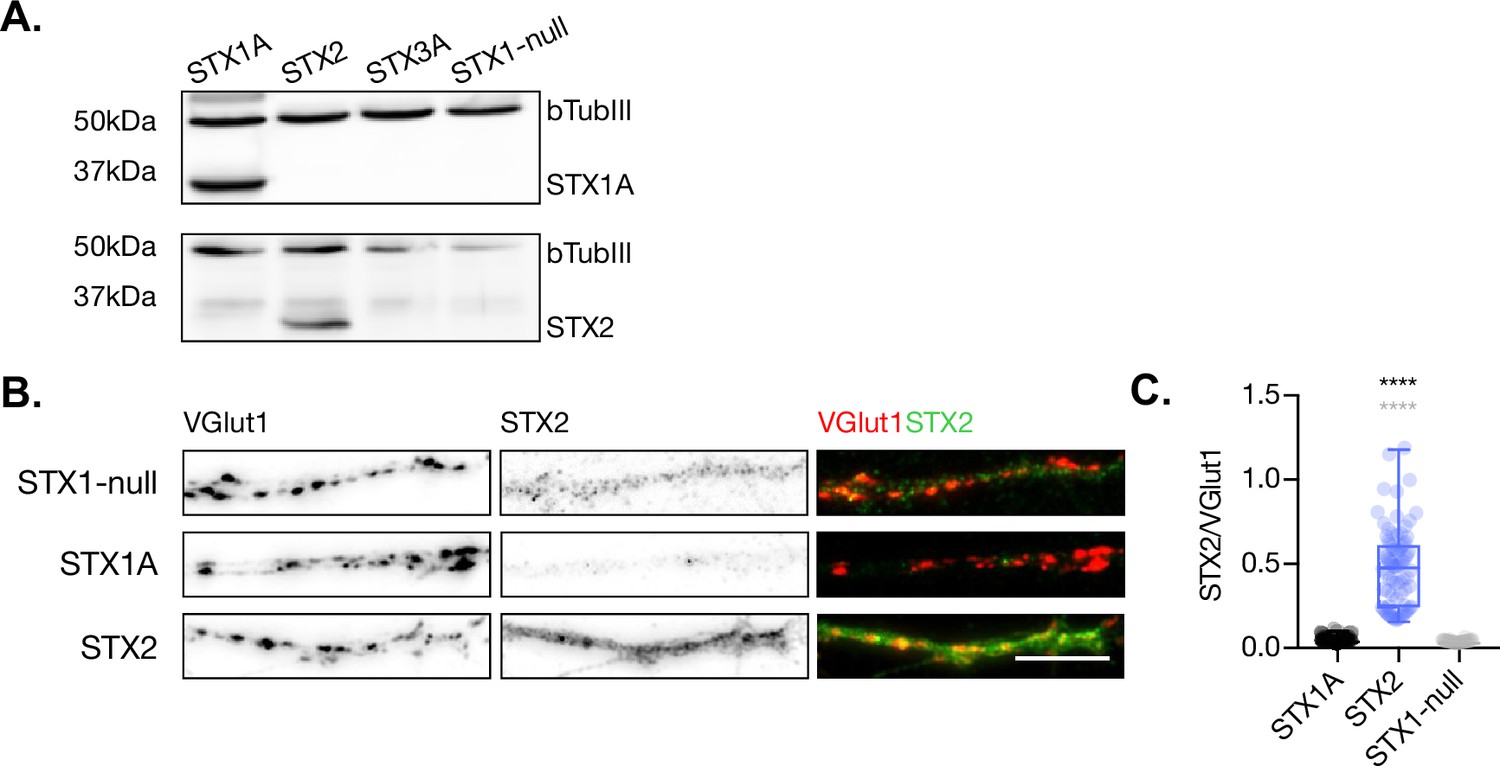
STX2 is expressed in STX1-null hippocampal neurons.
(A) SDS-PAGE electrophoresis of lysates from STX1-null neurons infected with STX1A, STX2, or GFP (STX1-null) and STX3A as negative controls. Proteins were detected using antibodies that recognize β-tubuline III as loading control STX1A, STX2, and STX3A. (B) Example images of mass-culture hippocampal neurons stained with fluorophore-labeled antibodies that recognize VGlut1 (red in merge) and STX2 (green in merge) from left to right. Scale bar: 10 μm. (C) Quantification of the immunofluorescent intensity of STX2 normalized to the intensity of the same VGlut1-labeled ROIs. In (C), data is shown as a whisker-box plot. Each data point represents single ROIs, middle line represents the median, boxes represent the distribution of the data, where the majority of the data points lie, and external data points represent outliers. Significances and p-values of data were determined by nonparametric Kruskal–Wallis test followed by Dunn’s post hoc test; *p≤0.05, **p≤0.01, ***p≤0.001, ****p≤0.0001. All data values are summarized in Figure 1—figure supplement 1—source data 1.
-
Figure 1—figure supplement 1—source data 1
Quantification of STX1A and STX2 levels in STX1-null neurons.
- https://cdn.elifesciences.org/articles/90775/elife-90775-fig1-figsupp1-data1-v1.xlsx
-
Figure 1—figure supplement 1—source data 2
Whole SDS-PAGE image represented in Figure 1—figure supplement 1.
- https://cdn.elifesciences.org/articles/90775/elife-90775-fig1-figsupp1-data2-v1.zip
Figure 2 with 1 supplement
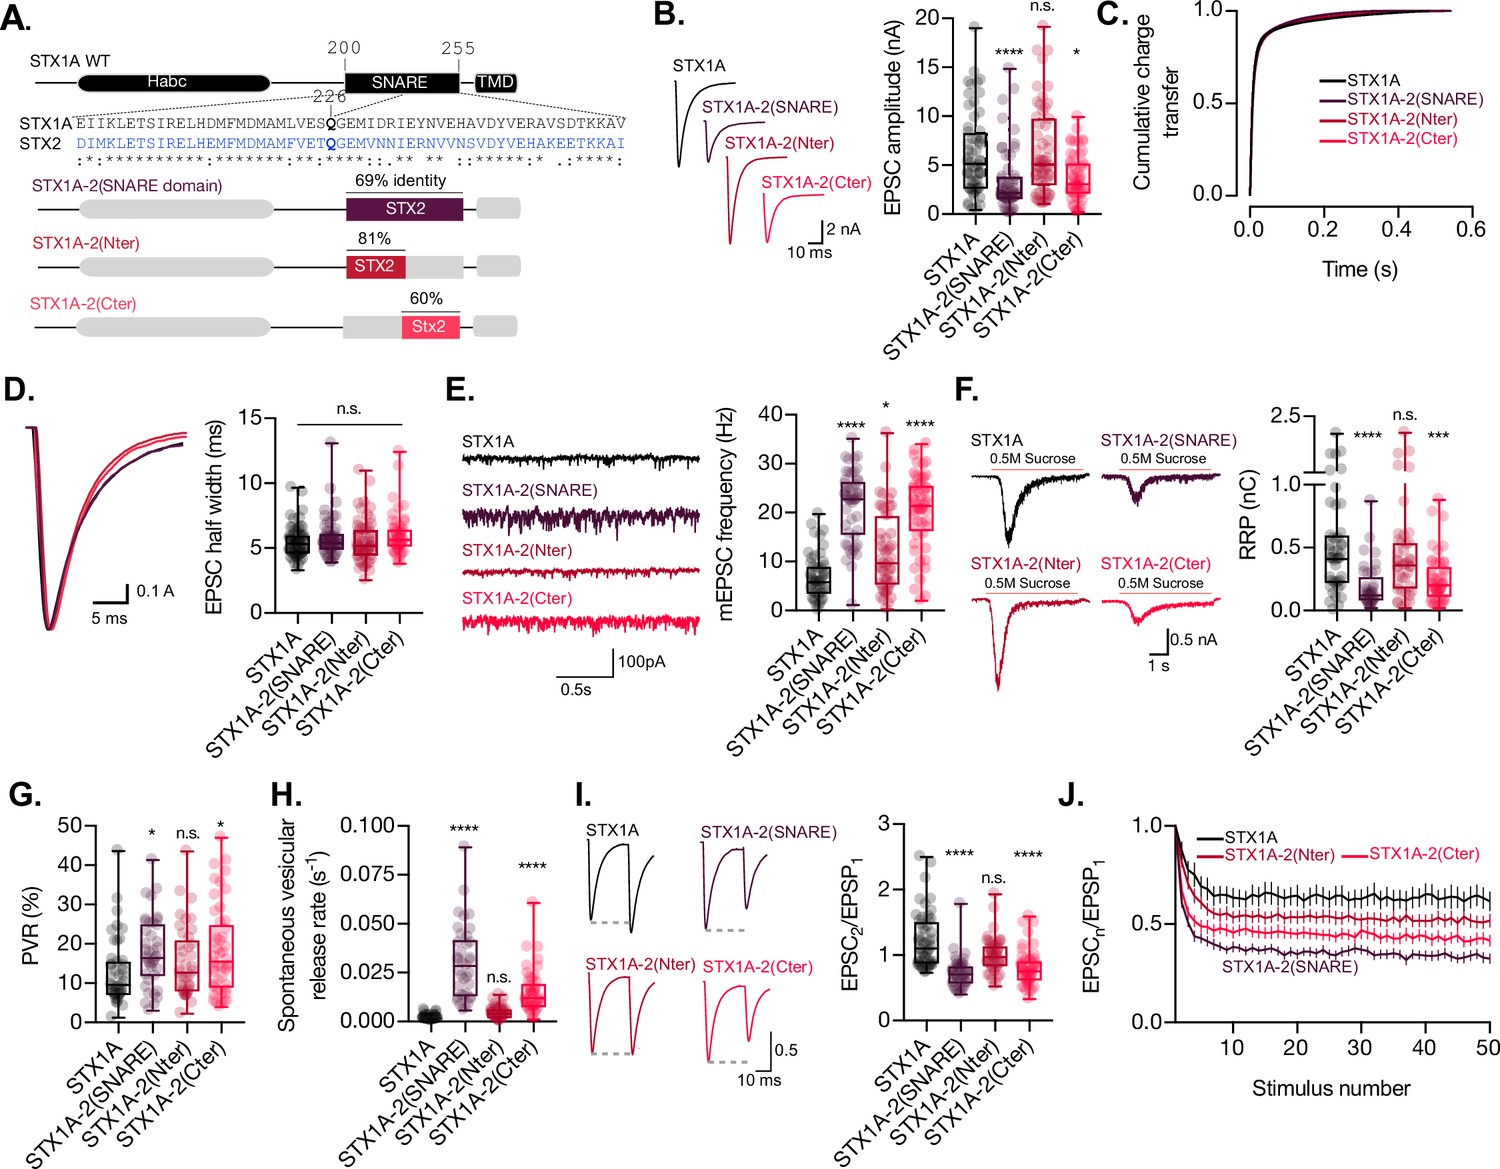
The C-terminal half of the SNARE domain of STX1A has a regulatory effect on the readily releasable pool (RRP), spontaneous release, and both, and N- and C-terminus have a role in the regulation of efficacy of Ca2+-evoked release.
(A) STX1A WT and chimera domain structure scheme, sequence alignment of STX1A and STX2 SNARE domain, and percentage homology between both SNARE domains. (B) Example traces (left) and quantification of the excitatory postsynaptic current (EPSC) amplitude (right) from autaptic STX1A-null hippocampal mouse neurons rescued with STX1A, STX1A-2(SNARE), STX1A-2(Nter), or STX1A-2(Cter). (B) Quantification of the cumulative charge transfer of the EPSC from the onset of the response until 0.55 s after. (C) Example traces of normalized EPSC to their peak amplitude (left) and quantification of the half-width of the EPSC (right). (D) Example traces (left) and quantification of the frequency of the miniature EPSCs (mEPSC) (right). (E) Example traces (left) and quantification of the response induced by a 5 s 0.5 M application of sucrose, which represents the RRP of vesicles. (F) Quantification of the vesicle release probability (PVR) as the ratio of the EPSC charge over the RRP charge (PVR). (G) Quantification of the spontaneous vesicular release rate as the ratio between the mEPSC frequency and number of vesicles in the RRP. (H) Example traces (left) and the quantification of a 40 Hz paired-pulse ratio (PPR). (I) Quantification of STP measured by 50 stimulations at 10 Hz. In (B, D–I), data is shown as a whisker-box plot. Each data point represents single observations, middle line represents the median, boxes represent the distribution of the data, where the majority of the data points lie, and external data points represent outliers. In (J), data represents the mean ± SEM. Significances and p-values of data were determined by nonparametric Kruskal–Wallis test followed by Dunn’s post hoc test; *p≤0.05, **p≤0.01, ***p≤0.001, ****p≤0.0001. All data values are summarized in Figure 2—source data 1.
-
Figure 2—source data 1
Quantification of neurotransmitter release parameters of STX1-null neurons transduced with STX1A, STX1A-2(SNARE), STX1A-2(Nter) and STX1A-2(Cter).
- https://cdn.elifesciences.org/articles/90775/elife-90775-fig2-data1-v1.xlsx
Figure 2—figure supplement 1
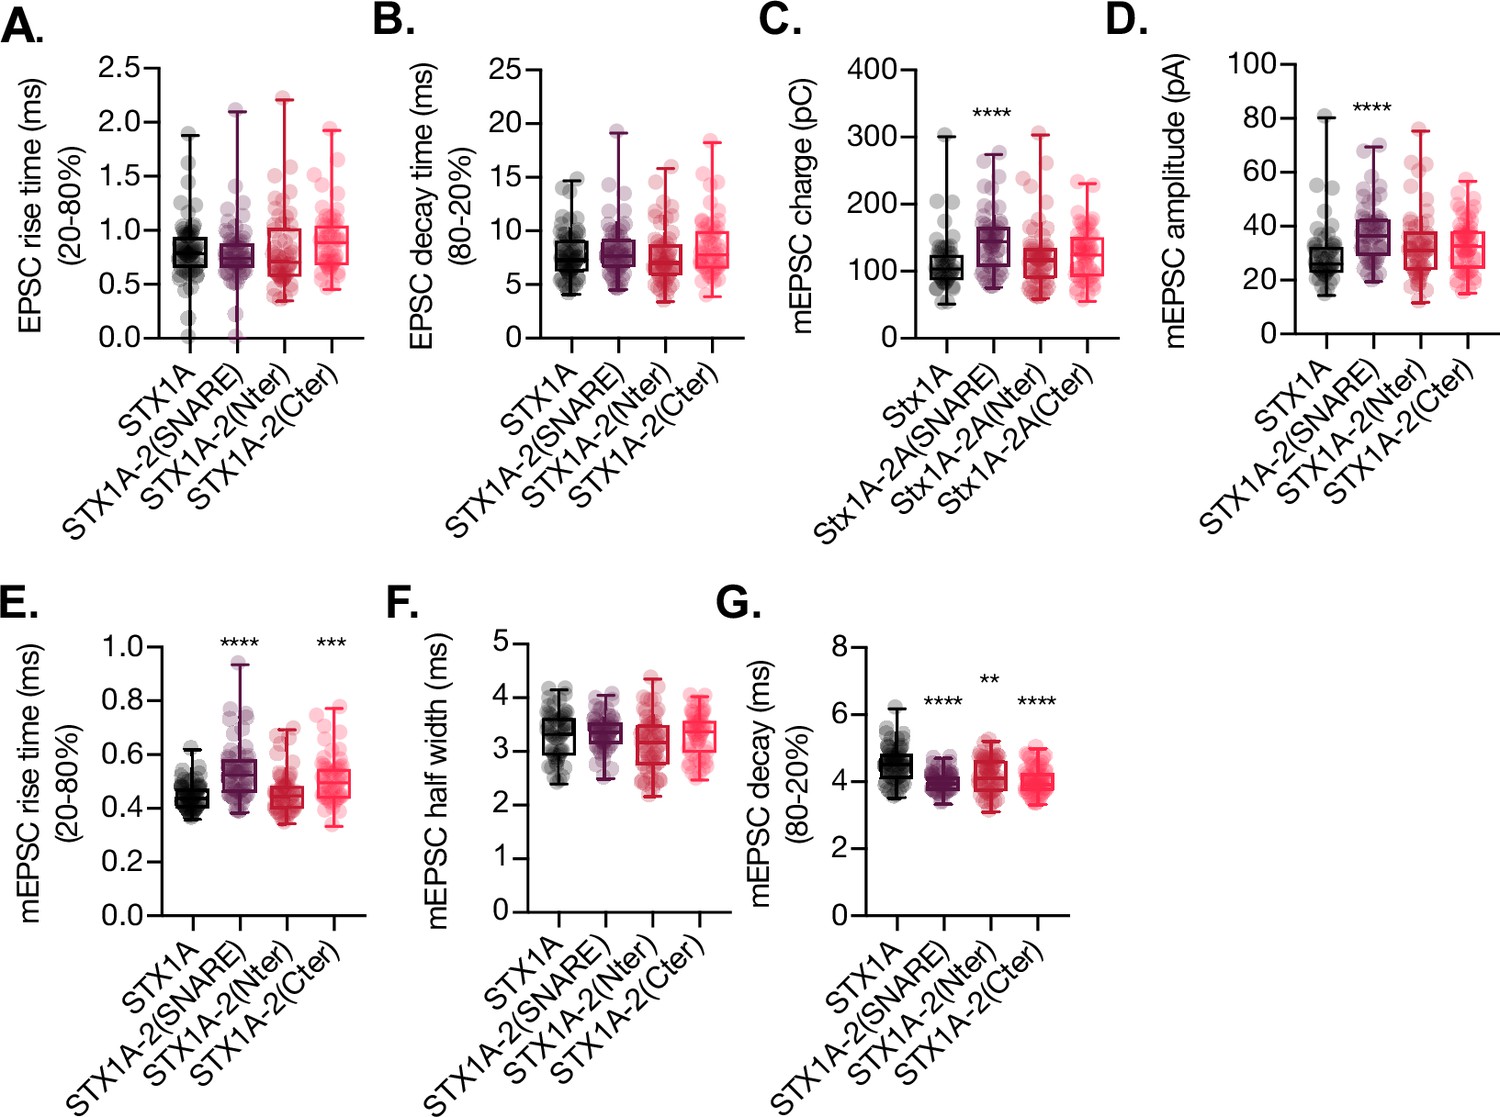
Quantification of kinetic parameters of the excitatory postsynaptic current (EPSC) and the miniature EPSC (mEPSC) of autaptic STX1A-null hippocampal mouse neurons rescued with STX1A, STX1A-2(SNARE), STX1A-2(Nter), or STX1A-2(Cter).
(A) Quantification of the rise time (20–80%) of the EPSC neurons. (B) Quantification of the decay time (80–20%) of the EPSC. (C) Quantification of the mEPSC charge. (D) Quantification of the mEPSC amplitude. (E) Quantification of the rise time (20–80%) of the mEPSC. (F) Quantification of the half-width of the mEPSC. (G) Quantification of the decay time of the mEPSC. (H) All electrophysiological recording were done on autaptic neurons. Data in (A–G) is shown as a whisker-box plot. Each data point represents single observations, middle line represents the median, boxes represent the distribution of the data, where the majority of the data points lie, and external data points represent outliers. Significances and p-values of data were determined by nonparametric Kruskal–Wallis test followed by Dunn’s post hoc test or by ordinary one-way ANOVA; *p≤0.05, **p≤0.01, ***p≤0.001, ****p≤0.0001. All data values are summarized in Figure 2—figure supplement 1—source data 1.
-
Figure 2—figure supplement 1—source data 1
Quantification of neurotransmitter release parameters of STX1-null neurons transduced with STX1A, STX1A-2(SNARE), STX1A-2(Nter) and STX1A-2(Cter).
- https://cdn.elifesciences.org/articles/90775/elife-90775-fig2-figsupp1-data1-v1.xlsx
Figure 3 with 1 supplement
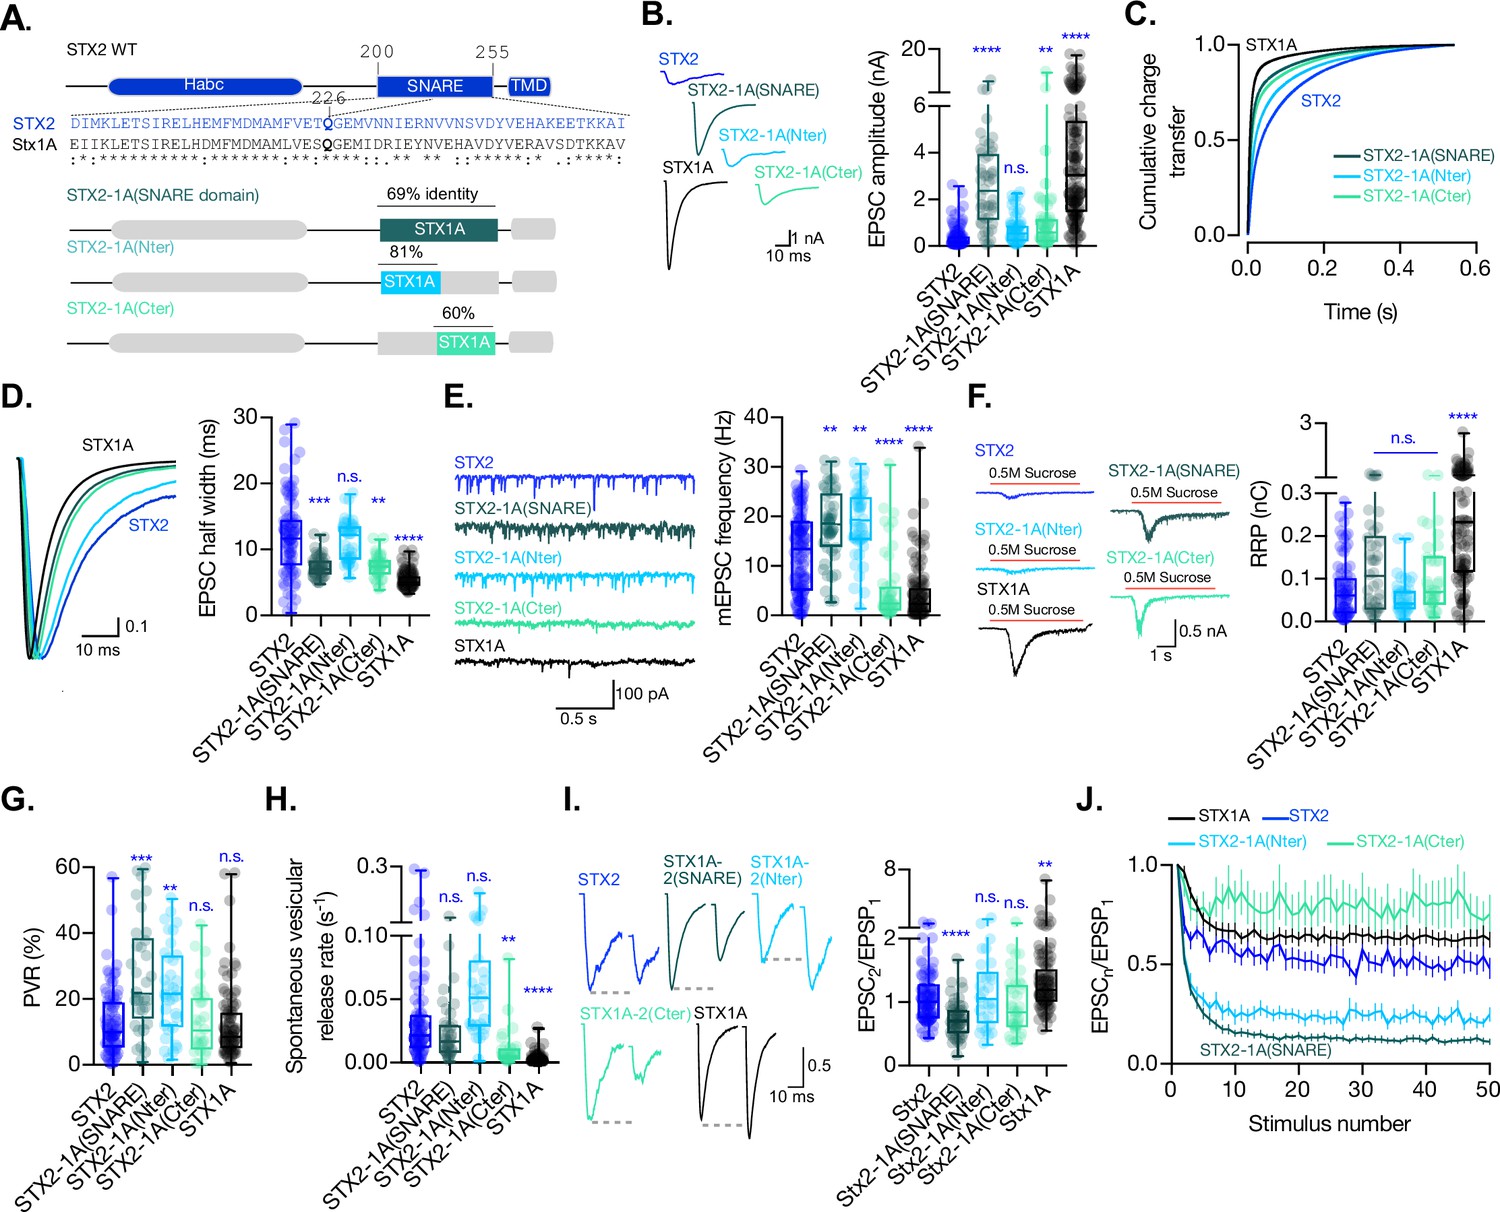
The C-terminal half of the SNARE domain of STX1A has a regulatory effect on the spontaneous release and the readily releasable pool (RRP), and the speed of Ca2+-evoked release depends on the integrity of the SNARE domain.
(A) STX2 WT and chimera domain structure scheme, sequence alignment of STX2 and STX1A SNARE domain, and percentage homology between both SNARE domains. (B) Example traces (left) and quantification of the excitatory postsynaptic current (EPSC) amplitude (right) from autaptic STX1A-null hippocampal mouse neurons rescued with STX2, STX2-1A(SNARE), STX2-1A(Nter), or STX2-1A(Cter). (C) Quantification of the cumulative charge transfer of the EPSC from the onset of the response until 0.55 s after. (D) Example traces of normalized EPSC to their peak amplitude (left) and quantification of the half-width of the EPSC (right). (E) Example traces (left) and quantification of the frequency of the miniature EPSC (mEPSC) (right). (F) Example traces (left) and quantification of the response induced by a 5 s 0.5 mM application of sucrose, which represents the RRP of vesicles. (G) Quantification of the vesicle release probability (PVR) as the ratio of the EPSC charge over the RRP charge (PVR). (H) Quantification of the spontaneous vesicular release rate as the ratio between the mEPSC frequency and number of vesicles in the RRP. (I) Example traces (left) and the quantification of a 40 Hz paired-pulse ratio (PPR). (J) Quantification of STP measured by 50 stimulations at 10 Hz. In (B, D-I), data is shown as whisker-box plot. Each data point represents single observations, middle line represents the median, boxes represent the distribution of the data, where the majority of the data points lie, and external data points represent outliers. Significances and p-values of data were determined by nonparametric Kruskal–Wallis test followed by Dunn’s post hoc test; *p≤0.05, **p≤0.01, ***p≤0.001, ****p≤0.0001. All data values are summarized in Figure 3—source data 1.
-
Figure 3—source data 1
Quantification of neurotransmitter release parameters of STX1-null neurons transduced with STX2, STX2-1A(SNARE), STX2-1A(Nter) and STX2-1A(Cter).
- https://cdn.elifesciences.org/articles/90775/elife-90775-fig3-data1-v1.xlsx
Figure 3—figure supplement 1
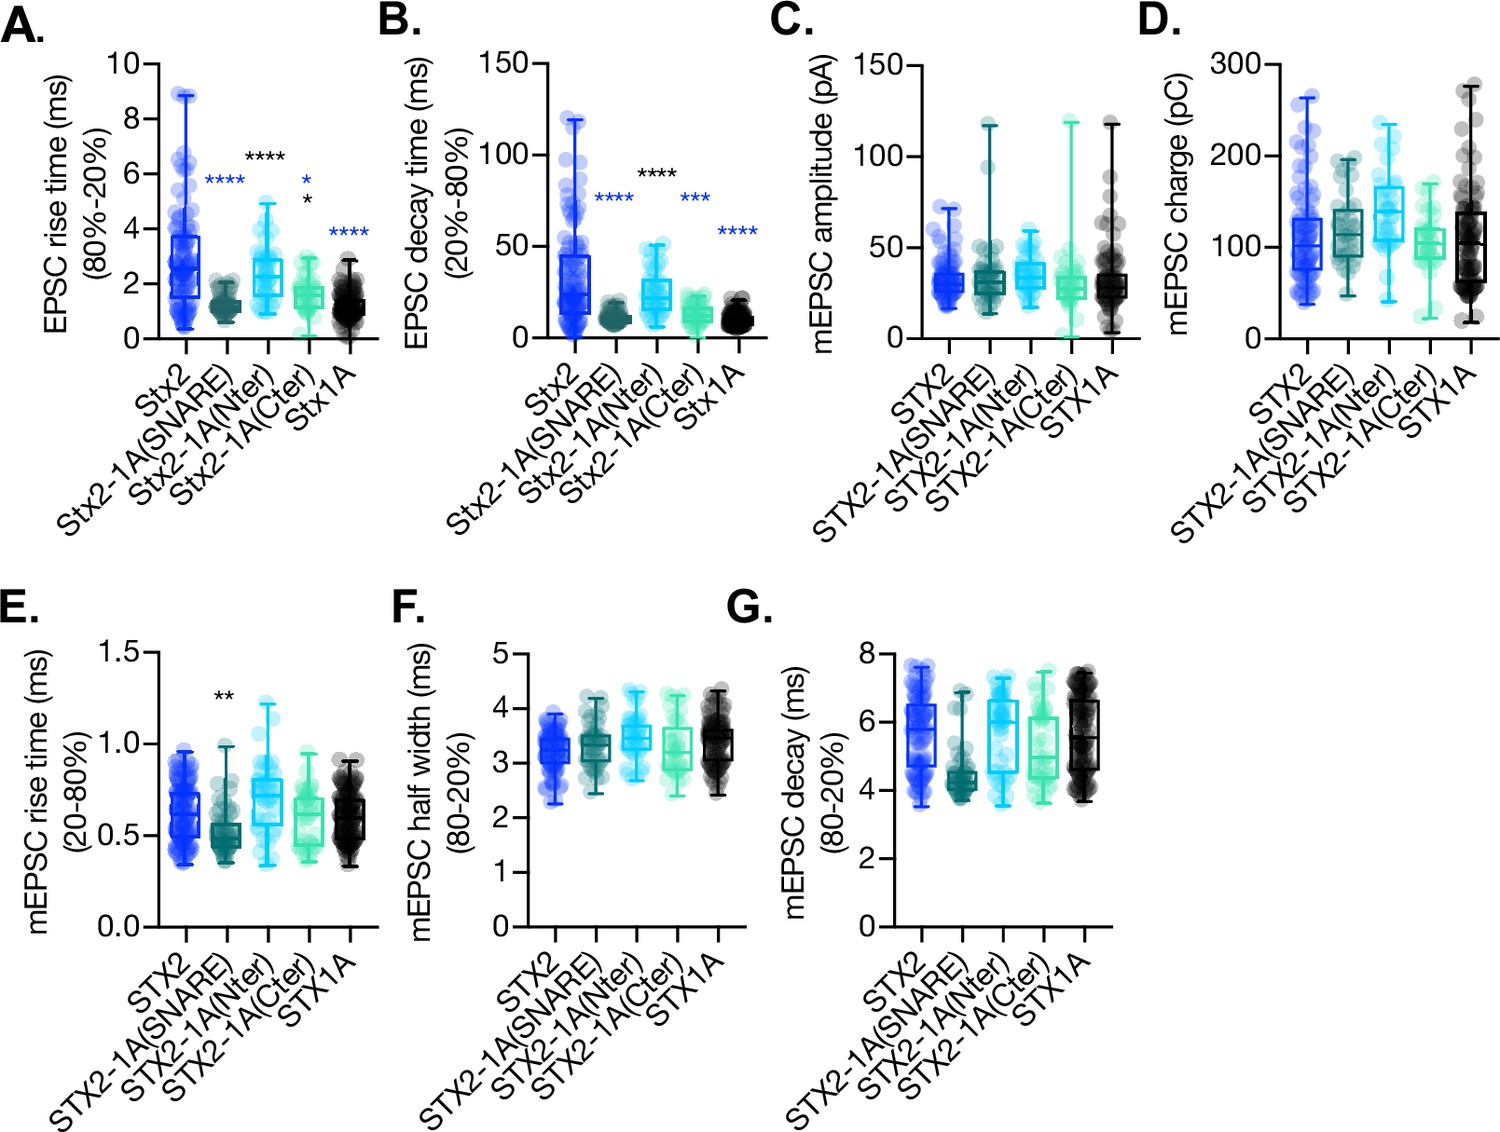
Quantification of kinetic parameters of the excitatory postsynaptic current (EPSC) and the miniature EPSC (mEPSC) of autaptic STX1A-null hippocampal mouse neurons rescued with STX2, STX2-1A(SNARE), STX2-1A(Nter), or STX2-1A(Cter).
(A) Quantification of the rise time (20–80%) of the EPSC. (B) Quantification of the decay time (80–20%) of the EPSC. (C) Quantification of the mEPSC charge. (D) Quantification of the mEPSC amplitude. (E) Quantification of the rise time (20–80%) of the mEPSC. (F) Quantification of the half-width of the mEPSC. (G) Quantification of the decay time of the mEPSC. Data in (A–G) is shown as a whisker-box plot. Each data point represents single observations, middle line represents the median, boxes represent the distribution of the data, where the majority of the data points lie, and external data points represent outliers. Significances and p-values of data were determined by nonparametric Kruskal–Wallis test followed by Dunn’s post hoc test or by ordinary one-way ANOVA; **p≤0.05, **p≤0.01, ***p≤0.001, ****p≤0.0001. All data values are summarized in Figure 3—figure supplement 1—source data 1.
-
Figure 3—figure supplement 1—source data 1
Quantification of neurotransmitter release parameters of STX1-null neurons transduced with STX2, STX2-1A(SNARE), STX2-1A(Nter) and STX2-1A(Cter).
- https://cdn.elifesciences.org/articles/90775/elife-90775-fig3-figsupp1-data1-v1.xlsx
Figure 4
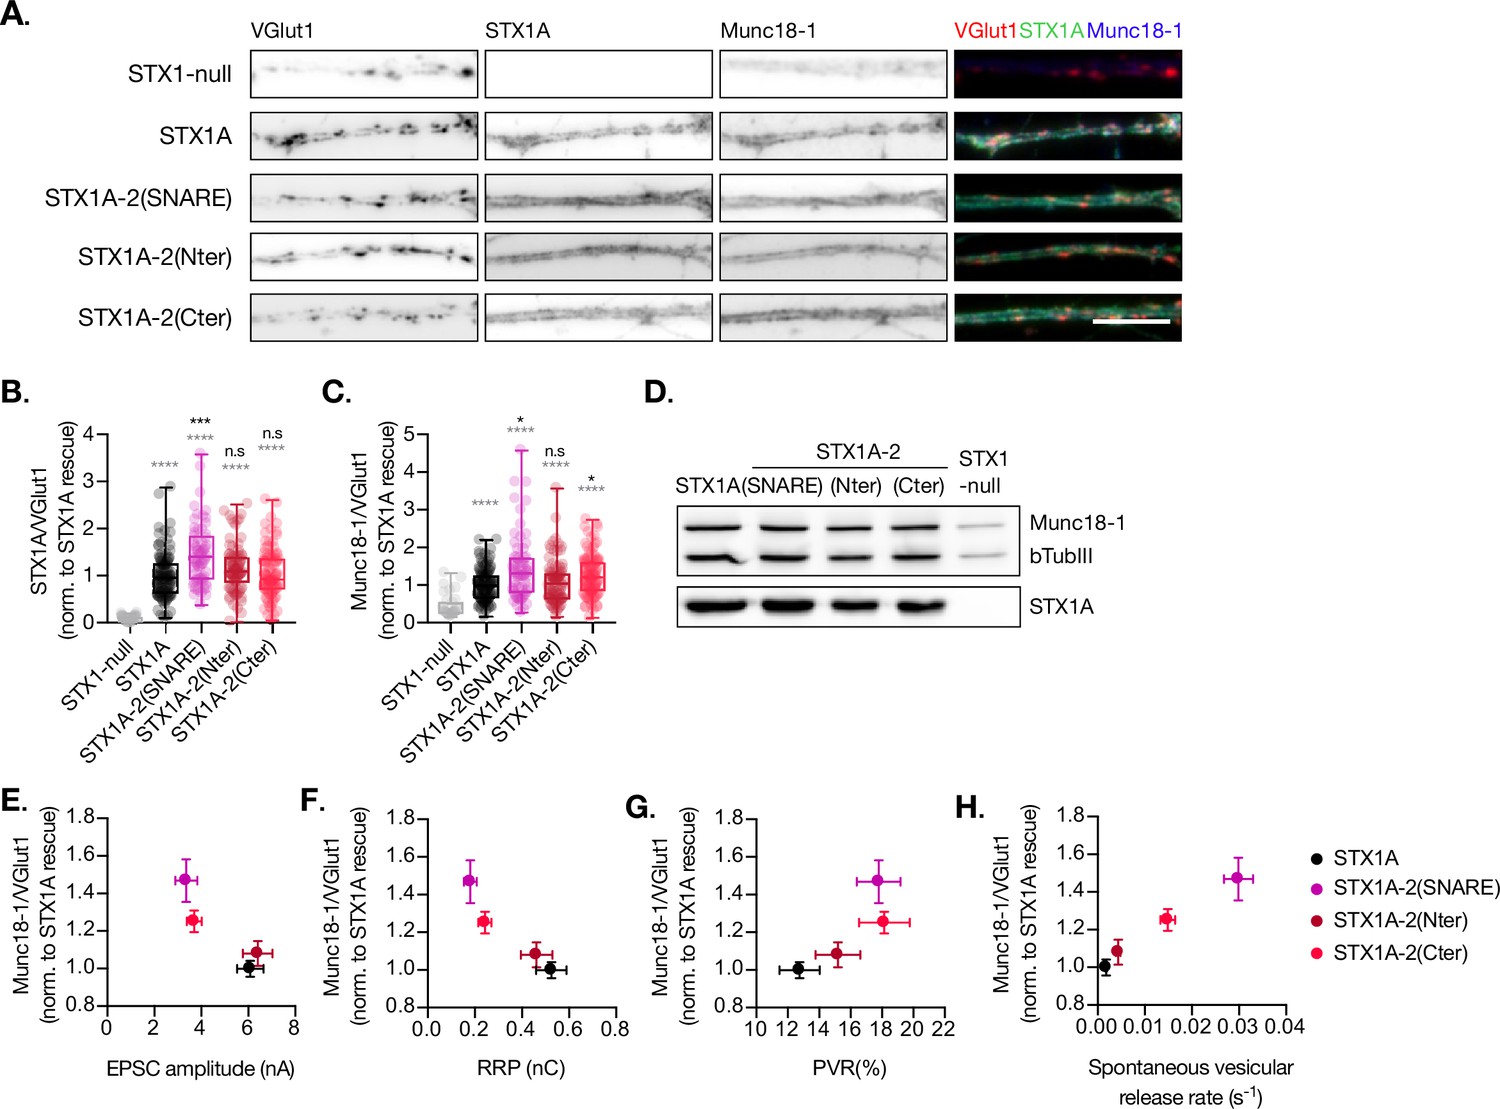
Quantification of STX1A and Munc18-1 levels at the synapse.
(A) Example images of Stx1-null neurons plated in high-density cultures and rescued with STX1A, STX1A-2(SNARE), STX1A-2(Nter), or STX1A-2(Cter) or GFP (STX1-null) as negative control. Neurons were fixed between days in vitro (DIV)14–16. Cultures were stained with fluorophore-labeled antibodies that recognize VGlut1 (red in merge), STX1A (green in merge), and Munc18-1 (blue in merge), from left to right. Scale bar: 10 μm. (B) Quantification of the immunofluorescent intensity of STX1A normalized to the intensity of the same VGlut1-labeled ROIs. Values were normalized to values in the STX1A rescue group. (C) Quantification of the immunofluorescent intensity of Munc18-1 normalized to the intensity of the same VGlut1-labeled ROIs. Values were normalized to values in the STX1 rescue group. (D) SDS-PAGE of the electrophoretic analysis of neuronal lysates obtained from each experimental group. Proteins were detected using antibodies that recognize β-tubuline III as loading control, STX1A, and Munc18-1. (E) Correlation between Munc18-1 values and excitatory postsynaptic current (EPSC) amplitude of Stx1-null neurons expressing STX1A, STX2, STX2-1A(SNARE), STX2-1A(Nter), or STX2-1A(Cter). (A) Correlation between Munc18-1 values and readily releasable pool (RRP). (B) Correlation between Munc18-1 values and probability of release (PVR). (C) Correlation between Munc18-1 values and spontaneous vesicular release rate. In (B, C), data is shown as a whisker-box plot. Each data point represents single ROIs, middle line represents the median, boxes represent the distribution of the data, where the majority of the data points lie, and external data points represent outliers. In (E–H), each data point is the correlation of the mean ± SEM. Significances and p-values of data were determined by nonparametric Kruskal–Wallis test followed by Dunn’s post hoc test; *p≤0.05, **p≤0.01, ***p≤0.001, ****p≤0.0001. All data values are summarized in Figure 4—source data 1.
-
Figure 4—source data 1
Quantification of STX1A and Munc18 levels in STX1-null neurons transduced with STX1A, STX1A-2(SNARE), STX1A-2(Nter) and STX1A-2(Cter).
- https://cdn.elifesciences.org/articles/90775/elife-90775-fig4-data1-v1.xlsx
-
Figure 4—source data 2
Whole SDS-PAGE image represented in Figure 4.
- https://cdn.elifesciences.org/articles/90775/elife-90775-fig4-data2-v1.zip
Figure 5
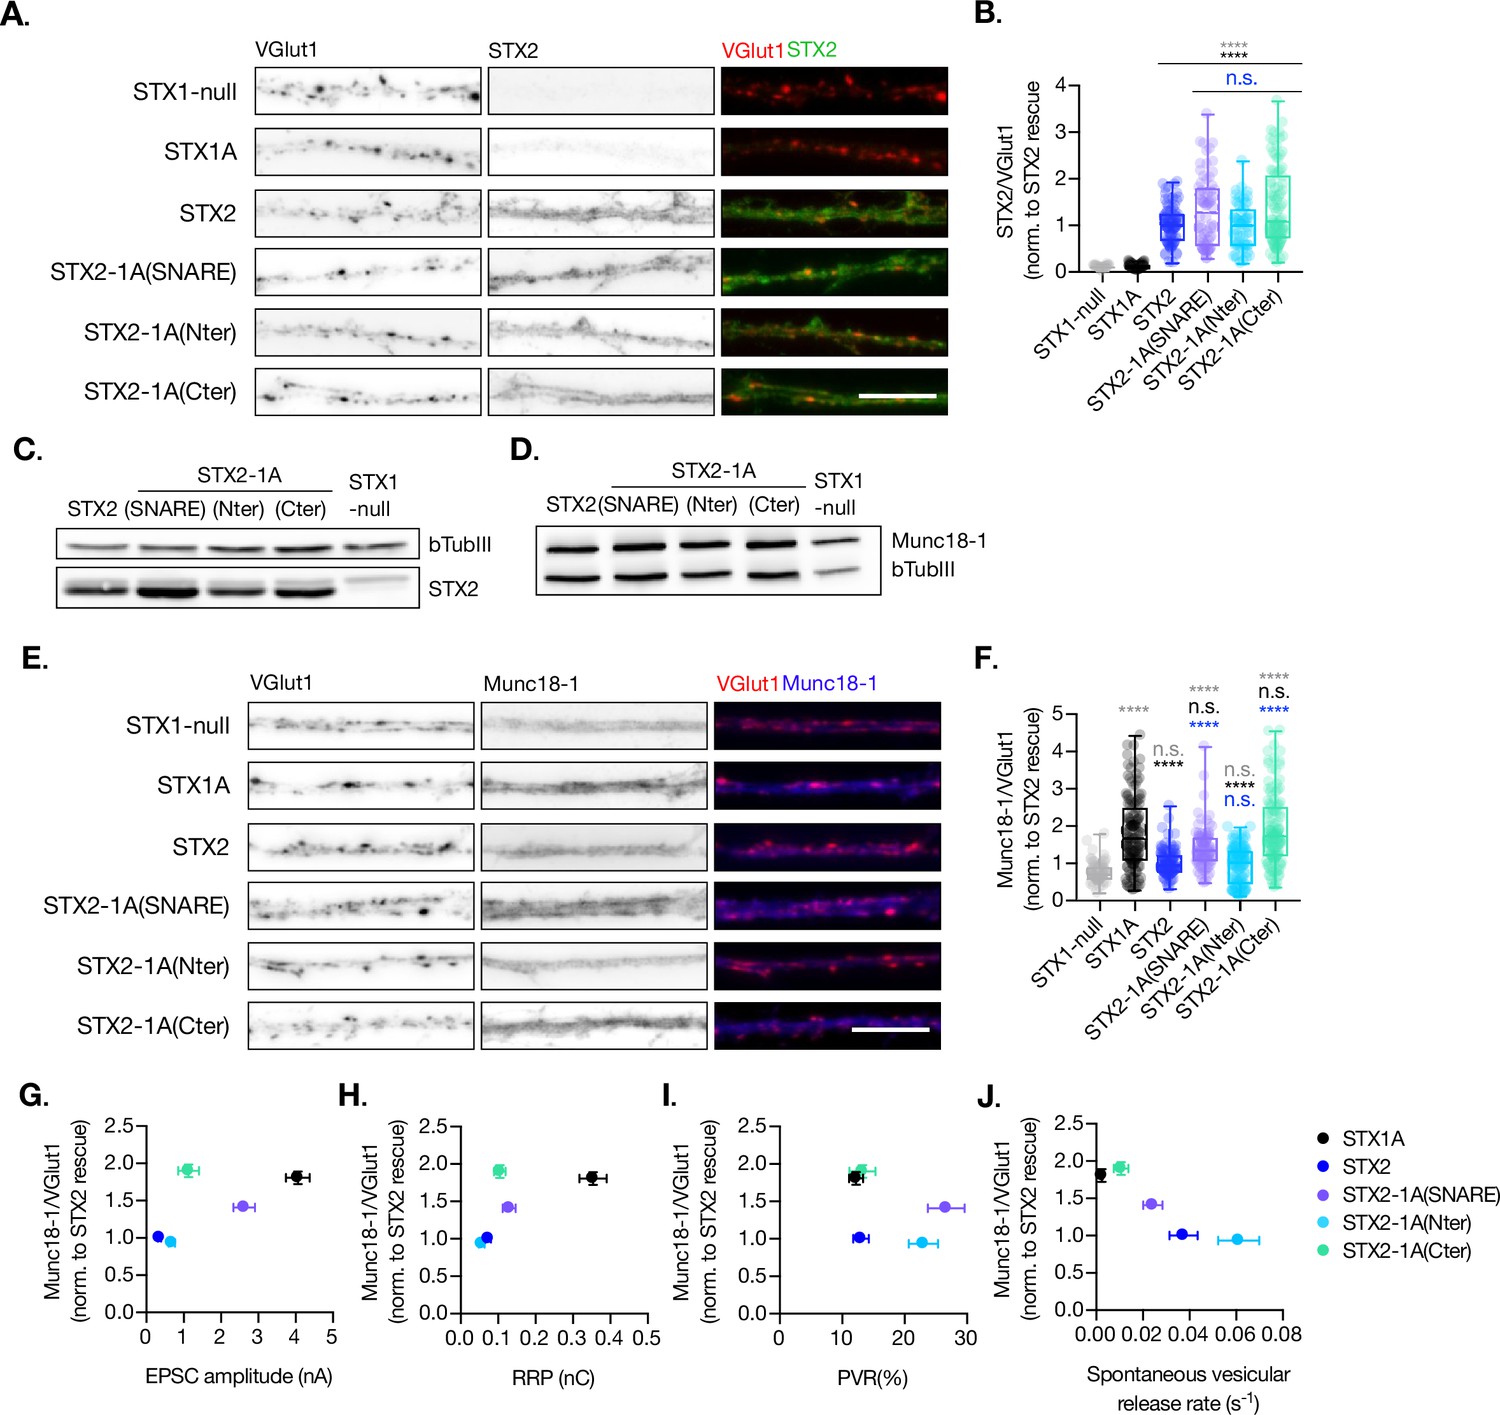
Quantification of STX2 and Munc18-1 levels at the synapse.
(A) Example images of Stx1-null neurons plated in high-density cultures and rescued with STX1A, STX2, STX2-1A(SNARE), STX2-1A(Nter), STX2-1A(Cter), or GFP (STX1-null) as negative control. Neurons were fixed between days in vitro (DIV)14–16 . (A) Example images of neurons stained with fluorophore-labeled antibodies that recognize VGlut1 (red in merge) and STX2 (green in merge), from left to right. Scale bar: 10 μm. (B) Quantification of the immunofluorescent intensity of STX2 normalized to the intensity of the same VGlut1-labeled ROIs. Values were normalized to values in the STX2 rescue group. (C) SDS-PAGE of the electrophoretic analysis of neuronal lysates obtained from each experimental group. Proteins were detected using antibodies that recognize β-tubuline III as loading control and STX2. (D) SDS-PAGE of the electrophoretic analysis of neuronal lysates obtained from each experimental group. Proteins were detected using antibodies that recognize β-tubuline III and Munc18-1. (E) Example images of neurons stained with fluorophore-labeled antibodies that recognize VGlut1 (red in merge) and Munc18-1 (blue in merge), from left to right. Scale bar: 10 μm. (F) Quantification of the immunofluorescent intensity of Munc18-1 normalized to the intensity of the same VGlut1-labeled ROIs. Values were normalized to values in the STX2 rescue group. (G) Correlation between Munc18-1 values and excitatory postsynaptic current (EPSC) amplitude of STX1-null neurons expressing STX1A, STX2, STX2-1A(SNARE), STX2-1A(Nter), or STX2-1A(Cter). (H) Correlation between Munc18-1 values and readily releasable pool (RRP). (I) Correlation between Munc18-1 values and probability of release (PVR). (J) Correlation between Munc18-1 values and spontaneous vesicular release rate. In (B, F), data is shown as a whisker-box plot. Each data point represents single ROIs, middle line represents the median, boxes represent the distribution of the data, where the majority of the data points lie, and external data points represent outliers. In (G–J), each data point is the correlation of the mean ± SEM. Significances and p-values of data were determined by nonparametric Kruskal–Wallis test followed by Dunn’s post hoc test; *p≤0.05, **p≤0.01, ***p≤0.001, ****p≤0.0001. All data values are summarized in Figure 5—source data 1.
-
Figure 5—source data 1
Quantification of STX2 and Munc18 levels in STX1-null neurons transduced with STX2, STX2-1A(SNARE), STX2-1A(Nter) and STX2-1A(Cter).
- https://cdn.elifesciences.org/articles/90775/elife-90775-fig5-data1-v1.xlsx
-
Figure 5—source data 2
Whole SDS-PAGE image represented in Figure 5.
- https://cdn.elifesciences.org/articles/90775/elife-90775-fig5-data2-v1.zip
Figure 6 with 1 supplement
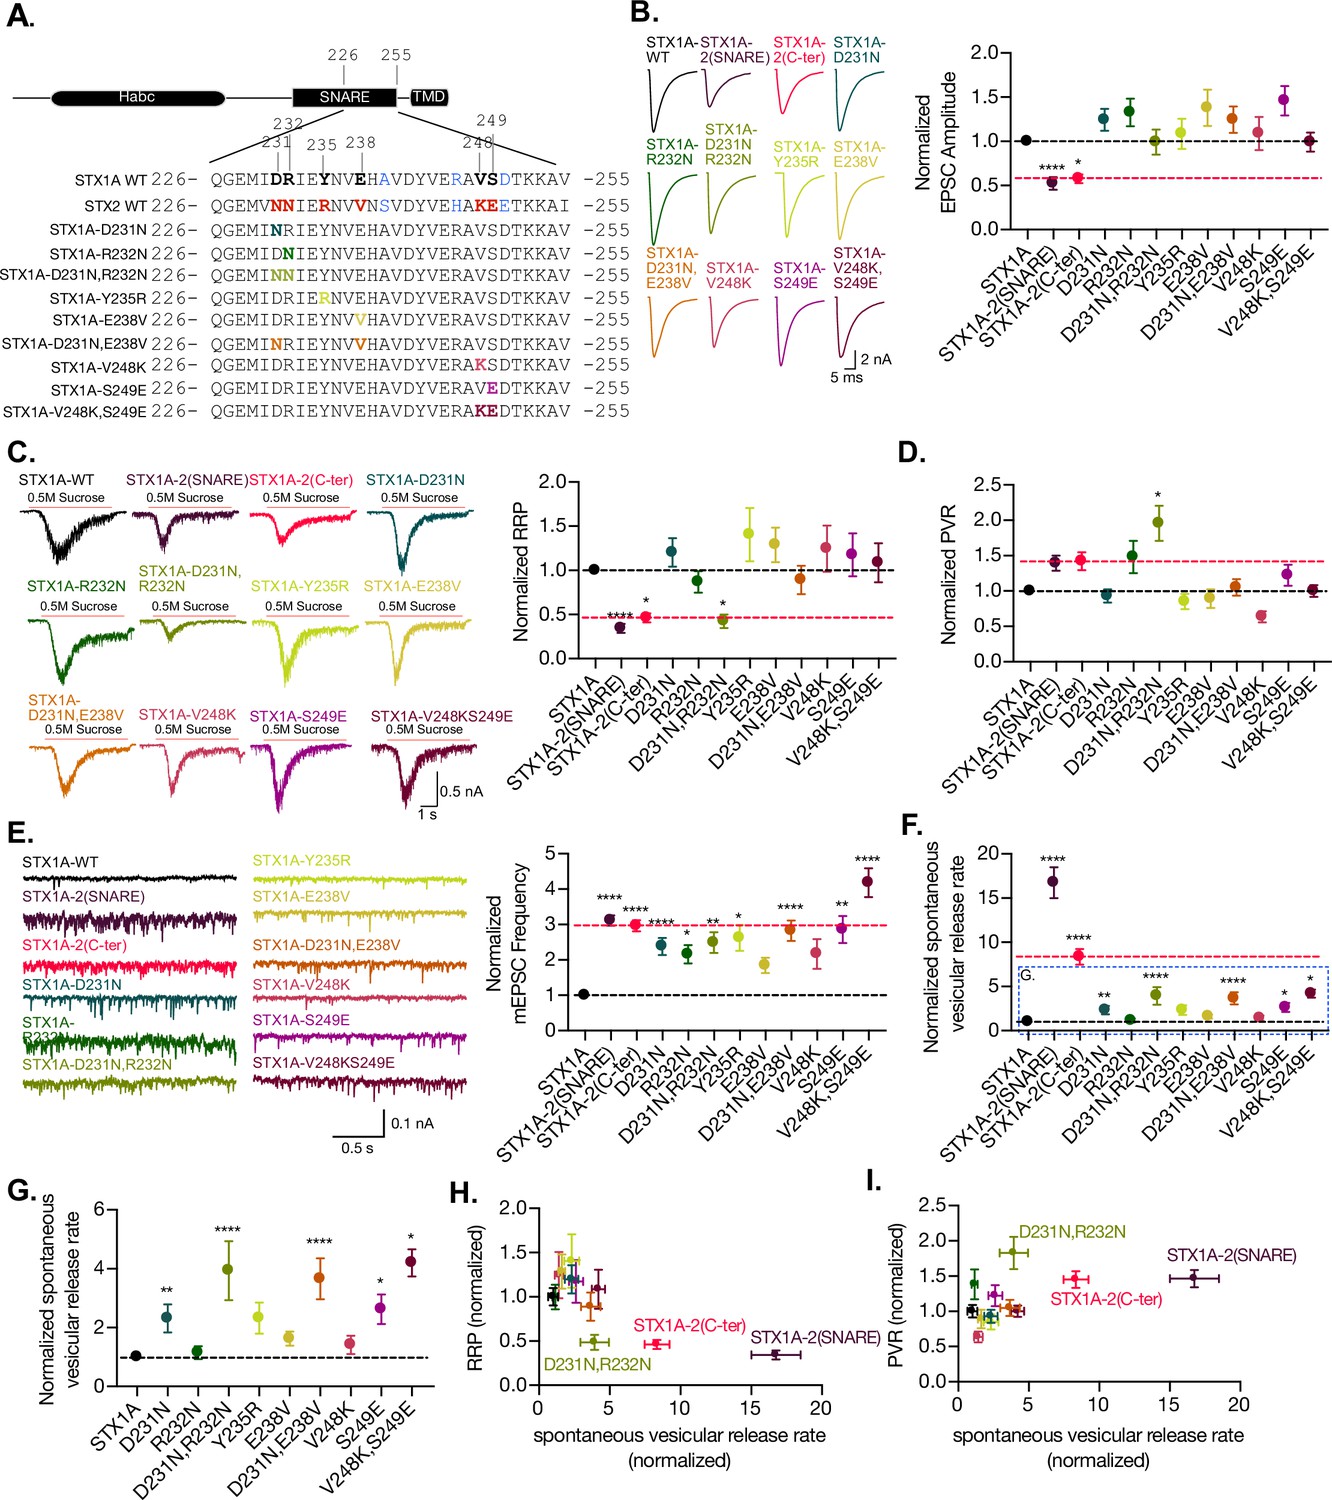
The charge in the outer-surface residues in the C-terminal half of the SNARE domain is important for clamping spontaneous release, and D231,R232 are important in the stabilization of the pool and the efficiency of Ca2+-evoked release.
(A) Sequence of the C-terminal half of STX1A and STX2 and single- and double-point mutations in the sequence of STX1A WT. (B) Example traces (left) and quantification of the excitatory postsynaptic current (EPSC) amplitude (right) from autaptic STX1A-null hippocampal mouse neurons rescued with STX1A, STX1AD231N, STX1AR232N, STX1AY235R, STX1AE238V, STX1AV248K, STX1AS249E STX1AD231N,R232N, and STX1AV248K,S249E. (C) Example traces (left) and quantification of the response induced by a 5 s 0.5 M application of sucrose, which represents the readily releasable pool of vesicles (RRP). (D) Quantification of the vesicle release probability (PVR) as the ratio of the EPSC charge over the RRP charge (PVR). (E) Example traces (left) and quantification of the frequency of the miniature EPSC (mEPSC) (right). (F) Quantification of the spontaneous vesicular release rate as the ratio between the mEPSC frequency and number of vesicles in the RRP. (G) Quantification of the spontaneous vesicular release rate as the ratio between the mEPSC frequency and number of vesicles in the RRP but STX1A-2(SNARE) and STX1A-2(Cter) chimeras were removed. (H) Correlation between the RRP and the spontaneous vesicular release rate. Both values are normalized to STX1A WT. (I) Correlation between the PVR and the spontaneous vesicular release rate. Values are normalized to STX1A WT. (B–H) All electrophysiological recording were done on autaptic neurons. Between 30 and 35 neurons per group from three independent cultures were recorded. Values from the STX1A-2(SNARE) and STX1A-2(Cter) groups were taken from the experiments done in Figure 2 and normalized to their own STX1A WT control and used here for visual comparison. Data points represent the mean ± SEM. Significances and p-values of data were determined by nonparametric Kruskal–Wallis test followed by Dunn’s post hoc test; *p≤0.05, **p≤0.01, ***p≤0.001, ****p≤0.0001. All data values are summarized in Figure 6—source data 1.
-
Figure 6—source data 1
Quantification of neurotransmitter release parameters of STX1-null neurons transduced with STX1AD231N, STX1AR232N, STX1AY235R, STX1AE238V, STX1AV248K, STX1AS249E, STX1AD231N,R232N, and STX1AV248K,S249E.
- https://cdn.elifesciences.org/articles/90775/elife-90775-fig6-data1-v1.xlsx
Figure 6—figure supplement 1
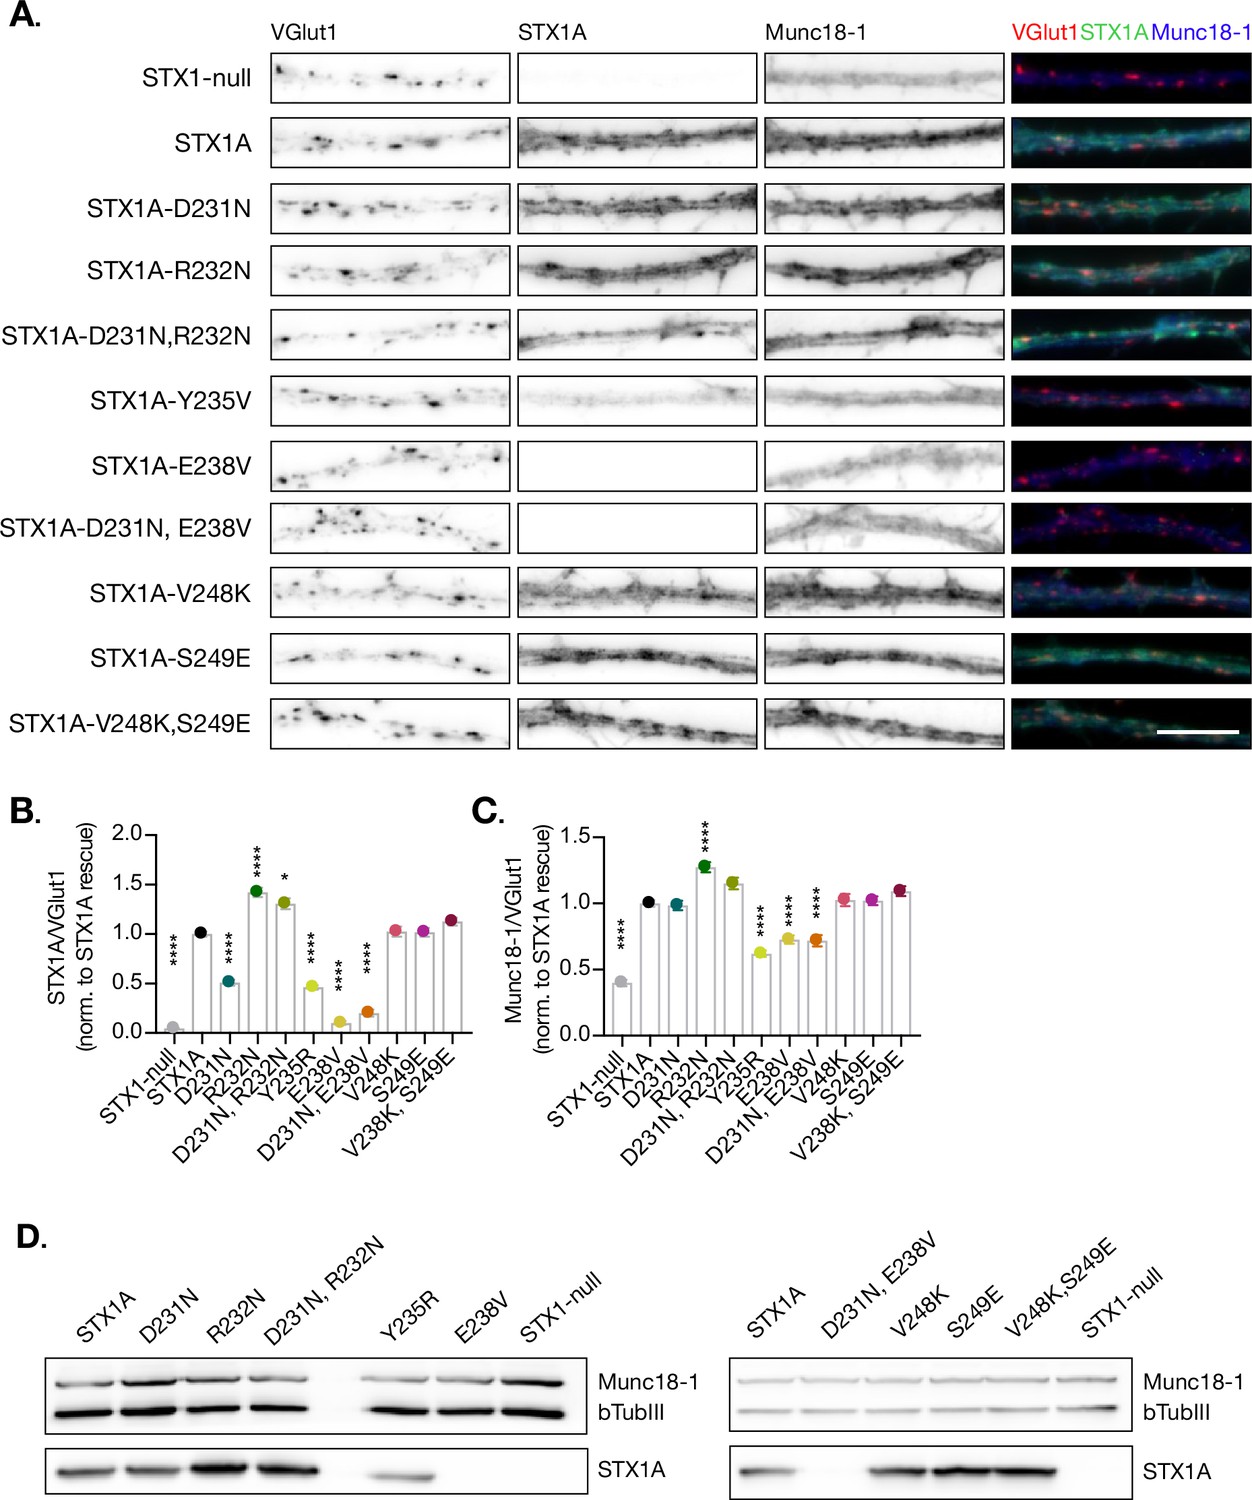
Quantification of STX2 levels at the synapse.
(A) Example images of Stx1-null neurons plated in high-density cultures and rescued with STX1A, STX2, STX2-1A(SNARE), STX2-1A(Nter), STX2-1A(Cter), or GFP (STX1-null) as negative control. Neurons were fixed between days in vitro (DIV)14–16. Neurons were stained with fluorophore-labeled antibodies that recognize VGlut1 (red in merge), STX1A (green in merge), and Munc18-1 (blue in merge) from left to right. Scale bar: 10 μm. (B) Quantification of the immunofluorescent intensity of STX1A normalized to the intensity of the same VGlut1-labeled ROIs. Values were normalized to STX1A WT values. (C) Quantification of the immunofluorescent intensity of Munc18-1 normalized to the intensity of the same VGlut1-labeled ROIs. Values were normalized to STX1A WT values. (D) SDS-PAGE of the electrophoretic analysis of neuronal lysates obtained from each experimental group. Proteins were detected using antibodies that recognize β-tubuline III as loading control and STX1A and Munc18-1. In (B, C), data points represent the mean ± SEM. Also, 7–9 images per group per culture were obtained and 3–5 ROI per image were analyzed. Three replicates per group. Significances and p-values of data were determined by nonparametric Kruskal–Wallis test followed by Dunn’s post hoc test; *p≤0.05, **p≤0.01, ***p≤0.001, ****p≤0.0001. All data values are summarized in Figure 6—figure supplement 1—source data 1.
-
Figure 6—figure supplement 1—source data 1
Quantification of STX1A and Munc18-1 levels in STX1-null neurons transduced with STX1AD231N, STX1AR232N, STX1AY235R, STX1AE238V, STX1AV248K, STX1AS249E, STX1AD231N,R232N, and STX1AV248K,S249E.
- https://cdn.elifesciences.org/articles/90775/elife-90775-fig6-figsupp1-data1-v1.xlsx
Figure 7
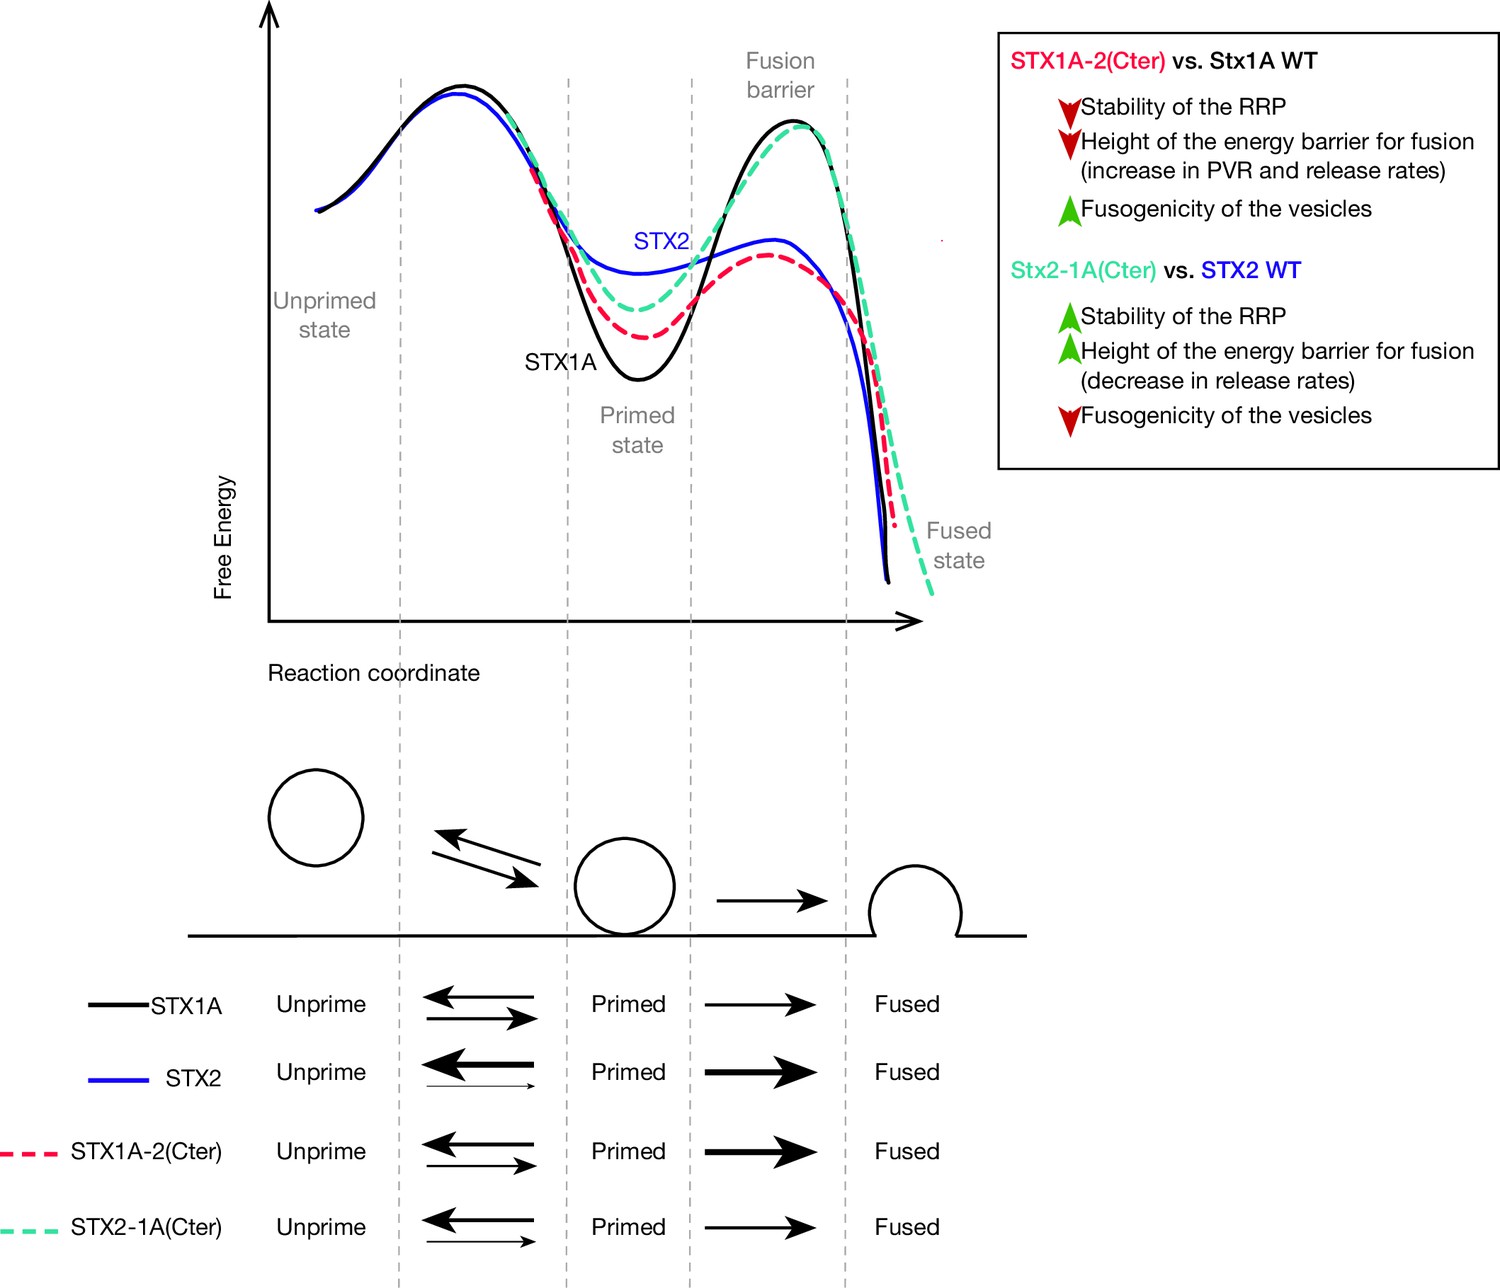
Speculative model based on the most important changes in electrophysiological properties found in STX1A-chimeras or STX2-chimeras compared to their WT isoforms.
Energy landscape for priming and fusion of synaptic vesicles that have SNARE complexes formed with STX1A WT (black line), STX1A-2(SNARE or Cter) (red dotted line), STX2 WT (blue line), and STX2-1A(Cter) (light green dotted line). Summarized conclusions of our results based on the speculative model in. Changes in the equilibrium between the unprimed/primed state (reflecting the stability of the primed state) and the rate of fusion (energy landscape for fusion adapted from Sørensen, 2009).
Download links
A two-part list of links to download the article, or parts of the article, in various formats.
Downloads (link to download the article as PDF)
Open citations (links to open the citations from this article in various online reference manager services)
Cite this article (links to download the citations from this article in formats compatible with various reference manager tools)
The stability of the primed pool of synaptic vesicles and the clamping of spontaneous neurotransmitter release rely on the integrity of the C-terminal half of the SNARE domain of syntaxin-1A
eLife 12:RP90775.
https://doi.org/10.7554/eLife.90775.3


