Overcoming the nutritional immunity by engineering iron-scavenging bacteria for cancer therapy
- Institute of Biomedical Sciences, Academia Sinica, Taiwan
- Doctoral Degree Program of Translational Medicine, National Yang Ming Chiao Tung University and Academia Sinica, Taiwan
- Department of Chemistry, National Taiwan University, Taiwan
Figures
Figure 1 with 2 supplements
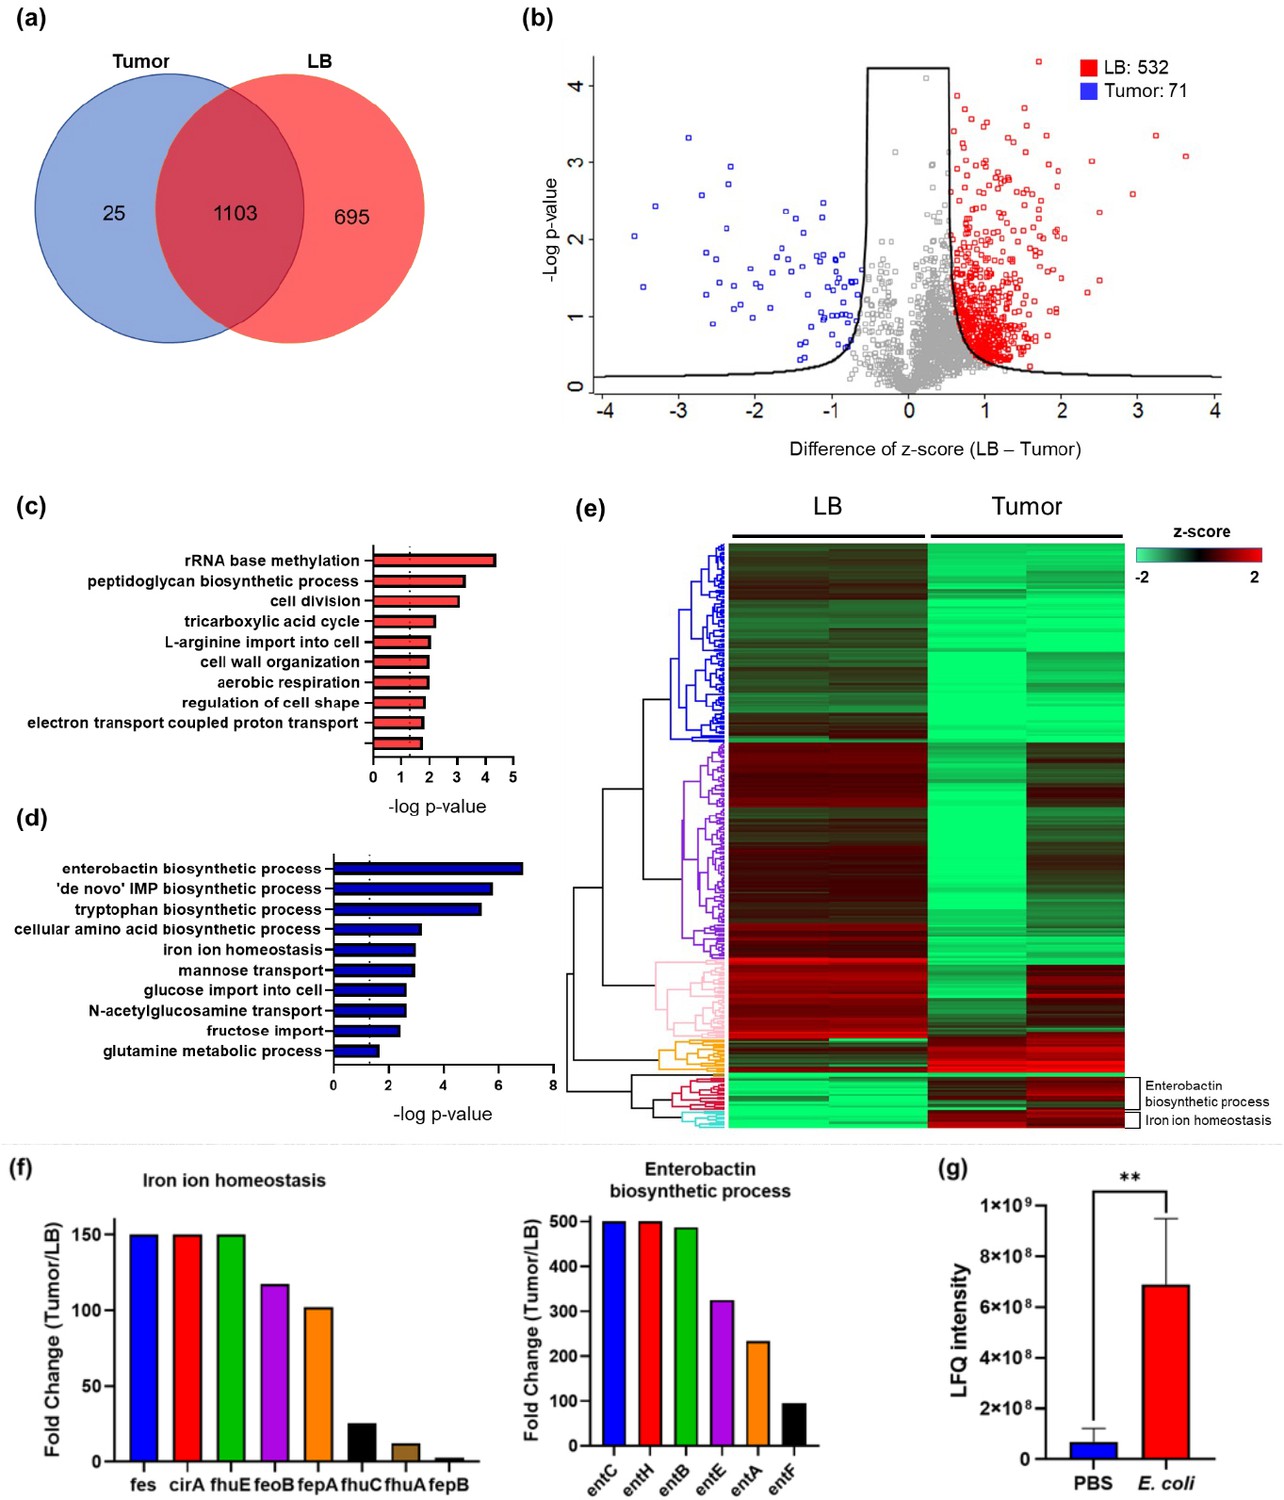
The quantitative proteomic analysis of E. coli in the rich medium and the tumor microenvironment.
(a) The Venn diagram of the E. coli protein IDs identified in the rich medium and in the tumor microenvironment (TME). (b) The volcano plot of the E. coli protein IDs quantified in the rich medium and in the TME. (c) The Gene Ontology (GO)-term analysis of the protein IDs enriched in the rich medium condition. (d) The GO-term analysis of the protein IDs enriched in the tumor condition. (e) The hierarchical clustering analysis of the protein IDs identified in the rich medium and in the TME. Each column is a biological replicate. (f) Left: the fold changes of individual proteins in the iron ion homeostasis process. These proteins are involved in transporting or processing the iron ions. Right: the fold changes of individual proteins in the enterobactin biosynthesis process. (g) Label-free quantification of lipocalin 2 (LCN2) in the tumors with and without E. coli inoculation. The error bars represent mean ± SD. Statistical analyses were performed by Student’s t-test (**p<0.01).
Figure 1—figure supplement 1

Workflow of quantitative proteomics for E. coli cultured in rich medium and E. coli colonized in murine tumors.
The E. coli BL21(DE3) were harvested from rich medium and tumors, respectively, and subject to the liquid chromatography-tandem mass spectrometry (LC-MS/MS) analysis.
Figure 1—figure supplement 2

STRING network analysis.
The proteins involving enterobactin biosynthesis and iron ion homeostasis were enriched in the E. coli colonized in tumors. The STRING diagram was drawn for the representative proteins in these two processes. The node size represents the fold change (tumor/rich medium) of the protein determined by the label-free quantification method. The different interior colors of the nodes represent various biological processes defined by Gene Ontology (GO) terms. The lines indicate the existence of experimental evidence between the connected nodes.
Figure 2 with 2 supplements

Combination of iron chelator and diguanylate cyclase (DGC)-E. coli for cancer therapy.
(a) Toxicity profiles of various iron chelators against MC38 cancer cells and E. coli. (b) Identification of cyclic-di-GMP secretion from DGC-E. coli by liquid chromatography-tandem mass spectrometry (LC-MS/MS). The precursor ion and the fragmented product ions correspond to the correct molecule weights of cyclic di-GMP (CDG). (c) IFN-β secretion by RAW264.7 cells treated with the supernatants from wild-type E. coli or DGC-E. coli. (d) Schematic illustration of mouse treatments. The DGC-E. coli was intratumorally delivered on Day 0 and Day 9, whereas VLX600 was intravenously administrated every three days from Day 0 to Day 9. (e) Tumor growth curve for various treatment groups. The complete remission was only achieved in the CDG + VLX600 group (CR = 2/4). (f) The Kaplan-Meier analysis for different treatment groups. The mouse was considered dead when the tumor volume exceeded 1500 mm3. The error bars represent mean ± SD. Statistical analyses were performed by Student’s t-test (*p<0.05).
Figure 2—figure supplement 1

High concentration of cyclic-di-GMP partially blocks lipocalin 2 (LCN2).
E. coli (1×10⁴) were cultured in RPMI medium supplemented with LCN2 at 0.15 µM and Cyclic-di-GMP at 7.5 µM overnight. The number of survival bacteria were determined by plating the overnight culture on the LB agar plates. The survival rate was normalized to the no-treatment group.
Figure 2—figure supplement 2

Tumor re-challenge experiments in mice.
The mice cured by diguanylate cyclase (DGC)-E. coli and VLX600 combination therapy were re-challenged with the same cell line (MC38) subcutaneously at the opposite flank. No tumor growth was observed. The naïve mice were used as controls.
Figure 3 with 1 supplement

Characterization of IroA-E. coli for anti-tumor activity.
(a) E. coli viability in varying concentrations of lipocalin 2 (LCN2) protein. The ΔentE strain, which could not generate enterobactin, was used as a negative control. (b) Iron-consuming ability of E. coli determined by the chrome azurol S (CAS) assay reagent. (c) Cytotoxicity of enterobactin on the MC38 colon cancer cells. The enterobactin was extracted from an equal supernatant volume of the wild-type (WT)-E. coli or the IroA-E. coli culture. The extraction buffer (DMSO) was used as a negative control. (d) Treatment schedule of IroA-E. coli in tumor-bearing mice. Two intratumoral injections were administered on Day 0 and Day 9. (e) Tumor growth curves across various treatment groups. (f) The Kaplan-Meier analysis for the mice in different treatment groups. (g) E0771 breast tumor growth curves for the different treatment groups. (h) Survival curves for mice in different treatment groups. (i) B16F10 melanoma tumor growth curves for the different treatment treatment groups. (j) Survival curves for mice in the different treatment groups. (k) The bacterial burden from the blood of mice on days 1, 3, and 7 following intravenous administration with different bacteria. (l) Whole blood cell analyses for the different treatment groups. The error bars represent mean ± SD. Statistical analyses were performed by one-way ANOVA (**p<0.01).
Figure 3—figure supplement 1

The tumor growth curves of individual mice in MC38, E0771, B16F10 tumor models.
(a) The tumor growth curves of individual mice in MC38 tumor model (b) The tumor growth curves of individual mice in E0771 tumor model (c) The tumor growth curves of individual mice in B16F10 tumor model.
Figure 4

Quantitative proteomic analysis comparing IroA-E. coli and wild-type (WT)-E. coli in the tumor microenvironment (TME).
(a) Volcano plot analysis between the proteomes of WT-E. coli and IroA-E. coli in the mouse tumors. (b) Fold changes of the proteins involved in the iron ion homeostasis. All the fold changes are >1. (c) Fold changes of the proteins involved in the enterobactin biosynthetic process. All the fold changes are >1. (d) Fold changes of transferrin and transferring receptor in the tumor.
Figure 5 with 1 supplement

IroA-E.coli treatment stimulated the adaptive immune system for anti-tumor activity.
(a) The mice cured by IroA-E. coli were re-challenged with a subcutaneous inoculation of 2.5×10⁵ MC38 cells. No tumor formation was observed. The naïve mice were used as controls. (b) The proportions of tumor-infiltrating CD4+ and CD8+ T cells in different treatment groups. (c) The tumor-bearing mice were treated with IroA-E. coli in the presence or absence of the anti-CD8 depletion antibody. (d) Survival curves of mice in different treatment groups. The error bars represent mean ± SD. Statistical analyses were performed by one-way ANOVA (**p<0.01, ***p<0.001).
Figure 5—figure supplement 1

IroA-E. coli treatment resulted in higher bacterial colonization in tumors as compared to wild-type (WT) bacteria.
The bacteria were intratumorally delivered to tumor-bearing mice for 15 days. The tumors were collected and homogenized for measuring the bacteria number. The number of survival bacteria was determined by plating the overnight culture on the LB agar plates.
Figure 6
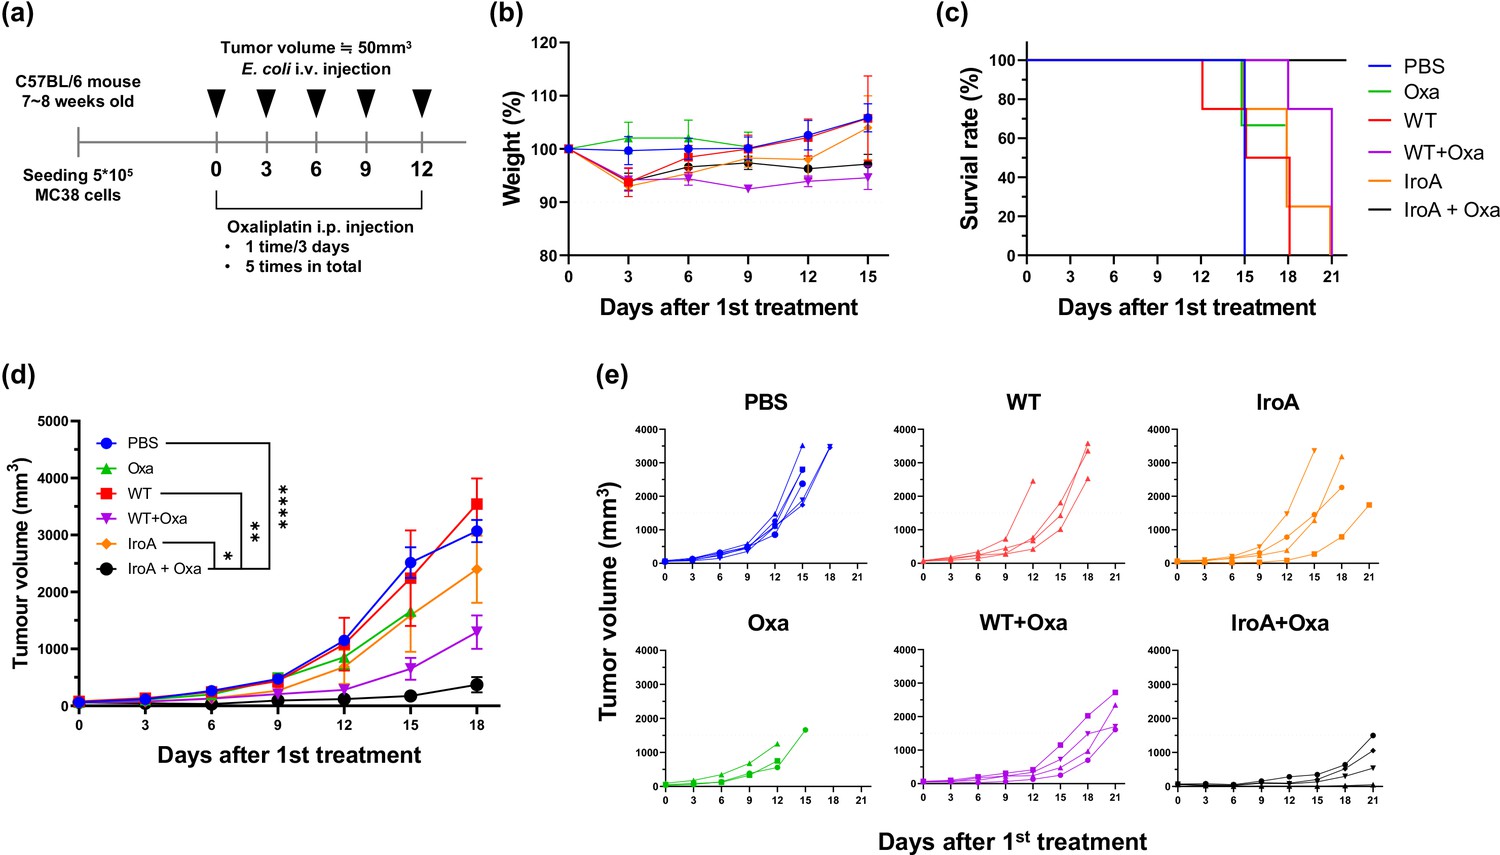
Synergistic anti-tumor activity of IroA-E.coli and oxaliplatin.
(a) The scheme of the systemic delivery of IroA-E. coli and oxaliplatin in the tumor-bearing mice. (b) The alteration of mouse weights during the treatment course. (c) Survival curves of the mice in various treatment groups. (d) The average tumor growth curves of different treatment groups. (e) The tumor growth curves of individual mice in (d). The error bars represent mean ± SD. Statistical analyses were performed by one-way ANOVA (*p<0.05, **p<0.01, ****p<0.0001).
Additional files
-
MDAR checklist
- https://cdn.elifesciences.org/articles/90798/elife-90798-mdarchecklist1-v1.docx
-
Source data 1
Source data for figure preparation.
- https://cdn.elifesciences.org/articles/90798/elife-90798-data1-v1.xlsx
Download links
A two-part list of links to download the article, or parts of the article, in various formats.
Downloads (link to download the article as PDF)
Open citations (links to open the citations from this article in various online reference manager services)
Cite this article (links to download the citations from this article in formats compatible with various reference manager tools)
Overcoming the nutritional immunity by engineering iron-scavenging bacteria for cancer therapy
eLife 12:RP90798.
https://doi.org/10.7554/eLife.90798.3


