Cannabinoid combination targets NOTCH1-mutated T-cell acute lymphoblastic leukemia through the integrated stress response pathway
- The Laboratory of Cancer Biology and Cannabinoid Research, Faculty of Biology, Technion – Israel Institute of Technology, Israel
Figures
Figure 1 with 3 supplements
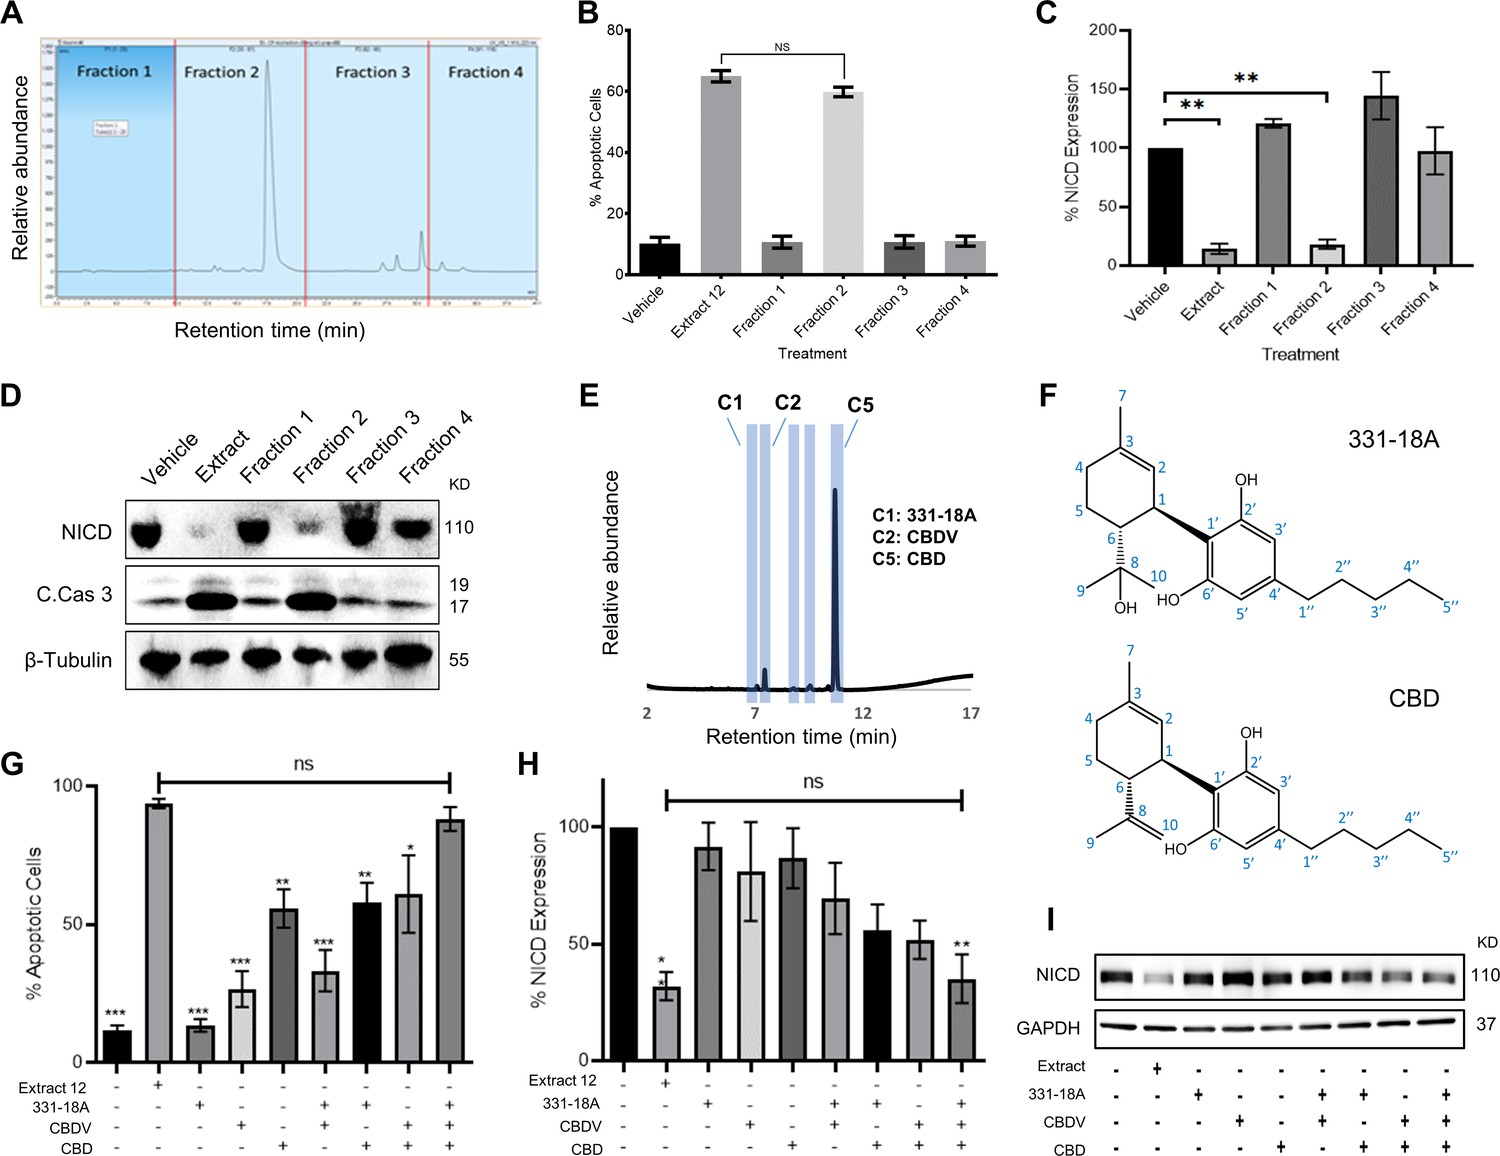
Identifying specific phytocannabinoids responsible for the cytotoxic effect of the whole extract.
(A) A semi-preparative HPLC-UV chromatogram of the whole extract showing the four fractions collected every 10 min. (B–D) MOLT-4 cells were treated with either vehicle, whole extract, or fractions 1–4 (3 μg/mL) and (B) apoptosis was analyzed after 24 hr (N=3) via Annexin V/PI, (C, D) Notch1 intracellular domain (NICD) and cleaved caspase-3 (C. Cas. 3) expressions were evaluated (N=3) after 3 hr with β-tubulin as the loading control. A representative blot is shown. (E) UHPLC/UV chromatogram of fraction 2, the specific compounds constituting the fraction are marked (C1–C5). (F) Chemical structure and peak assignment of cannabidiol (CBD) and 331-18A according to 1H and 13C nuclear magnetic resonance (NMR). Atom numbering is according to the monoterpene numbering system. (G–I) MOLT-4 cells were treated with the whole extract (3 μg/mL) or with 0.06 µg/mL 331-18A, 0.06 µg/mL cannabidivarin (CBDV), and 1.5 µg/mL CBD, their corresponding concentrations in the extract, and their different combinations. Cells were assessed for (G) apoptosis after 24 hr (N=3) via Annexin V/PI assay and (H, I) NICD expression after 3 hr (N=3) with GAPDH as the loading control. Results are presented as mean ± SEM and statistically analyzed with one-way ANOVA (*p<0.05, **p<0.01, ***p<0.001).
-
Figure 1—source data 1
Original file for the western blot presented in Figure 1D.
- https://cdn.elifesciences.org/articles/90854/elife-90854-fig1-data1-v1.zip
-
Figure 1—source data 2
Original file for the western blot presented in Figure 1I.
- https://cdn.elifesciences.org/articles/90854/elife-90854-fig1-data2-v1.zip
Figure 1—figure supplement 1
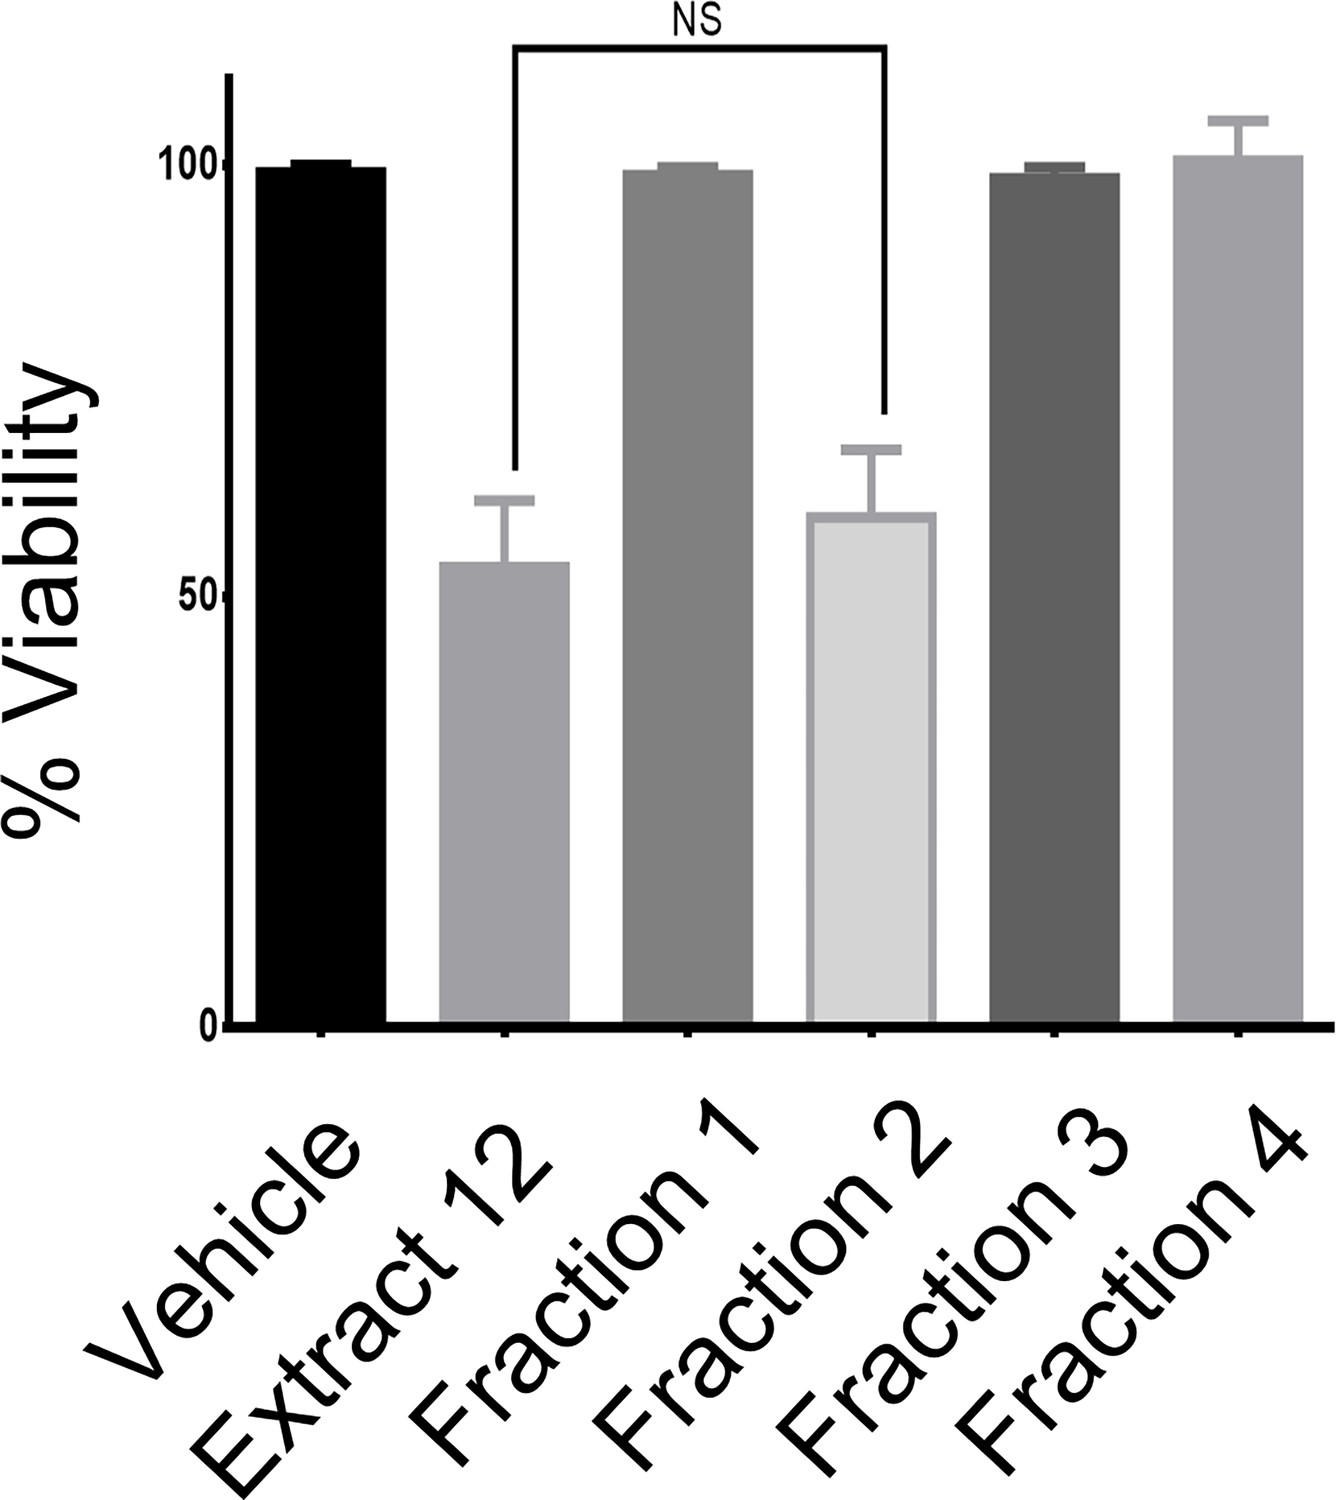
Fraction 2 is as effective as the whole extract in reducing the viability of MOLT-4 cells.
MOLT-4 cells were treated with either whole extract or each of the four fractions and 24 hr later the viability of the cells was assessed with XTT.
Figure 1—figure supplement 2
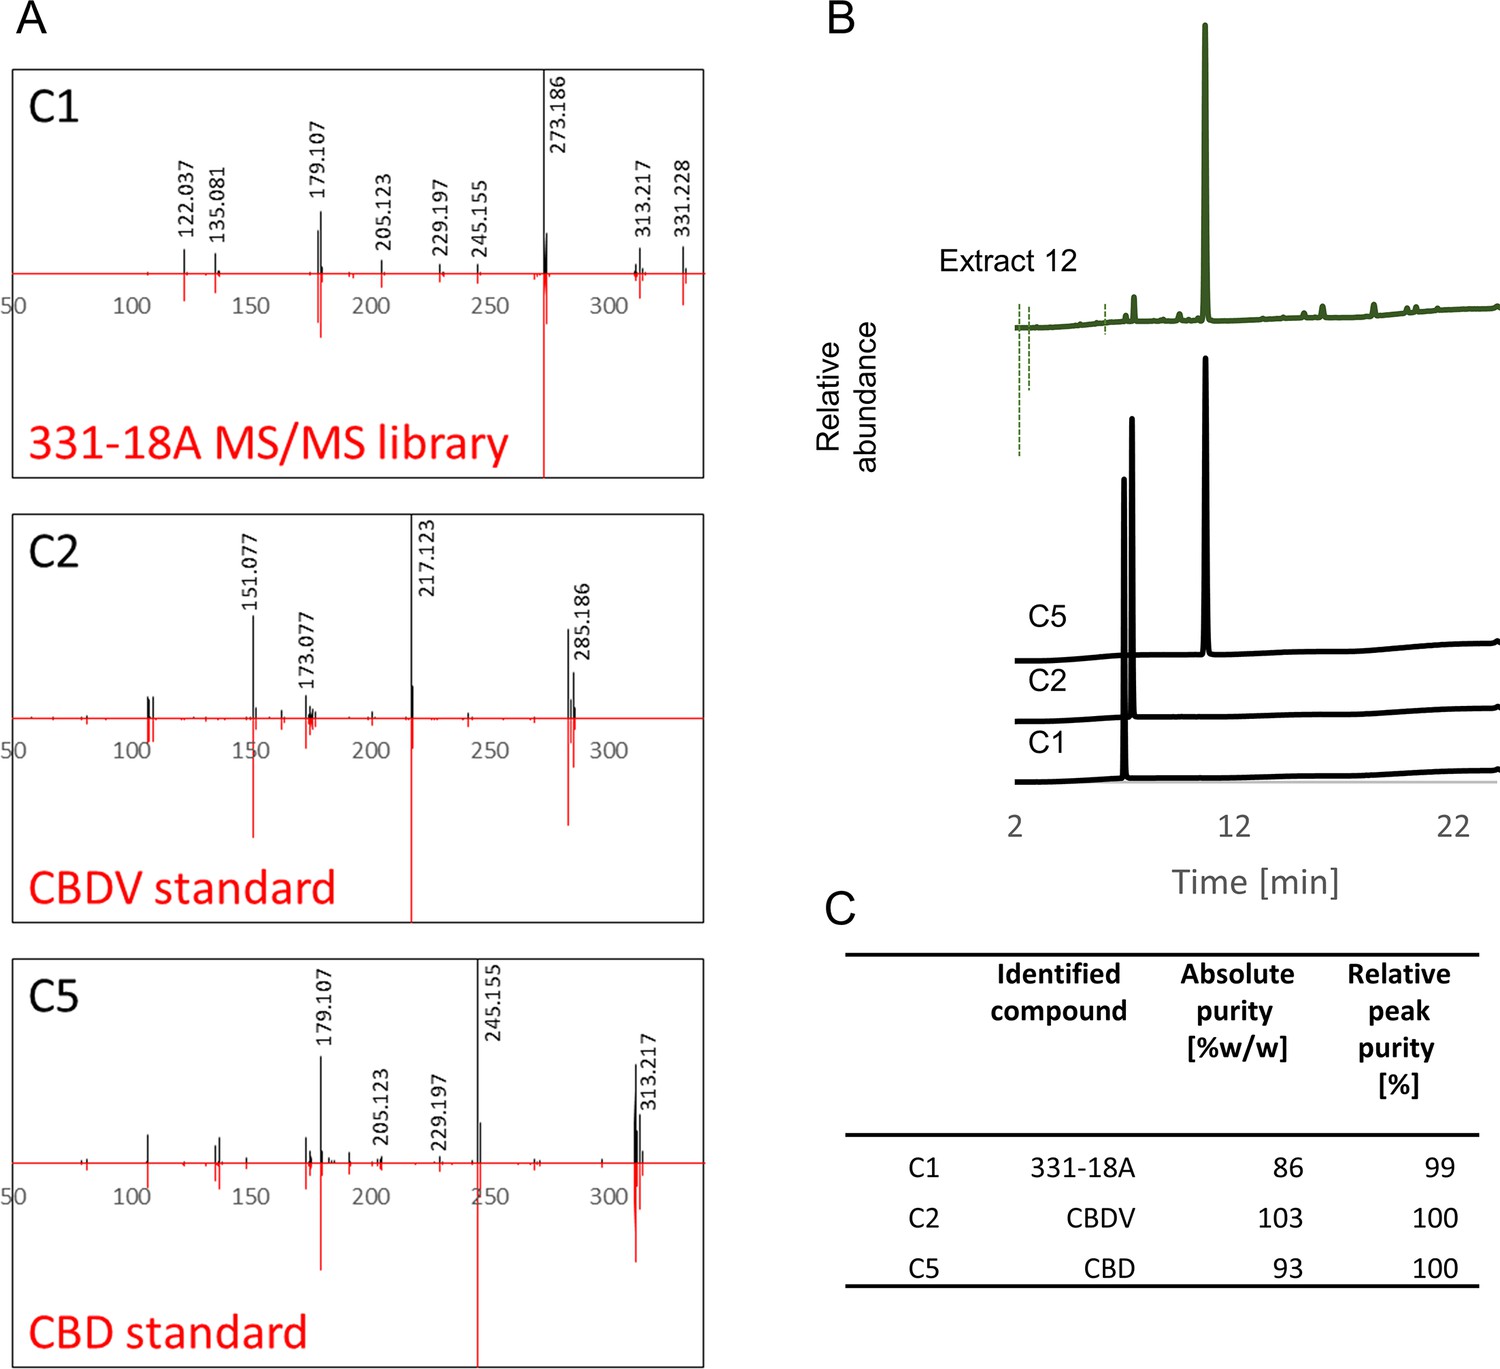
Specific identification of phytocannabinoids with anti-cancer properties by spectral matching and peak purity.
(A) MS/MS spectral matching of C1, C2, and C5 versus our spectral library and analytical standards of cannabidivarin (CBDV) and cannabidiol (CBD), respectively. (B) UHPLC/UV chromatogram of extract 12 and the three isolated phytocannabinoids analyzed separately. (C) Calculated purities of the three isolated phytocannabinoids according to analytical standards (absolute purity) or as the percent area in relation to all other observed peaks in the UHPLC analysis (relative peak purity). The absolute purity of 331-18A was quantified according to the calibration curve of the CBD standard.
Figure 1—figure supplement 3
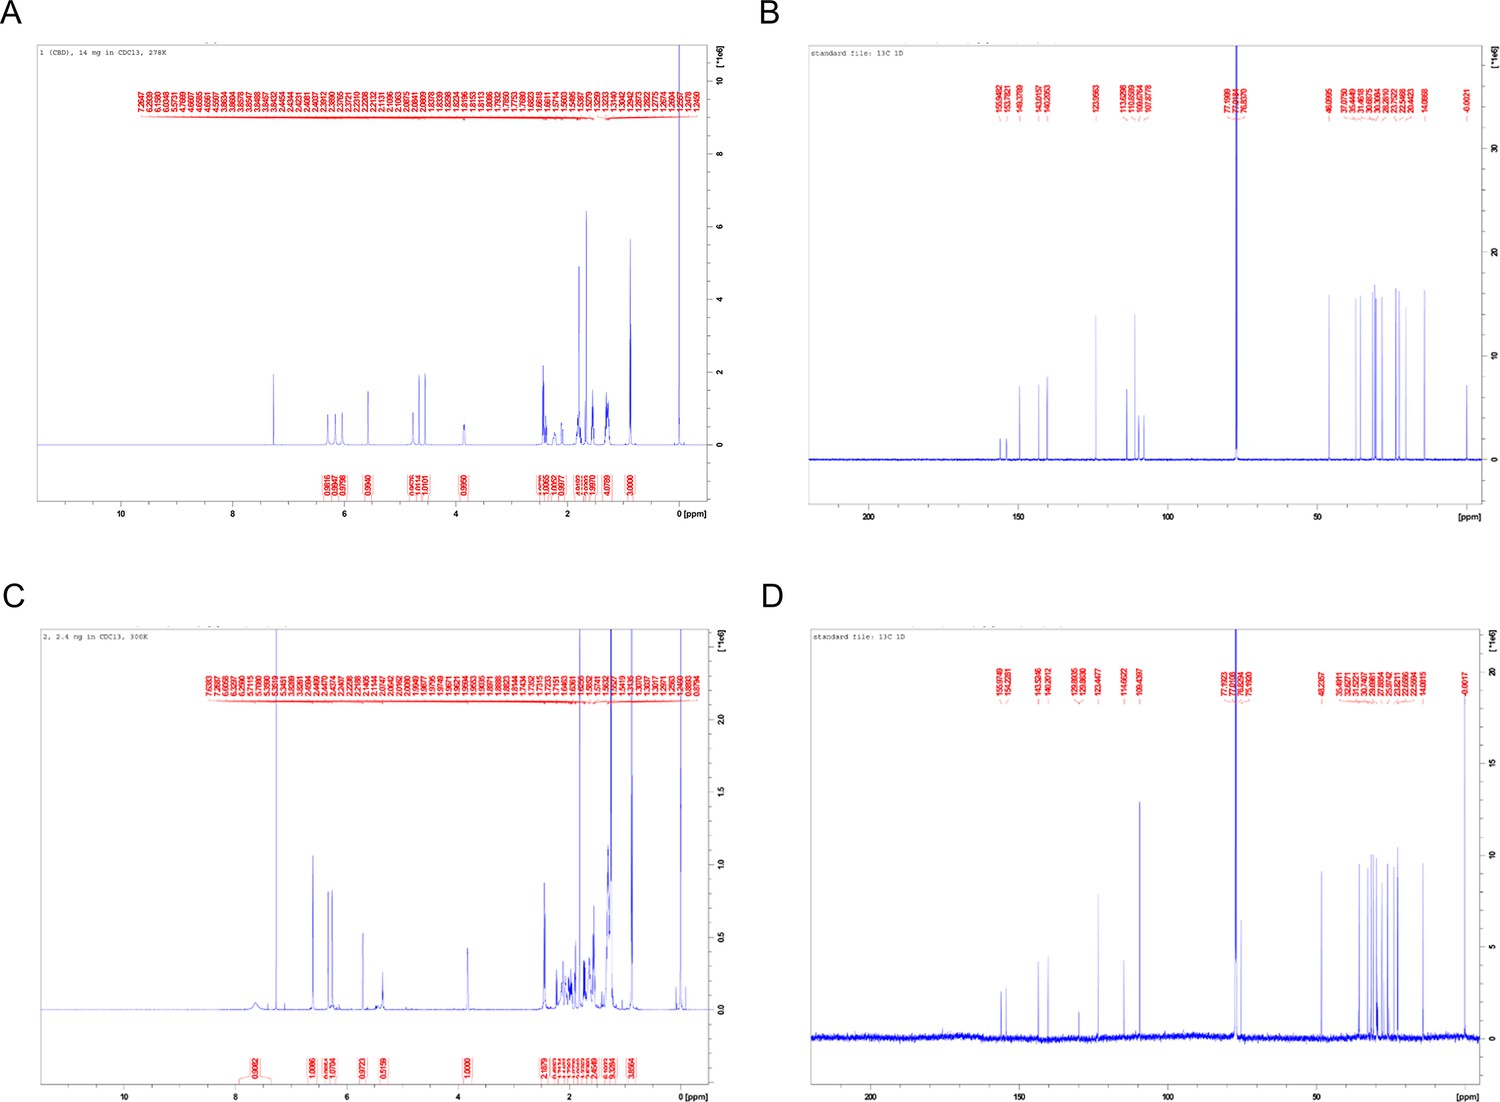
Cannabidiol (CBD) and 331-18A nuclear magnetic resonance (NMR) spectra.
(A) 1H NMR spectrum of CBD. (B) 13C NMR spectrum of CBD. (C) 1H NMR spectrum of 331-18A. (D) 13C NMR spectrum of 331-18A.
Figure 2 with 1 supplement
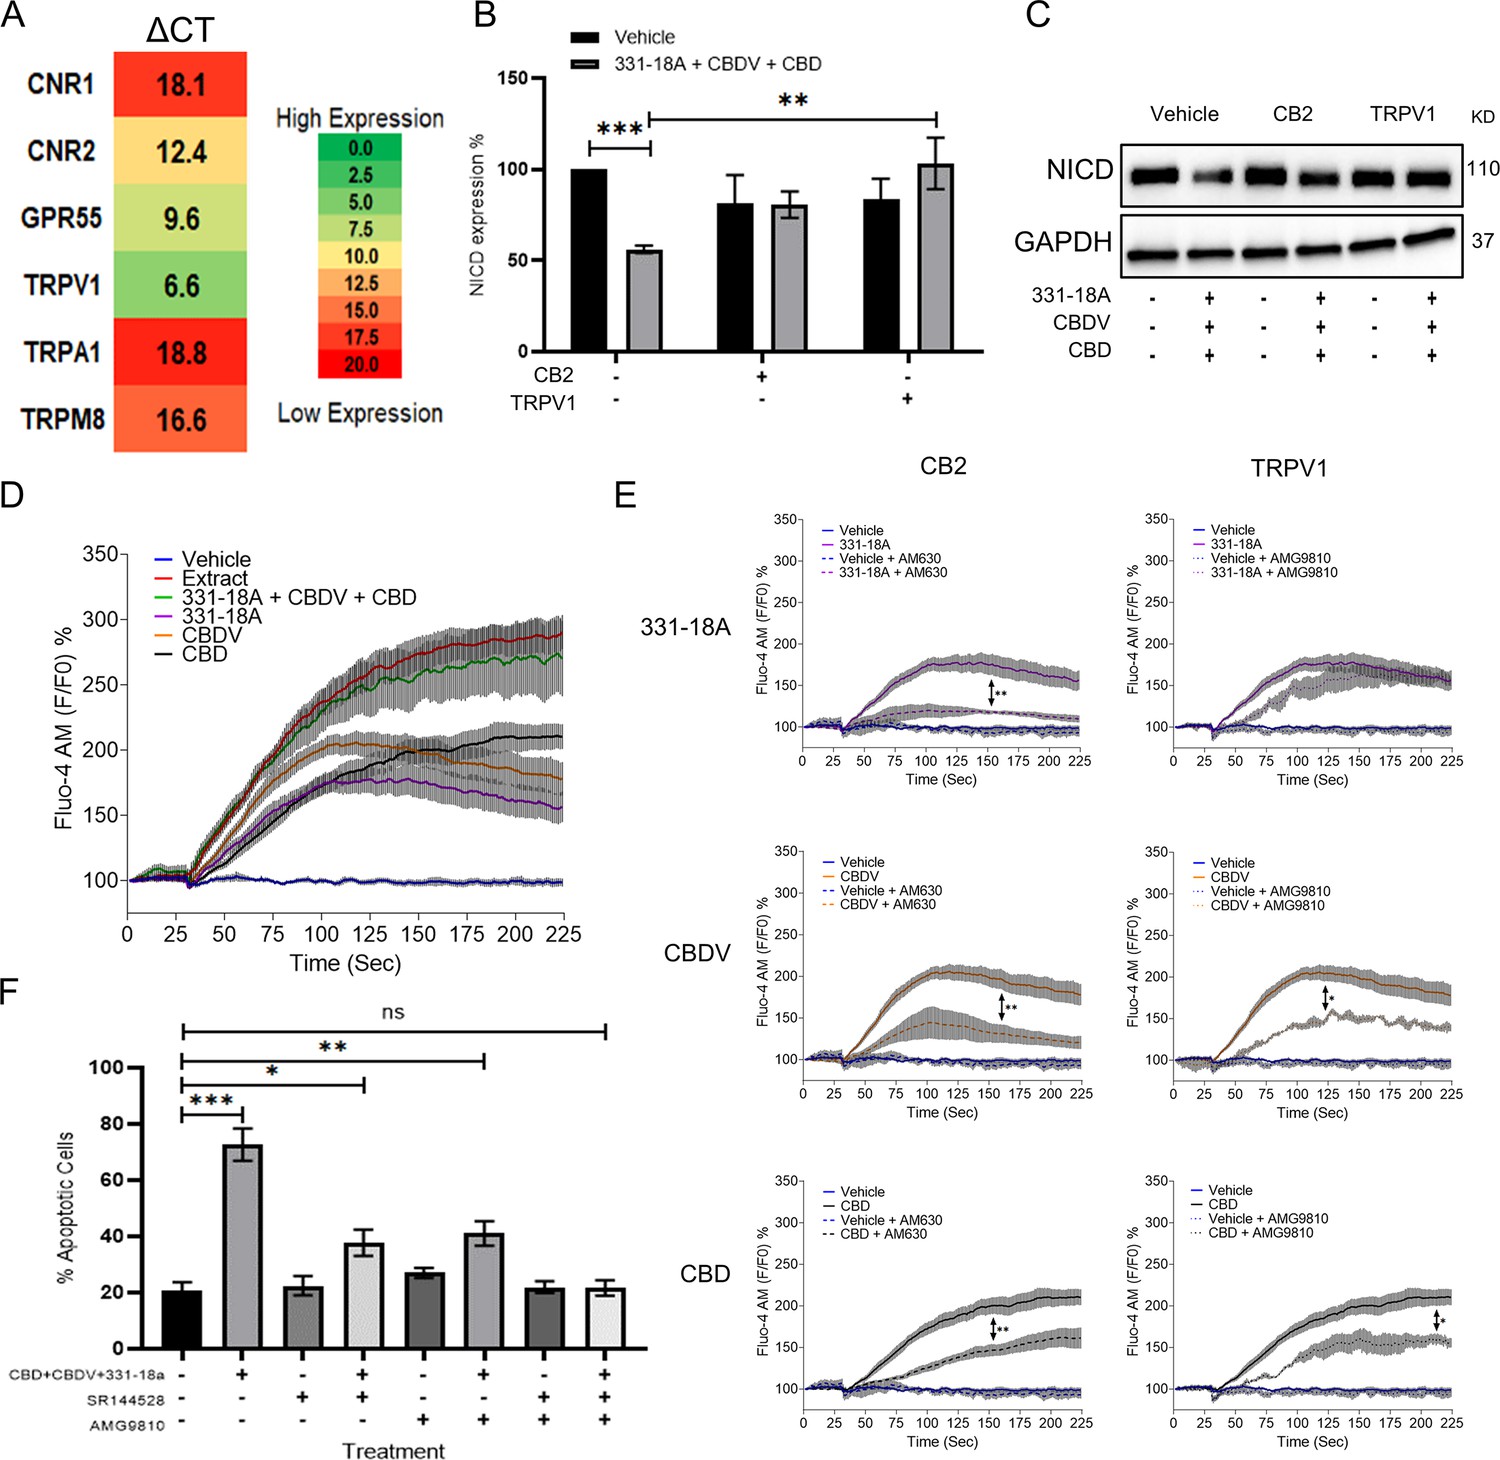
331-18A, cannabidivarin (CBDV), and cannabidiol (CBD) mediate their effect through CB2 and TRPV1.
(A) The mRNA levels of receptors CNR1 (cannabinoid receptor type 1 [CB1]), CNR2 (CB2), GPR55, TRPV1, TRPA1, and TRPM8 were evaluated by qRT-PCR. Gene expression levels were calculated as ΔCT normalized to GUSB housekeeping gene. Results are presented as mean expression of three biological replicates. High ΔCT values indicate low receptor expression. (B) MOLT-4 cells were pretreated with 50 µM antagonist to CB2 (AM630) or TRPV1 (AMG9810) for 30 min, then treated with the combination of the three cannabinoids for 3 hr. Notch1 intracellular domain (NICD) expression was evaluated by western blot (N=3) with GAPDH as the loading control and statistically analyzed with an unpaired Student’s t-test (**p<0.01, ***p<0.001). (C) Representative blots of B. (D) Calcium release by MOLT-4 cells was measured with the Fluo-4 calcium probe immediately following treatment with either vehicle, whole extract, a combination of 331-18A, CBDV, and CBD, and each cannabinoid separately. The calcium curves represent an average of three independent experiments. (E) Reduction of each phytocannabinoid-induced calcium release by pretreatment with 50 µM of antagonist to CB2 (AM630) or TRPV1 (AMG9810) for 30 min. The calcium curve for each compound is given again in this graph to compare the effects with the antagonists (N=3, two-way ANOVA, *p<0.05, **p<0.01). (F) MOLT-4 cells were pretreated with 50 µM antagonist to CB2 (SR-144,528) or TRPV1 (AMG9810) or both for 30 min, then treated with the combination of the three cannabinoids or left untreated. Apoptosis was analyzed after 24 hr (N=3) by Annexin V/PI. Results are presented as mean ± SEM and statistically analyzed with one-way ANOVA (*p<0.05, **p<0.01, ***p<0.001).
-
Figure 2—source data 1
Original file for the western blot presented in Figure 2C.
- https://cdn.elifesciences.org/articles/90854/elife-90854-fig2-data1-v1.zip
Figure 2—figure supplement 1
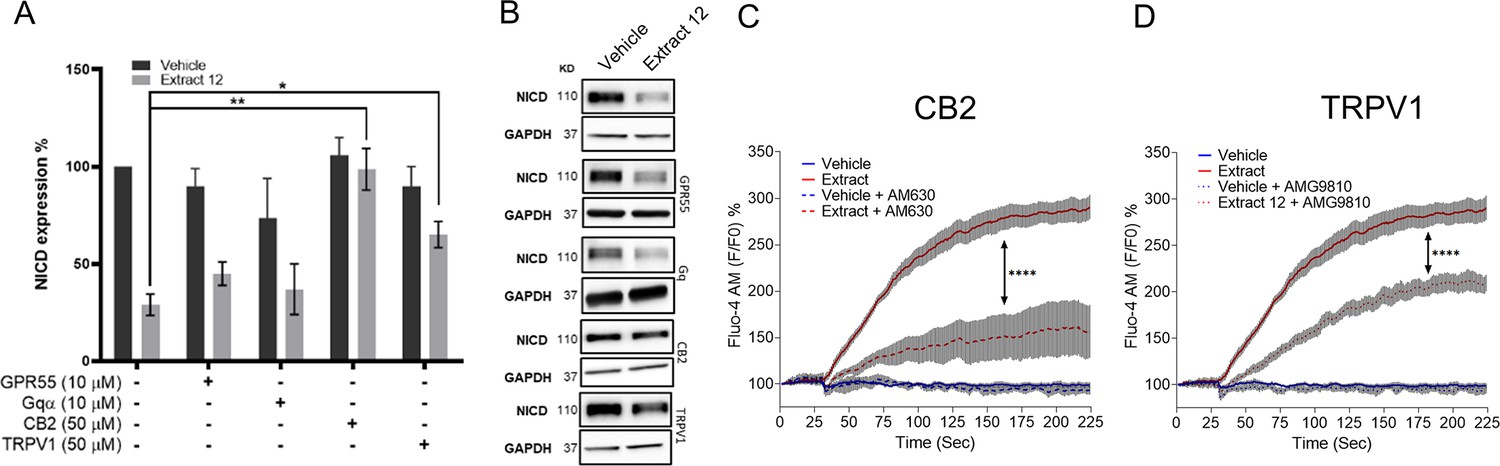
Notch1 downregulation by extract 12 is mediated through CB2 and TRPV1 followed by ATF4-CHOP-CHAC1 signaling pathway.
(A) MOLT-4 cells were pretreated for 30 min with either of the following antagonists: CID (10 µM) for GPR55, BIM (10 µM) for general Gαq GPCR, AM630 (50 µM) for CB2 and AMG9810 (50 µM) for TRPV1; then added vehicle or extract 12 (3 µg/mL) for 3 hr. The protein expression of Notch1 intracellular domain (NICD) was analyzed relative to untreated vehicle control (n=3) and statistically analyzed with unpaired Student’s t-test (*p<0.05, **p<0.01). (B) Representative blots of NICD expression. (C, D) MOLT-4 cells were pretreated for 30 min with either AM630 (50 µM), an antagonist to CB2, or AMG9810 (50 µM), an antagonist to TRPV1; then added either vehicle or extract 12 and calcium release was immediately measured with the Fluo-4 calcium probe. The presented calcium curves represent an average of three independent experiments and statistically analyzed with two-way ANOVA (****p<0.0001).
-
Figure 2—figure supplement 1—source data 1
Original file for the western blot presented in Figure 2—figure supplement 1B.
- https://cdn.elifesciences.org/articles/90854/elife-90854-fig2-figsupp1-data1-v1.zip
Figure 3 with 1 supplement
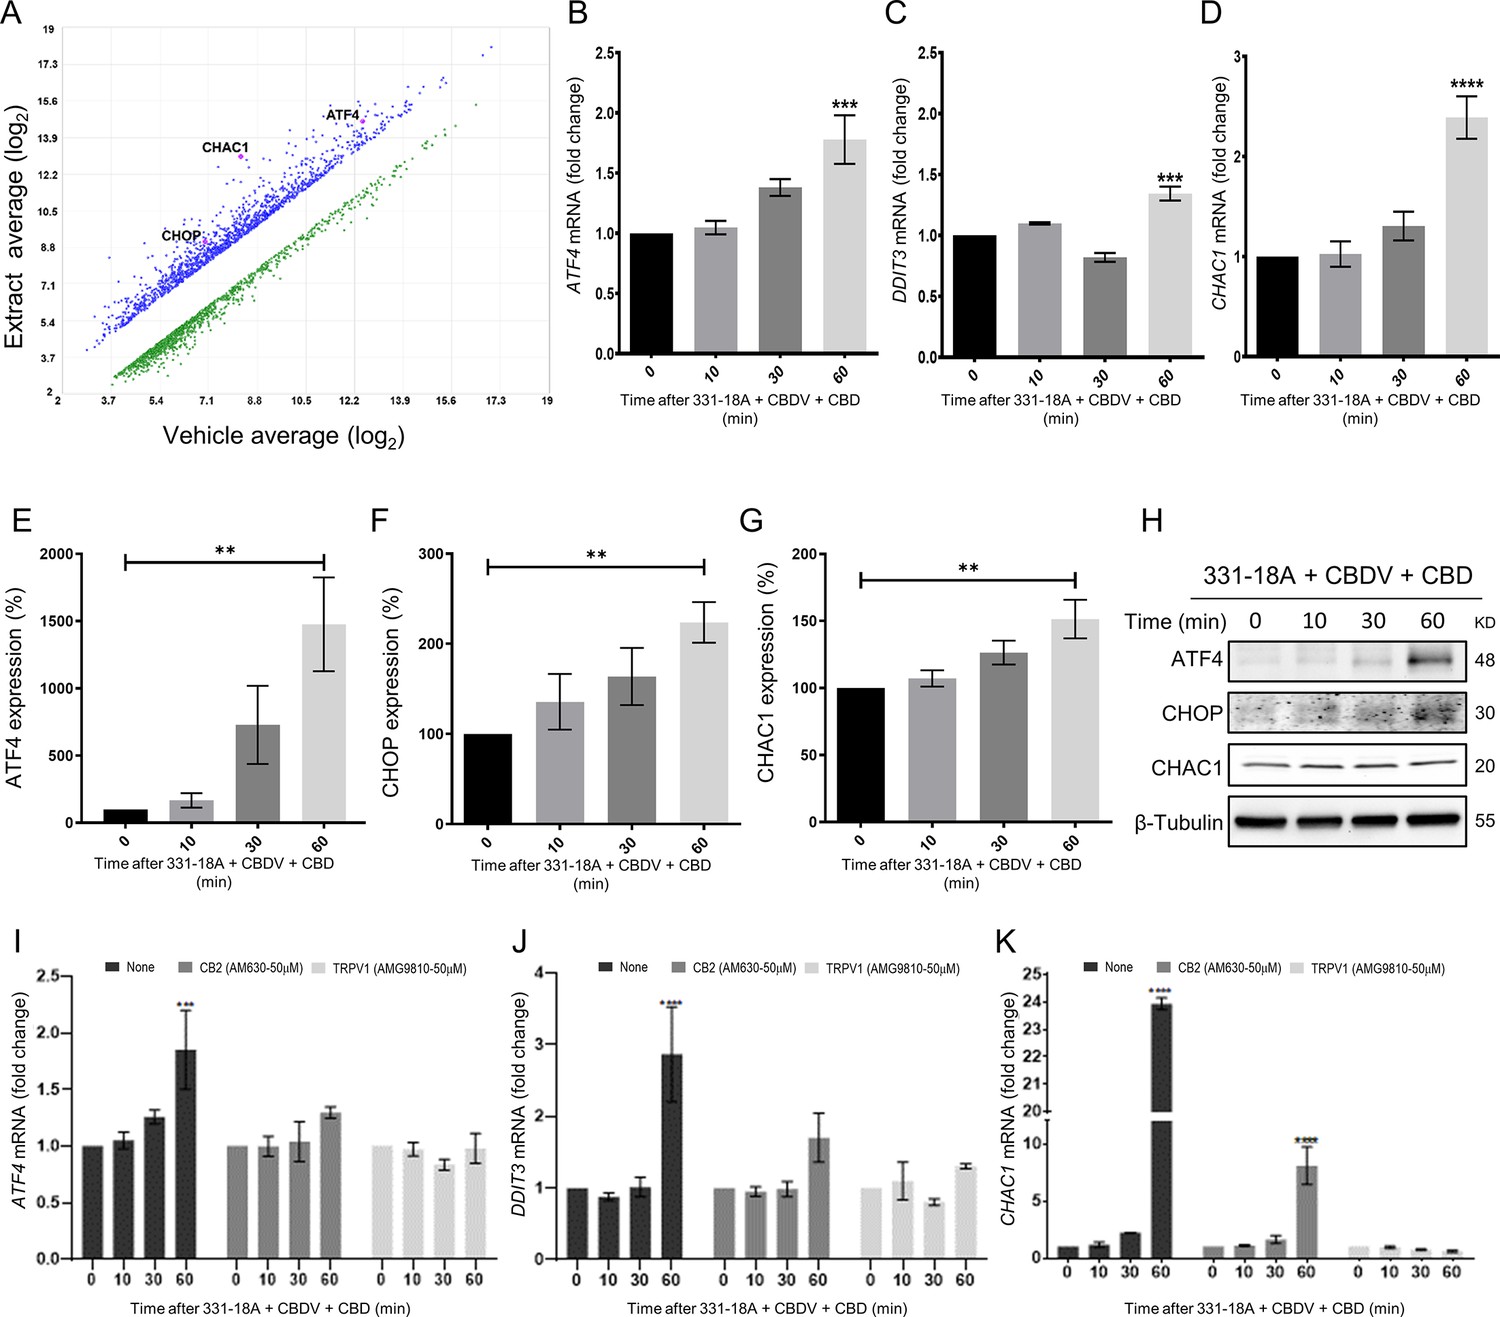
Notch1 downregulation by 331-18A, cannabidivarin (CBDV), and cannabidiol (CBD) combination is mediated via ATF4-CHOP-CHAC1 signaling pathway.
(A) MOLT-4 cells were treated for 3 hr with either vehicle or the whole extract (3 µg/mL) and an Affymetrix scatter plot presents the differential expression; the increased-abundance genes CHAC1, DDIT3, and ATF4 are marked (N=3). (B–D) MOLT-4 cells were treated for 3 hr with 331-18A, CBDV, and CBD combination (N=3), the mRNA expression of ATF4, DDIT3, and CHAC1 genes was evaluated with qRT-PCR at different time points (0–60 min). Differences are presented as fold change ± SEM and statistically analyzed with one-way ANOVA (***p<0.001, ****p<0.0001). (E–G) MOLT-4 cells were treated as in B–D and the protein expression of ATF4, CHOP, and CHAC1 were evaluated with β-tubulin as the loading control. Intensity analysis was performed on three independent experiments (N=3) and statistically analyzed with an unpaired Student’s t-test (**p<0.01). (H) Representative blots. (I–K) Analysis of ATF4, DDIT3, and CHAC1 mRNA expression at different time points following pretreatment with CB2 and TRPV1 antagonists for 30 min and then treatment with the cannabinoid combination (N=3), analyzed with two-way ANOVA (***p<0.001, ****p<0.0001).
-
Figure 3—source data 1
Original file for the western blot presented in Figure 3H.
- https://cdn.elifesciences.org/articles/90854/elife-90854-fig3-data1-v1.zip
Figure 3—figure supplement 1
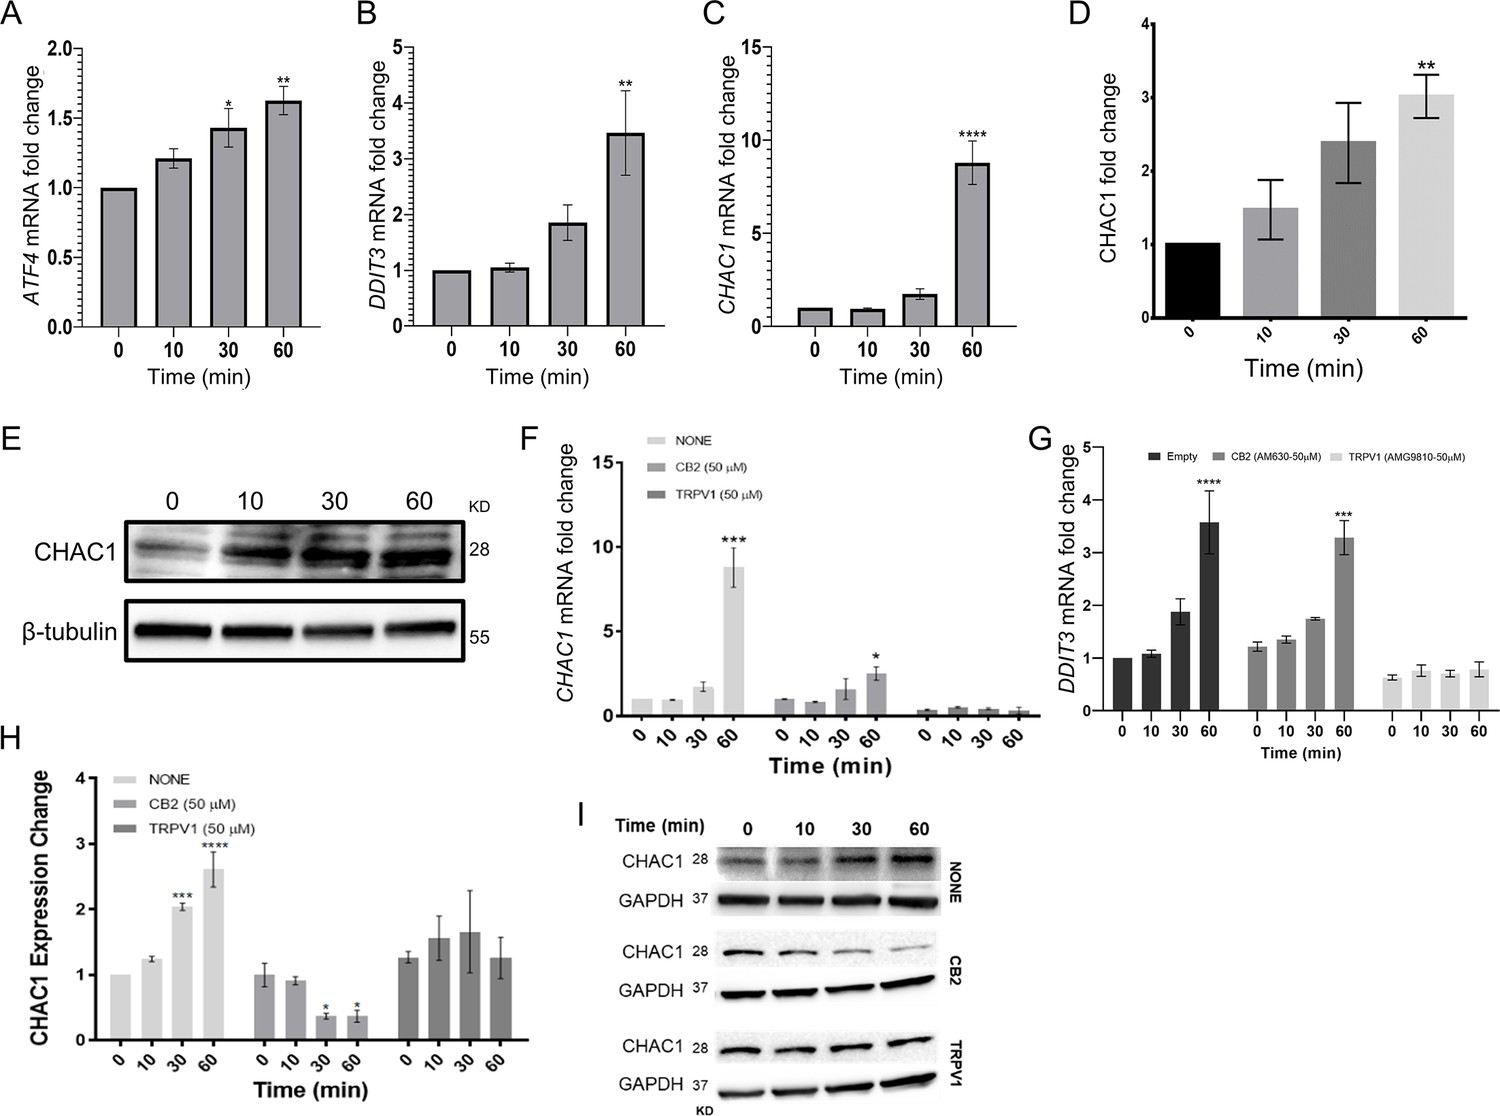
Notch1 downregulation by extract 12 is mediated through the ATF4-CHOP-CHAC1 signaling pathway.
(A–C) Time course (n=3) qRT-PCR of ATF4, DDIT3, and CHAC1 genes at different time points (0-60 min) following treatment with extract 12 (3 µg/mL) and statistically analyzed with one-way ANOVA (*p<0.05, **p<0.01, ****p<0.0001). (D, E) MOLT-4 cells were treated with extract 12 (3 µg/mL) for 10, 30, and 60 min and the protein expression of CHAC1 was evaluated with β-tubulin as the loading control. Intensity analysis was performed on three independent experiments relative to untreated control (n=3) and statistically analyzed with an unpaired Student’s t-test (**p<0.01). (F–I) MOLT-4 cells were pretreated for 30 min with vehicle or 50 µM of either antagonist to CB2 (AM630) or to TRPV1 (AMG9810), and then treated with extract 12 (3 µg/mL) for the indicated times and assessed (n=3) for the mRNA expression of CHAC1 (F) and DDIT3 (G), as well as the protein expression of CHAC1 (H). A representative blot of CHAC1 expression with GAPDH as the loading control (I). Results are presented as mean ± SEM relative to untreated control and statistically analyzed by unpaired Student’s t-test (*p<0.05, ***p<0.001, ****p<0.0001).
-
Figure 3—figure supplement 1—source data 1
Original file for the western blot presented in Figure 3—figure supplement 1E.
- https://cdn.elifesciences.org/articles/90854/elife-90854-fig3-figsupp1-data1-v1.zip
-
Figure 3—figure supplement 1—source data 2
Original file for the western blot presented in Figure 3—figure supplement 1I.
- https://cdn.elifesciences.org/articles/90854/elife-90854-fig3-figsupp1-data2-v1.zip
Figure 4 with 1 supplement
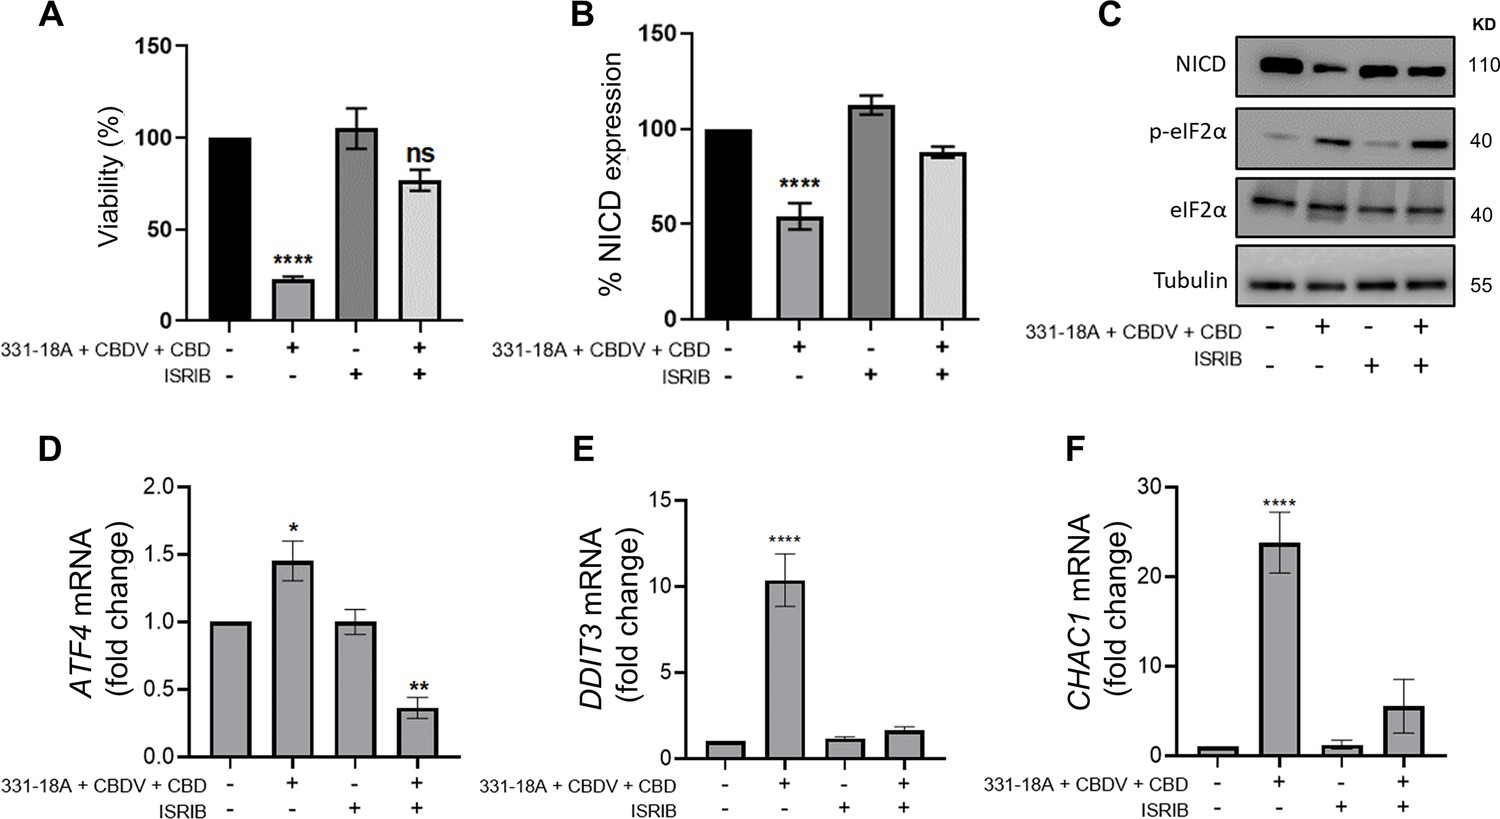
331-18A, cannabidivarin (CBDV), and cannabidiol (CBD) combination activates eIF2α.
MOLT-4 cells were pretreated for 30 min with the eIF2α inhibitor integrated stress response inhibitor (ISRIB) (150 µM) or left untreated, then treated with vehicle or the combination of 331-18A, CBDV, and CBD for 3 hr. (A) Viability after 24 hr was assessed with XTT (N=3). (B) Notch1 intracellular domain (NICD) protein expression was assessed (N=3) with β-tubulin as the loading control (unpaired Student’s t-test, *p<0.05). (C) A representative image also showing the protein levels of phosphorylated eIF2α (Ser51) and total eIF2α. (D–F) ATF4, DDIT3, and CHAC1 gene expression was assessed via qRT-PCR 4 hr after treatment (N=3). Results are presented as mean ± SEM and statistically analyzed with one-way ANOVA (****p<0.0001).
-
Figure 4—source data 1
Original file for the western blot presented in Figure 4C.
- https://cdn.elifesciences.org/articles/90854/elife-90854-fig4-data1-v1.zip
Figure 4—figure supplement 1
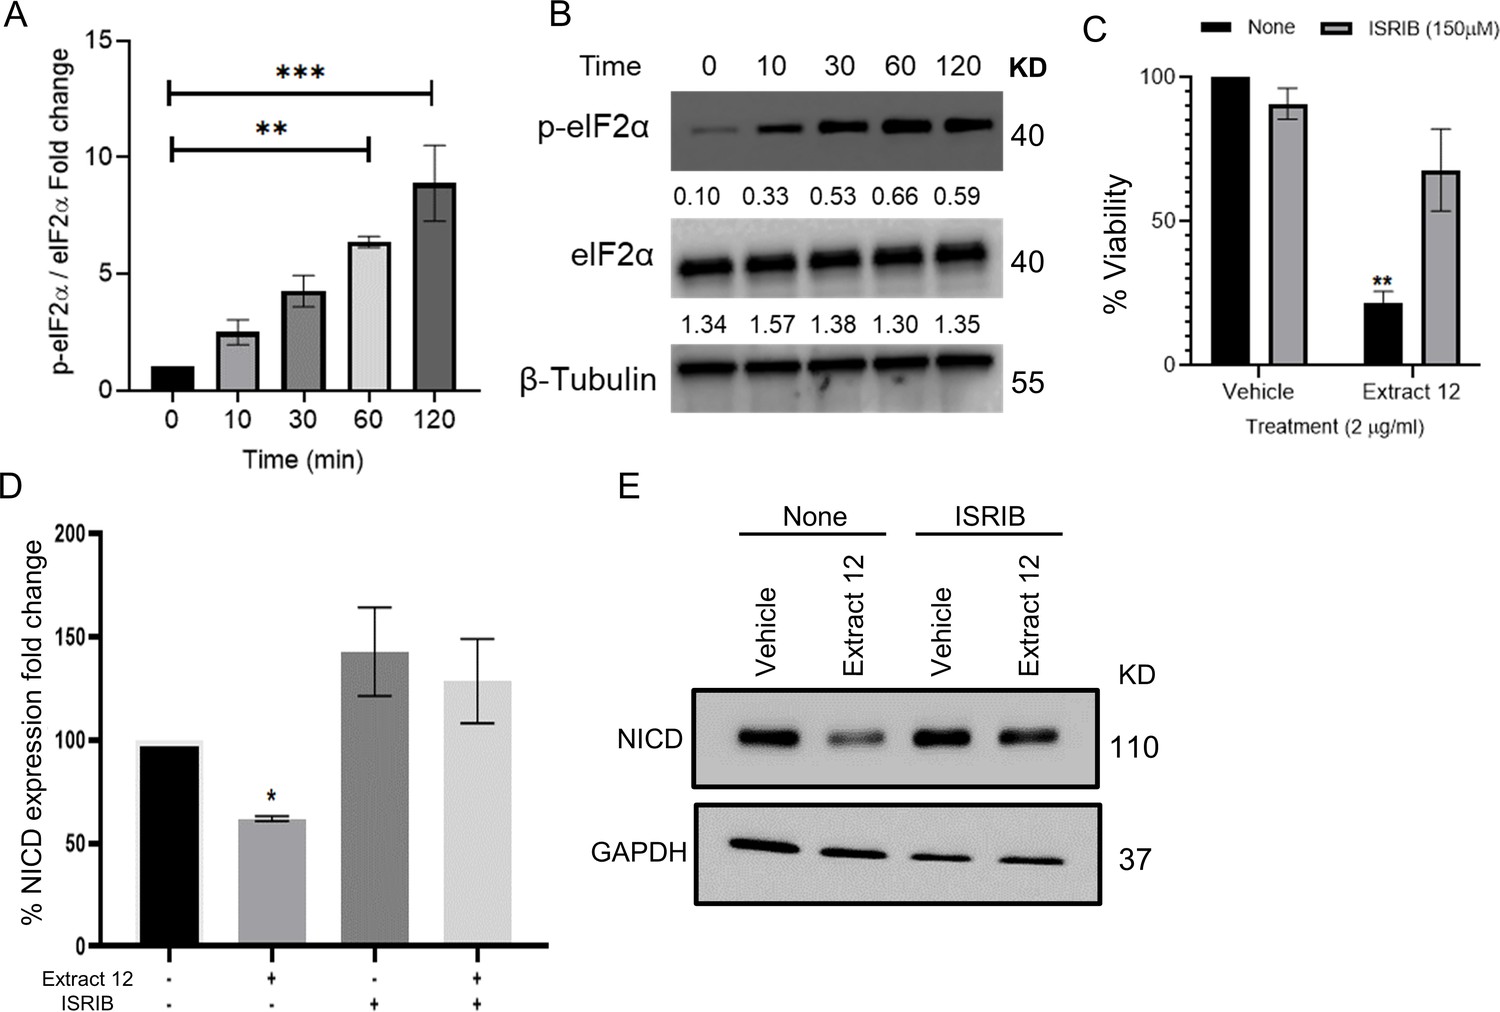
Whole extract treatment activates eIF2α.
(A) MOLT-4 cells were with extract 12 and the phosphorylation of eIF2α was assessed at different times up to 2 hr after treatment. (B) Representative blots of phosphorylated eIF2α (Ser51), total eIF2α, and β-tubulin. (C) MOLT-4 cells were pretreated for 30 min with the eIF2α inhibitor integrated stress response inhibitor (ISRIB) (150 µM) or left untreated, then treated with vehicle or extract 12. Viability was assessed after 24 hr with XTT assay (n=3). (D) Notch1 intracellular domain (NICD) protein expression was assessed (n=3) with GAPDH as the loading control. (E) A representative image showing the protein levels of NICD and GAPDH. Results are presented as mean ± SEM and statistically analyzed with one-way ANOVA (*p<0.05, **p<0.01, ***p<0.001).
-
Figure 4—figure supplement 1—source data 1
Original file for the western blot presented in Figure 4—figure supplement 1B.
- https://cdn.elifesciences.org/articles/90854/elife-90854-fig4-figsupp1-data1-v1.zip
-
Figure 4—figure supplement 1—source data 2
Original file for the western blot presented in Figure 4—figure supplement 1E.
- https://cdn.elifesciences.org/articles/90854/elife-90854-fig4-figsupp1-data2-v1.zip
Figure 5
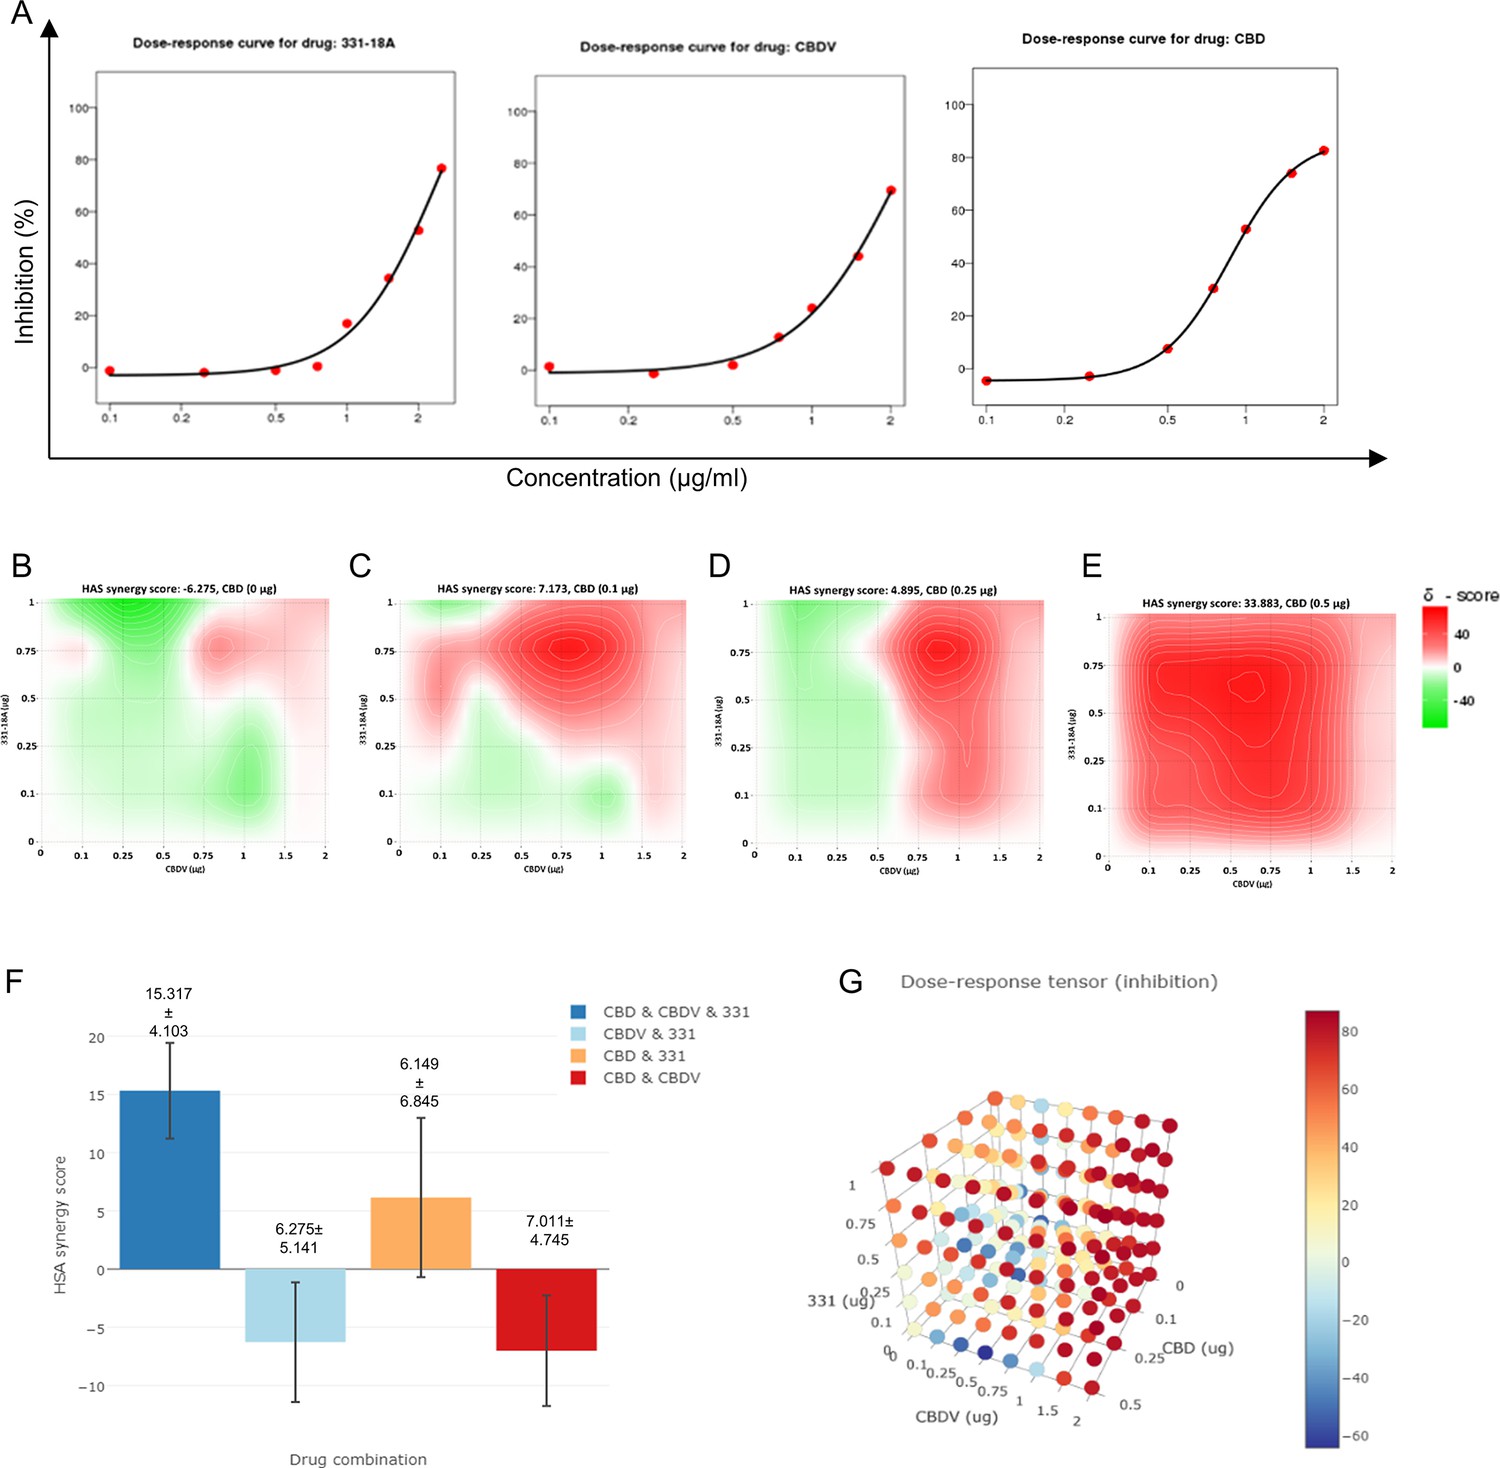
All three cannabinoids must be combined for a synergistic effect.
(A) MOLT-4 cell death (N=3) was assessed by XTT following treatments with concentrations ranging 0–2 µg/mL and a dose-response curve for each cannabinoid separately was plotted. (B–E) Synergy distribution for different ratios of cannabinoids was calculated by Highest Single Agent (HSA) model with SynergyFinder web application (v 2.0), representative dose-response matrices are presented for cannabidiol (CBD) at (B) 0, (C) 0.1, (D) 0.25, and (E) 0.5 µg/mL. (F, G) Best synergy scores according to HSA model presented for the triple combination relative to the two-cannabinoid combinations.
Figure 6 with 2 supplements
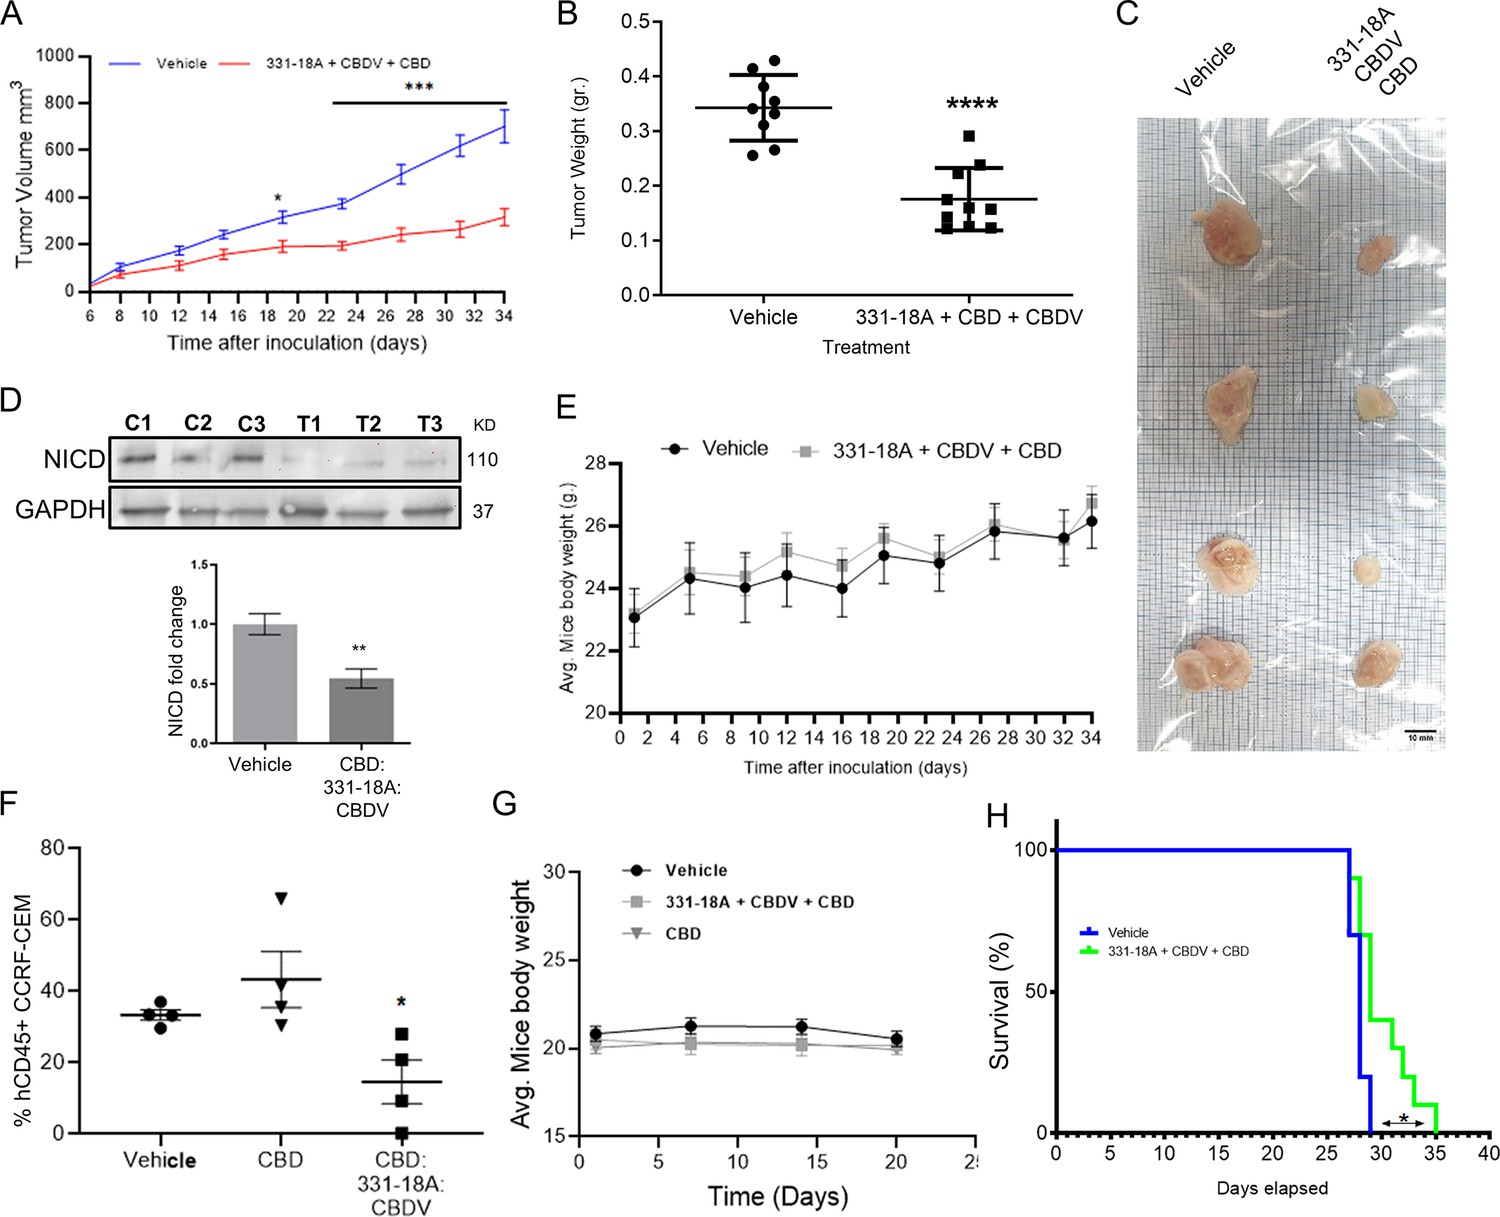
Inhibition of cancer progression in vivo by a combination of 331-18A, cannabidivarin (CBDV), and cannabidiol (CBD).
(A) Female nonobese diabetic-severe combined immunodeficiency (NOD/Scid) mice (N=4–5/group, two independent experiments) were engrafted subcutaneously with 1×10⁶ MOLT-4 cells. After 7 days, the mice were randomly divided into two groups and alternate-day treated intraperitoneally with either vehicle or a combination of 331-18A (1.11 mg/kg), CBDV (1.11 mg/kg), and CBD (17.77 mg/kg). Ectopic tumor volume was measured using a vernier caliper and calculated according to the formula (length × width2)×0.5. The average difference between groups was statistically analyzed by Bonferroni’s multiple comparisons test (*p<0.05, ***p<0.001). (B) After 34 days of treatment, the mice were sacrificed and tumors were excised and weighed (N=9). The difference in the weights of the tumors between treatment groups was statistically analyzed by unpaired Student’s t-test (****p<0.0001). (C) Representative photograph of excised tumors. (D) A representative blot (top) and fold change (bottom) of Notch1 intracellular domain (NICD) protein expression in excised tumors at day 34 after treatment with either vehicle (C) or a combination of the three cannabinoids (T), with GAPDH as the loading control. Data are presented as mean ± SEM (N=3) and statistically analyzed by unpaired Student’s t-test (**p<0.01). (E) Body weight (grams) in vehicle- and cannabinoids-treated mice. (F) Female NSG mice were intravenously injected with 1×10⁶ human CCRF-CEM cells. Mice were randomly divided into three groups (N=5/group) and treated intraperitoneally daily for 5 days, then left untreated for 2 days before starting another cycle, for a period of 3 weeks. Treatment groups were vehicle, pure CBD (30 mg/kg), and a combination of CBD (26.67 mg/kg), CBDV (1.67 mg/kg), and 331-18A (1.67 mg/kg) at the same overall concentration as pure CBD. After 24 days, the percentage of hCD45+ cells in the bone marrow was measured with flow cytometry and statistically analyzed by unpaired Student’s t-test (*p<0.05). (G) Body weight (grams) in vehicle- and cannabinoids-treated mice. (H) Survival analyses after CCRF-CEM injection followed by treatment with either vehicle or the cannabinoid combination (N=10/group), statistical differences were calculated with the Log-rank (Mantel-Cox) test (*p<0.05).
-
Figure 6—source data 1
Original file for the western blot presented in Figure 6D.
- https://cdn.elifesciences.org/articles/90854/elife-90854-fig6-data1-v1.zip
Figure 6—figure supplement 1
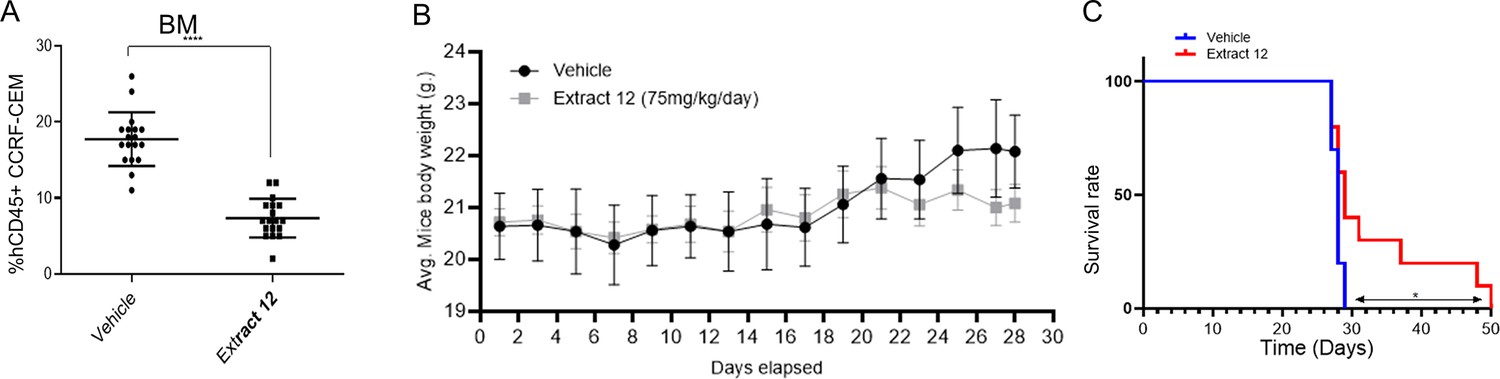
Inhibition of tumor growth in vivo by whole extract.
(A) Female NSG mice were intravenously injected with 1×10⁶ human CCRF-CEM cells. Mice were randomly divided into two groups (n=19) and alternate-day treated intraperitoneally with either vehicle or extract 12 (150 mg/kg), after 4 weeks the percentage of hCD45-positive cells in the bone marrow (BM) was measured by flow cytometry and statistically analyzed by unpaired Student's t-test (****p<0.0001). (B) Body weight (g) in vehicle- and extract-treated mice. (C) Survival analyses after CCRF-CEM injection followed by treatment with either vehicle or the whole extract (n=10/group), statistical differences were calculated with the Log-rank (Mantel-Cox) test (*p<0.05).
Figure 6—figure supplement 2
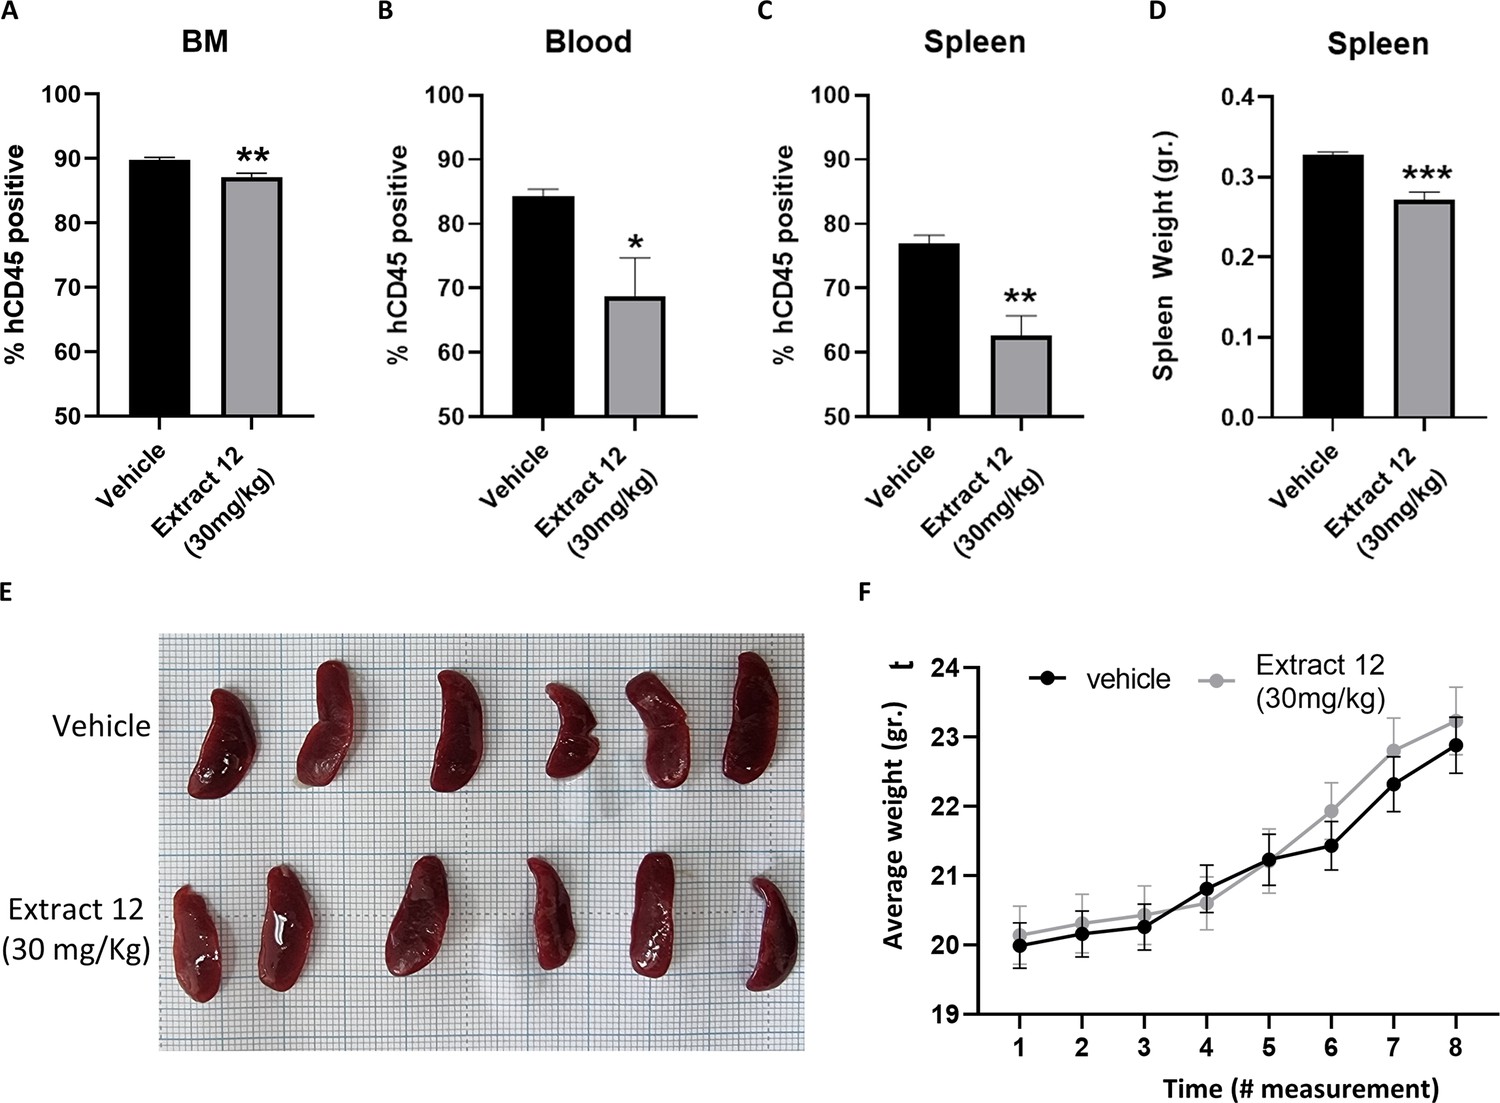
Treatment with extract containing the three cannabinoids inhibits leukemic expansion in an in vivo patient-derived xenografts (PDX) model.
NSG mice were engrafted with 1×10⁶ primary Notch1-mutated cells expanded from a T-cell acute lymphoblastic leukemia (T-ALL) patient. After 35 days, the mice were randomly divided into two groups (N=6), a control group and an extract 12 treatment group. The mice were treated on alternating days for 21 days and then evaluated for the percent of human CD45-positive cells from the (A) bone marrow, (B) peripheral blood, and (C) spleen by flow cytometry. (D) The spleens were harvested and weighed. The average weight was compared between the two groups. (E) Representative image of the spleens from the vehicle-treated (top) and extract 12-treated (bottom) groups. (F) The mice were weighed every 5–8 days, starting on day 1. Data are presented as mean ± SD and statistically analyzed by a Student's t-test (*p<0.05, **p<0.01, ***p<0.001).
Figure 7
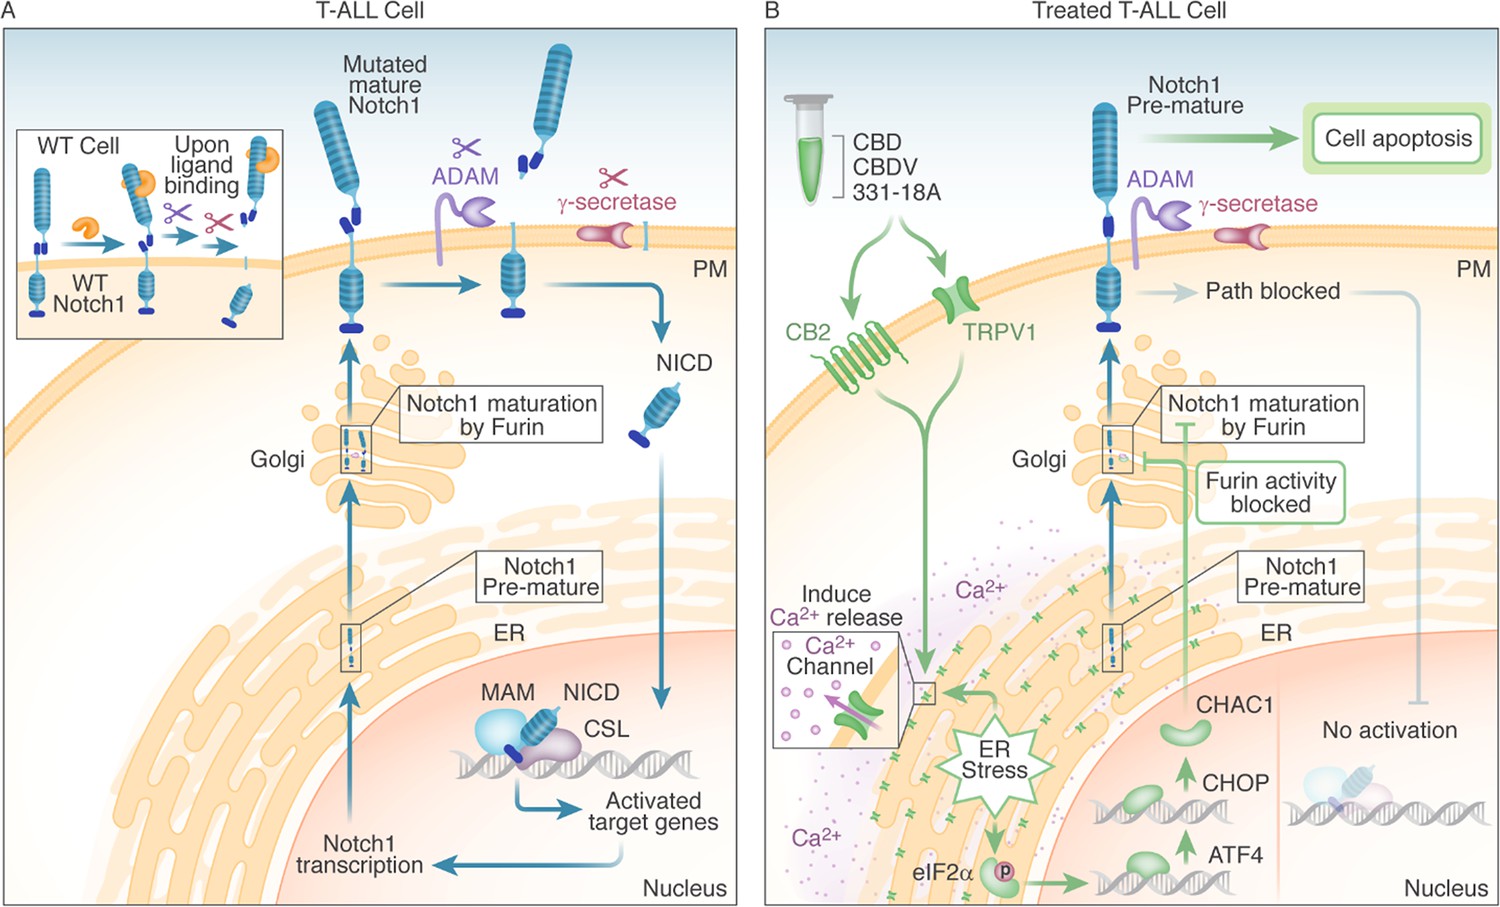
Schematic representation.
(A) In WT cells, the Notch1 receptor is only activated upon ligand binding. In T-cell acute lymphoblastic leukemia (T-ALL) cells that have a Notch1 mutation, the receptor is constitutively active regardless of ligand binding, leading to a positive feedback loop in which the mature receptor is cleaved by a series of sequential cleavage events, causing the release of Notch1 intracellular domain (NICD), which translocates to the nucleus where it promotes transcription of target genes involved in cell growth. The premature Notch1 is cleaved by a furin-like convertase in the trans-Golgi apparatus, resulting in a mature receptor that is transported to the membrane. (B) The three phytocannabinoids cannabidiol (CBD), cannabidivarin (CBDV), and 331-18A in the whole extract stimulate CB2 and TRPV1 leading to an increase in cytosolic Ca2+ and ER stress-induced activation of eIF2α followed by ATF4-CHOP-CHAC1 signaling. CHAC1 inhibits the furin-like cleavage of Notch1, preventing its maturation and resulting in reduced NICD formation, reduced cell viability, and increased apoptosis.
Author response image 1

Partial knockdown of CHAC1 hinders extract-induced cell death.
(A) MOLT-4 cells were treated with either an empty vector or shRNA for Chac1, 369 and 739 represent two different areas of Chac1, for 48 hrs. Then, the gene expression of CHAC1 was assessed via qRT-PCR (N=3). (B) MOLT-4 cells were treated as in A, then added vehicle control or whole Extract (3 µg/mL) for additional 24 hrs, and the viability of the cells was assessed with XTT.
Author response image 2

Partial knockdown of CHAC1 hinders extract-induced cell death.
(A) MOLT-4 cells were treated with either an empty vector or shRNA for Chac1, 369 and 739 represent two different areas of Chac1, for 48 hrs. Then, the gene expression of CHAC1 was assessed via qRT-PCR (N=3). (B) MOLT-4 cells were treated as in A, then added vehicle control or whole Extract (3 µg/mL) for additional 24 hrs, and the viability of the cells was assessed with XTT.
Author response image 3

Dose-response of CB2 and TRPV1 inhibitors in MOLT-4 cells.
MOLT-4 cells were treated with increasing concentrations (µM) of (A) CB2 inhibitor AM630 or (B) TRPV1 inhibitor AMG9810; and 24 hrs later the viability of the cells was assessed with XTT.
Additional files
-
Supplementary file 1
Phytocannabinoid concentrations by UHPLC/LC-MS of fractions relative to the whole extract.
- https://cdn.elifesciences.org/articles/90854/elife-90854-supp1-v1.docx
-
Supplementary file 2
Phytocannabinoid concentrations by UHPLC/LC-MS of Cannabis fraction 2 peaks.
- https://cdn.elifesciences.org/articles/90854/elife-90854-supp2-v1.docx
-
Supplementary file 3
1H and 13C peak assignments and chemical shifts of 331-18A.
- https://cdn.elifesciences.org/articles/90854/elife-90854-supp3-v1.docx
-
Supplementary file 4
Ten most increased- and decreased-abundance genes following treatment of MOLT-4 cells with the whole extract according to Affymetrix.
- https://cdn.elifesciences.org/articles/90854/elife-90854-supp4-v1.docx
-
MDAR checklist
- https://cdn.elifesciences.org/articles/90854/elife-90854-mdarchecklist1-v1.docx
Download links
A two-part list of links to download the article, or parts of the article, in various formats.
Downloads (link to download the article as PDF)
Open citations (links to open the citations from this article in various online reference manager services)
Cite this article (links to download the citations from this article in formats compatible with various reference manager tools)
Cannabinoid combination targets NOTCH1-mutated T-cell acute lymphoblastic leukemia through the integrated stress response pathway
eLife 12:RP90854.
https://doi.org/10.7554/eLife.90854.3


