The trunk replaces the longer mandible as the main feeding organ in elephant evolution
- University of Chinese Academy of Sciences, China
- Key Laboratory of Vertebrate Evolution and Human Origins of the Chinese Academy of Sciences, Institute of Vertebrate Paleontology and Paleoanthropology, Chinese Academy of Sciences, China
- Department of Earth, Ocean and Atmospheric Science, Florida State University, United States
- Environmental Science & Technology, University of Maryland, United States
- School of Civil and Hydraulic Engineering, Huazhong University of Science and Technology, China
- National Center of Technology Innovation for Digital Construction, China
Figures
Figure 1 with 5 supplements
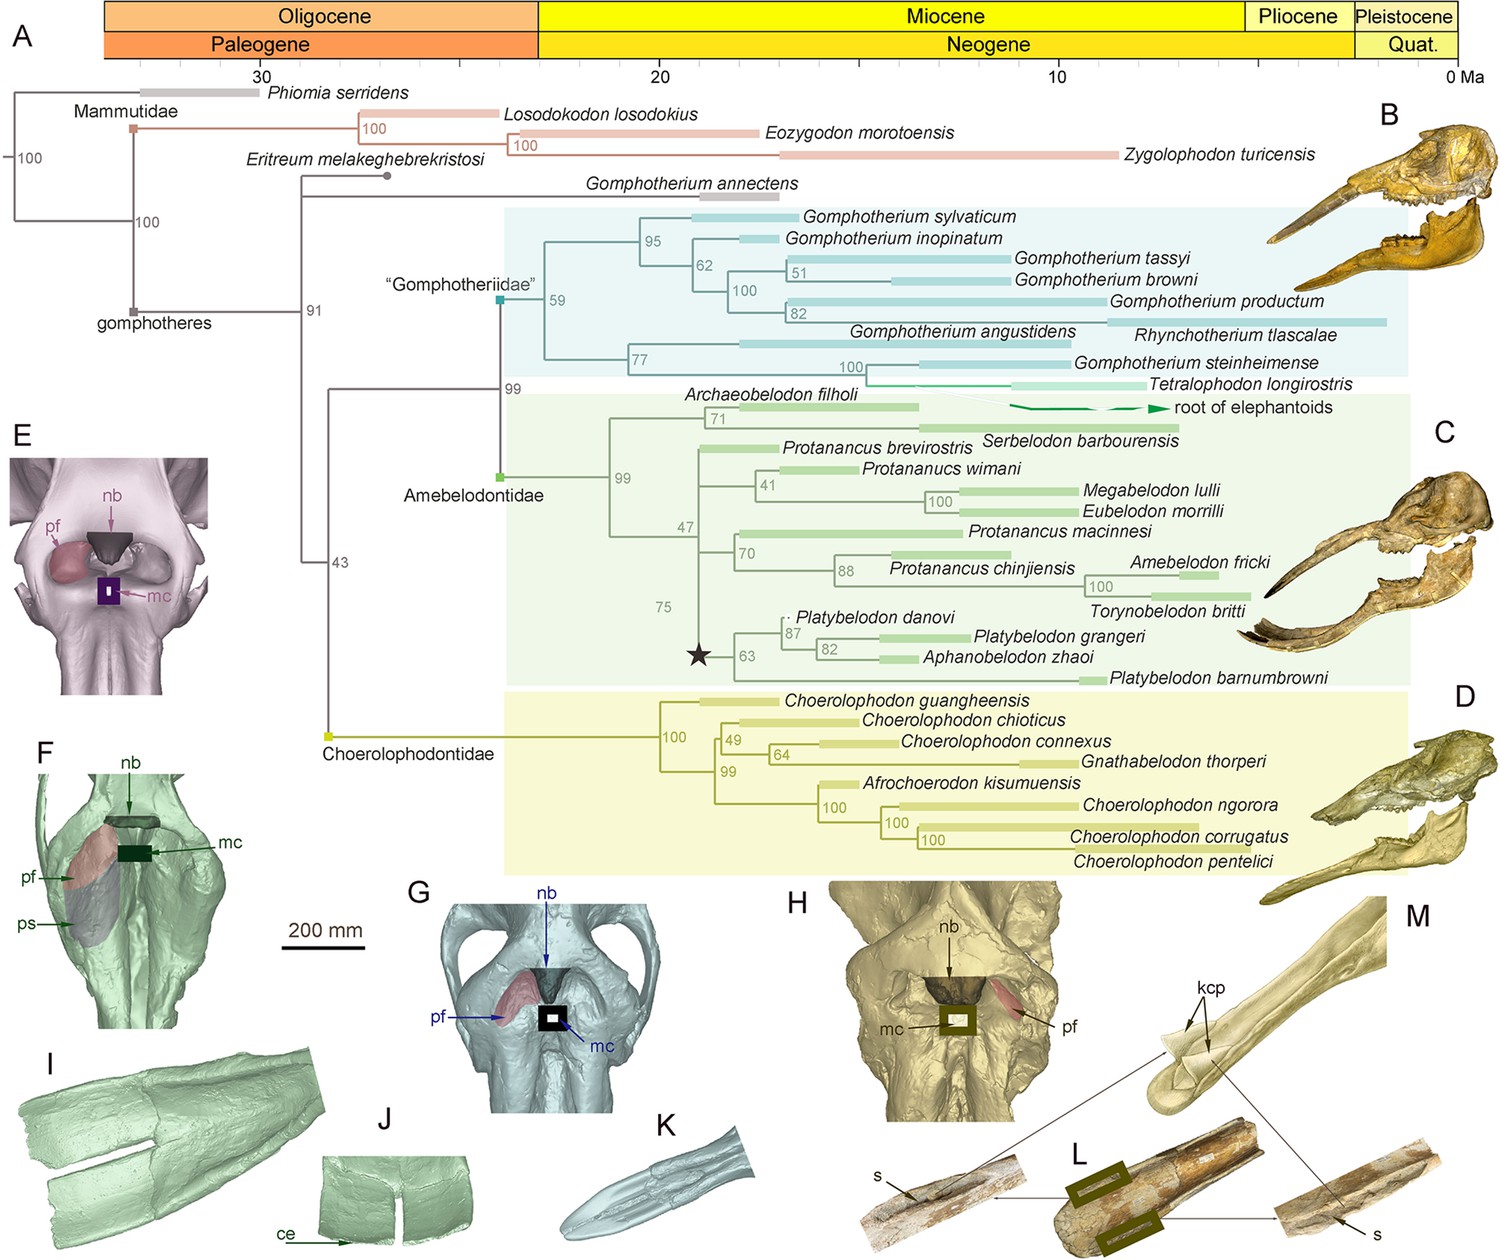
Morphology of the narial region and mandible of three gomphothere families compared with an extant elephant, and the elephantiformes phylogeny.
(A) Phylogenetic reconstruction of major longirostrine elephantiforms at the species level based on the Bayesian tip-dating method. The node support (the number at each node) is the posterior probability, and the bars represent chronologic ranges of each taxon. (B–D) Representative cranium and mandible specimens of the three gomphothere families, including IVPP V22780, cranium, and IVPP V22781, mandible, of Gomphotherium tassyi [B], ‘Gomphotheriidae’, from Heijiagou Fauna, Tongxin region (TX4); HMV 0930, cranium and associated mandible of Platybelodon grangeri [C], from Zengjia Fauna, Linxia Basin (LX3); and IVPP V23457, cranium and associated mandible of Choerolophodon chioticus [D], from Middle Miaoerling Fauna, Linxia Basin (LX2). (E–H) Narial morphology of bunodont elephantiforms and elephantids in dorsal view, including IVPP OV733, Elephas maximus [E], a living elephantid; HMV 0930, P. grangeri [F]; IVPP V22780, G. tassyi [G]; and IVPP V23457, C. chioticus [H]. Mandibular morphology of bunodont elephantiforms. (I–J) Mandibular symphysis and tusks of HMV 0930, P. grangeri, in dorsal [I] and distal [J] views. (K) Mandibular symphysis and tusks of IVPP V22781, G. tassyi, in dorsal view. (L) Mandibular symphysis of IVPP V25397, C. chioticus, showing the deep slits at both sides of the distal alveolar crests in dorsal view. (M) Reconstruction of keratinous cutting plates in the slits, in dorsolateral view. Anatomic abbreviations: ce, cutting edge of the distal mandibular tusk in Platybelodon; kcp, reconstructed keratinous cutting plates in Choerolophodon; nb, nasal process of nasal bone; mc, slit or groove for mesethmoid cartilage insertion (white in color); pf, perinasal fossa; ps, prenasal slope in Platybelodon; s, slit for holding kcp in Choerolophodon.
-
Figure 1—source data 1
Morphological characters and data set for phylogenetic analyses, characters, see Appendix.
- https://cdn.elifesciences.org/articles/90908/elife-90908-fig1-data1-v1.xlsx
Figure 1—figure supplement 1
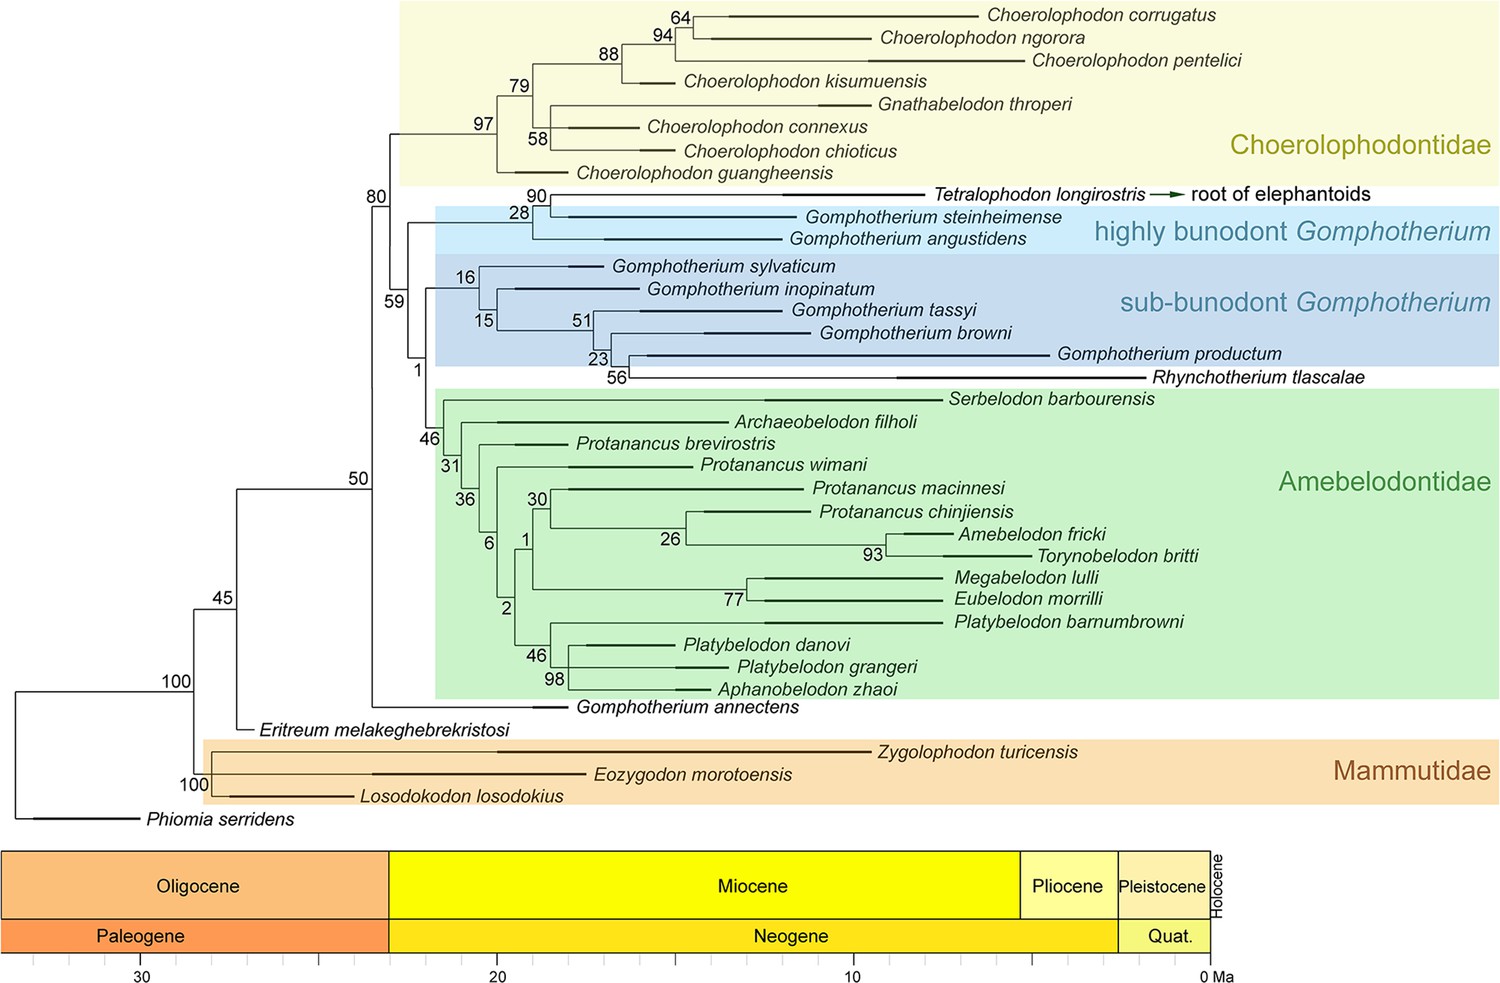
Phylogenetic reconstruction of longirostrine bunodont elephantiforms and mammutids using the maximum parsimony method (tree length, 253; CI, 0.470; RI, 0.779).
The node support (the number at each node) was calculated by symmetric resampling with 0.33 change probability (1000 replicates).
Figure 1—figure supplement 2
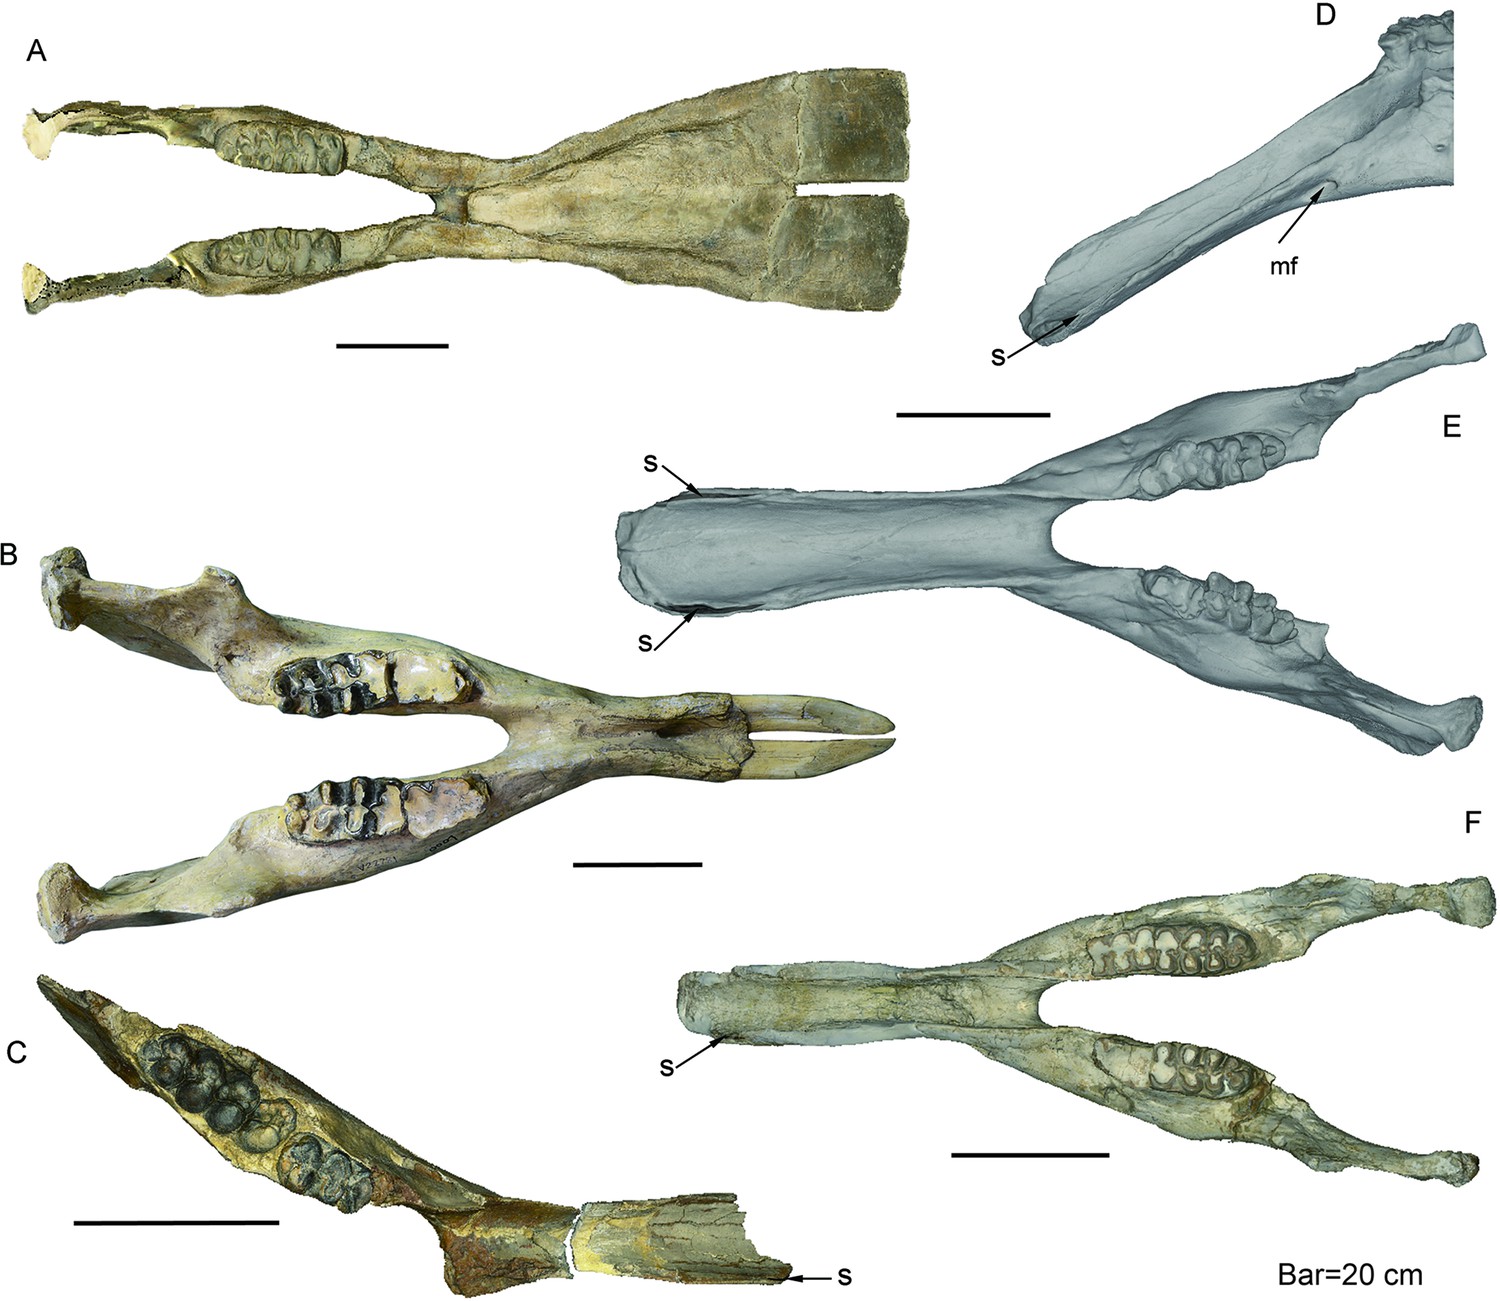
Mandible of longirostrine bunodont elephantiforms.
(A) P. grangeri, HMV 0939, from Zengjia Fauna, Linxia Basin (LX3). (B) G. tassyi, IVPP V22781, from Hejiagou Fauna, Tongxin region (TX4). (C) Choerolophodon connexus, IVPP V8567, from Halamagai Fauna, Junggar Basin (JG2). (D–F) C. chioticus, from Lower and Middle Miaoerling Faunas, Tongxin region (TX2), including IVPP V23457, male, lateral view [D], showing the large, tube-like anterior mental foramen, and dorsal view [E] and IVPP V23213 [F], female, dorsal view. Anatomic abbreviations: mf, mental foramen; s, slit for holding keratinous cutting plates in Choerolophodon.
Figure 1—figure supplement 3
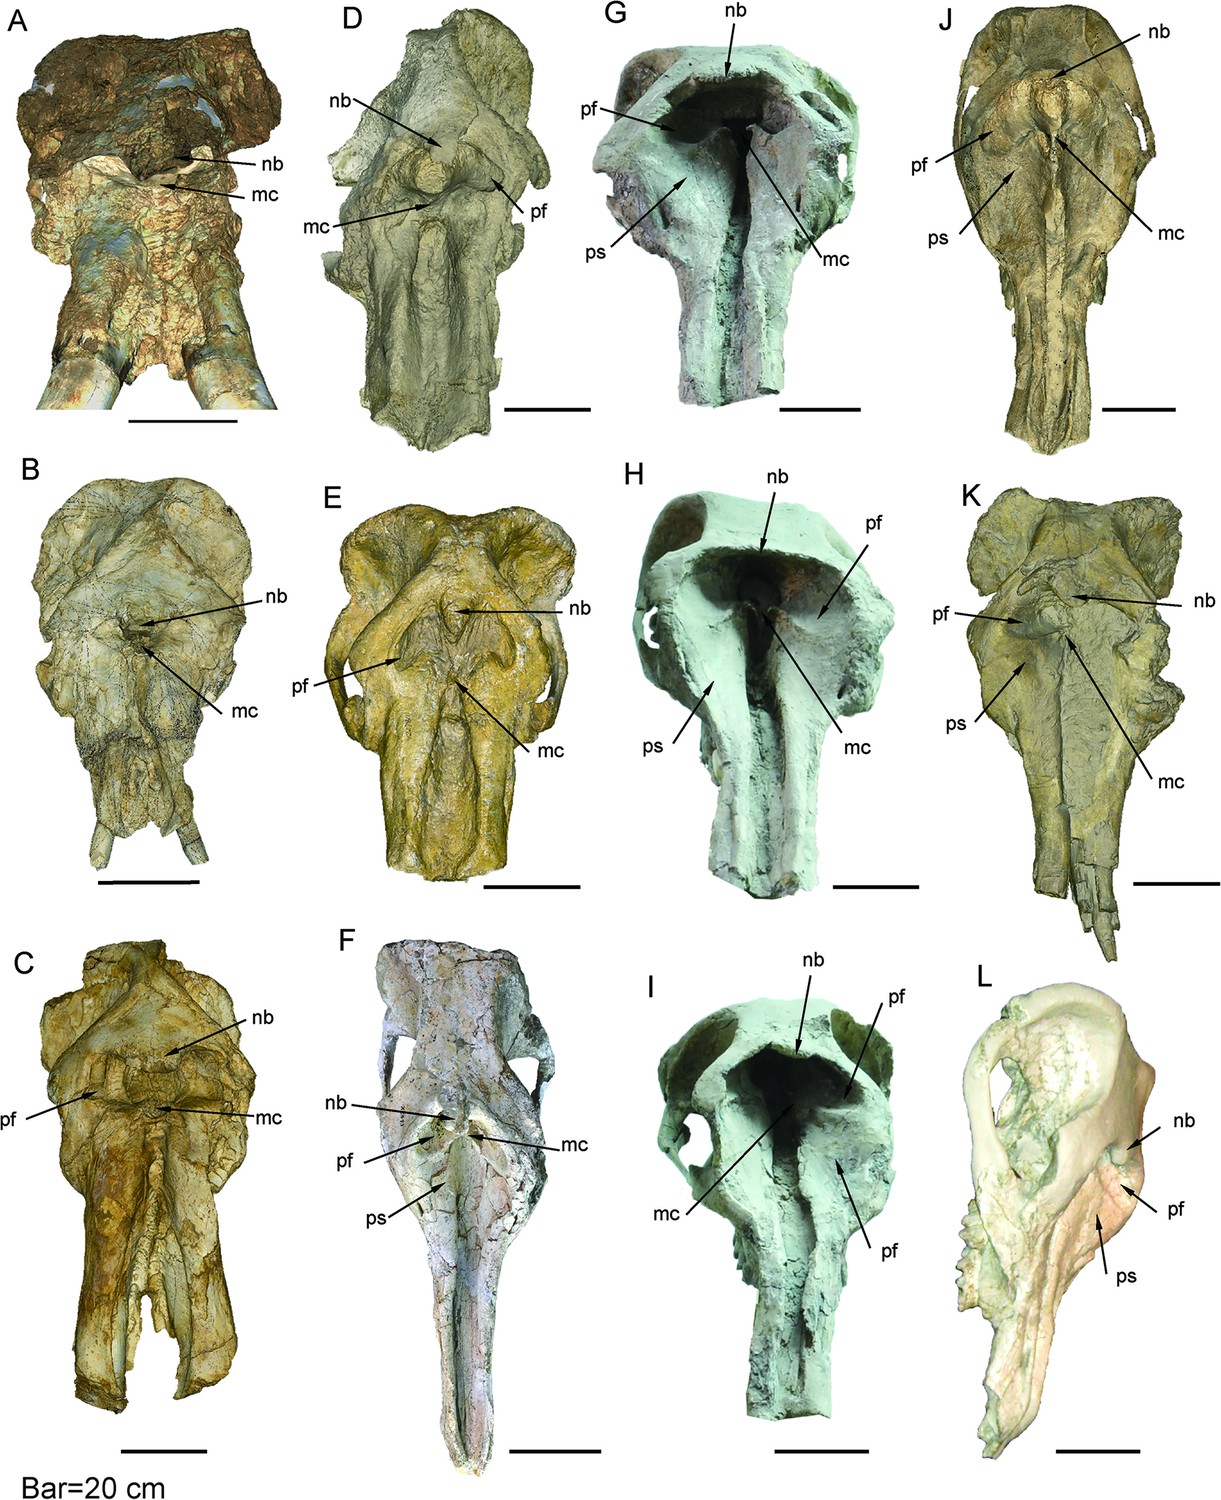
Narial region of longirostrine bunodont elephantiforms.
(A and B) Choerolophodon guangheensis showing the large nasal bone processes and insertion for mesethmoid cartilage, lacking perinasal fossae; IVPP V17685 [A], type specimen, male, from Dalanggou Fauna, Linxia Basin (LX1); IVPP V31268 [B], female, from Lower Miaoerling Fauna, Tongxin region (TX1). (C) C. chioticus, IVPP V23457, male, from Middle Miaoerling Fauna, Tongxin region (TX2), showing a large nasal bone process and mesethmoid cartilage insertion, with very small perinasal fossae. (D and E) G. tassyi showing a moderately developed nasal bone processes and mesethmoid cartilage insertion, and well-developed perinasal fossae; HMV 0028 [D], type specimen, from Zengjia fauna, Linxia (LX3); IVPP V22780 [E], from Hejiagou fauna, Tongxin region (TX4). (F) Aphanobelodon zhaoi, HMV 1880, type specimen, from Upper Miaoerling fauna, Tongxin (TX3), showing a small nasal bone process and mesethmoid cartilage insertion, well-developed perinasal fossae, and initially developed prenasal slope. (G–J) P. grangeri, showing the very small nasal bone process and mesethmoid cartilage insertion, well-developed perinasal fossae and prenasal slope, including HMV 1841 [G], HMV 1840 [H], HMV 0940 [I], and HMV 0939 [J], from Zengjia Fauna, Linxia Basin (LX3). (K) Platybelodon tongxinensis, from Lintong region showing the small nasal bone process and mesethmoid cartilage insertion, well-developed perinasal fossae, and initially developed prenasal slope. (L) Platybelodon tetralophus, AMNH 26460, from Tamuqin Fauna, Tunggur region (TG3), showing a small nasal bone process, and well-developed perinasal fossae and prenasal slope. Anatomic abbreviations: nb, nasal process of nasal bone; mc, slit or groove for mesethmoid cartilage insertion (white in color); pf, perinasal fossa; ps, prenasal slope.
Figure 1—figure supplement 4
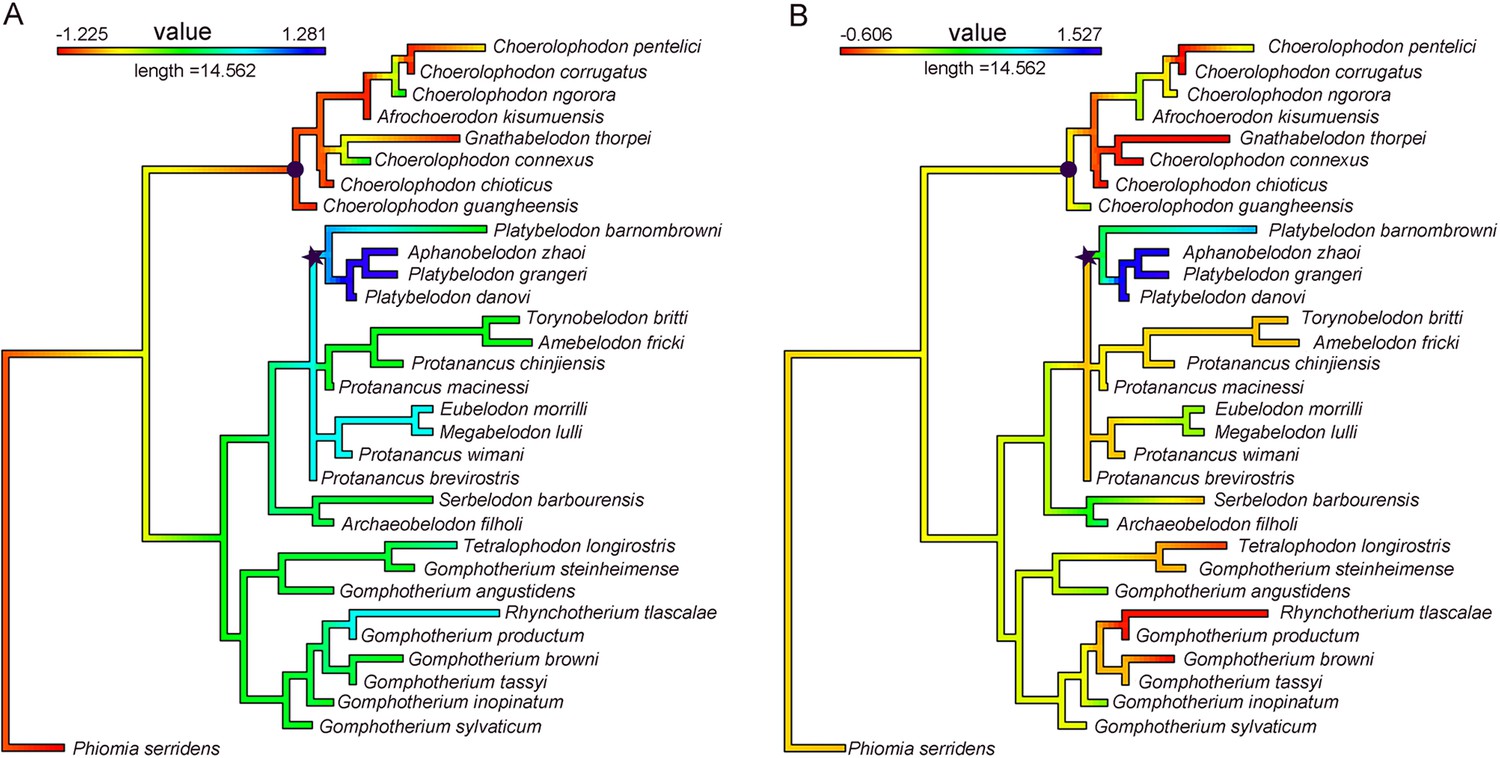
Evolutionary levels of narial region (A) and of characters in relation to horizontal cutting (B).
Value in A was PC1 of characters 54–57 (see Appendix, Figure 1—figure supplement 5C, and Figure 1—source data 1); and that in B was PC2 of characters 5, 9, 11, 72, and 77 (see Figure 1—figure supplement 5D). Note that the clade of Platybelodon (marked by an asterisk) shows high evolutionary levels and that of Choerolophodontidae (marked by a circle) shows low evolutionary levels in both character combines, strongly suggesting the co-evolution of narial morphology and horizontal cutting behavior.
Figure 1—figure supplement 5
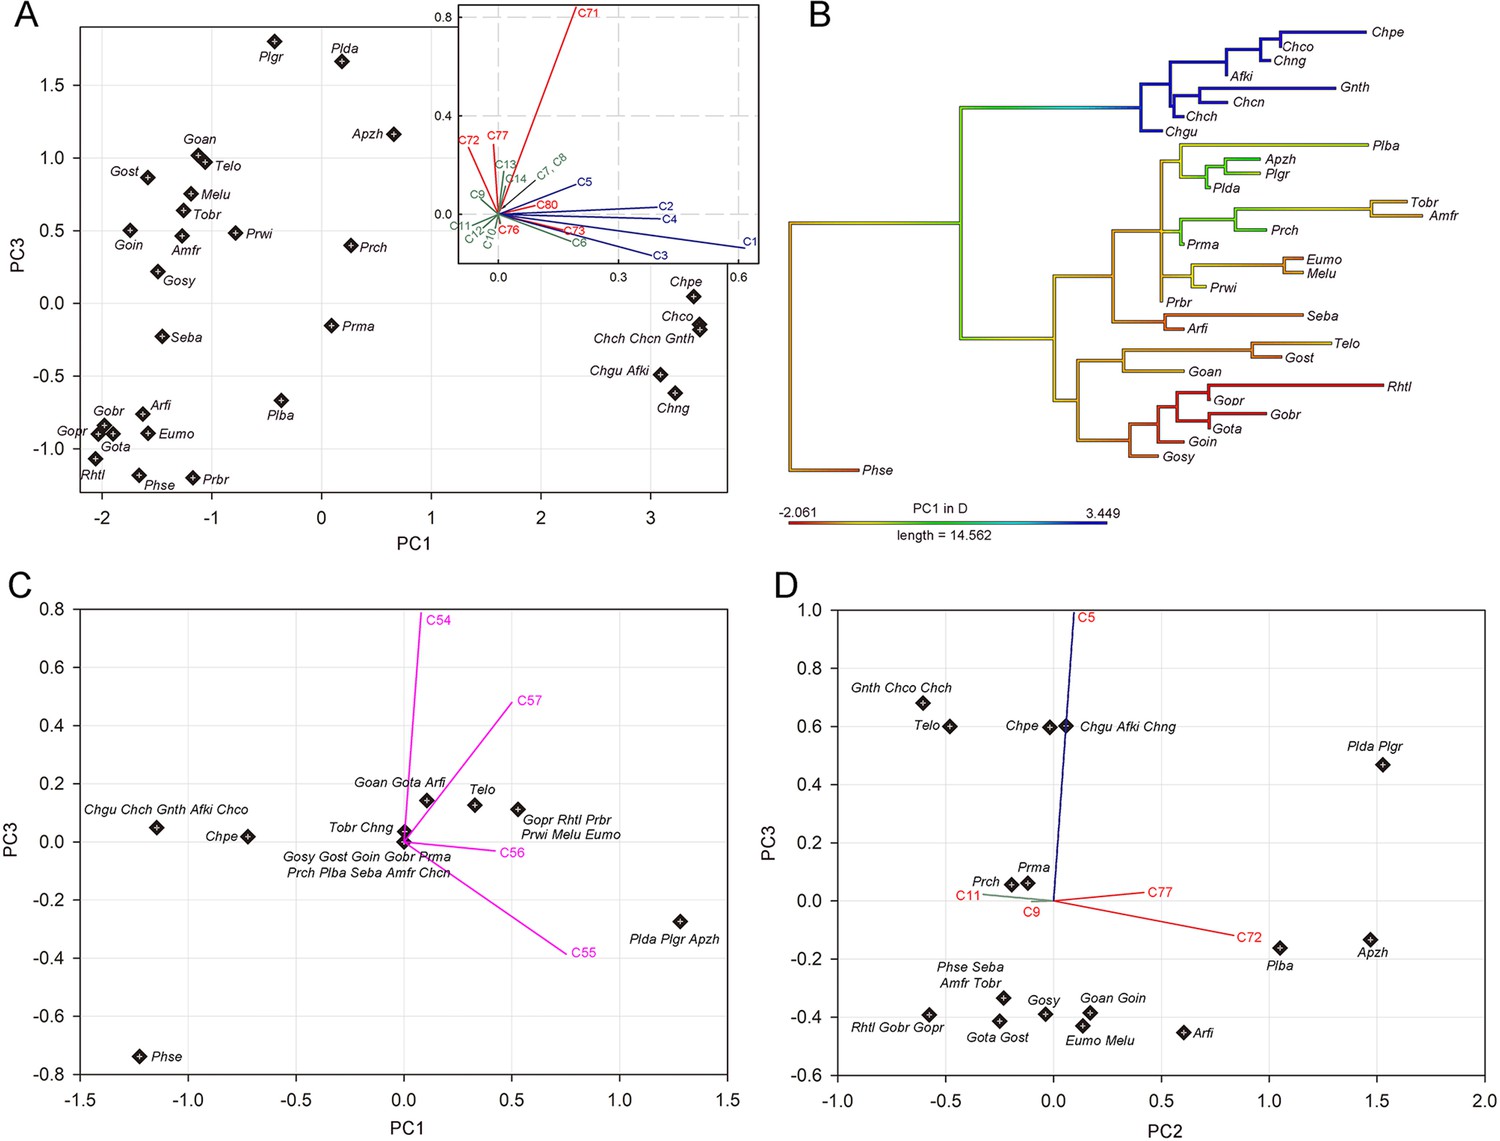
Character combines in relation to feeding behavior in trilophodont longirostrine bunodont elephantiforms.
(A) PC1–PC3 plan of character combine of tusks and mandibular symphysis; (B) PC1 scores of A that are mapped on the phylogenetic tree (mammutids and stem elephantimorphs excluded); (C) PC1–PC3 plan of character combine of narial region; (D) PC2–PC3 plan of character combine in relation to horizontal cutting behavior. In A, C, and D, character loads were shown as line segments. Notes: character load vectors were marked in purple, narial region; red, mandible; blue, upper tusk; and green, mandibular tusk, colors, respectively. Taxa abbreviation: Afki, Afrochoerodon kisumuensis; Amfr, Amebelodon fricki; Apzh, A. zhaoi; Arfi, Archoerobelodon filholi; Chch, C. chioticus; Chco, Choerolophodon corrugatus; Chcn, C. connexus; Chgu, C. guangheensis; Chng, Choerolophodon ngorora; Eumo, Eubelodon morrilli; Gnth, Gnathabelodon thorpei; Goan, Gomphotherium angustidens; Gobr, Gomphotherium browni; Goin, Gomphotherium inopinatum; Gost, Gomphotherium steinheimense; Gopr, Gomphotherium productum; Gosy, Gomphotherium sylvaticum; Gota, G. tassyi; Melu, Megabelodon lulli; Phse, Phiomia serridens; Plba, Platybelodon barnumbrowni; Plda, Platybelodon danovi; Plgr, P. grangeri; Plte, P. tetralophus; Plto, P. tongxinensis; Prch, Protanancus chinjiensis; Prbr, Protanancus brevirostris; Prma, Protanancus macinnesi; Prwi, Protanancus wimani; Rhtl, Rhynchotherium tlascalae; Seba, Serbelodon barbourensis; Telo, Tetralophodon longirostris; Tobr, Torynobelodon britti.
Figure 2 with 2 supplements
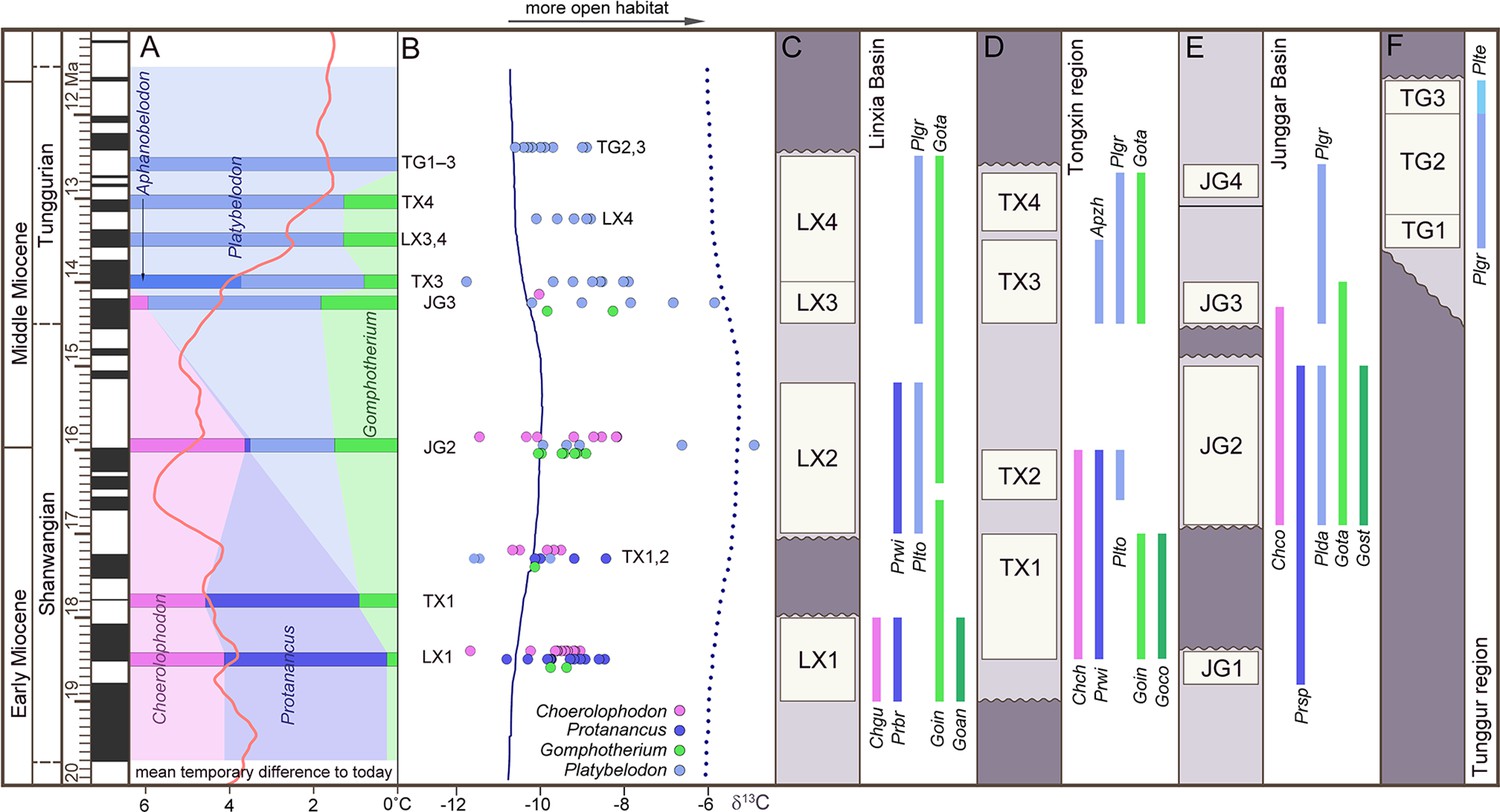
Relative abundance, tooth enamel δ13C, and stratigraphic ranges of the three gomphothere families in the Shanwangian and Tunggurian stages (~20–11.5 Ma) of northern China.
(A) Relative abundance of the three gomphothere families, including Choerolophodontidae, only represented by Choerolophodon (pink); Amebelodontidae, represented by Protanancus, Aphanobelodon (dark blue), and Platybelodon (light blue); and ‘Gomphotheriidae’, only represented by Gomphotherium (green). Horizontal bars indicate the average ages of the fossil assemblages, which are shown in C–F. The ages were determined by paleomagnetism (Supplementary file 1). The red curve shows the global reference benthic foraminifer oxygen isotope curve, which represents the global temperature (after Westerhold et al., 2020). (B) Tooth enamel stable carbon isotopic compositions of various gomphothere taxa. Each circle represents the bulk enamel δ13C values of a single tooth. The data of LX4 and TG2,3 are from previous publications (Wang and Deng, 2005; Zhang et al., 2009). Solid and dashed lines represent the mean and maximum enamel δ13C values for C3 diets that have been corrected for Miocene atmospheric CO2δ13C (after Tipple et al., 2010). (C–F) Synthetic stratigraphic columns of typical fossil bearing regions of northern China during ~19–11.5 Ma, which incorporated different fossil assemblages with different ages, from the Linxia Basin [C], Tongxin region [D], Junggar Basin [E], and Tunggur region [F]. Vertical bars represent the temporal ranges of different gomphothere taxa. Abbreviations for gomphothere taxa: Apzh, A. zhaoi; Chch, C. chioticus; Chco, C. connexus; Chgu, C. guangheensis; Goan, G. cf. angustidens; Goco, Gomphotherium cooperi; Goin, G. inopinatum; Gost, G. steinheimense; Gota, G. tassyi; Plda, Platybelodon dangheensis; Plgr, P. grangeri; Plte, P. tetralophus; Plto, P. tongxinensis; Prbr, P. brevirostris; Prsp, Protanancus sp.; Prwi, P. wimani.
-
Figure 2—source data 1
Elephantiform specimens counted in the present article are housed in Institute of Vertebrate Paleontology and Paleoanthropology (IVPP), Hezheng Paleozoological Museum (HPM), and American Museum of Natural History (AMNH).
- https://cdn.elifesciences.org/articles/90908/elife-90908-fig2-data1-v1.xlsx
-
Figure 2—source data 2
Original measurements of elephantiform tooth enamel isotope ratios analyses in the present article.
- https://cdn.elifesciences.org/articles/90908/elife-90908-fig2-data2-v1.xlsx
Figure 2—figure supplement 1
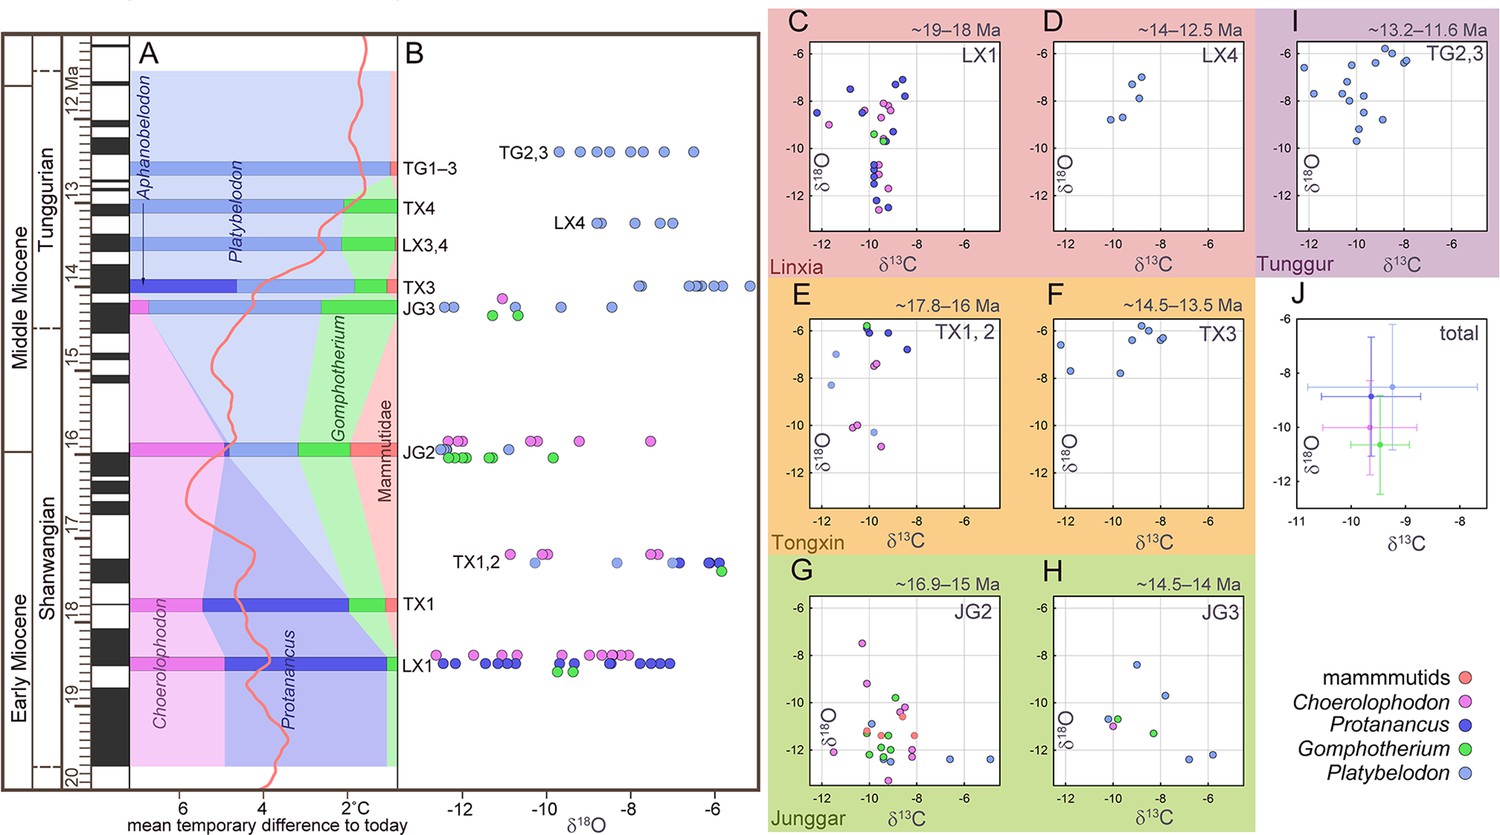
Relative abundance and tooth enamel δ18O values of fossil elephantiforms from the Shanwangian and Tunggurian stages (~19–11.5 Ma) in northern China.
(A) Relative abundances of the four elephantiform families, including Choerolophodontidae, only represented by Choerolophodon (pink); Amebelodontidae, represented by Protanancus, Aphanobelodon (dark blue), and Platybelodon (light blue); ‘Gomphotheriidae’, only represented by Gomphotherium (green); and Mammutidae (red). Horizontal bars represent the average ages of the fossil assemblages. The ages were determined by palaeomagnetism (Supplementary file 1). The red curve shows the global benthic foraminifer oxygen isotope curve, which represents the global temperature (after Westerhold et al., 2020). (B) Tooth enamel stable oxygen isotopic compositions of various gomphothere taxa. Each circle represents a single data point. (C–I) Plots of gomphothere tooth enamel stable carbon and oxygen isotopes in different fossil assemblages, including Dalanggou [C] and Laogou [D], Linxia Basin; lower Miaoerling [E] and upper Miaoerling [F], Tongxin Region; Halamagai [G] and Kekemaideng [H], Junggar Basin; and Moergen+Tamuqin [I], Tunggur region. (J) Isotopic data statistics from all gomphothere samples. The circles represent the average values, and the error bars represent the standard deviations. Abbreviations for fossil assemblages: JG1, Top Suosuoquan Fauna; JG2, Halamagai Fauna; JG3, Kekemaideng Fauna; JG4, Dingshanyanchi I Fauna; LX1, Dalanggou Fauna; LX2, Shinanu Fauna; LX3, Zengjia Fauna; LX4, Laogou Fauna; TG1, Tairum Fauna; TG2, Moergen Fauna; TG3, Tamuqin Fauna; TX1, Lower Miaoerling (Miaoerling A/B) Fauna; TX2, Middle Miaoerling (Miaoerling C) Fauna; TX3, Upper Miaoerling (Miaoerling D/E) Fauna; TX4, Heijiagou Fauna.
Figure 2—figure supplement 2
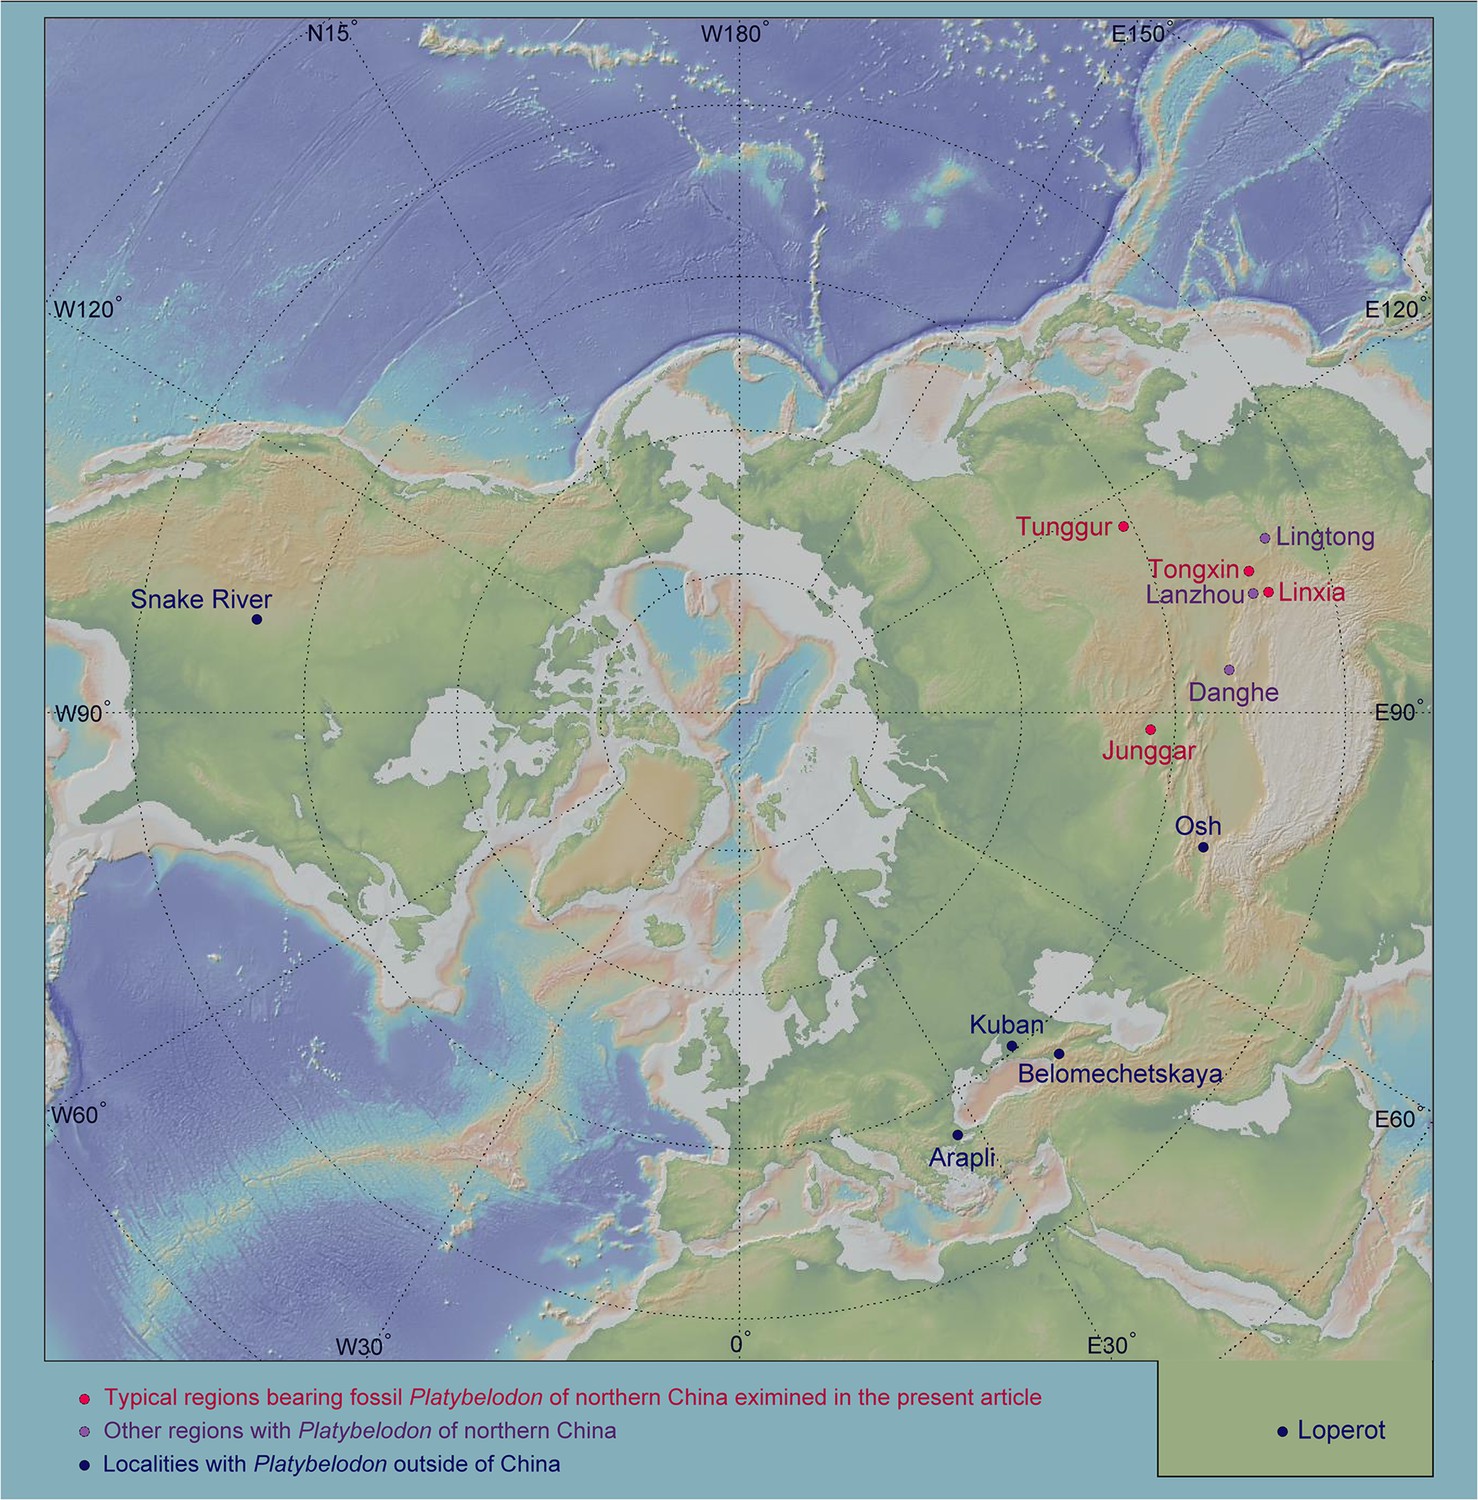
Geographic distribution of Platybelodon worldwide.
The red circles represent the four regions examined in the present article, the light purple circles show the other regions with Platybelodon in northern China, and the dark blue circles denote the Platybelodon localities outside of China. This geographic map was generated by GeoMapApp (V3.6.15) (https://www.geomapapp.org/).
Figure 3 with 4 supplements
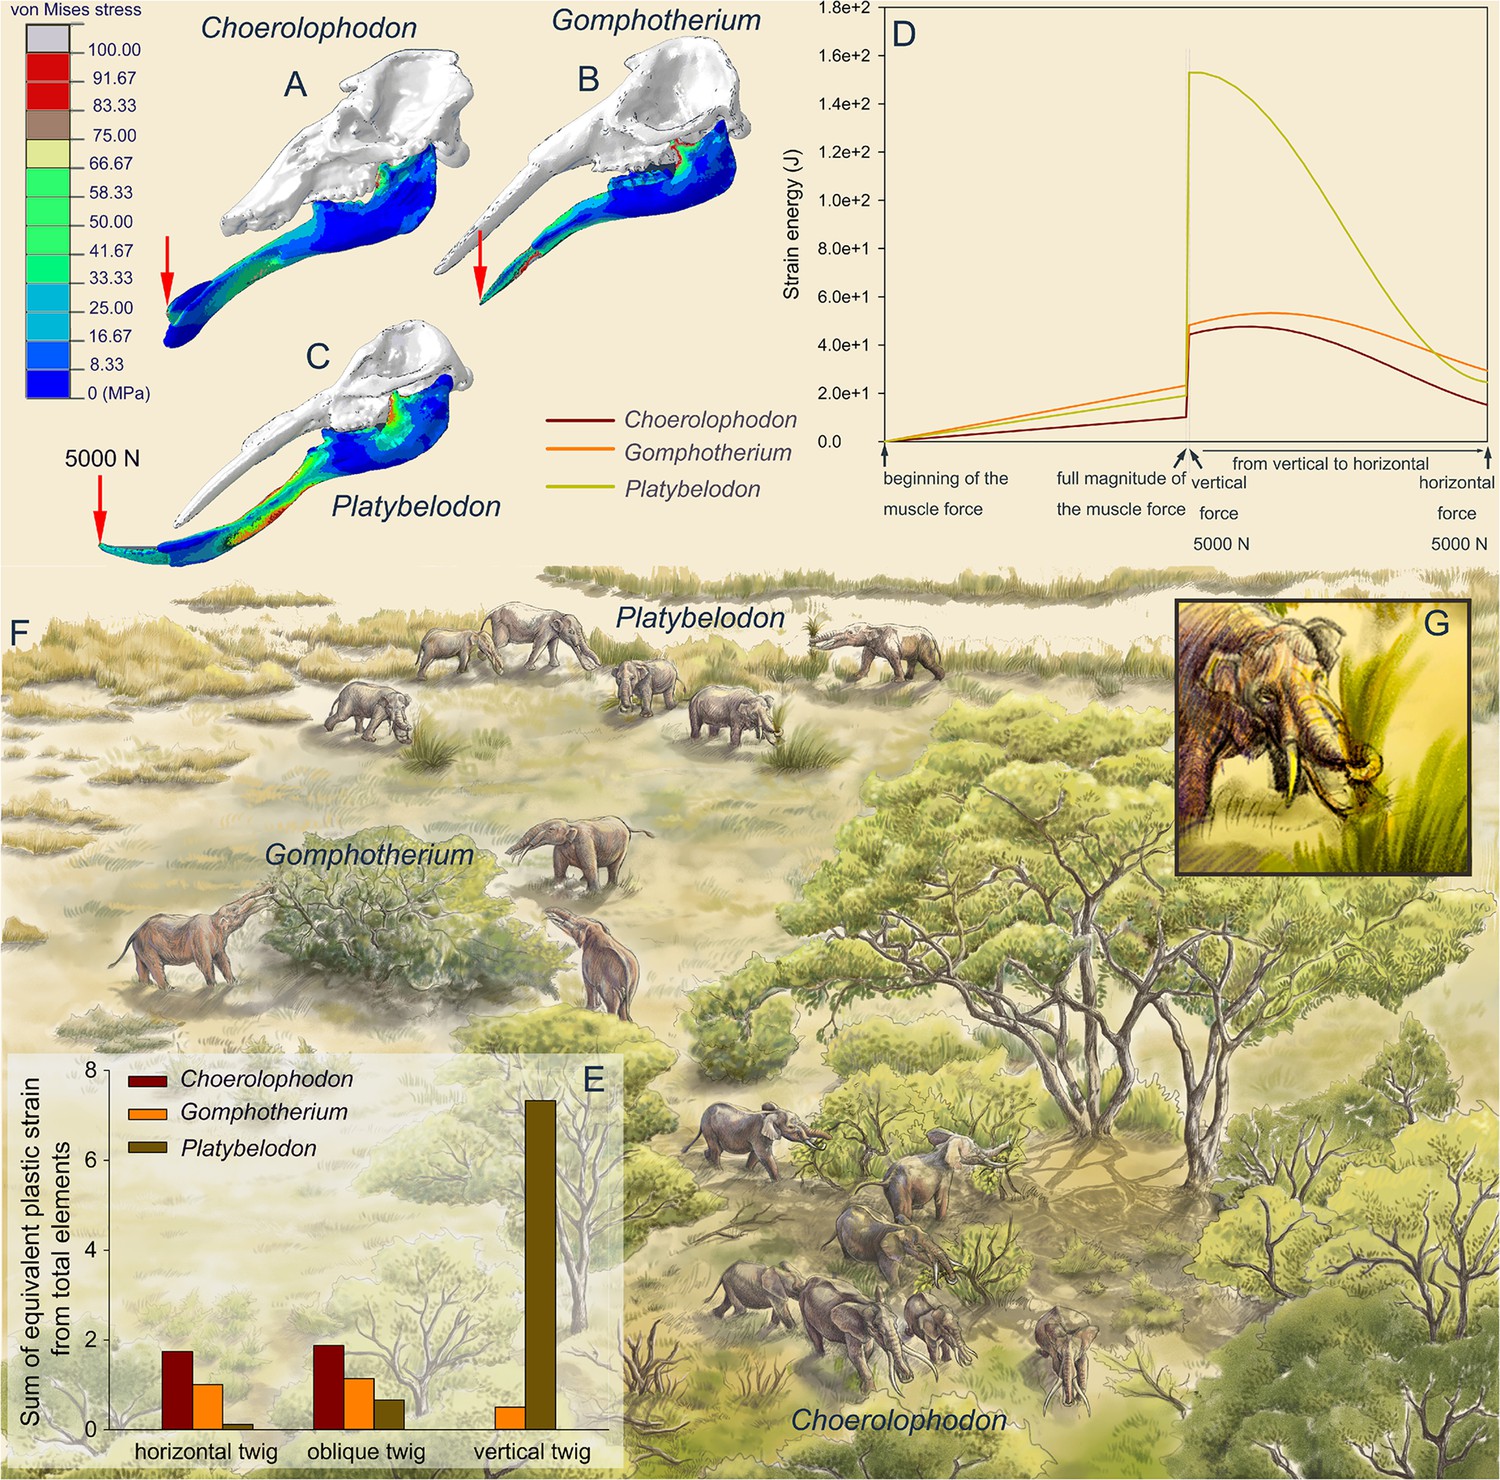
Finite element analyses of feeding behaviors among three longirostrine gomphothere families and reconstruction of their feeding ecology.
(A–C) von Mises stress color maps of Choerolophodon, Gomphotherium, and Platybelodon models, with the full muscle forces exerted, and an additional 5000 N external vertical force applied on the distal end of the mandibular symphysis. (D) Strain energy curves of the three mandibles under the following three steps: (1) muscle forces linearly exerted; (2) a 5000 N external vertical force suddenly applied on the distal end; and (3) the 5000 N external force gradually changed from vertical to horizontal. (E) Sum of equivalent plastic strain from total elements (SEPS) of twigs cut by mandible models in three different directions (i.e. twig horizontal, 45º oblique, and vertical). Larger SEPS values indicate higher efficiency of twig cutting. (F) Scenery reconstruction of feeding behaviors of the three longirostrine gomphothere families (by X Guo), represented by Choerolophodon (Choerolophodontidae), feeding in a closed forest, Gomphotherium (‘Gomphotheriidae’), feeding at the margin between the closed forest and open grassland, and Platybelodon (Amebelodontidae), feeding on open grassland. (G) Detailed 3D reconstruction of Platybelodon feeding by grasping the grass blades using their flexible trunk and cutting the grass blades using the distal edge of their mandibular tusks.
Figure 3—figure supplement 1
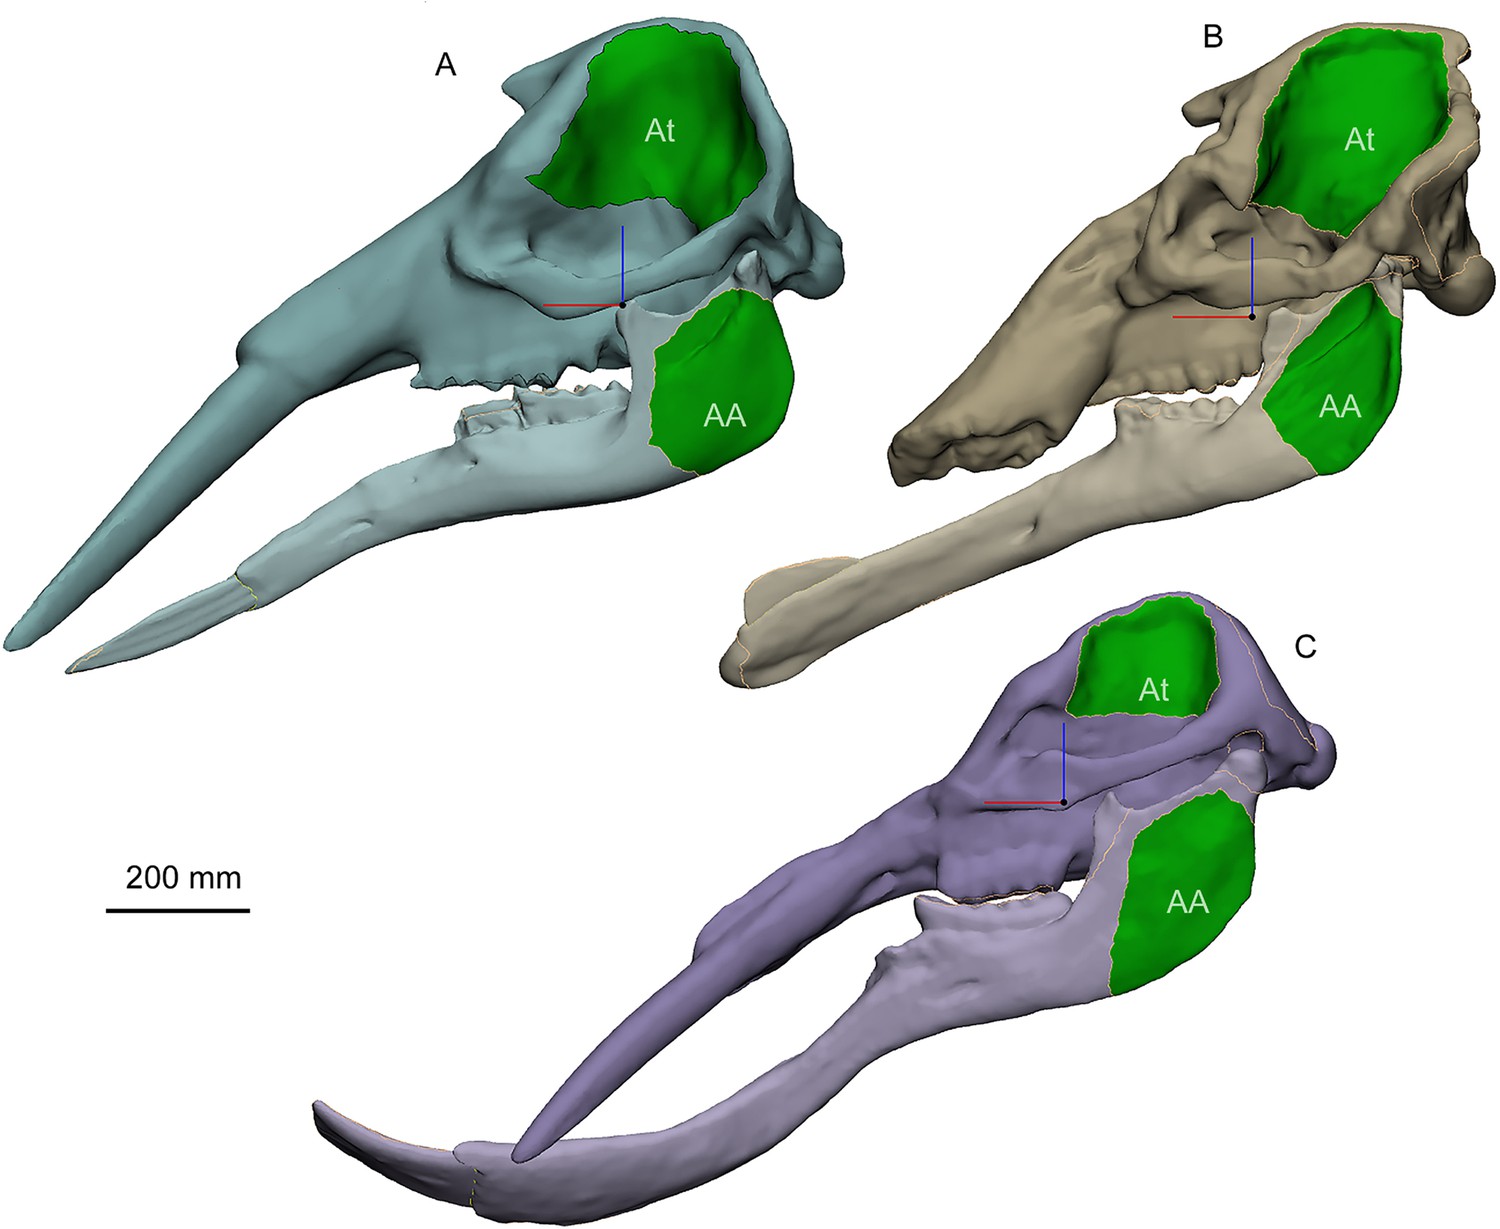
Geometric skull models for finite element (FE) analysis of three representative bunodont elephantiforms, including Gomphotherium (A), Choerolophodon (B), and Platybelodon (C), generated by Materialise 3-matic Research (V12.0).
For comparative purposes, the three bony parts of mandibles (excluding the tusk or cutting plate) were scaled to the same volume as those of Choerolophodon, and the other parts (cranium and tusk or cutting plate) were also scaled to the bony mandible of each model. The green areas indicate the surfaces for attaching temporalis (At), and superficial masseter+zygomaticomandibularis+ pterygoideus internus (AA), of which the areas were calculated for muscle force estimation. Note that the muscle forces of Choerolophodon were used in FE analyses, and those of Gomphotherium and Platybelodon were assigned the same magnitude as the muscle forces of Choerolophodon for comparative purposes.
Figure 3—figure supplement 2
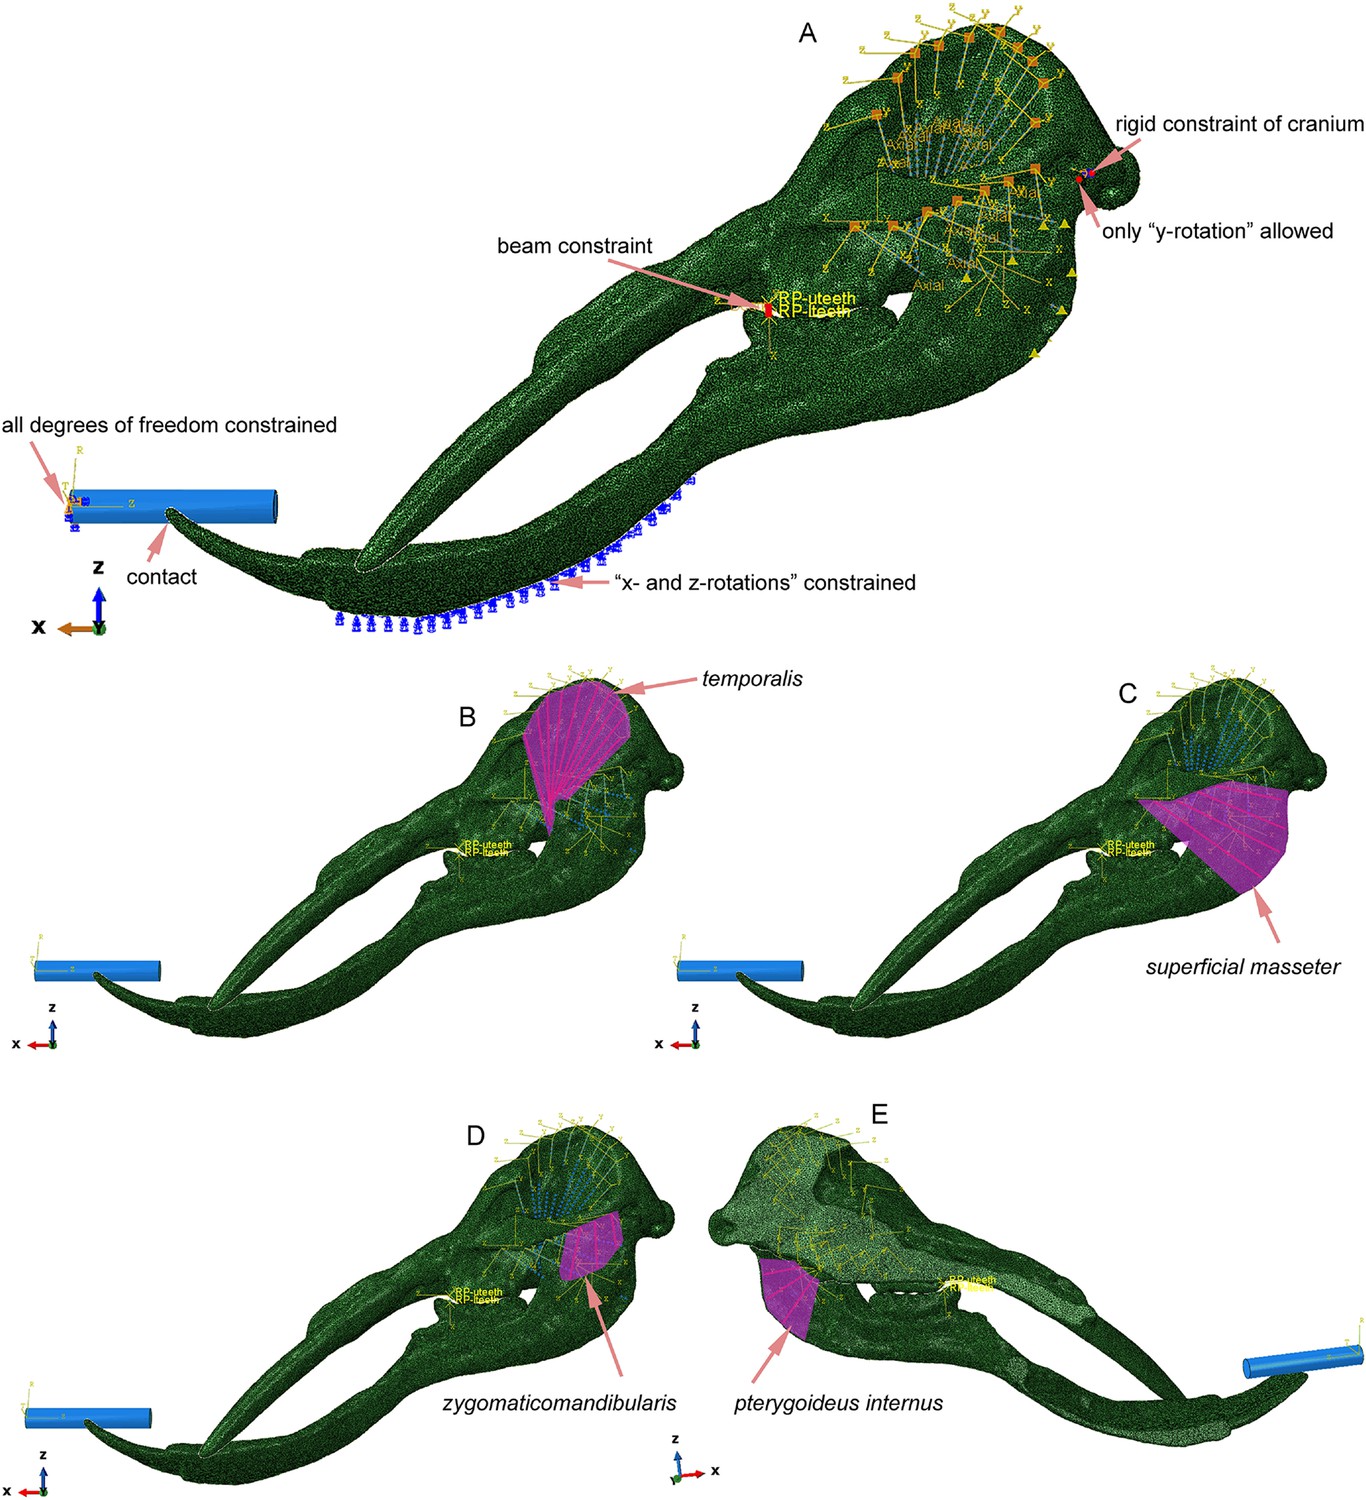
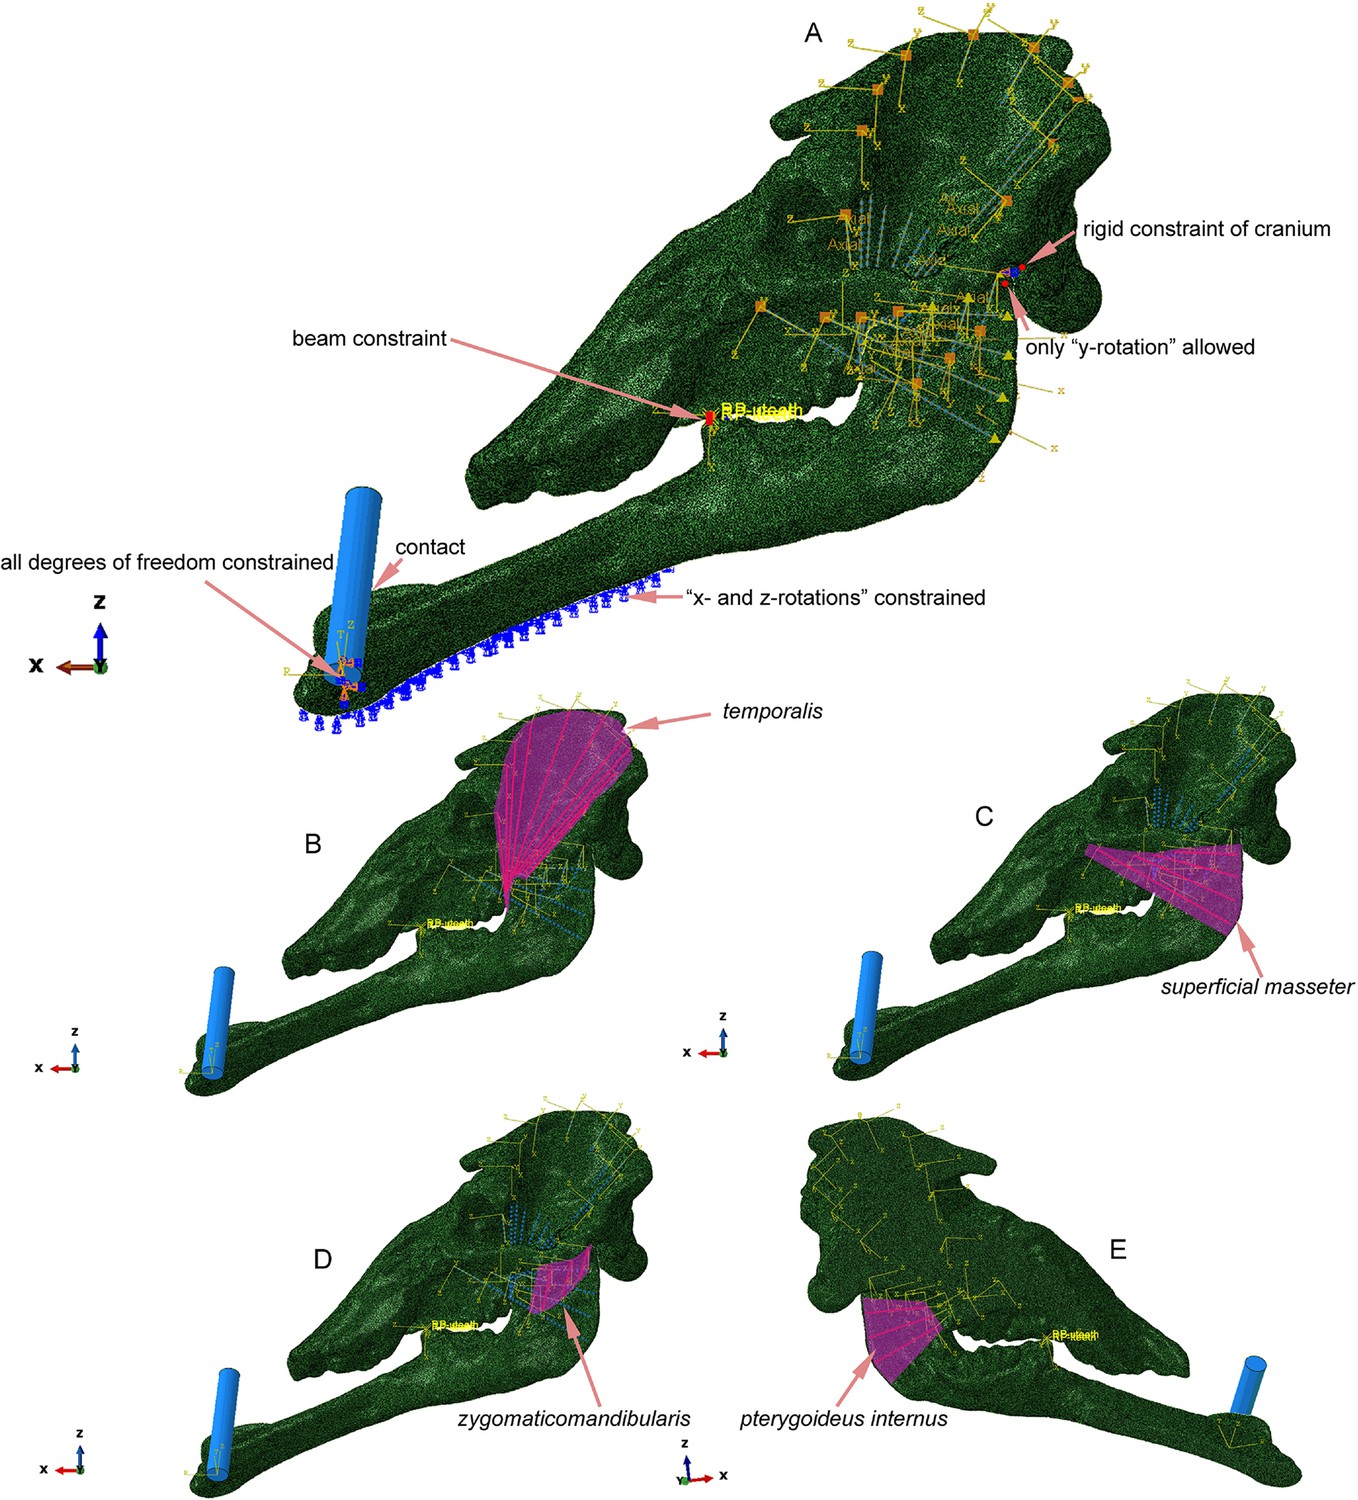
Mechanical settings of Platybelodon horizontal twig-cutting modeling; the blue cylinder represents the twig model.
(A) Constraints and boundary conditions of the model. (B) Modeling of the temporalis muscle; the muscle forces were exerted on the red axes. (C) Modeling of the superficial masseter muscle. (D) Modeling of the zygomaticomandibularis muscle. (E) Modeling of the pterygoideus internus muscle.
Figure 3—figure supplement 3
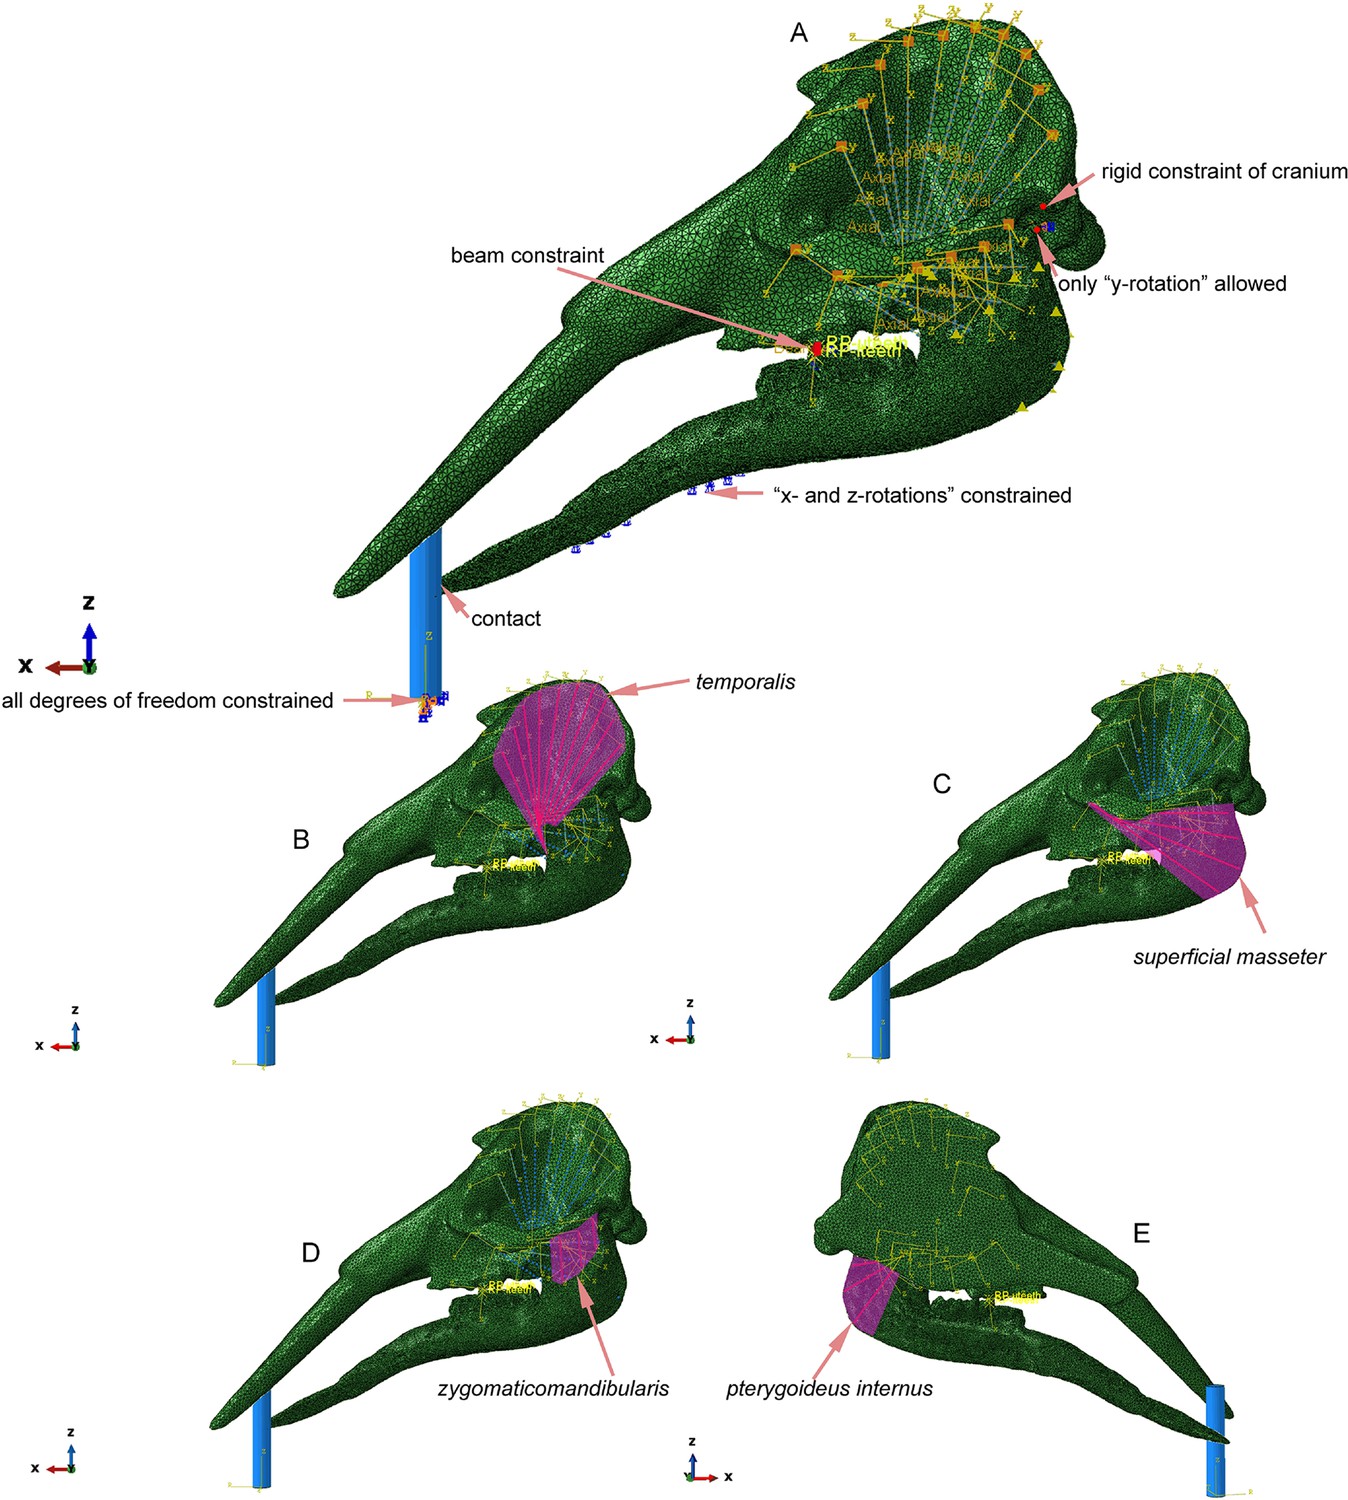
Mechanical settings of Gomphotherium vertical twig-cutting modeling.
(A) Constraints and boundary conditions of the model. (B) Modeling of the temporalis muscle. (C) Modeling of the superficial masseter muscle. (D) Modeling of the zygomaticomandibularis muscle. (E) Modeling of the pterygoideus internus muscle.
Figure 3—figure supplement 4
Mechanical settings of Choerolophodon oblique twig-cutting modeling.
(A) Constraints and boundary conditions of the model. (B) Modeling of the temporalis muscle. (C) Modeling of the superficial masseter muscle. (D) Modeling of the zygomaticomandibularis muscle. (E) Modeling of the pterygoideus internus muscle.
Videos
Video 1
Finite element (FE) modeling of Platybelodon distal force test, color map showing the von Mises stress.
Video 2
Finite element (FE) modeling of Gomphotherium distal force test, color map showing the von Mises stress.
Video 3
Finite element (FE) modeling of Choerolophodon distal force test, color map showing the von Mises stress.
Video 4
Finite element (FE) modeling of Platybelodon vertical twig-cutting test, the total model, color map showing the von Mises stress.
Video 5
Finite element (FE) modeling of Platybelodon vertical twig-cutting test, the twig model (facing to the surface that is in contact with the tusk), color map showing the equivalent plastic strain.
Video 6
Finite element (FE) modeling of Platybelodon oblique twig-cutting test, the total model, color map showing the von Mises stress.
Video 7
Finite element (FE) modeling of Platybelodon oblique twig-cutting test, the twig model (facing to the surface that is in contact with the tusk), color map showing the equivalent plastic strain.
Video 8
Finite element (FE) modeling of Platybelodon horizontal twig-cutting test, the total model, color map showing the von Mises stress.
Video 9
Finite element (FE) modeling of Platybelodon horizontal twig-cutting test, the twig model (facing to the surface that is in contact with the tusk), color map showing the equivalent plastic strain.
Video 10
Finite element (FE) modeling of Gomphotherium vertical twig-cutting test, the total model, color map showing the von Mises stress.
Video 11
Finite element (FE) modeling of Gomphotherium vertical twig-cutting test, the twig model (facing to the surface that is in contact with the tusk), color map showing the equivalent plastic strain.
Video 12
Finite element (FE) modeling of Gomphotherium oblique twig-cutting test, the total model, color map showing the von Mises stress.
Video 13
Finite element (FE) modeling of Gomphotherium oblique twig-cutting test, the twig model (facing to the surface that is in contact with the tusk), color map showing the equivalent plastic strain.
Video 14
Finite element (FE) modeling of Gomphotherium horizontal twig-cutting test, the total model, color map showing the von Mises stress.
Video 15
Finite element (FE) modeling of Gomphotherium horizontal twig-cutting test, the twig model (facing to the surface that is in contact with the tusk), color map showing the equivalent plastic strain.
Video 16
Finite element (FE) modeling of Choerolophodon oblique twig-cutting test, the total model, color map showing the von Mises stress.
Video 17
Finite element (FE) modeling of Choerolophodon oblique twig-cutting test, the twig model (facing to the surface that is in contact with the cutting plate), color map showing the equivalent plastic strain.
Video 18
Finite element (FE) modeling of Choerolophodon horizontal twig-cutting test, the total model, color map showing the von Mises stress.
Video 19
Finite element (FE) modeling of Choerolophodon horizontal twig-cutting test, the twig model (facing to the surface that is in contact with the cutting plate), color map showing the equivalent plastic strain.
Additional files
-
Supplementary file 1
1 Age estimation of different faunas of the four regions.
2 Geometric and mesh parameters of the finite element (FE) models. 3 Material properties in the finite element (FE) models. 4 Muscle forces estimation of finite element (FE) models.
- https://cdn.elifesciences.org/articles/90908/elife-90908-supp1-v1.xlsx
-
Supplementary file 2
3D model 1 Platybelodon cranium model (.stl file), 3D model 2 Platybelodon mandible model (.stl file), 3D model 3 Gomphotherium cranium model (.stl file), 3D model 4 Gomphotherium mandible model (.stl file), 3D model 5 Choerolophodon cranium model (.stl file), 3D model 6 Choerolophodon mandible model (.stl file).
- https://cdn.elifesciences.org/articles/90908/elife-90908-supp2-v1.zip
-
MDAR checklist
- https://cdn.elifesciences.org/articles/90908/elife-90908-mdarchecklist1-v1.pdf
Download links
A two-part list of links to download the article, or parts of the article, in various formats.
Downloads (link to download the article as PDF)
Open citations (links to open the citations from this article in various online reference manager services)
Cite this article (links to download the citations from this article in formats compatible with various reference manager tools)
The trunk replaces the longer mandible as the main feeding organ in elephant evolution
eLife 12:RP90908.
https://doi.org/10.7554/eLife.90908.3


