Neurofeedback training can modulate task-relevant memory replay rate in rats
- Departments of Biological Structure and Lab Medicine & Pathology, University of Washington, United States
- Departments of Physiology and Psychiatry and the Kavli Institute for Fundamental Neuroscience, University of California, San Francisco, United States
- Howard Hughes Medical Institute, United States
Figures
Figure 1 with 1 supplement
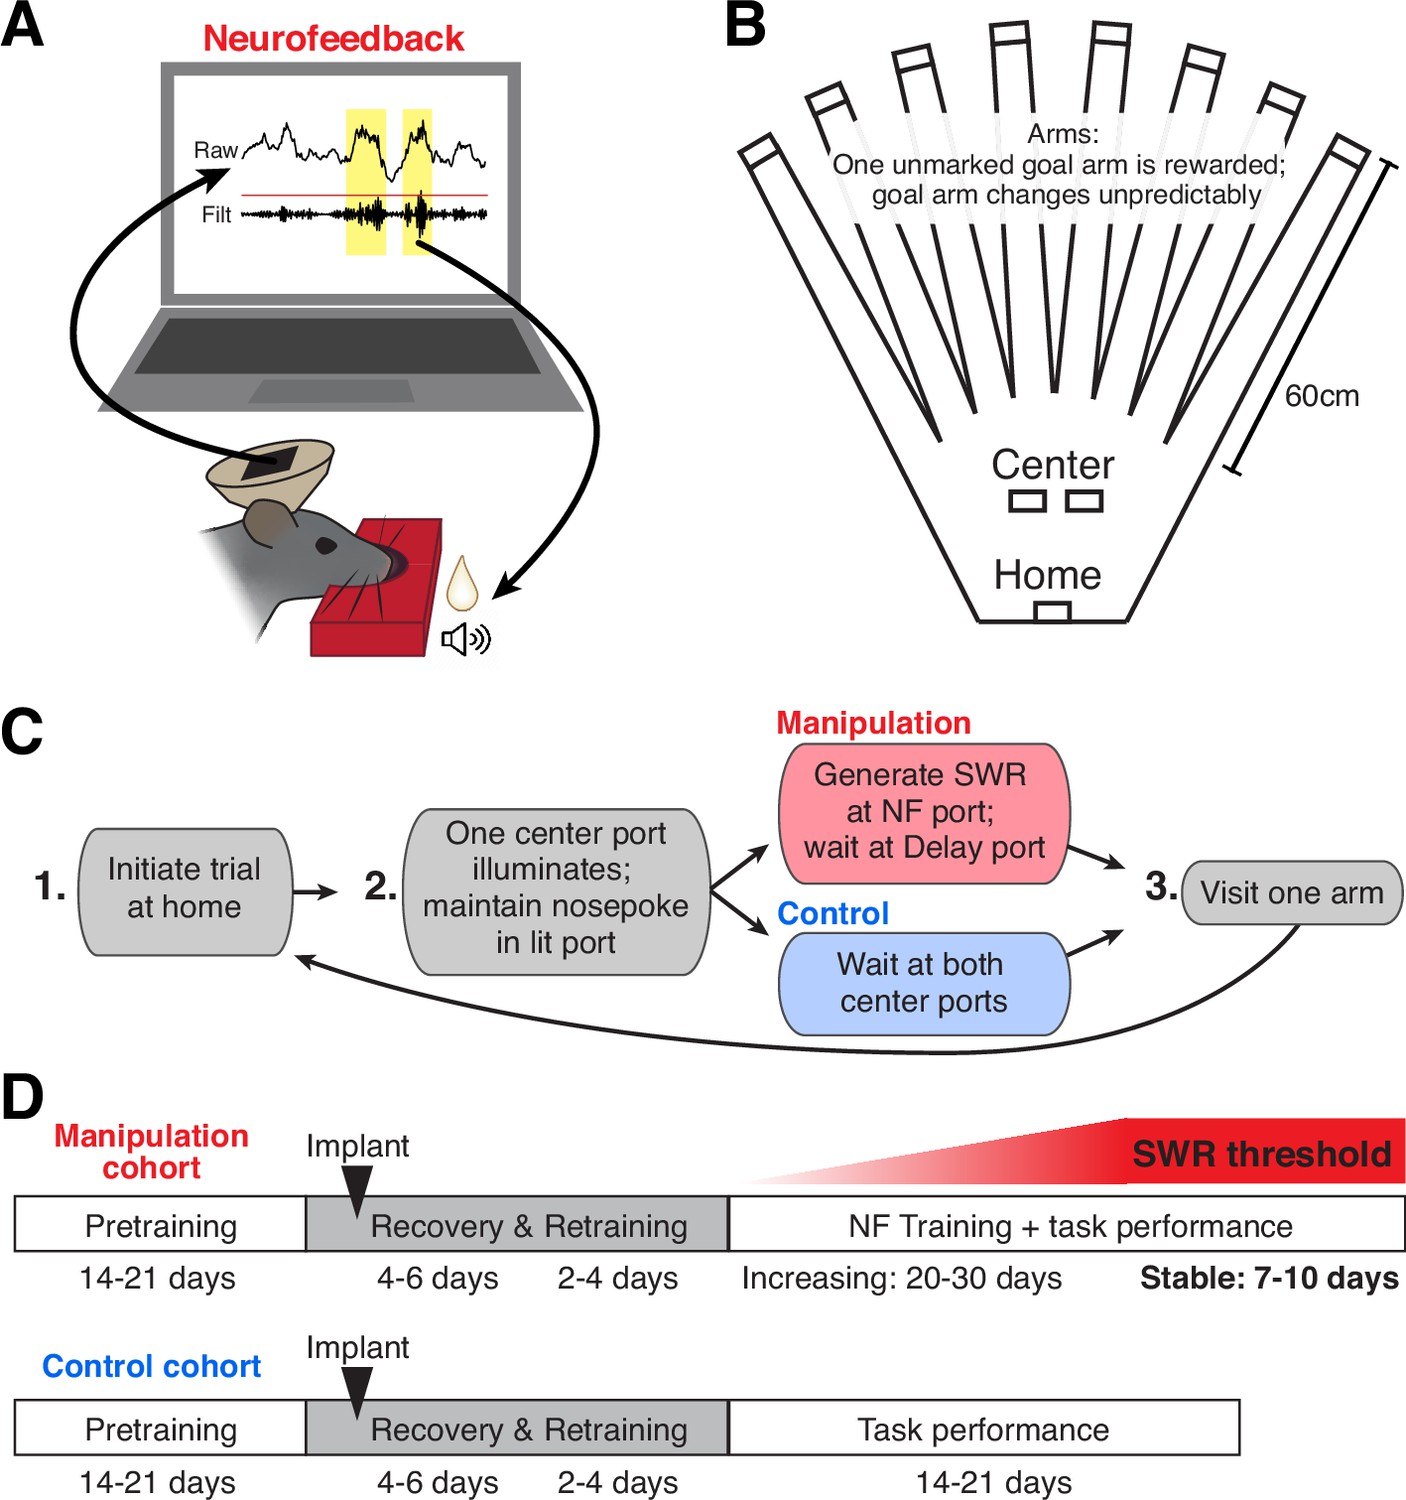
A neurofeedback paradigm to promote SWRs.
(A) Schematic of the neurofeedback (NF) protocol: while subject’s nose remains in the neurofeedback port, SWRs (yellow) are detected in real time. Top trace: raw CA1 LFP; bottom trace: ripple filtered (150–250 Hz) CA1 LFP. During the neurofeedback interval, the first event exceeding a set standard deviation (sd) threshold (red line) triggers the delivery of a sound cue and food reward to the rat. (B) Top-down view of the maze environment. Reward ports are indicated by rectangles. (C) The rules of the spatial memory task for each of the behavioral cohorts. (D) Experimental timeline for each behavioral cohort.
Figure 1—figure supplement 1
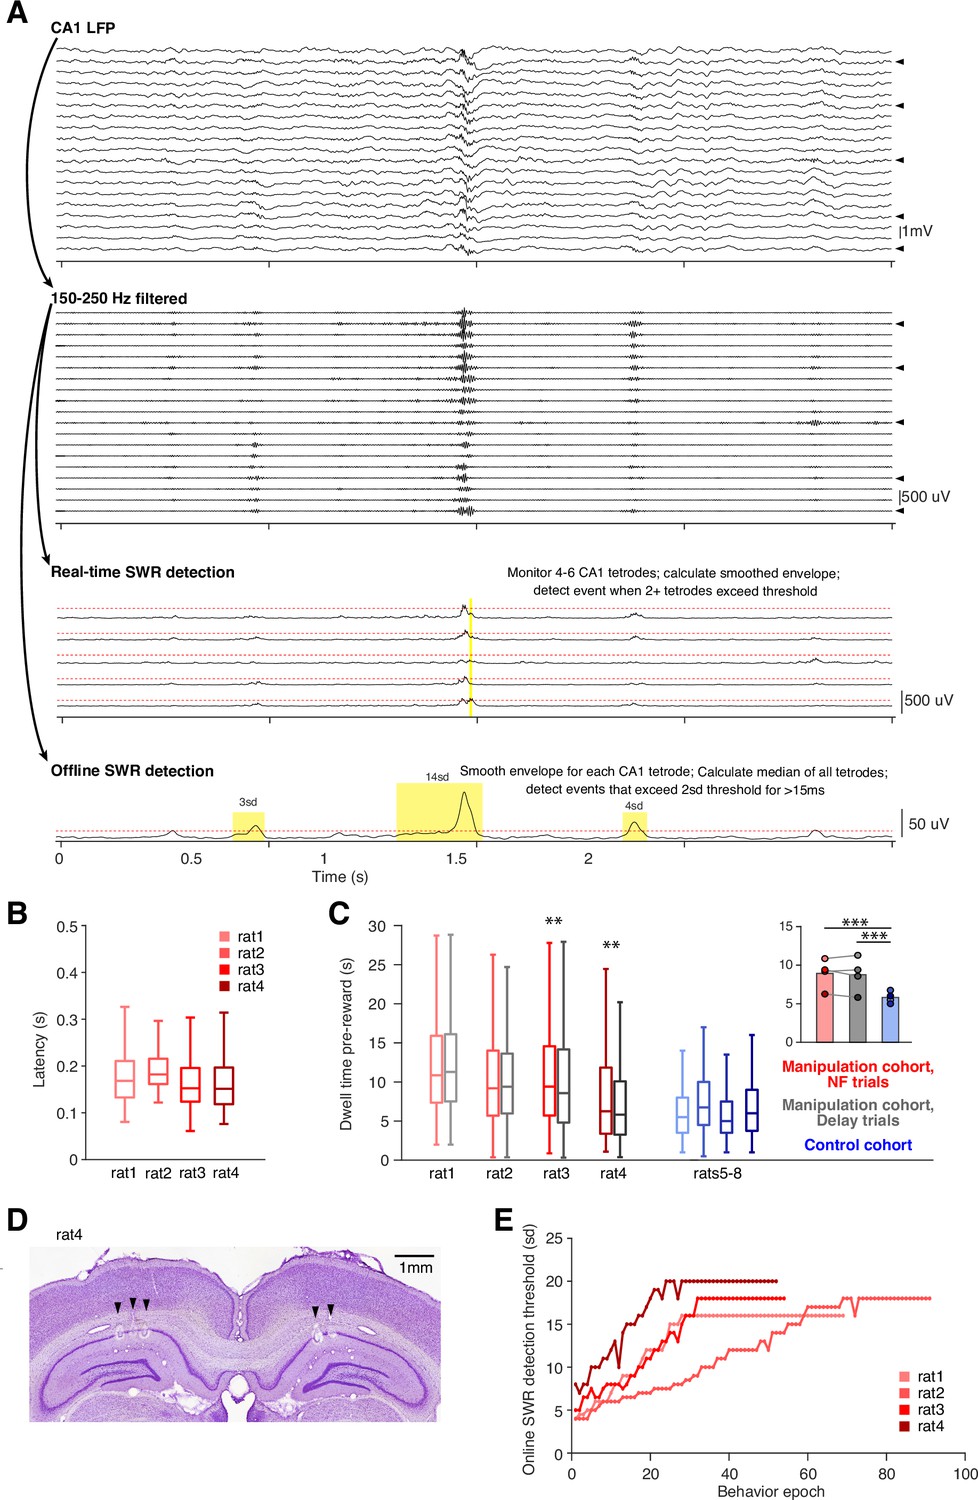
A neurofeedback paradigm to promote SWRs.
(A) Schematic of the online and offline SWR detection strategies used. For both detection methods, raw LFP from tetrodes located in CA1 cell layer are filtered for ripple band power (100–400 Hz bandpass filter for online detection; 150–250 Hz bandpass filter for offline detection). For online detection, 4–6 tetrodes are chosen each day (marked with arrowheads). During a period of movement just prior to the start of the behavioral epoch, the envelope of the ripple filtered signal is calculated for the chosen tetrodes, the mean and standard deviation (sd) of the envelope are calculated, and are fixed for the subsequent behavioral epoch. A threshold is set as a certain number of sd above the mean and events which cross this threshold on at least two chosen tetrodes simultaneously are detected as suprathreshold SWRs. In contrast, the offline detection strategy calculates the envelope of the ripple-filtered trace for all CA1 cell layer tetrodes and calculates a “consensus trace” as the median across tetrodes (see Methods). The mean and sd of this consensus trace is calculated and events which exceed 2 sd above the mean for at least 15ms are considered SWR events. (B) Feedback latency to reward delivery for the manipulation cohort. Feedback latency is calculated as the time between the start of the offline-detected SWR event and the tone/reward delivery. Note that this latency includes both the time for the event to reach the online detection threshold on multiple tetrodes as well as the fixed delay added to reduce the chance of feedback delivery interrupting the ongoing SWR event (100, 50, 75, and 75ms for each subject, respectively). n=3948, 2155, 3880, and 4894 suprathreshold events per subject, respectively. (C) Time spent at the center ports pre-reward for subjects of each cohort. Manipulation cohort n=1892, 684, 1157, and 1602 NF trials and 2022, 640, 1201, and 1552 delay trials; control cohort n=2490, 2629, 2027, and 3021 trials, respectively. Manipulation cohort ranksum comparisons between neurofeedback (NF) and delay trials: p=0.228, 0.690, 0.005, and 0.002, respectively. Inset: Groupwise comparisons. Manipulation cohort NF trials vs control cohort trials: p=2.936 × 10⁻⁹; manipulation cohort delay trials vs control cohort trials: p=2.178 × 10⁻⁵. (D) Representative histology example from rat4 showing lesions (arrowheads) at locations where tetrode tips were located in dorsal CA1 cell layer. (E) Maximum online detection threshold for SWRs for each behavioral epoch of neurofeedback training for subjects in the manipulation cohort.
Figure 2 with 1 supplement
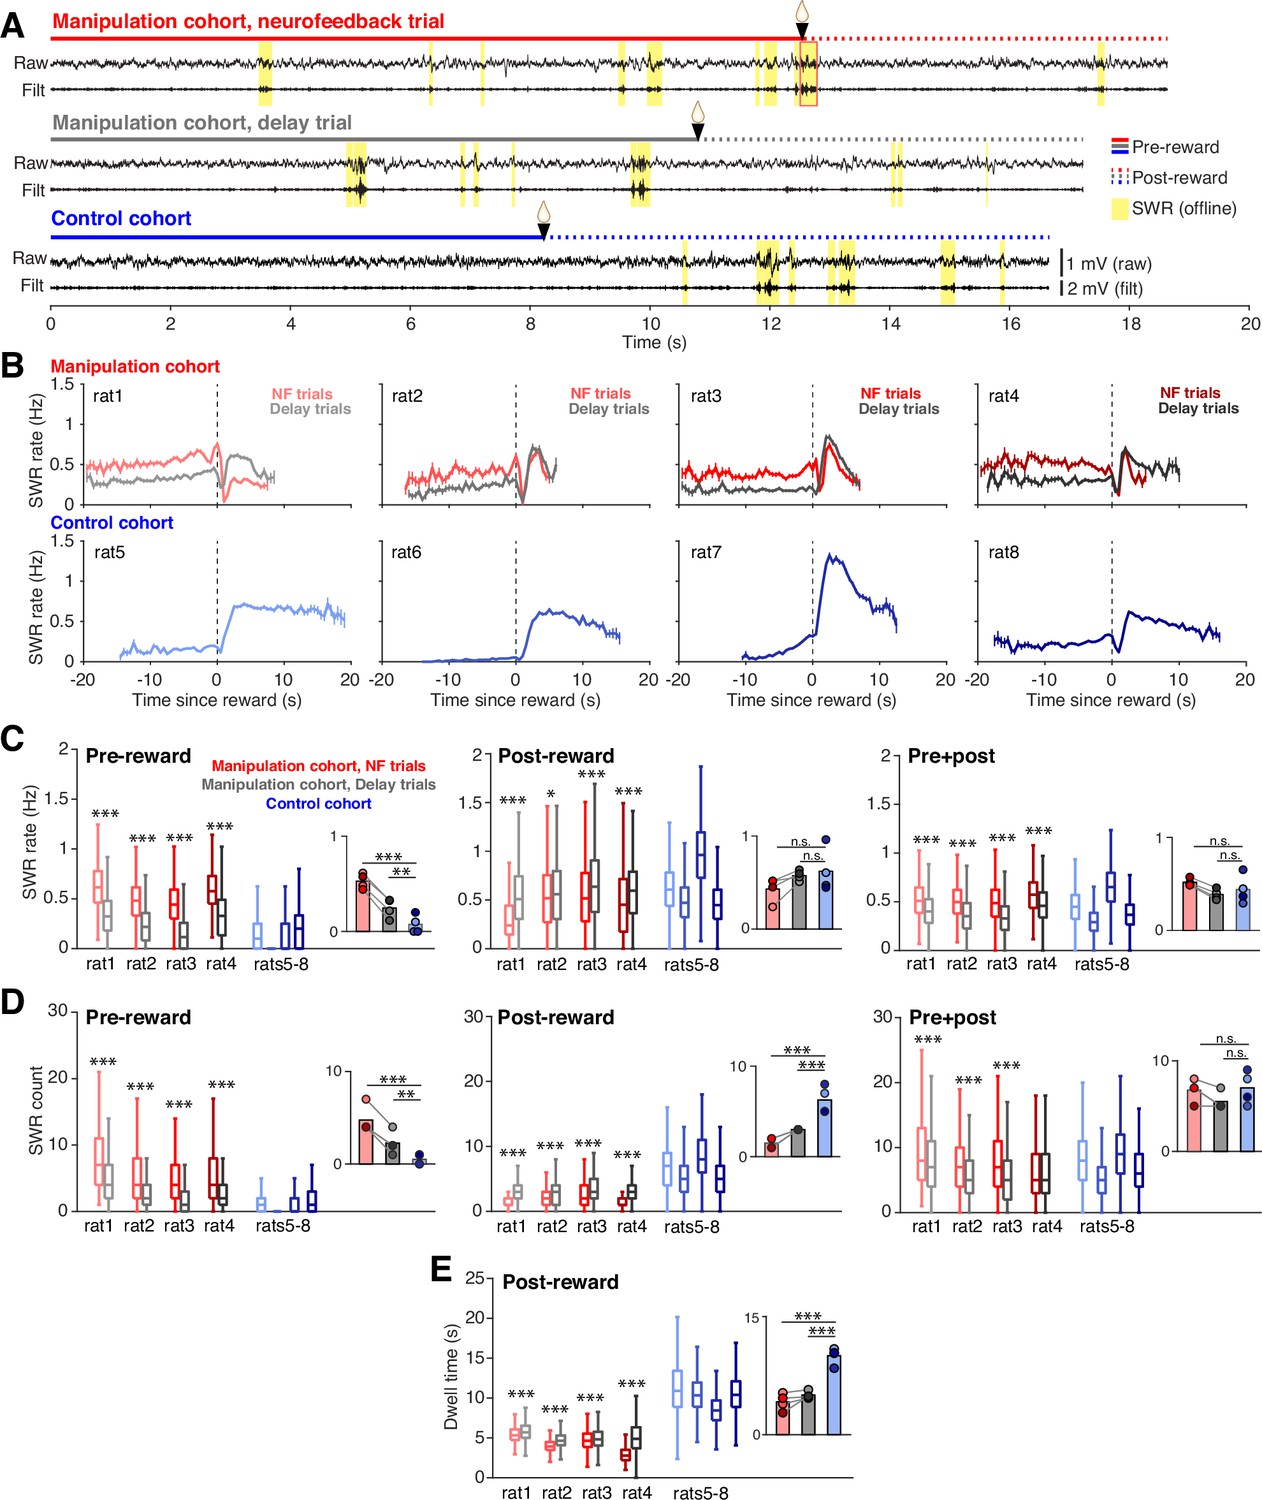
Neurofeedback training enhances SWR rate during targeted interval.
(A) Example CA1 raw LFP traces and ripple filtered LFP traces (150–250 Hz) with SWRs highlighted in yellow, from the time spent at a center port on a neurofeedback (NF) trial (top) and a delay trial (middle) from a manipulation subject and a trial from a control subject (bottom). (B) SWR rate calculated in 0.5 s bins during the pre- and post-reward periods, aligned to the time of reward delivery (dashed lines) for subjects in the manipulation (top row) and control (bottom row) cohorts. Trigger SWRs on NF trials are excluded from the rate calculation, and time bins with fewer than 100 trials contributing data are not shown. Vertical bars indicate S.E.M. (C) SWR rate calculated during the pre-reward period (left), post-reward period (middle) and for the total time at the center port (right). Manipulation cohort n=1892, 684, 1157, and 1602 NF trials and 2022, 640, 1201, and 1552 delay trials; control cohort n=2490, 2629, 2027, and 3021 trials. For the pre-reward period, manipulation cohort ranksum comparisons between NF and delay trials: p=4.382 × 10–258, 7.111x10–83, 5.689x10–214, and 3.285x10–191. Inset: Groupwise comparisons. Manipulation cohort NF trials vs control cohort trials: p=1.126 × 10⁻¹⁶; manipulation cohort delay trials vs control cohort trials: p=0.009. For the post-reward period, manipulation cohort ranksum comparisons between NF and delay trials: p=3.646 × 10–127, 0.038, 6.538x10⁻¹¹, and 2.768x10⁻²³, respectively. Inset: Groupwise comparisons. Manipulation cohort NF trials vs control cohort trials: p=0.142; manipulation cohort delay trials vs control cohort trials p=0.691. For pre +post combined, manipulation cohort ranksum comparisons between NF and delay trials p=3.324 × 10–64, 3.136x10–40, 2.996x10–69, and 9.066x10–50, respectively. Inset: Groupwise comparisons. Manipulation cohort NF trials vs control cohort trials: p=0.237; manipulation cohort delay trials vs control cohort trials: p=0.504. (D) Count of SWR events detected during the pre-reward period (left), post-reward period (middle) and for the total time at the center ports (right). Trial n are the same as in (C). For the pre-reward period, manipulation cohort ranksum comparisons between NF and delay trials: p=3.133 × 10–96, 8.936x10–37, 1.266x10–106, and 6.024x10–65. Inset: Groupwise comparisons. Manipulation cohort NF trials vs control cohort trials: p=6.790 × 10⁻⁷; manipulation cohort delay trials vs control cohort trials: p=0.0018. For the post-reward period, manipulation cohort ranksum comparisons between NF and delay trials: p=1.797 × 10–137, 6.100x10⁻¹⁰, 6.688x10⁻¹³, and 2.152x10–130. Inset: Groupwise comparisons. Manipulation cohort NF trials vs control cohort trials: p=2.361 × 10⁻¹²; manipulation cohort delay trials vs control cohort trials p=5.820 × 10⁻⁹. For pre +post combined, manipulation cohort ranksum comparisons between NF and delay trials: p=1.534 × 10⁻¹⁹, 5.828x10⁻¹⁴, 6.735x10⁻³², and 0.083. Inset: Groupwise comparisons. Manipulation cohort NF trials vs control cohort trials p=0.366; manipulation cohort delay trials vs control cohort trials: p=0.299. (E), Dwell time post-reward. Trial n are the same as in (C). Manipulation cohort ranksum comparisons between NF and delay trials: p=1.397 × 10⁻²³, 8.588x10–49, 6.180x10⁻⁴, and 7.127x10–257. Inset: Groupwise comparisons. Manipulation cohort NF trials vs control cohort trials: p=4.075 × 10⁻¹⁸; manipulation cohort delay trials vs control cohort trials: p=1.835 × 10⁻¹⁸. For C-E, all within-subject ranksum p-values are corrected using the Benjamini-Hochberg method and all groupwise comparisons are performed using linear mixed effects models (see Methods).
Figure 2—figure supplement 1
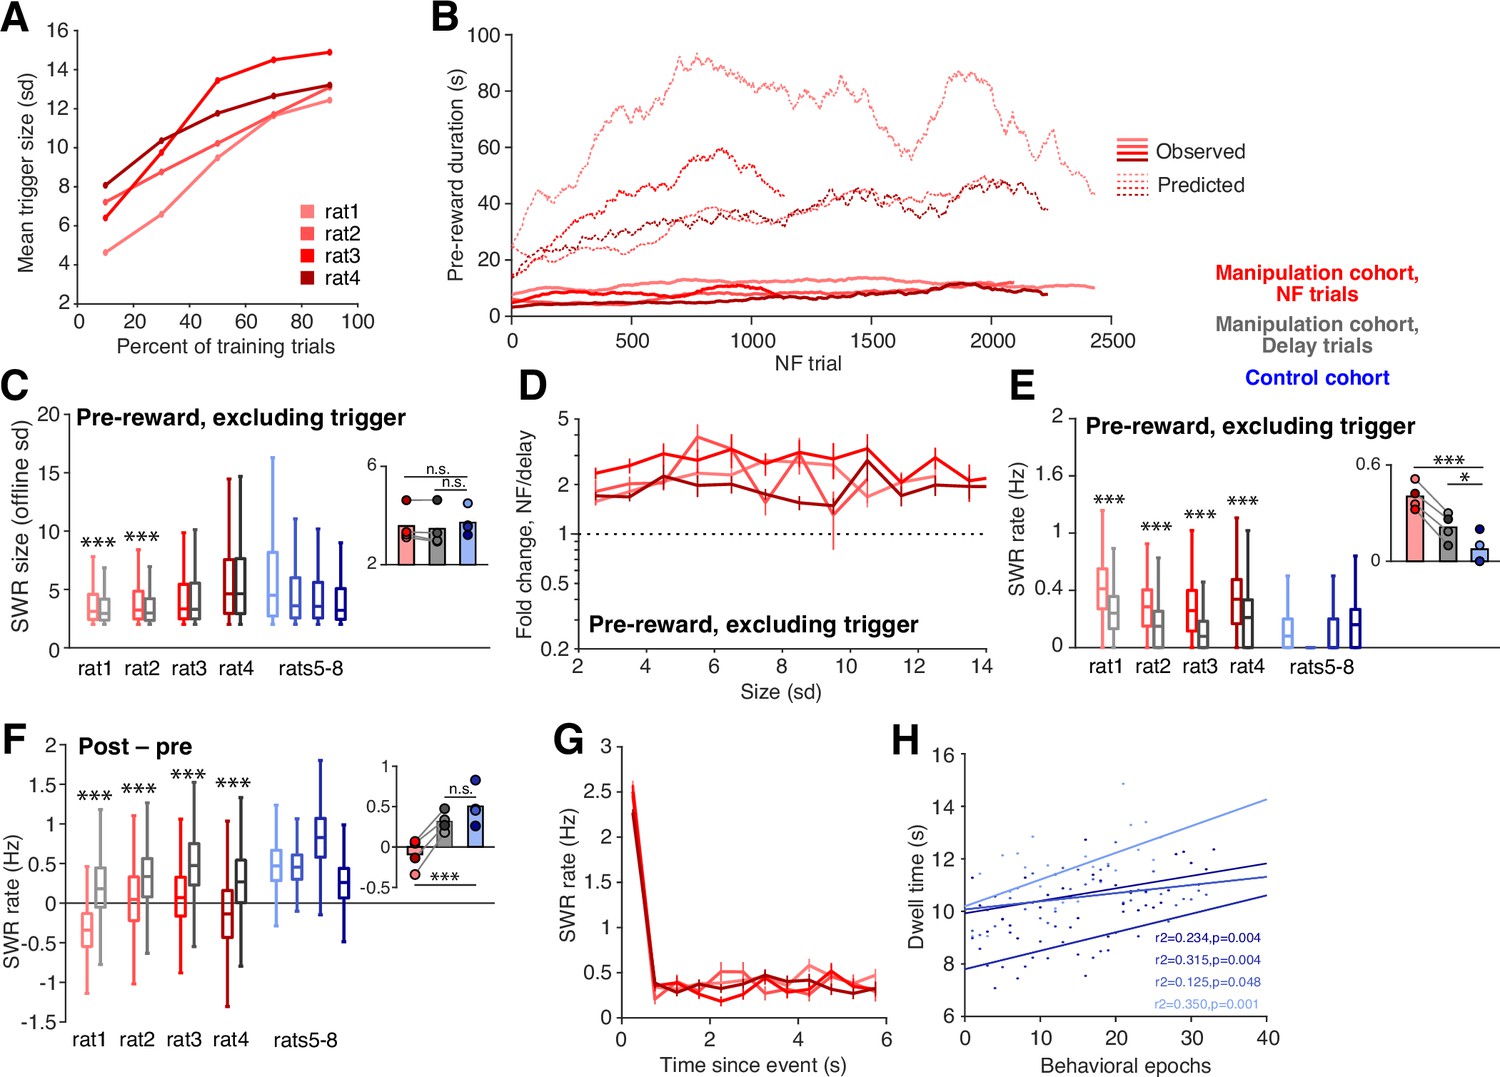
Neurofeedback training enhances SWR rate during targeted interval.
(A) Mean trigger event size (sd) for neurofeedback trials over the early portion neurofeedback training (while increasing the detection threshold). Trials included are those from the second half of each behavioral epoch to ensure that the online detection threshold had been raised to its maximum value (see Methods). (B) Actual duration pre-reward (solid lines) compared to predicted duration (dashed lines) based on the occurrence rate of large-amplitude SWRs prior to and early in neurofeedback training. Traces have been smoothed with a 200-trial window (see Methods). (C) SWR size during the pre-reward period at the center ports. All suprathreshold events for both trial types within the manipulation cohort are excluded. Manipulation cohort n=13209, 3060, 5369, and 7165 NF SWRs and 8716, 1618, 2535, and 3855 delay SWRs; control cohort n=2660, 581, 2192, and 5429 SWRs. Manipulation cohort ranksum comparisons between NF and delay trials: p=1.734 × 10⁻¹⁶, 7.389x10⁻⁹, 0.921, and 0.921. Inset: Groupwise comparisons. Manipulation cohort NF trials vs control cohort trials: p=0.234; manipulation cohort delay trials vs control cohort trials: p=0.184. (D) Fold change of occurrence rate of SWRs binned by amplitude at neurofeedback port relative to delay port pre-reward, excluding all suprathreshold events for both trial types. (E) SWR rate during the pre-reward period calculated with suprathreshold events excluded from both neurofeedback and delay trials in the manipulation cohort. Manipulation cohort n=1892, 684, 1157, and 1602 NF trials and 2022, 640, 1201, and 1552 delay trials; control cohort n=2490, 2629, 2027, and 3021 trials. Manipulation cohort ranksum comparisons between NF and delay trials: p=9.873 × 10–136, 2.562x10⁻³⁴, 4.017x10–91, and 7.171x10–49. Inset: Groupwise comparisons. Manipulation cohort NF trials vs control cohort trials: p=5.574 × 10⁻⁸; manipulation cohort delay trials vs control cohort trials: p=0.040. (F) The difference between SWR rate during the post-reward period and SWR rate during the pre-reward period. Manipulation cohort n=1892, 684, 1157, and 1602 NF trials and 2022, 640, 1201, and 1552 delay trials; control cohort n=2490, 2629, 2027, and 3021 trials. Manipulation cohort ranksum comparisons between NF and delay trials: p=0, 2.132x10–36, 4.528x10–117, and 3.821x10–139. Inset: Groupwise comparisons. Manipulation cohort NF trials vs control cohort trials: p=1.352 × 10⁻⁵; manipulation cohort delay trials vs control cohort trials: p=0.139. (G) SWR rate in 0.5 s bins calculated following the detection of suprathreshold events during delay trials, pre-reward, with at least 2 s remaining prior to reward delivery, shows no extended suppression of SWR rate following suprathreshold events. (H) For the control cohort, the amount of time spent post reward delivery at the center well tends to increase as subjects gain more experience with the task. For C, E, and F, all ranksum p-values are corrected using the Benjamini-Hochberg method and all groupwise comparisons are performed using linear mixed effects models (see Methods).
Figure 3
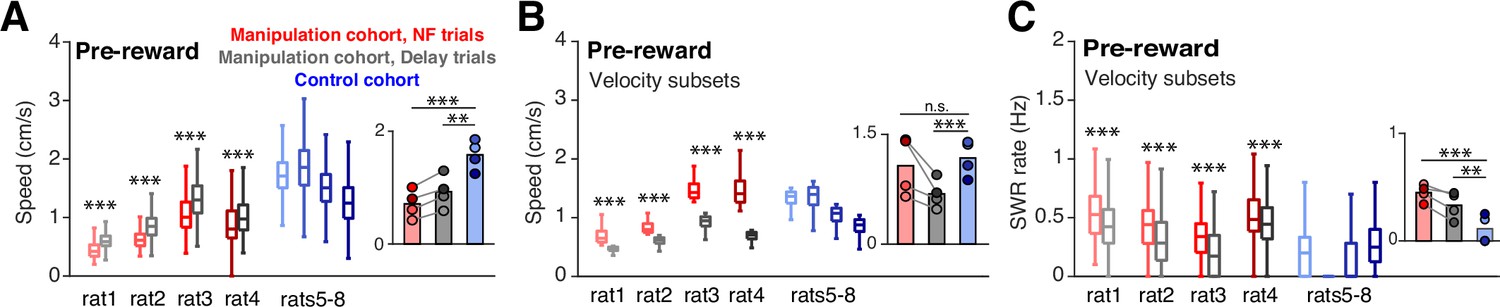
Speed does not account for differences in SWR rate.
(A) Mean head velocity (smoothed), during pre-reward time at the center ports. Trial n are the same as in (E); manipulation cohort ranksum comparisons between NF and delay trials: p=2.447 × 10–223, 2.760x10–85, 3.247x10–80, and 9.077x10–36. Inset: Groupwise comparisons. Manipulation cohort NF trials vs control cohort trials: p=1.260 × 10⁻⁷; manipulation cohort delay trials vs control cohort trials: p=1.121 × 10⁻⁴. (B) Mean head velocity for subsets of trials: the quartile of trials with the lowest mean head velocities are shown for the control cohort and for delay trials for the manipulation cohort. The quartile of trials with the highest mean head velocity are shown for neurofeedback trials. Manipulation cohort n=473, 171, 289, and 400 NF trials and 505, 160, 300, and 388 delay trials; control cohort n=624, 794, 423, and 913 trials. Manipulation cohort ranksum comparisons between NF and delay trials: p=1.342 × 10–160, 1.053x10–55, 9.488x10–98, and 4.751x10–130. Inset: Groupwise comparisons. Manipulation cohort NF trials vs control cohort trials: P=0.989; manipulation cohort delay trials vs control cohort trials: p=4.196 × 10⁻⁴. (C) SWR rate for the pre-reward period for the subset of trials included in G, showing that even in neurofeedback trials with equal or higher velocities than delay or control trials, the SWR rate remains significantly elevated. Trial n are the same as in (G); manipulation cohort ranksum comparisons between NF and delay trials: p=3.923 × 10⁻¹¹, 1.155x10⁻⁸, 1.902x10⁻¹⁸, and 5.081x10⁻⁶. Inset: Groupwise comparisons. Manipulation cohort NF trials vs control cohort trials: p=1.019 × 10⁻⁶; manipulation cohort delay trials vs control cohort trials: p=7.958 × 10⁻³. For all panels, ranksum p-values are corrected using the Benjamini-Hochberg method and all groupwise comparisons are performed using linear mixed effects models.
Figure 4 with 1 supplement
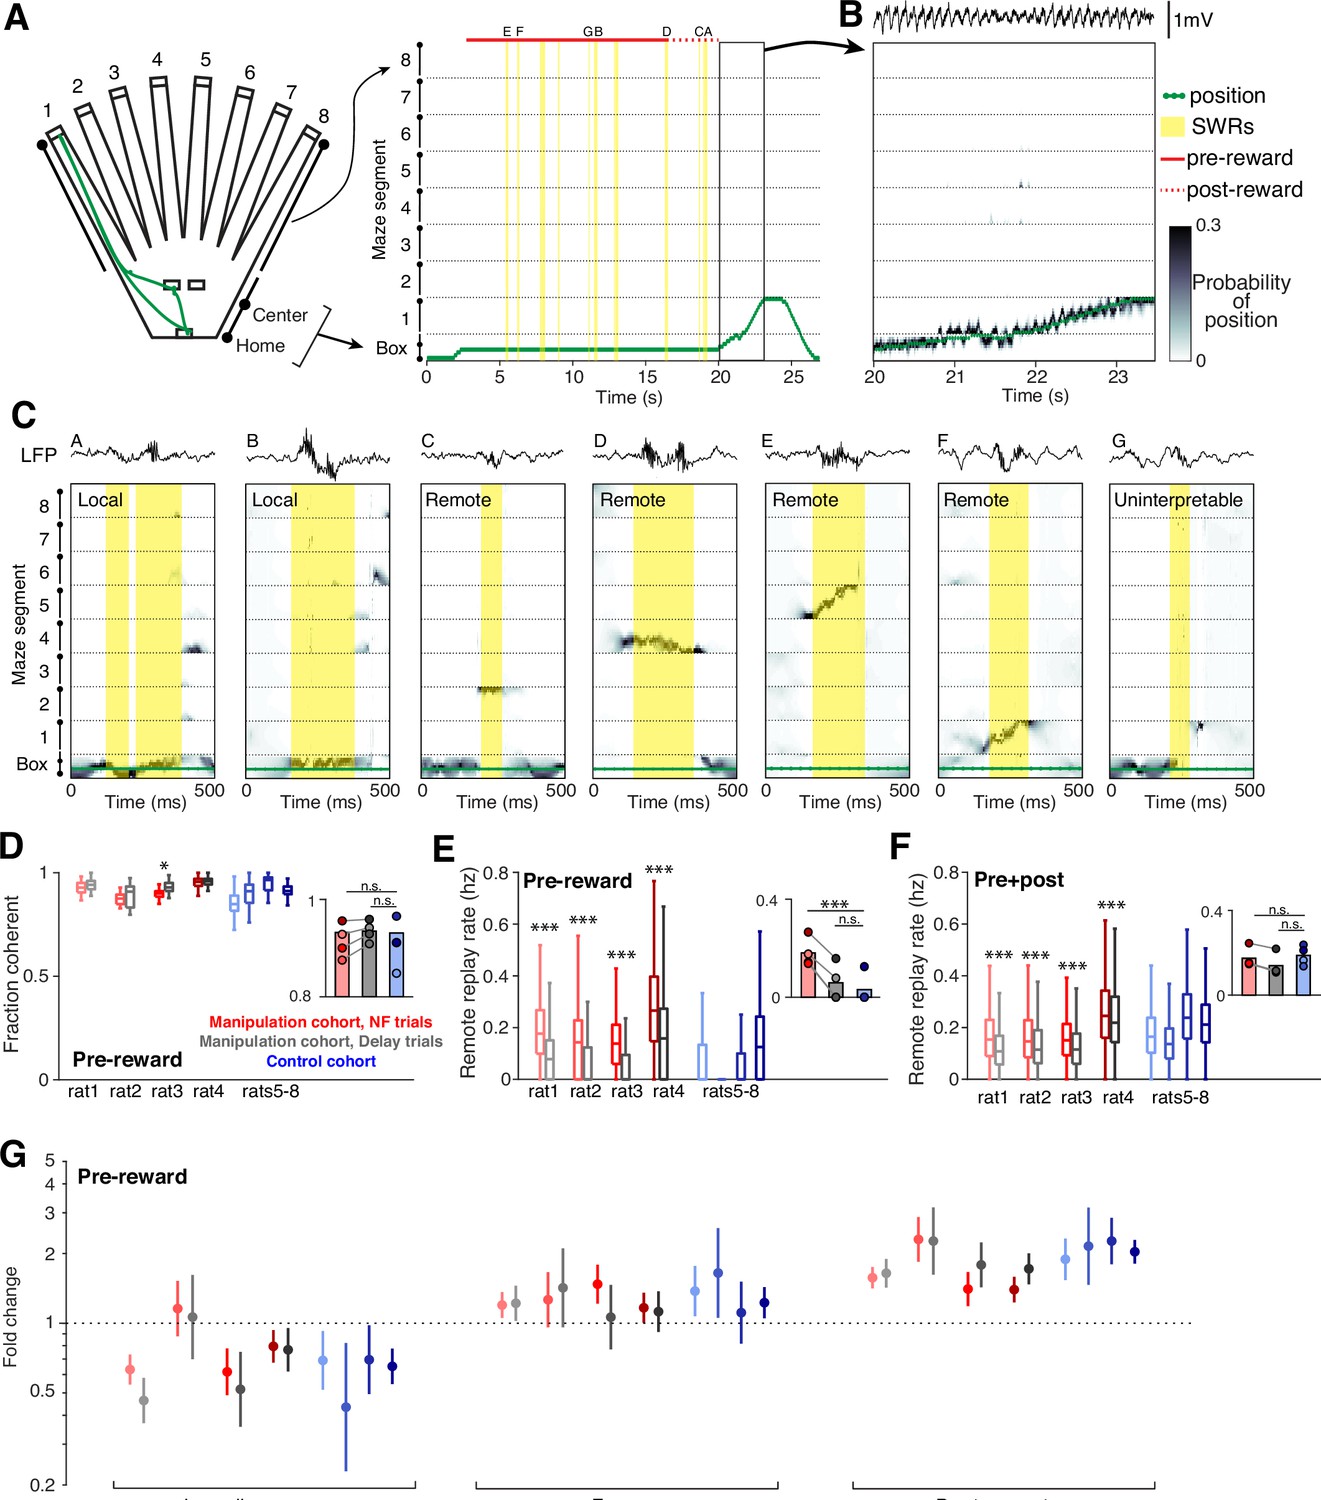
Neurofeedback preserves replay content.
(A) The 2D maze is linearized to 1D for decoding efficiency; movement trajectory for an example neurofeedback (NF) trial is shown in green. Times of SWR events are highlighted in yellow, and the small letters indicate the SWRs that are shown in (C). (B) Decoding during movement times shows a close correspondence between decoded position and the subject’s real position. (C) Several examples of decoding during SWRs, drawn from the example trial above. These include local events (two left), remote events (four middle), and one uninterpretable event (right). (D) The fraction of all SWRs per behavioral epoch that contain interpretable spatial content during pre-reward period at center ports. Manipulation cohort n=37, 14, 18, and 26 behavioral epochs per subject for each trial type and control cohort n=24, 32, 23, and 33 behavioral epochs. Manipulation cohort ranksum comparisons between NF and delay trials: p=0.1813, 0.5978, 0.0273, and 0.6738. Inset: Groupwise comparisons. Manipulation cohort NF trials vs control cohort trials: p=0.5523; manipulation cohort delay trials vs control cohort trials: p=0.2098. (E) Rate of remote replay events during pre-reward period. Manipulation cohort n=1843, 558, 1011, and 1513 NF trials and 1982, 535, 1038, and 1447 delay trials; control cohort n=2058, 2509, 1879, and 2795 trials per subject, respectively. Manipulation cohort ranksum comparisons between NF and delay trials: p=6.507 × 10–126, 9.703x10⁻³⁰, 2.991x10–79, and 6.293x10–55, respectively. Inset: Groupwise comparisons. Manipulation cohort NF trials vs control cohort trials: p=9.073 × 10⁻⁴; manipulation cohort delay trials vs control cohort trials: p=0.4304. (F) Rate of remote replay events during the pre- and post-reward periods combined. Trial n are the same as in (E). Manipulation cohort ranksum comparisons between NF and delay trials: p=7.666 × 10–47, 1.573x10⁻⁶, 1.044x10⁻¹⁶, and 5.768x10⁻⁶. Inset: Groupwise comparisons. Manipulation cohort NF trials vs control cohort trials: p=0.6644; manipulation cohort delay trials vs control cohort trials: p=0.1477. (G) Generalized linear model coefficients quantify the extent to while replay of an arm is modulated by its behavioral relevance. Manipulation cohort n=1661, 392, 866, and 1281 NF trials and 1705, 367, 894, and 1213 delay trials per subject; control cohort n=1458, 1636, 1464, and 2181 trials, respectively. For panels D-F, all ranksum p-values are corrected using the Benjamini-Hochberg method and all groupwise comparisons are performed using linear mixed effects models (see Methods).
Figure 4—figure supplement 1

Replay content is consistent when considering all replay at the center ports.
GLM quantifying modulation of replay rate by arm category considering replay events during both the pre- and post-reward periods at the center ports. Manipulation cohort n=1661, 392, 866, and 1281 neurofeedback (NF) trials and 1705, 367, 894, and 1213 delay trials; control cohort n=1458, 1636, 1464, and 2181 trials, respectively.
Figure 5 with 1 supplement
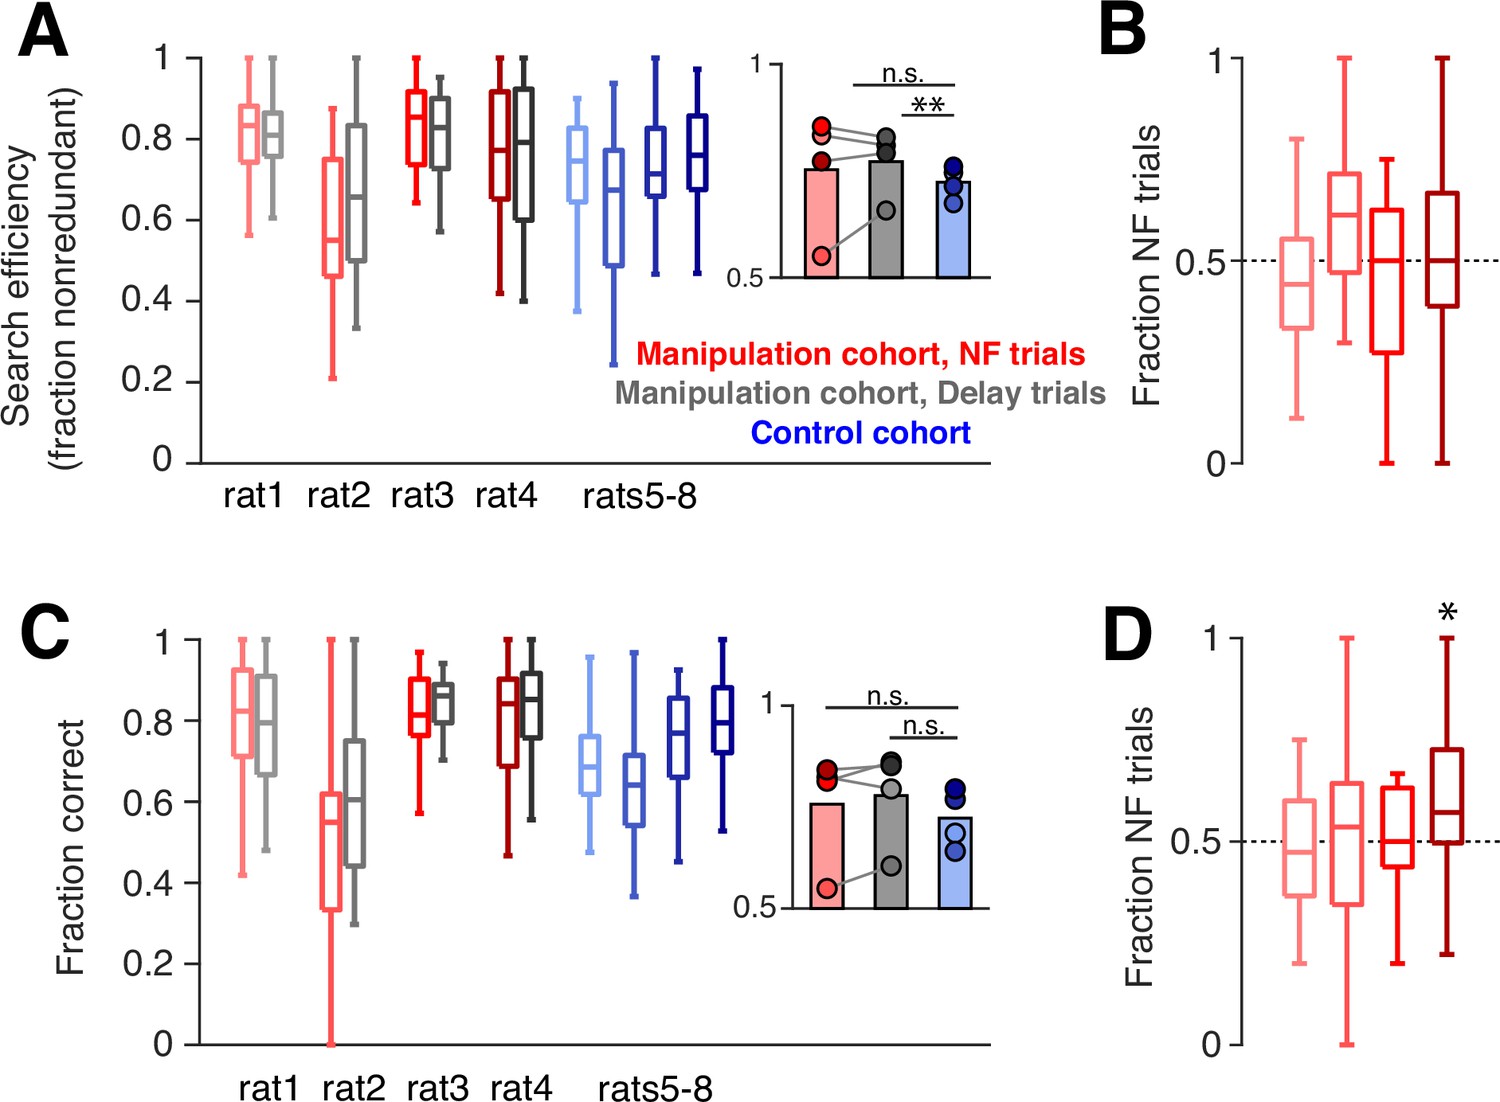
Neurofeedback does not alter behavioral performance.
(A) During trials when the subject is searching for a new goal location, we quantify the fraction of trials in which the subject chooses an arm that has not yet been sampled. Manipulation cohort ranksum comparisons between neurofeedback (NF) and delay trials: p=0.9562, 0.7509, 0.7509, and 0.9562, respectively. Inset: Groupwise comparisons. Manipulation cohort NF trials vs control cohort trials: p=0.5425; manipulation cohort delay trials vs control cohort trials: p=0.0069. (B) The fraction of redundant search trials per epoch which are NF (vs delay). Two-sided sign test vs 0.5: p=0.1102, 0.2668, 1, and 1, respectively. (C) During trials when the subject has discovered the goal arm, the fraction of subsequent trials in which the goal arm is visited (‘correct’ choice). Manipulation cohort ranksum comparisons between NF and delay trials: p=0.7202, 0.7202, 0.8123, and 0.7202. Inset: Groupwise comparisons. Manipulation cohort NF trials vs control cohort trials: p=0.6946; manipulation cohort delay trials vs control cohort trials: p=0.2857. (D) The fraction of error repeat trials which are NF trials. Two-sided sign test: p=0.3770, 0.7744, 1, and 0.0227, respectively. For all panels, manipulation cohort n=37, 14, 18, and 26 behavioral epochs per subject, respectively, and control cohort n=24, 32, 23, and 33 behavioral epochs. For (A) and (C), all ranksum p-values are corrected using the Benjamini-Hochberg method and all groupwise comparisons are performed using linear mixed effects models.
Figure 5—figure supplement 1

Search efficiency increases with experience.
For the control cohort, search efficiency tends to increase over behavioral epochs.
Author response image 1
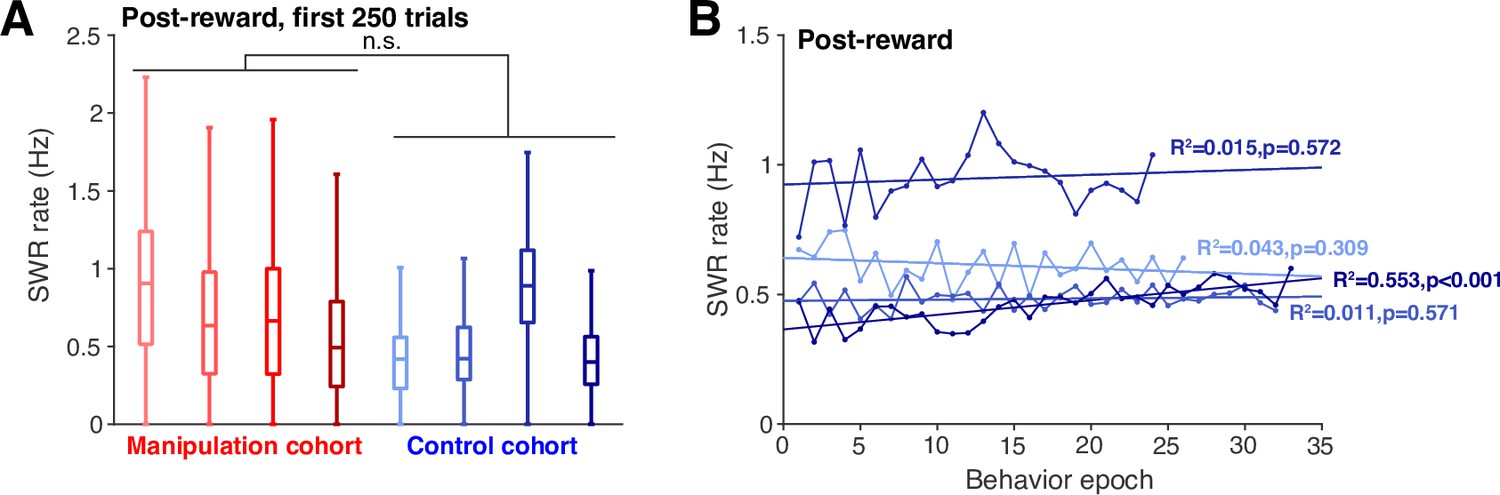
(A) SWR rate calculated during the post-reward period at the center port for the first 250 trials of postimplant behavior for each animal.
Trials of all types are included (ie both neurofeedback trials and delay trials for the manipulation cohort). Groupwise comparison p=0.192. (B) Mean SWR rate during the post-reward period at the center port for each behavioral training epoch shows no systematic change over time across subjects within the control cohort.
Additional files
Download links
A two-part list of links to download the article, or parts of the article, in various formats.
Downloads (link to download the article as PDF)
Open citations (links to open the citations from this article in various online reference manager services)
Cite this article (links to download the citations from this article in formats compatible with various reference manager tools)
Neurofeedback training can modulate task-relevant memory replay rate in rats
eLife 12:RP90944.
https://doi.org/10.7554/eLife.90944.3


