CRISPR-Cas9 knockdown of ESR1 in preoptic GABA-kisspeptin neurons suppresses the preovulatory surge and estrous cycles in female mice
- Centre for Neuroendocrinology, New Zealand
- Department of Physiology, University of Otago School of Biomedical Sciences, New Zealand
- Department of Physiology, Development and Neuroscience, University of Cambridge, United Kingdom
Figures
Figure 1
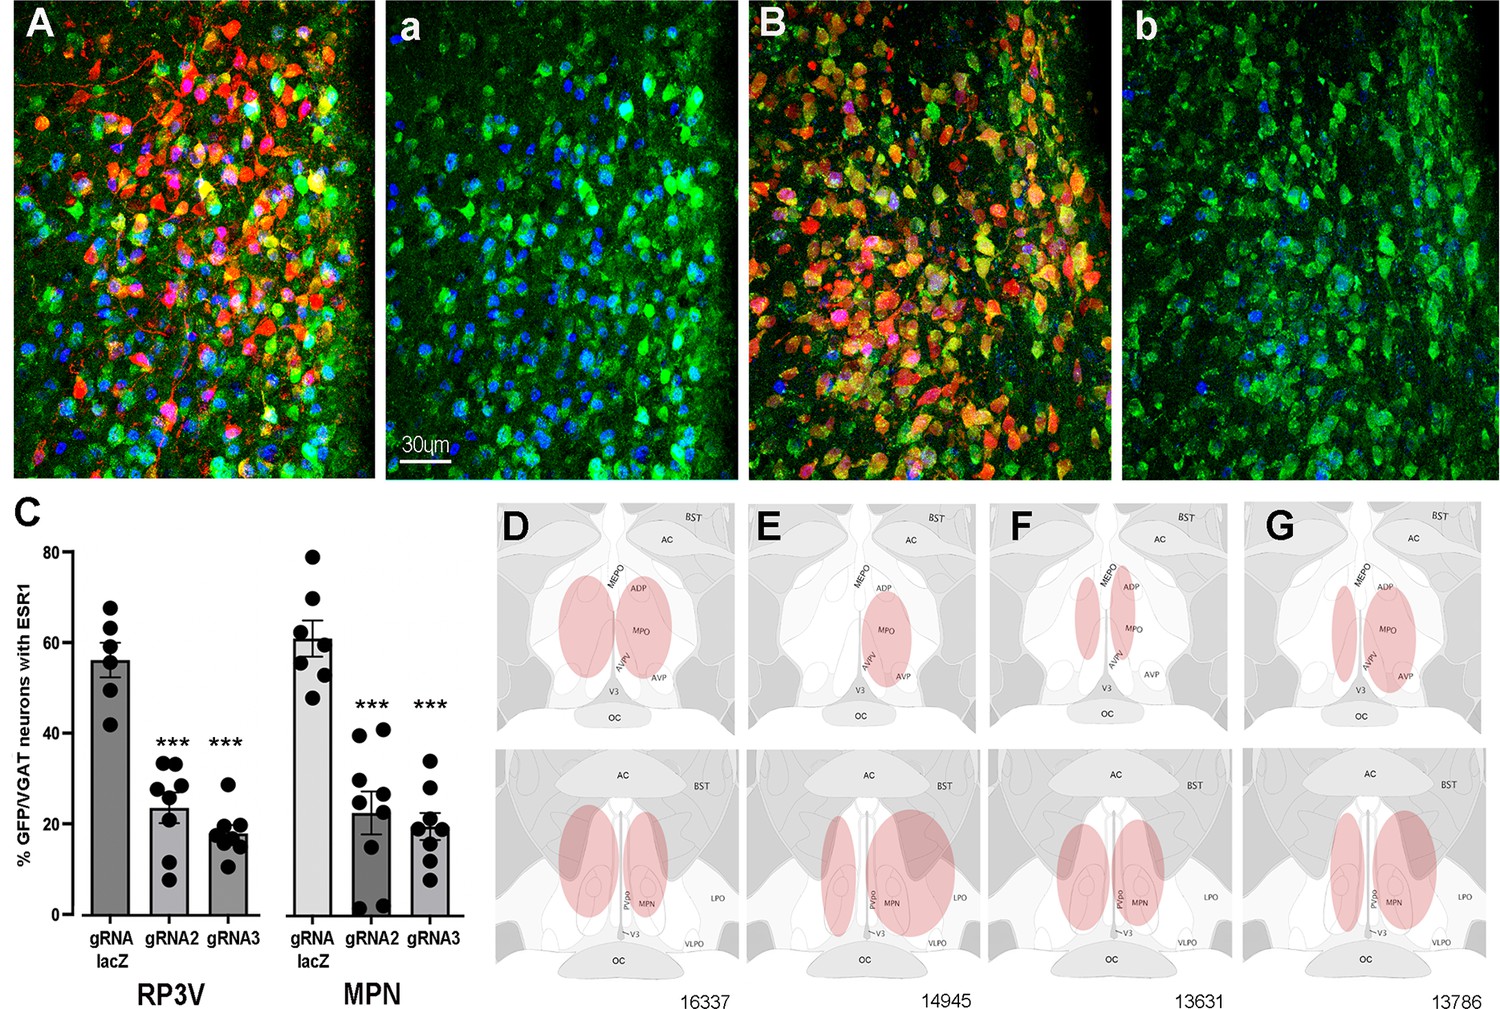
CRISPR knockdown of ESR1 in preoptic GABA neurons.
(A, B) Photomicrographs showing distribution of mCherry (gRNA from AAV) and expression of GFP (Cas9) in VGAT neurons and nuclear-located ESR1 (blue) in the preoptic periventricular (PVpo) of two mice receiving either gRNA-LacZ (A) or gRNA-2 (B). The mCherry signal is removed in the adjoining plates (a) and (b) so that the VGAT neurons (green) co-expressing ESR1 (blue or teal nuclei) are more easily identified. Scale bar in (a) is the same for all photomicrographs. (C) Individual data points (n=6-9) and mean ± SEM percentage of GFP/VGAT neurons expressing ESR1 within injected regions of the RP3V and medial preoptic nuclei (MPN) for the three gRNA groups. ***p<0.001 versus gRNA-LacZ (ANOVA, post hoc Dunnett’s tests). Data in Source data 1. (D–G) Representative schematics of AAV injection sites (pink) in four mice; 16,337 (bilateral gRNA-2), 14,945 (unilateral RP3V, bilateral MPN gRNA-2), 13,631 (bilateral gRNA-3), 13,786 (bilateral gRNA-LacZ).
Figure 2
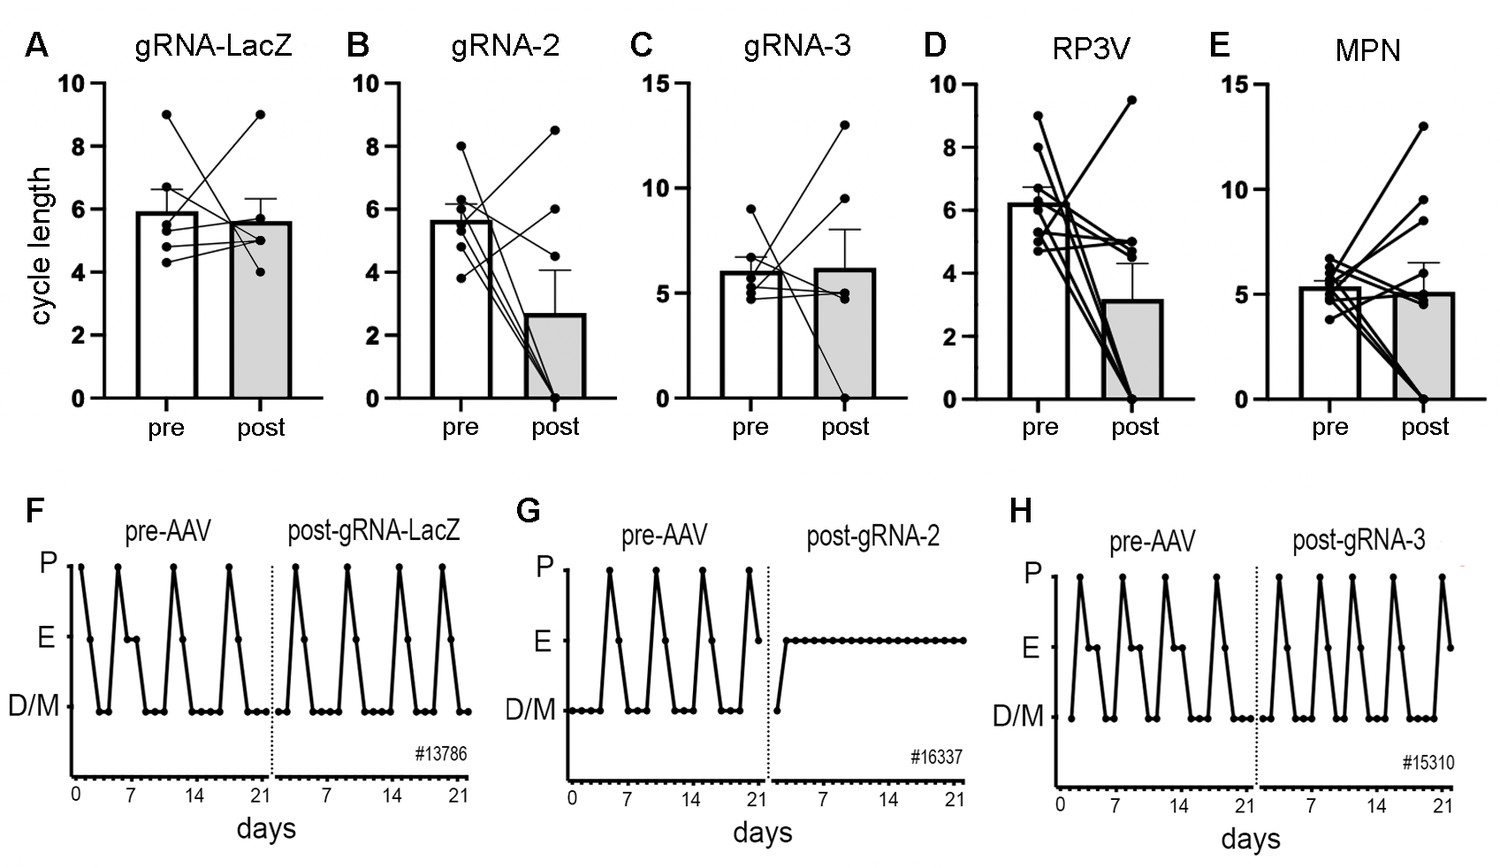
Deletion of ESR1 from preoptic GABA neurons and estrous cyclicity.
(A–C) Individual paired data points (n=6-7) and mean ± SEM estrous cycle length before and after AAV gRNA injection of lacZ, gRNA-2, and gRNA-3 into the RP3V and medial preoptic nuclei (MPN). (D–E) Individual paired data points (n=9-10) and mean ± SEM estrous cycle length before and after AAV gRNA injection in mice with bilateral AAV injections in the RP3V and MPN analyzed separately. Four mice (3× gRNA-2, 1× gRNA-3) enter constant estrus and one gRNA-2 mouse was in constant diestrus, all scored as a cycle length of 0. No significant effects of gRNA injection were detected (p>0.05 Wilcoxon paired tests). (F–H), Examples of estrous cycle patterns from three mice including one (G) that entered constant estrous following gRNA-2 injection. The individual animal number is given in each frame. All data in Source data 1.
Figure 3
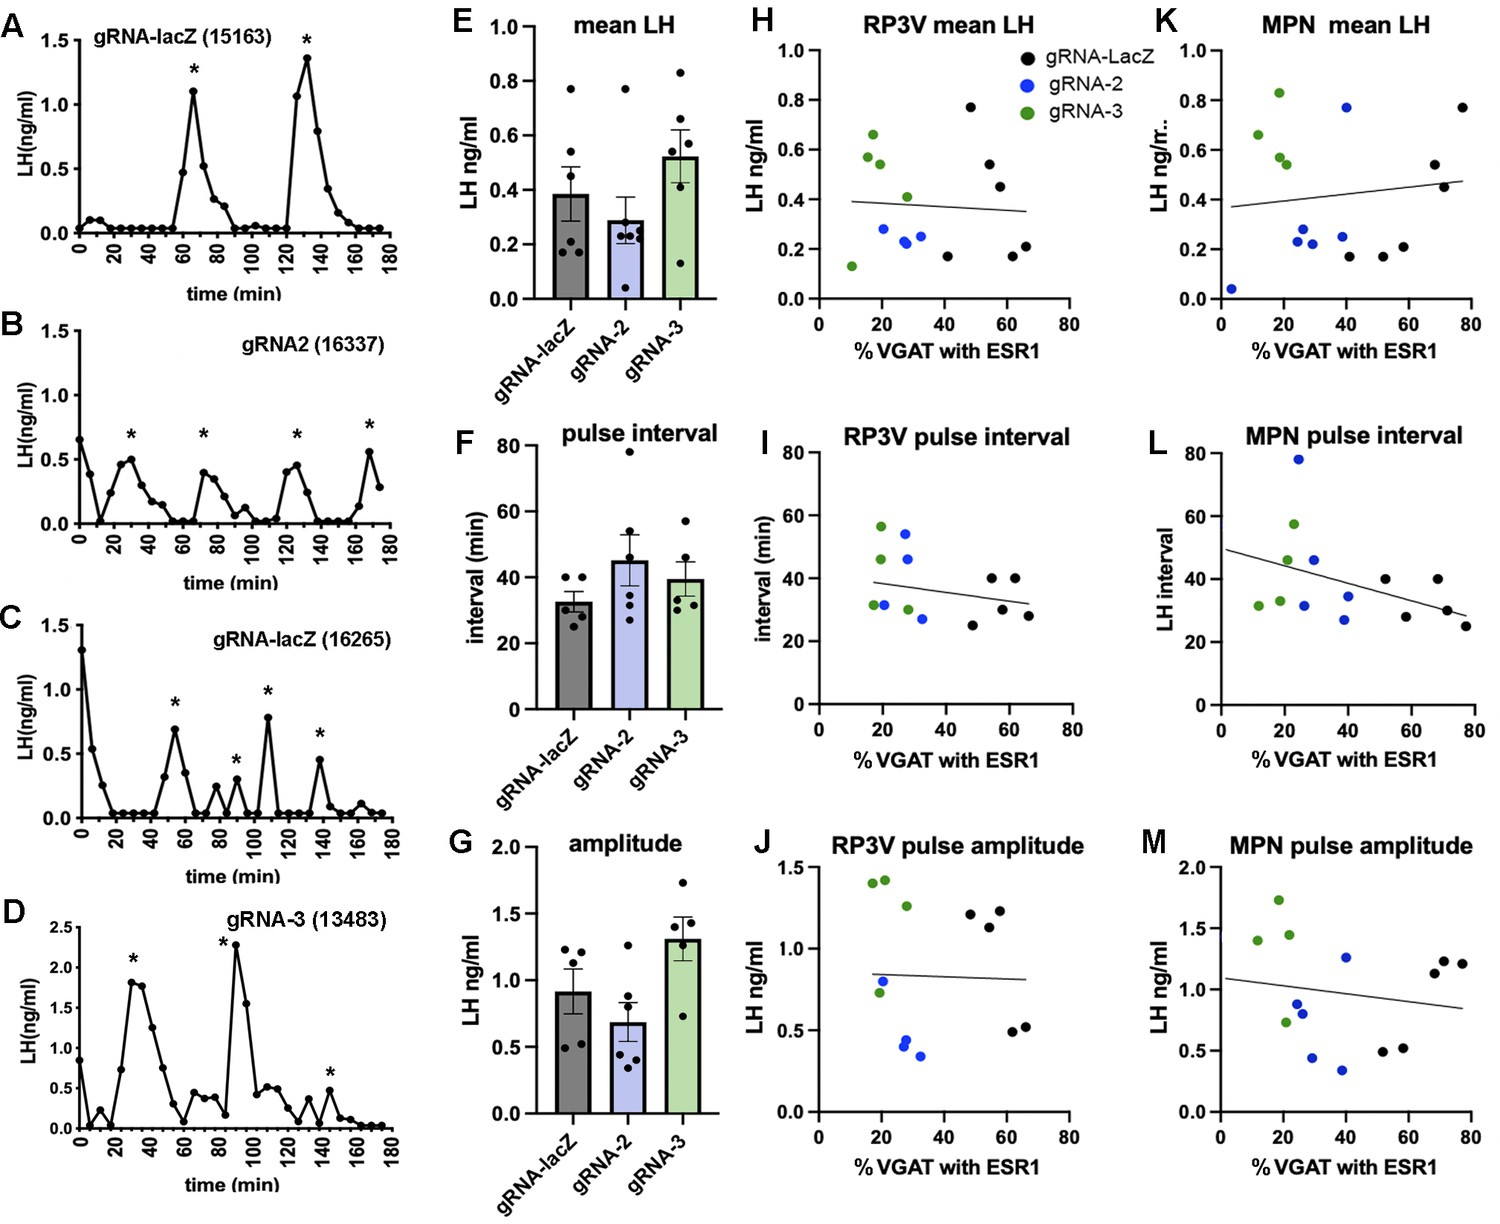
Deletion of ESR1 from preoptic GABA neurons does not alter pulsatile luteinizing hormone (LH) secretion.
(A–D) Representative LH pulse profiles from female mice given AAV gRNA-lacZ, gRNA-2, and gRNA-3. The mouse identification number is given in brackets. (E–G) Histograms show the individual data points (n=5-6) and mean ± SEM for parameters of pulsatile LH secretion in mice given gRNA-lacZ, gRNA-2, and gRNA-3 into the RP3V and medial preoptic nuclei (MPN). No significant effects are detected (p>0.05, Kruskal-Wallis test). (H–J) Correlations between the % VGAT neurons with ESR1 in the RP3V and parameters of pulsatile LH secretion. Individual mice are color-coded according to their gRNA treatment. No significant correlations were detected (Pearson r<0.34 in all cases). (K–M) Correlations between the % VGAT neurons with ESR1 in the MPN and parameters of pulsatile LH secretion. Individual mice are color-coded according to their gRNA treatment. No significant correlations were detected (Pearson r<0.41 in all cases). All data in Source data 1.
Figure 4

Effects of ESR1 deletion in preoptic GABA neurons on surge parameters.
(A, B) Individual data points (n=6-7) and mean ± SEM values showing the percentage of gonadotropin-releasing hormone (GnRH) neurons with cFos and single-point luteinizing hormone (LH) levels for mice killed at the time of the expected surge given gRNA-LacZ (black), gRNA-2 (blue), and gRNA-3 (green) injections centered on the RP3V and medial preoptic nuclei (MPN). **p=0.0023 (Krusakl-Wallis) compared with LacZ. (C, D) Correlations between the % of RP3V VGAT neurons with ESR1 and cFos expression by GnRH neurons or LH secretion. Individual mice are color-coded according to their gRNA treatment. A significant correlation for cFos in GnRH neurons exists (p=0.008, Pearson r=0.66) but not for LH (p=0.26, Pearson r=0.31). (E, F) Correlations between the % of MPN VGAT neurons with ESR1 and cFos expression by GnRH neurons or LH secretion. Individual mice are color-coded according to their gRNA treatment. No significant correlations were found. All data in Source data 1.
Figure 5
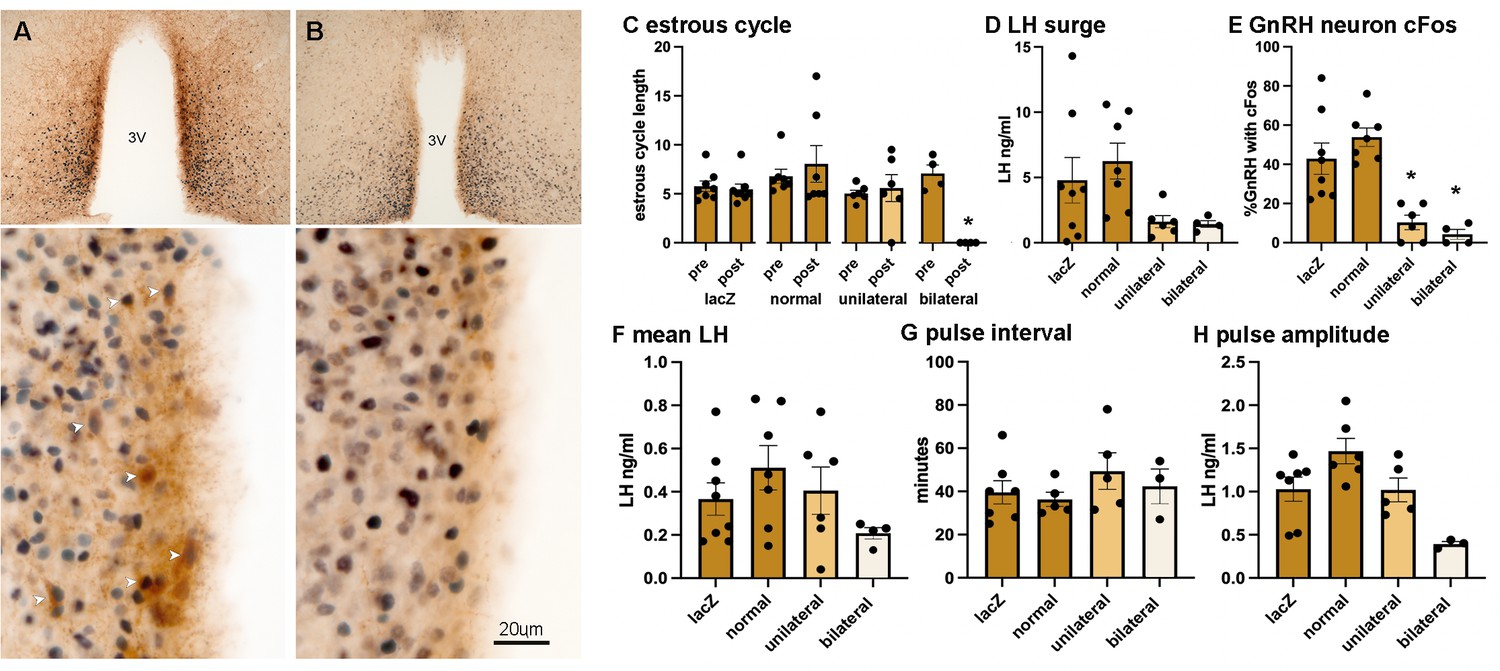
Suppression of RP3V kisspeptin expression is associated with the loss of estrous cycles and the surge mechanism.
(A, B) Dual-label immunohistochemistry for kisspeptin (brown) and ESR1 (black) shows the normal high level of co-expression (white arrowheads) in a representative gRNA-lacZ mouse (A) but near absence of kisspeptin immunoreactivity in a representative ‘bilateral loss’ mouse (#16337) (B). 3V, third ventricle. Scale bar in B is the same for A. (C) Individual data points (n=4-7) and mean ± SEM values showing estrous cycle length before and after gRNA injection in gRNA ‘lacZ’ mice, gRNA-2/3 mice with ‘normal’ kisspeptin expression, gRNA-2/3 mice with a ‘unilateral’ reduction in kisspeptin, and gRNA-2/3 mice with a near-complete ‘bilateral’ loss of kisspeptin. *p<0.05 compared to pre-values. (D, E) Individual data points (n=4-7) and mean ± SEM single-point luteinizing hormone (LH) levels and % of gonadotropin-releasing hormone (GnRH) neurons with cFos at the time of the expected surge in gRNA ‘lacZ’ mice, gRNA-2/3 mice with ‘normal’ kisspeptin expression, gRNA-2/3 mice with a ‘unilateral’ reduction in kisspeptin, and gRNA-2/3 mice with a near-complete ‘bilateral’ loss of kisspeptin. *p<0.05 compared to lacZ. (F–H) Individual data points (n=3-7) and mean ± SEM parameters of pulsatile LH secretion in gRNA ‘lacZ’ mice, gRNA-2/3 mice with ‘normal’ kisspeptin expression, gRNA-2/3 mice with a ‘unilateral’ reduction in kisspeptin, and gRNA-2/3 mice with a near-complete ‘bilateral’ loss of kisspeptin. No significant differences were detected. All data in Source data 1.
Tables
Table 1
Kisspeptin-ESR1 co-expression in re-grouped gRNA mice.
Table showing the numbers of kisspeptin neurons/section in the anteroventral periventricular (AVPV) and preoptic periventricular (PVpo) and percentage expression with ESR1. ‘LacZ’ refers to all mice given gRNA-LacZ, ‘normal’ refers to all gRNA-2/3 mice with normal kisspeptin expression (unilateral cell counts shown), ‘unilateral’ refers to gRNA-2/3 mice in which only one side of the brain had reduced kisspeptin cell numbers with the cell count on the affected side given, ‘bilateral’ refers to gRNA-2/3 mice with essentially no cytoplasmic kisspeptin expression bilaterally in the RP3V. Too few kisspeptin neurons existed to reliably determine co-expression with ESR1. **p<0.01, ***p<0.001 compared with lacZ group (Kruskal-Wallis with Dunn’s tests, exact p-values given below). All data in Source data 1.
| LacZ (n=8) | Normal (n=7) | Unilateral(n=6) | Bilateral (n=4) | ||
|---|---|---|---|---|---|
| AVPV | No. kisspeptin neurons/section | 20.1±2.0 | 15.4±0.9 | 5.6±2.5** (p=0.0066) | 0.4±0.1*** (p=0.0006) |
| % Kiss with ESR1 | 74.5±3.3 | 78.5±4.4 | 57.3±19.7 | – | |
| PVpo | No. kisspeptin neurons/section | 24.0±1.9 | 19.6±1.3 | 4.8±2.8** (p=0.0016) | 0.8±0.3** (p=0.0031) |
| % Kiss with ESR1 | 63.3±5.1 | 70.5±5.2 | 27.5±17.1 | – | |
Table 2
VGAT-ESR1 in mice grouped on the basis of kisspeptin expression.
Table showing the percentage of VGAT neurons in the RP3V and MPN expressing ESR1 in gRNA mice re-grouped on the basis of kisspeptin expression (see Table 1 for explanation of groups). *p<0.05, ***p<0.001 compared with lacZ group (Kruskal-Wallis with Dunn’s tests, exact p-values given below). All data in Source data 1.
| LacZ (n=8) | Normal (n=7) | Unilateral (n=6) | Bilateral (n=4) | ||
|---|---|---|---|---|---|
| RP3V | % VGAT with ESR1 | 50.4±6.1 | 17.9±2.3* (p=0.0242) | 17.7±3.0* (p=0.0358) | 24.5±4.8 |
| MPN | % VGAT with ESR1 | 61.2±4.2 | 14.0±3.1*** (p=0.0002) | 22.0±5.1* (p=0.0162) | 30.1±4.8 |
Additional files
-
Source data 1
All measured parameters for each individual mouse.
- https://cdn.elifesciences.org/articles/90959/elife-90959-data1-v1.xlsx
-
MDAR checklist
- https://cdn.elifesciences.org/articles/90959/elife-90959-mdarchecklist1-v1.docx
Download links
A two-part list of links to download the article, or parts of the article, in various formats.
Downloads (link to download the article as PDF)
Open citations (links to open the citations from this article in various online reference manager services)
Cite this article (links to download the citations from this article in formats compatible with various reference manager tools)
CRISPR-Cas9 knockdown of ESR1 in preoptic GABA-kisspeptin neurons suppresses the preovulatory surge and estrous cycles in female mice
eLife 12:RP90959.
https://doi.org/10.7554/eLife.90959.3


