The substrate-binding domains of the osmoregulatory ABC importer OpuA transiently interact
- Department of Biochemistry, Groningen Biomolecular Science and Biotechnology Institute, University of Groningen, Netherlands
- Biochemistry Center, Heidelberg University, Germany
Figures
Figure 1 with 1 supplement
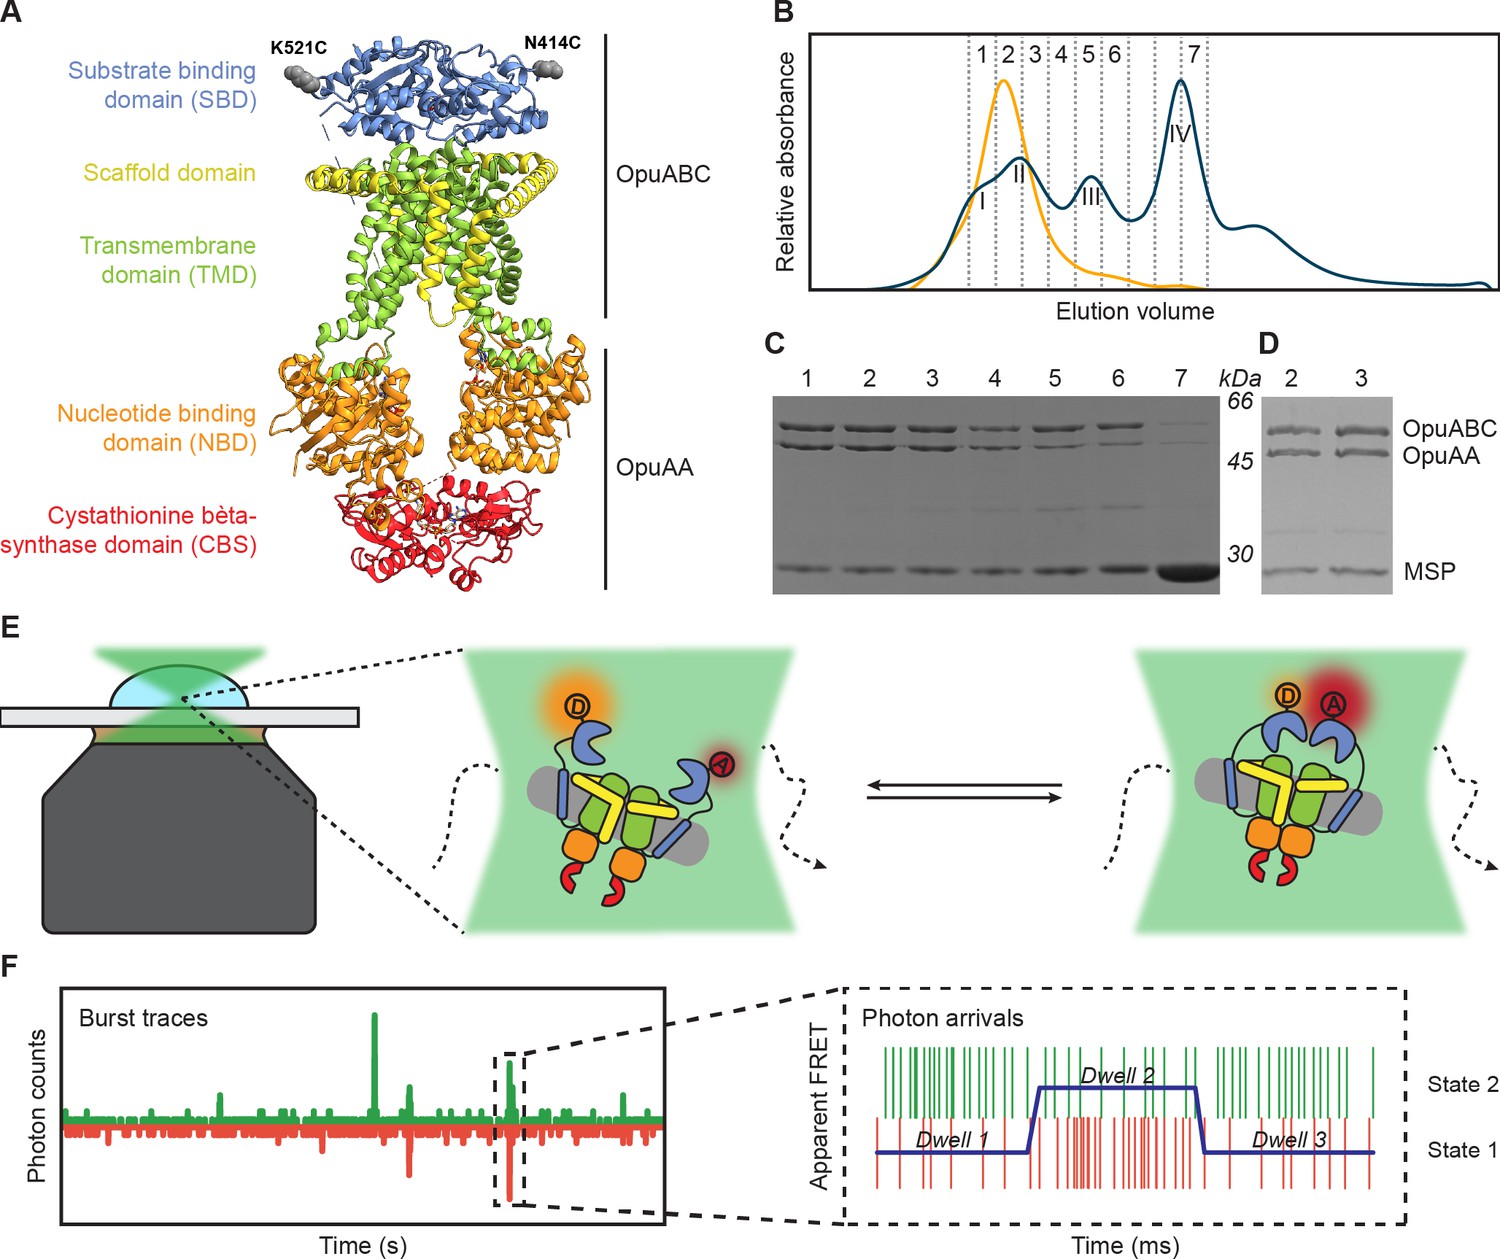
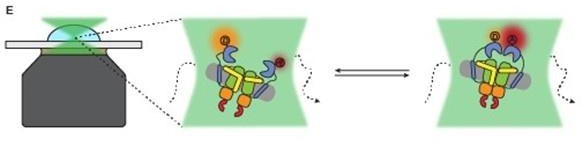
Experimental approach for measuring interdomain dynamics in the SBDs of OpuA.
(A) A cryo-EM structure of OpuA (PDB: 7AHH). Mutations K521C and N414C are highlighted as grey spheres. (B) Size-exclusion chromatography profiles of OpuA-nanodiscs that were purified according to the previously described protocol (Sikkema et al., 2020) (blue) or according to the new protocol that is described here (yellow). The Latin numbers refer to the four different nanodisc species as is described in the first paragraph of the Results section. The other numbers refer to the elution fractions that were loaded on an SDS-PAA gel. (C) SDS-PAA gel with the size exclusion fractions of the blue line in (B). (D) SDS-PAA gel with the size-exclusion fractions of the yellow line in (B). (E) A schematic representation of how confocal, solution-based smFRET was used to study different states of the SBDs. (F) A representation of a fluorescent burst time trace, displaying the photon counts in the donor (green) and acceptor (red) detection channel over time (left). The zoom-in is a representation of a photon time trace, in which single photons are represented as lines and the most likely state path from the Viterbi algorithm in mpH2MM as a blue line.
-
Figure 1—source data 1
Raw SDS-PAA gel images of Figure 1C and D.
- https://cdn.elifesciences.org/articles/90996/elife-90996-fig1-data1-v1.zip
-
Figure 1—source data 2
Labelled SDS-PAA gel images of Figure 1C and D.
- https://cdn.elifesciences.org/articles/90996/elife-90996-fig1-data2-v1.zip
Figure 1—figure supplement 1
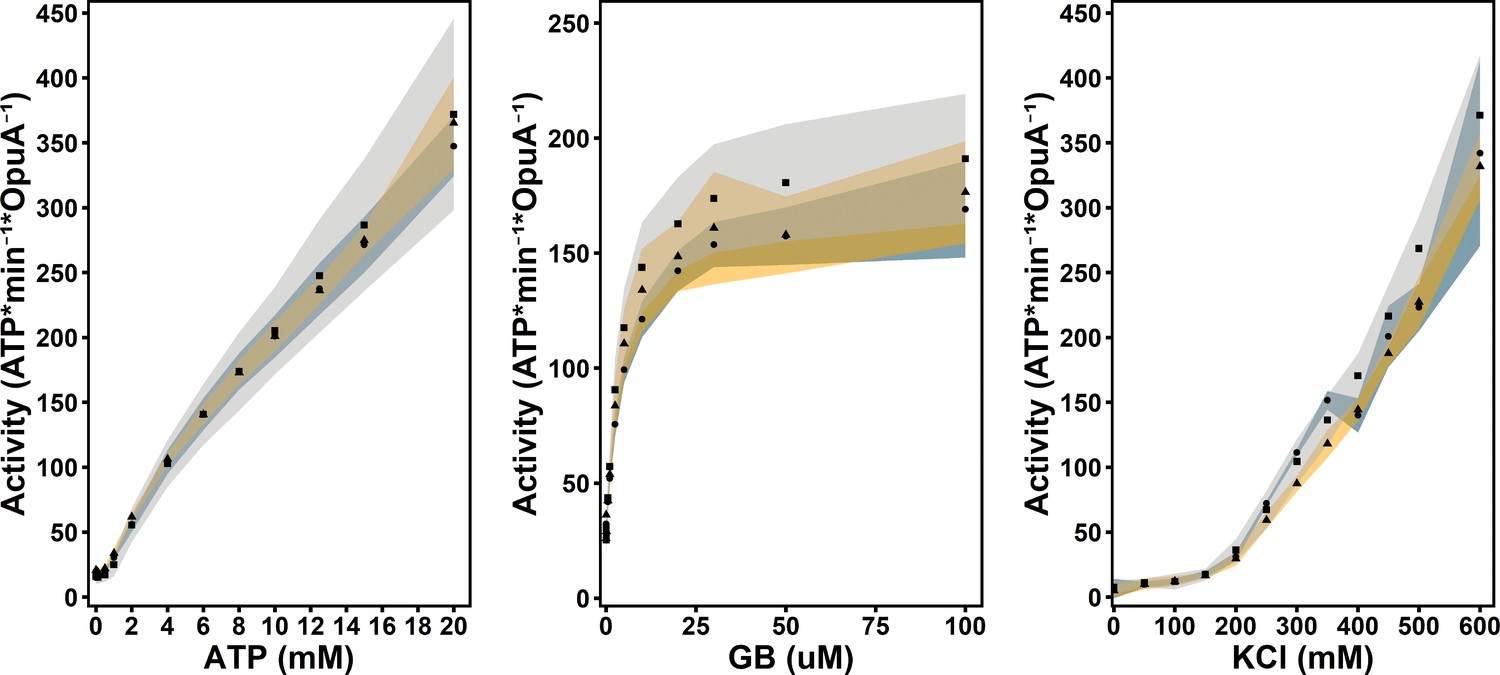
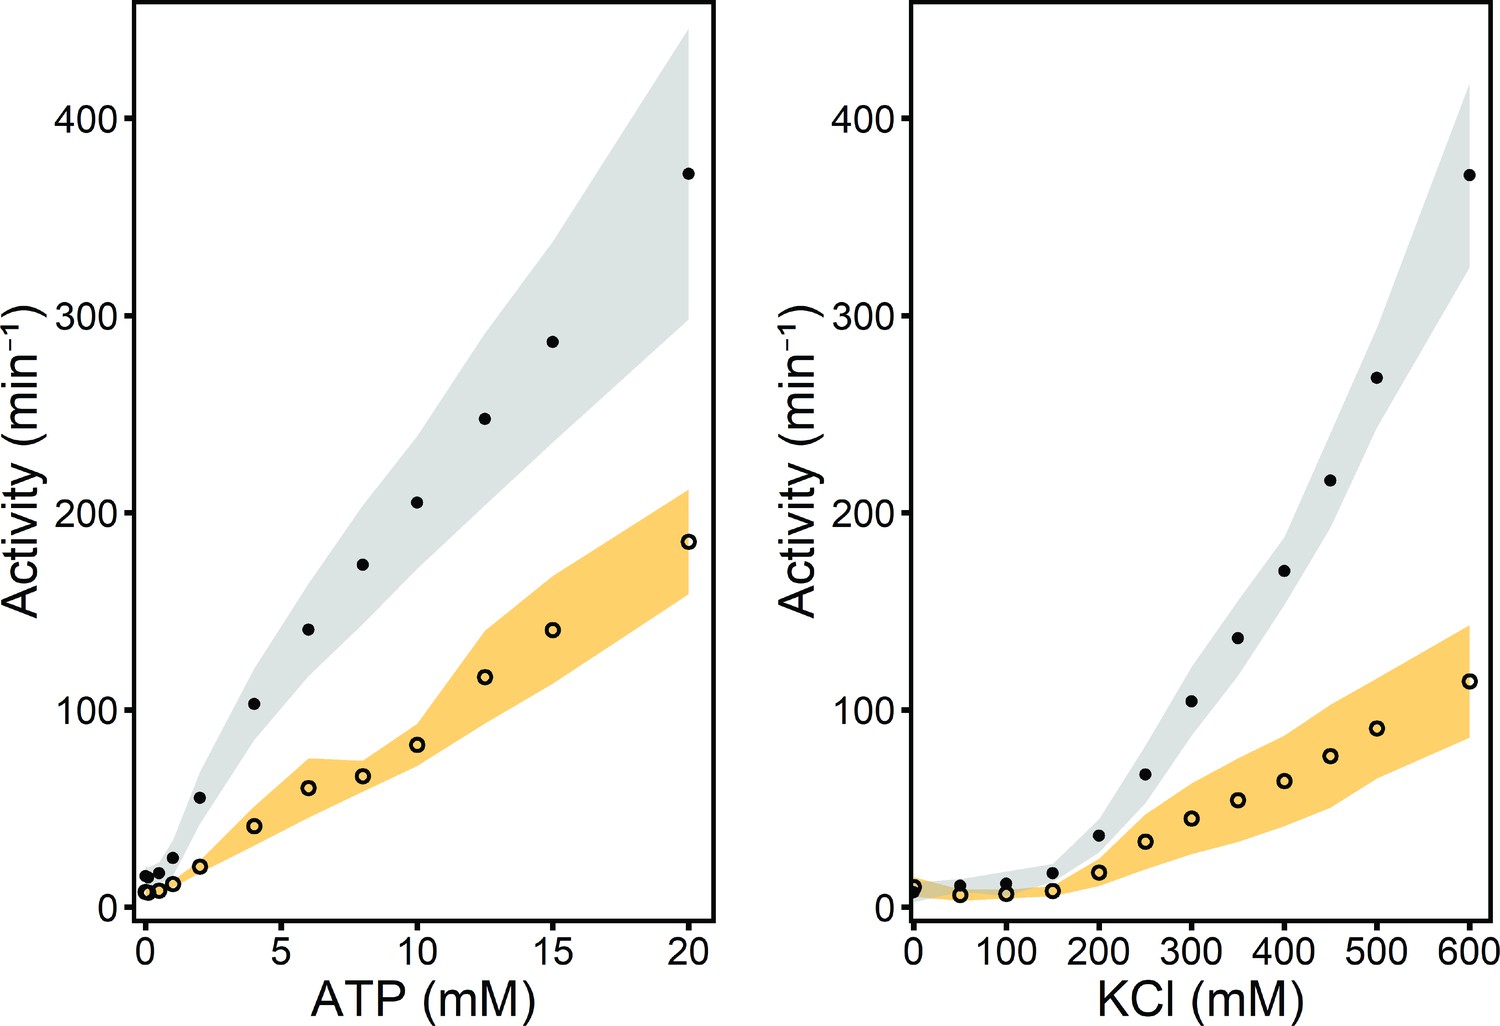
Enzyme-coupled ATPase assay of wildtype OpuA (circles, grey shading), OpuA-K521C (squares, blue shading) and OpuA-N414C (triangles, yellow shading).
A standard sample contains 50 mM HEPES-K pH 7.0, 450 mM KCl, 20 mM Mg-ATP, 100 µM glycine betaine, 4 mM phosphoenolpyruvate, 600 μM NADH, 2.1–3.5 U of pyruvate kinase plus 3.2–4.9 U of lactate dehydrogenase. Standard deviation over at least two measurements with different protein purifications and membrane reconstitutions, each consisting of three technical replicates is represented as shaded areas.
Figure 2 with 1 supplement

The SBDs of OpuA sample two dynamic FRET states.
The proteins were analyzed in 50 mM HEPES-K pH 7.0, 600 mM KCl with the following additions: (A) OpuA-N414C without further additions. (B) OpuA-K521C without further additions. (C) OpuA-E190Q-K521C with 20 mM Mg-ATP plus 100 µM glycine betaine. (D) OpuA-K521C with 20 mM Mg-ATP. From top to bottom: (i) FRET histogram showing the corrected bursts that were selected after removing donor-only and acceptor-only bursts. (ii) 2D E-S histogram showing the same data as in (i). Black dots represent the average value of each state after mpH2MM and after application of the correction factors. (iii) Burst variance analysis of the same burst data as in (i). The standard deviation of FRET in each burst is plotted against its mean FRET. Black squares represent average values per FRET bin. The black dotted line shows the expected standard deviation in the absence of within-burst dynamics. (iv) E-S scatter plot of the corrected dwells. Dwells are colored on the basis of the assigned state of the chosen mpH2MM model. Black dots represent the average value of each state and the numbers at the arrows show transition rate constants (s–1) between the two FRET states. (v) Plot of the ICL-values for each final model. The model used in the analysis is shown as a red star.
Figure 2—figure supplement 1
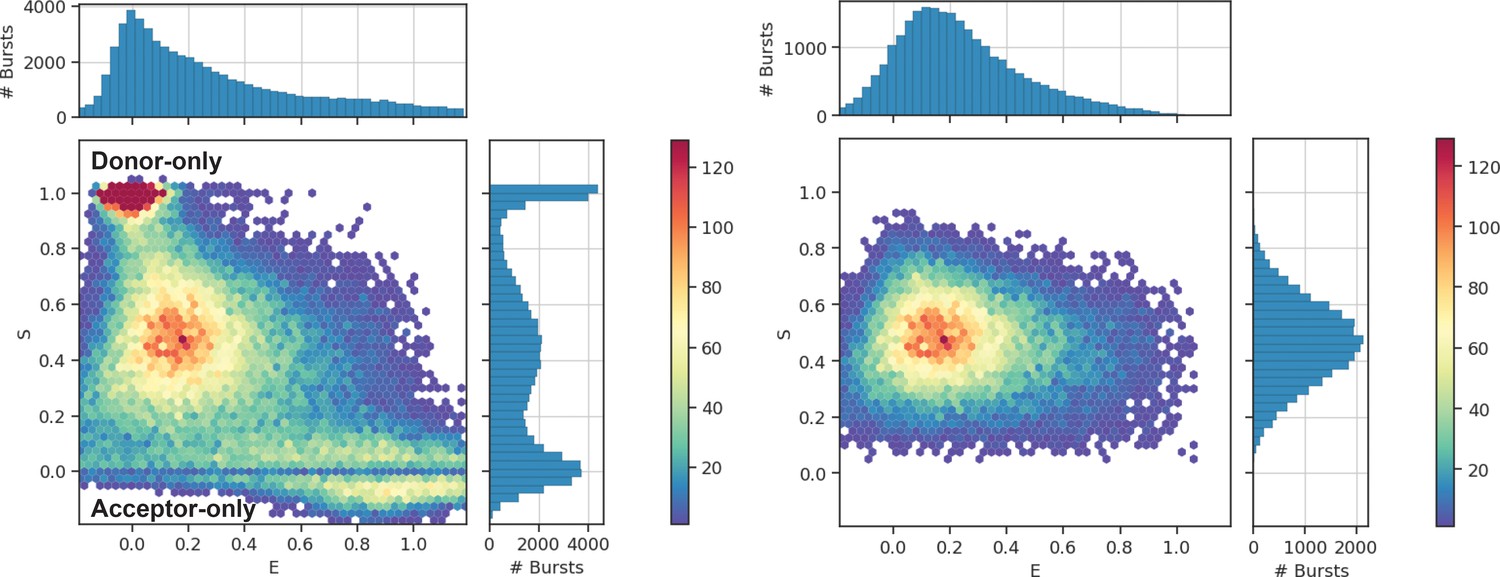
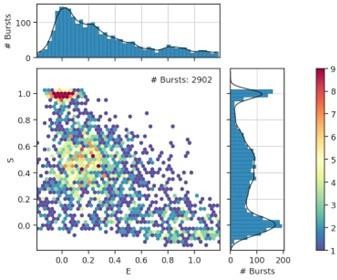
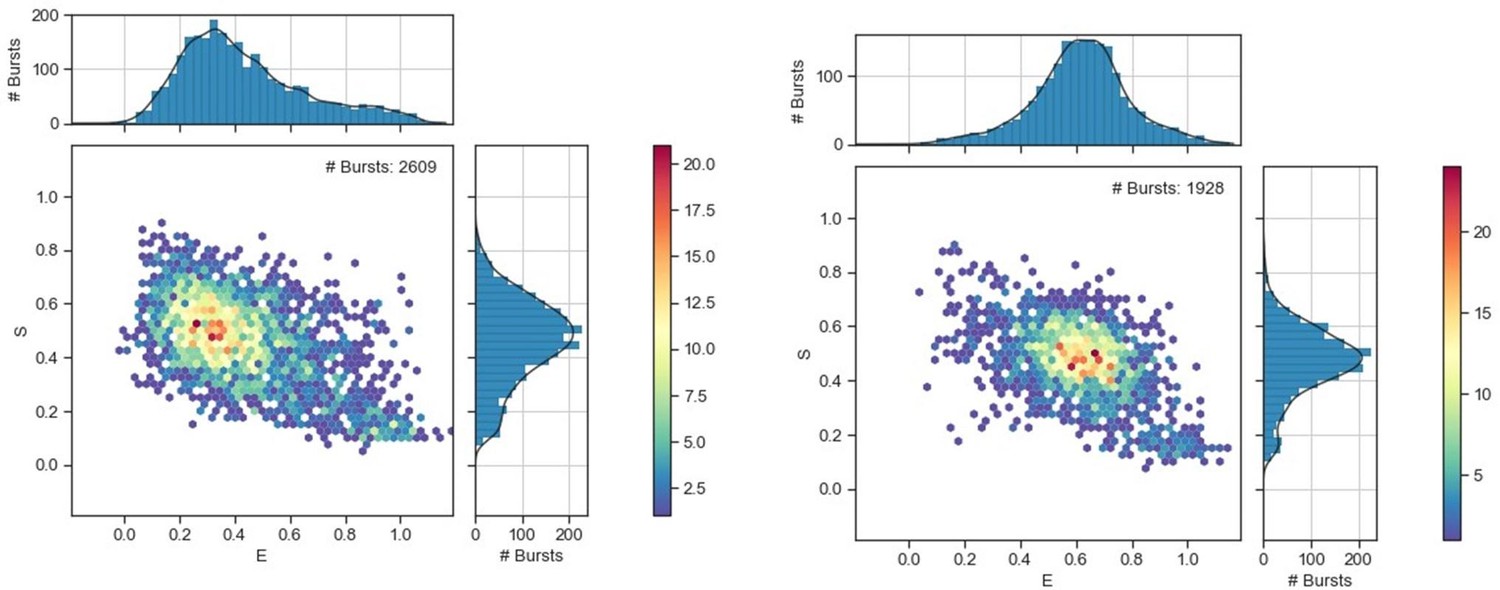
Typical 2D E-S histograms of FRET bursts after γ-correction and correction for leakage and crosstalk.
Graphs represent data of OpuA-K521C in 50 mM HEPES-K pH 7.0, 600 mM KCl. Left graph shows the bursts after burst selection with a cut-off of minimally 35 photons per burst. Right graph shows the bursts after removal of donor-only and acceptor-only bursts. To filter out acceptor-only bursts, a threshold of minimally 15 photons after donor excitation was set. To filter out donor-only bursts, a threshold of minimally 15 photons was set. Similar graphs for all other OpuA variants and conditions can be found in the publicly available python notebooks (https://doi.org/10.34894/GSIEBW).
Figure 3 with 1 supplement
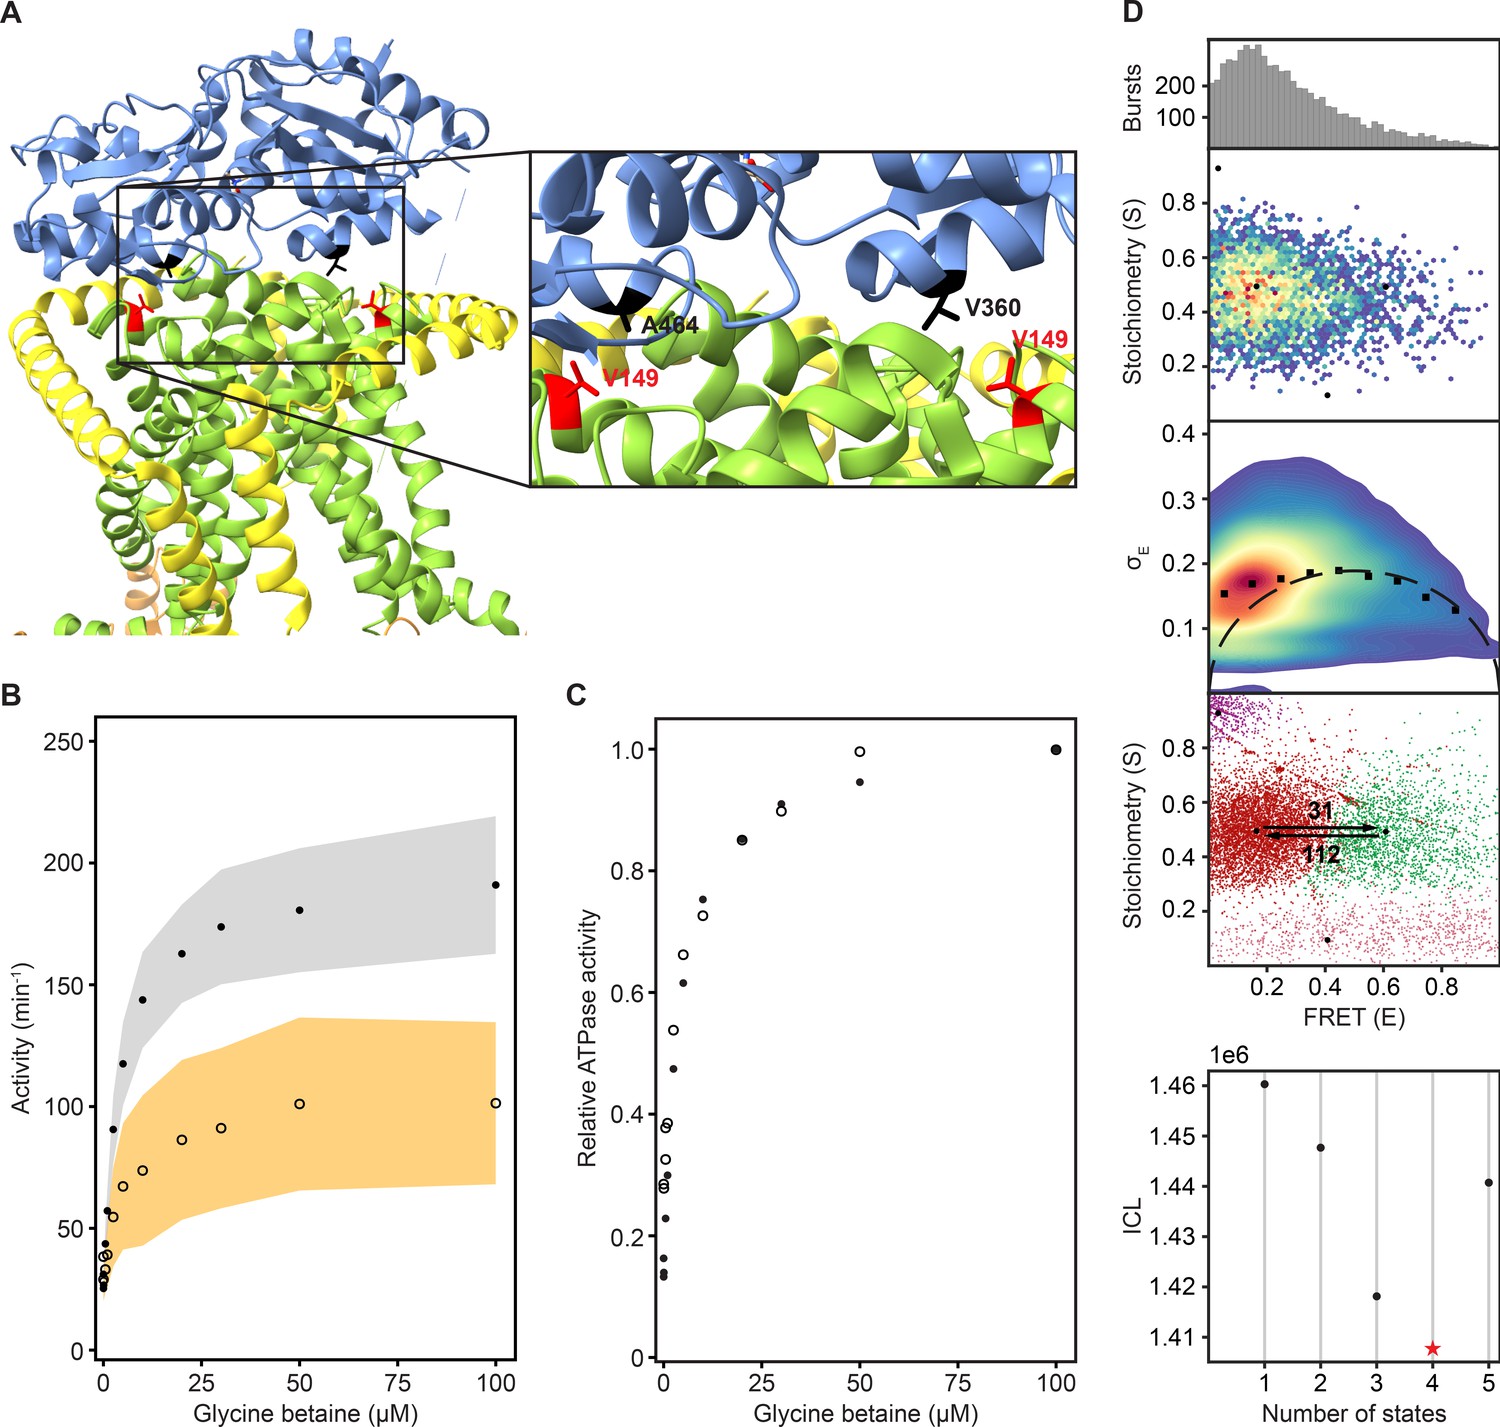
Reduction in SBD docking efficiency does not affect the two dynamic FRET states.
(A) A cryo-EM structure of OpuA (PDB: 7AHH) highlighting Val-149 and the two most important residues in the vicinity of Val-149. Coloring of the domains is similar to that in Figure 1A. (B) Results of an enzyme-coupled ATPase assay for OpuA-WT (filled circles, grey) and OpuA-V149Q-K521C (open circles, yellow). Each sample contains 50 mM HEPES-K pH 7.0, 450 mM KCl, 10 mM Mg-ATP, 4 mM phosphoenolpyruvate, 600 μM NADH, 2.1–3.5 U of pyruvate kinase, and 3.2–4.9 U of lactate dehydrogenase. Standard deviation over at least two measurements with different protein purifications and membrane reconstitutions, each consisting of three technical replicates is represented as shaded areas. (C) Results of (B) represented as activity relative to the activity at 100 µM glycine betaine. (D) smFRET results for OpuA-V149Q-K521C in 50 mM HEPES-K pH 7.0, 600 mM KCl. From top to bottom: (i) FRET histogram showing the corrected bursts that were selected after removing donor-only and acceptor-only bursts. (ii) 2D E-S histogram showing the same data as in (i). Black dots depict the average value of each state after mpH2MM and after application of the correction factors. (iii) Burst variance analysis of the same burst data as in (i). The standard deviation of FRET in each burst is plotted against its mean FRET. Black squares represent average values per FRET bin. Black dotted line shows the expected standard deviation in the absence of within-burst dynamics. (iv) E-S scatter plot of the corrected dwells. Dwells are colored on the basis of the assigned state of the chosen mpH2MM model. Black dots represent the average value of each state and the numbers at the arrows show transition rate constants (s–1) between the two FRET states. (v) Plot of the ICL-values for each final model. The model used in the analysis is shown as a red star.
Figure 3—figure supplement 1
Enzyme-coupled ATPase assay for wildtype OpuA (squares, grey shading) and OpuA-V149Q-K521C (circles, yellow shading).
A standard sample contains 50 mM HEPES-K pH 7.0, 450 mM KCl, 20 mM Mg-ATP, 100 µM glycine betaine, 4 mM phosphoenolpyruvate, 600 μM NADH, 2.1–3.5 U of pyruvate kinase plus 3.2–4.9 U of lactate dehydrogenase. Standard deviation over at least two measurements with different protein purifications and membrane reconstitutions, each consisting of three technical replicates is represented as shaded areas.
Figure 4 with 3 supplements
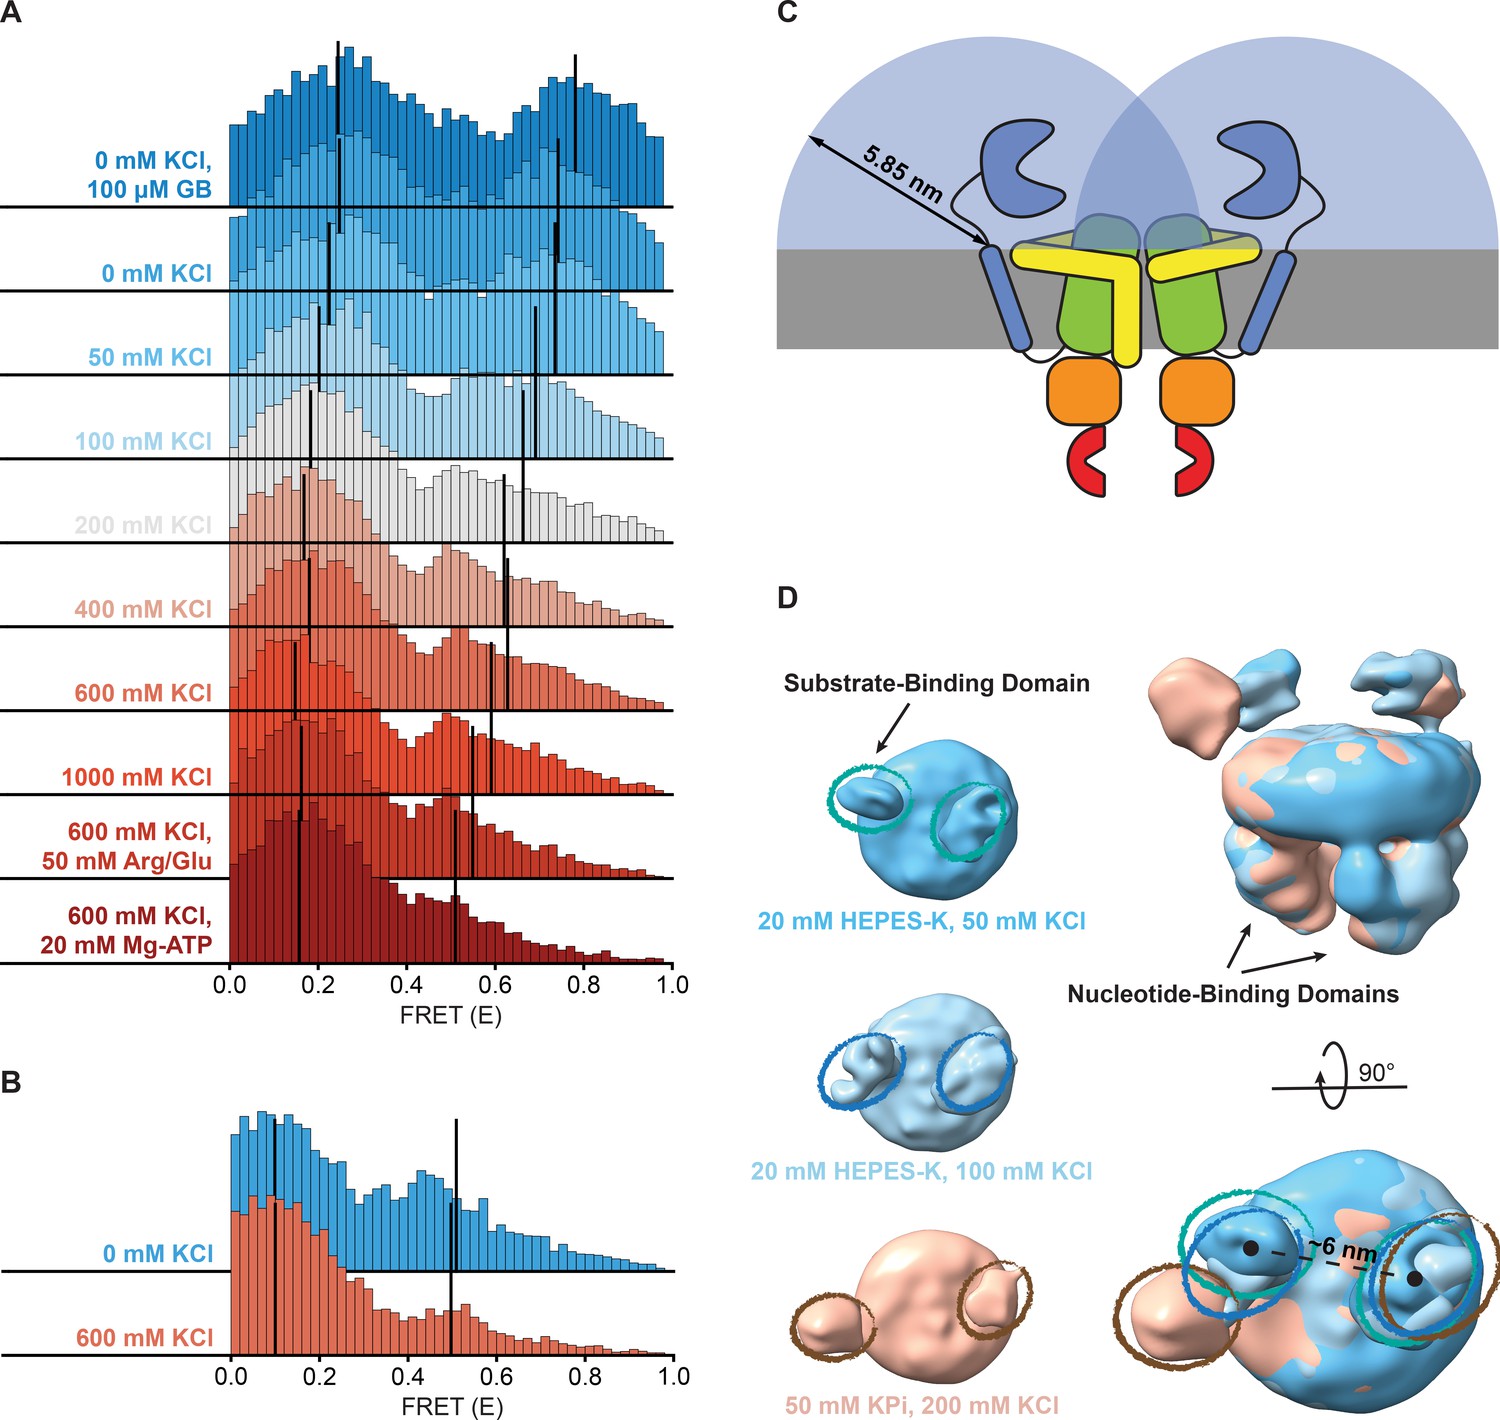
Shifts in FRET states under different conditions.
(A, B) FRET (E) histograms of OpuA-K521C (A) and OpuA-N414C (B) corresponding to the corrected dwells of the two FRET states after mpH2MM. Black lines show the mean E of the two states. (C) A schematic representation of the diffusion freedom in 2D of the SBDs, shown as blue semicircles. The radius is defined as the sum of the radius of an SBD and the length of the linker region in a fully extended conformation. The sequence of the linker region was defined based on the occluded OpuA structure (PDB: 7AHD) and spans the N- and C-terminal end of the SBD and anchoring helix, respectively. (D) Lowpass-filtered cryo-EM density maps of OpuA-WT in three different ionic strength conditions (50 mM, 100 mM and 200 mM KCl). The top-views of each condition are horizontally aligned (left) and super-positioned (right) for better comparison. The densities corresponding to the SBDs are highlighted in teal, blue and brown ellipses, respectively.
Figure 4—figure supplement 1
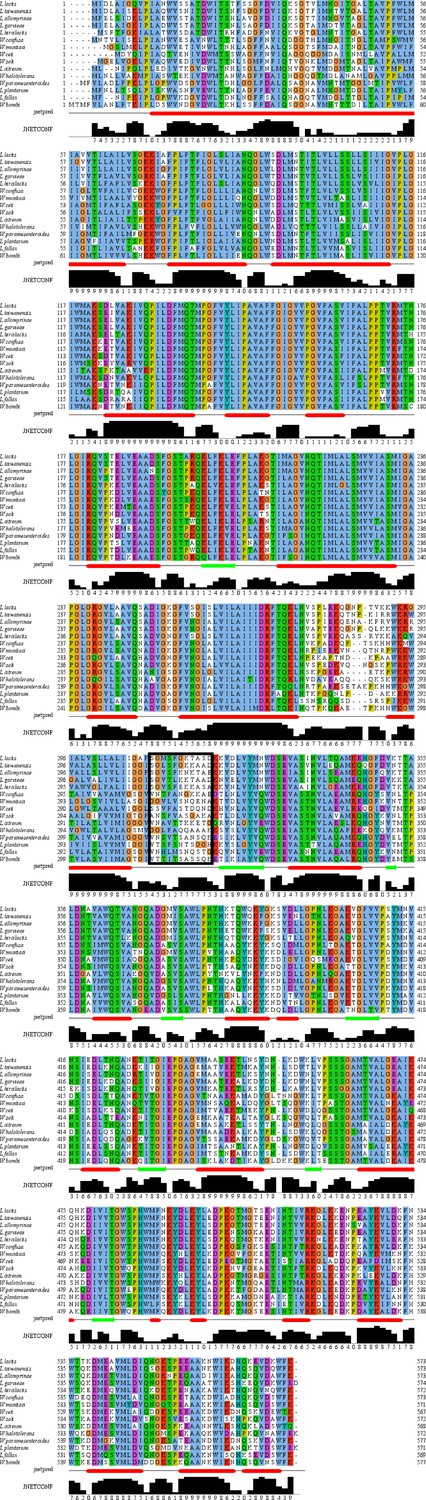
Multiple sequence alignment of close homologs of OpuA from L.
lactis. The alignment was made by the Clustal Omega webserver using the default settings. The alignment was visualized and the JPRED secondary structure prediction were performed in Jalview (version 2.11.2.6). The black box indicates the linker region, based on OpuA from L. lactis. Jnetpred shows the consensus prediction of the different predictions in JPRED; α-helices are shown as red tubes and β-sheets as dark green arrows. JNETCONF is a confidence estimate of the jnetpred prediction. NCBI reference sequence IDs are: L. lactis, WP_003130445.1; L. taiwanensis, WP_205272268.1; L. allomyrinae, WP_120771492.1; L. garvieae, WP_004257235.1; L. hircilactis, WP_153496572.1; W. confusa, WP_199402959.1; W. muntiaci, WP_187387617.1;, W. ceti, WP_213409458.1; W. soli, WP_147152447.1; L. citreum, WP_040177303.1; W. halotolerans, WP_022790870.1; W. paramesenteroides, WP_150189650.1; L. plantarum, WP_068161132.1; L. fallax, WP_010007192.1; W. bombi, WP_092461275.1.
Figure 4—figure supplement 2
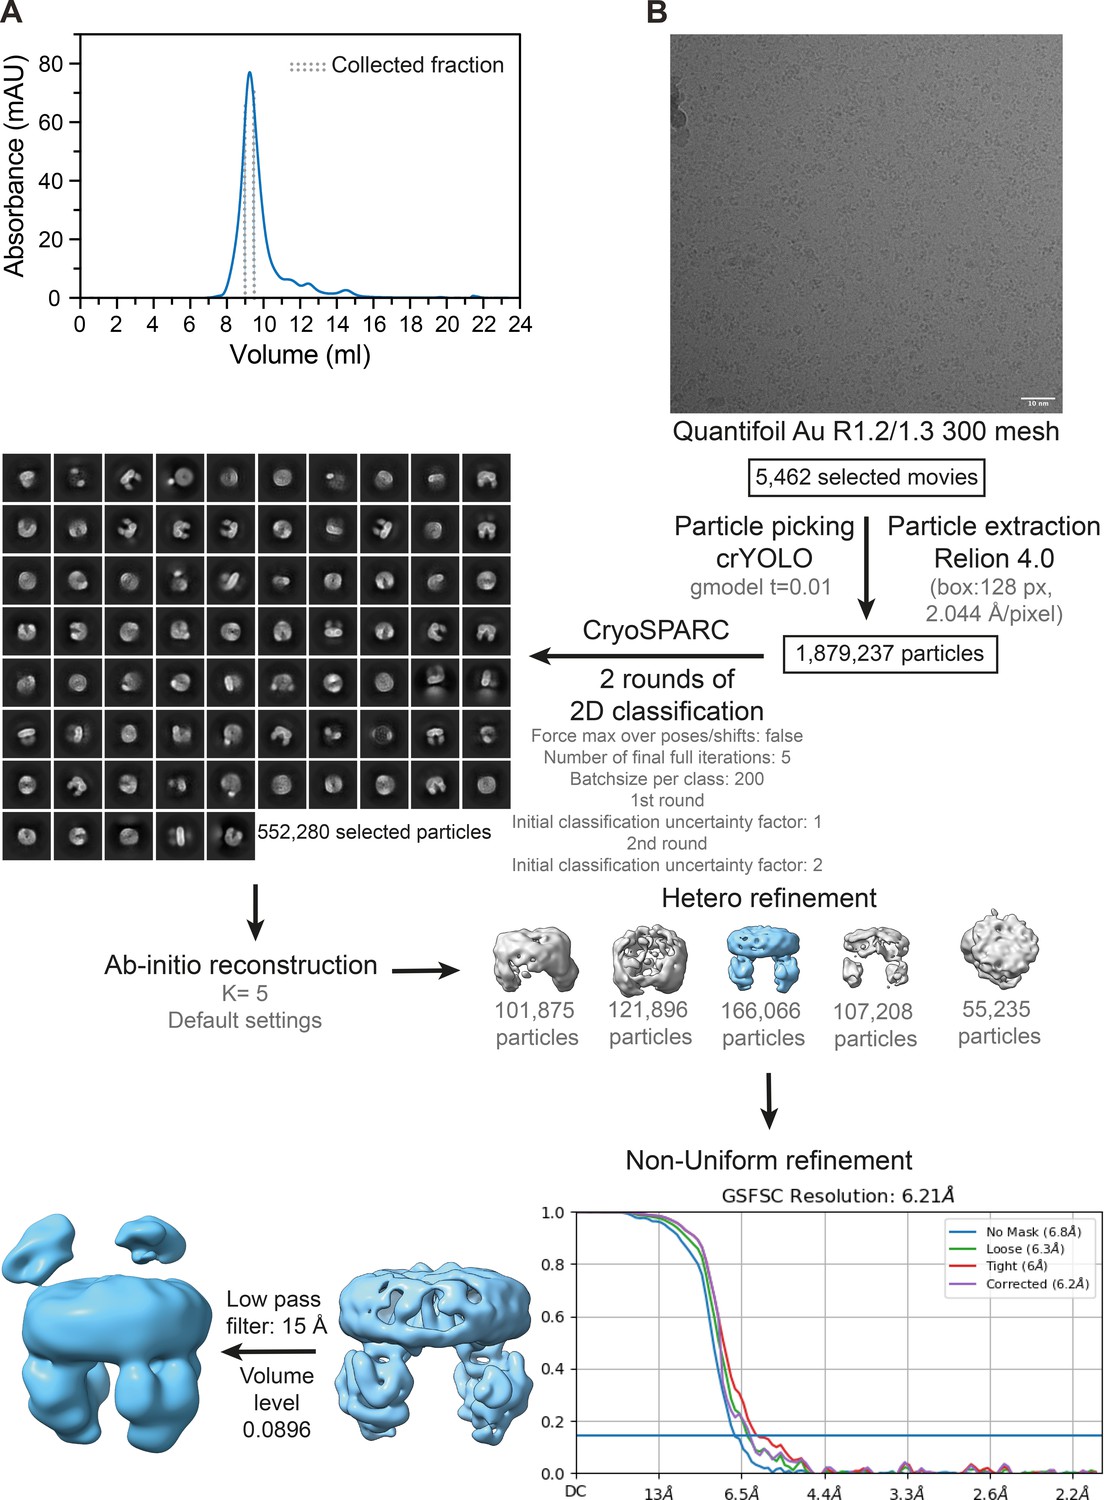
Image processing of OpuA wild-type in MSP1E3D1 nanodiscs in 20 mM HEPES-K pH 7.0, 50 mM KCl.
(A) Representative elution profile from Superdex 200 increase 10/300 GL size-exclusion column. The collected fraction for cryo-EM sample preparation is indicated by dashed lines. (B) Representative micrograph at 1.3 μm defocus followed by detailed overview of the image processing leading to the map used. Abbreviations: gmodel t=crYOLO general model and K=number of classes. Scale bar, 10 nm.
Figure 4—figure supplement 3
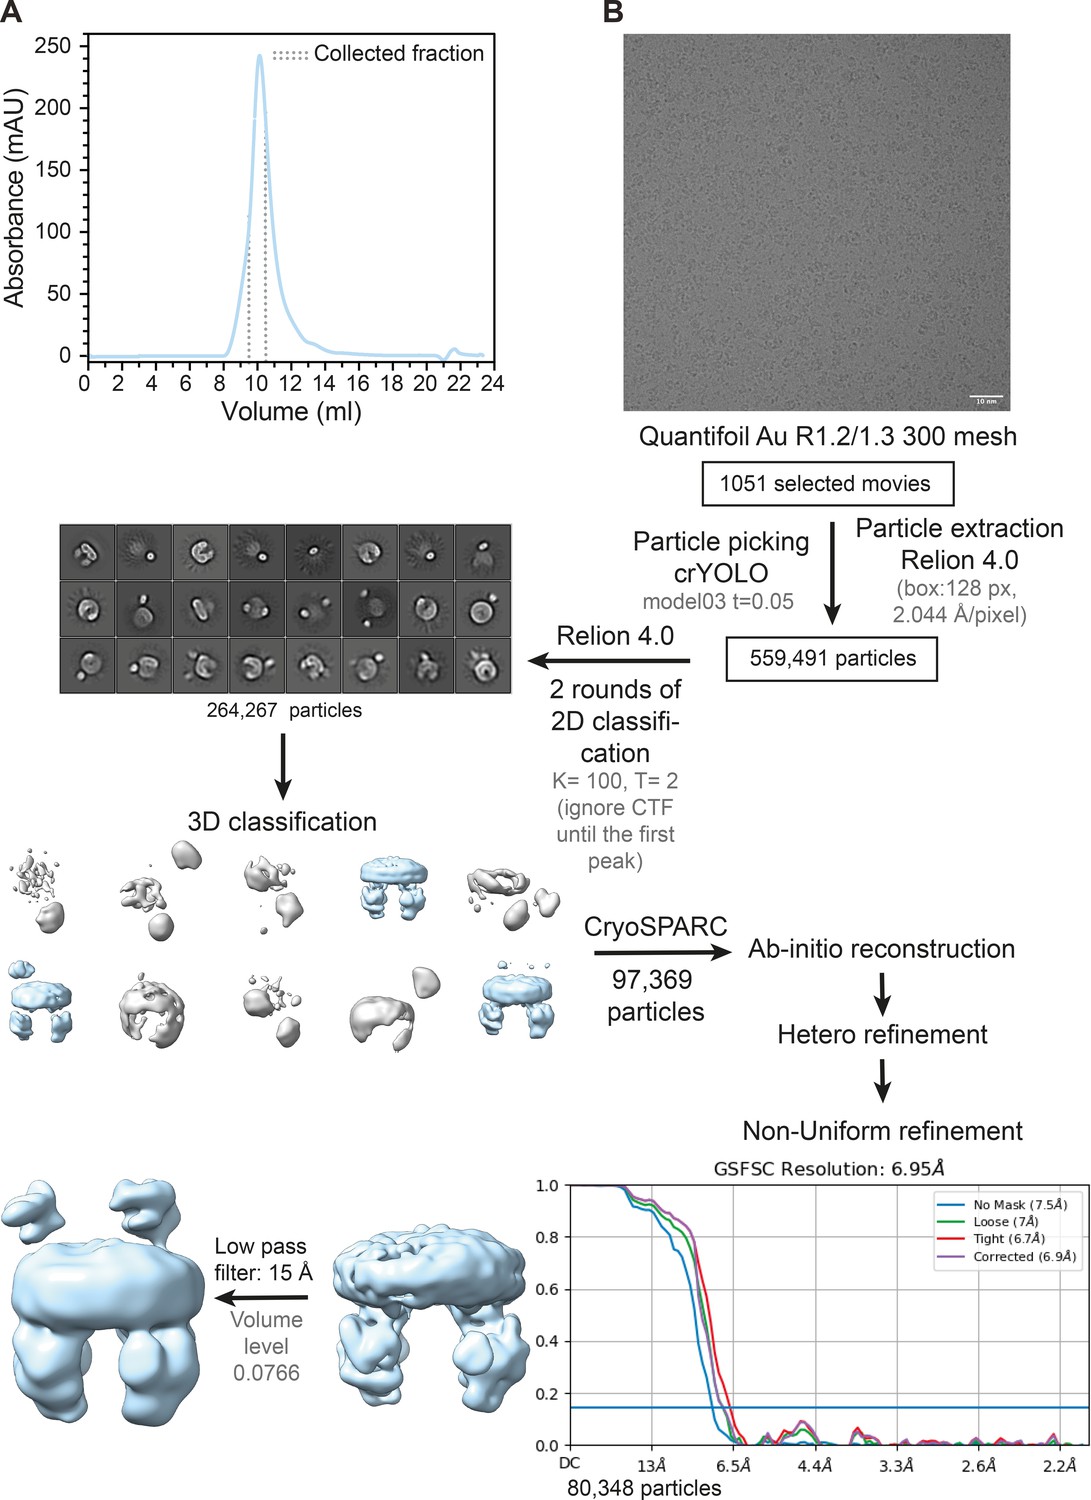
Image processing of OpuA wild-type in MSP1E3D1 nanodiscs in 20 mM HEPES-K pH 7.0, 100 mM KCl.
(A) Representative elution profile from Superdex 200 increase 10/300 GL size-exclusion column. The collected fraction for cryo-EM sample preparation is indicated by dashed lines. (B) Representative micrograph of the sample at 1.3 μm defocus, followed by detailed overview of the image processing leading to the map used. Abbreviations: model03=in-house trained crYOLO model generated by Sikkema et al., 2020, K=number of classes and T=tau_fudge. Scale bar, 10 nm.
Figure 5
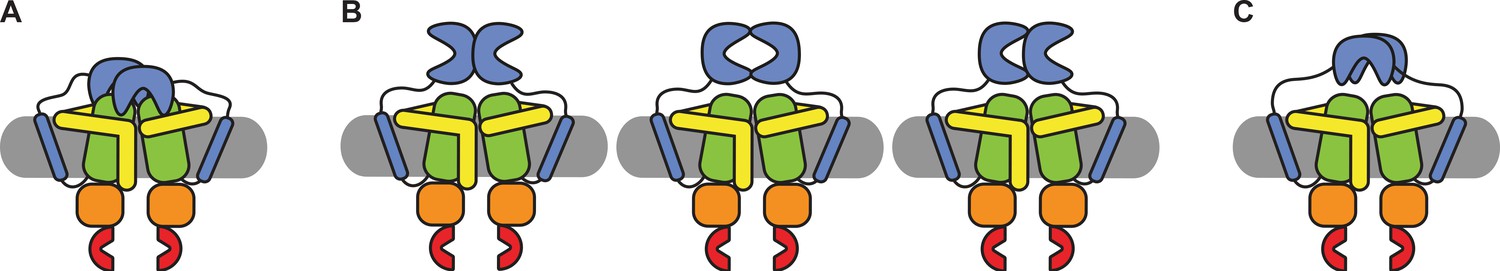
Schematic of possible states of the SBDs of OpuA.
(A) Both SBDs dock in a non-productive manner onto the TMDs. (B) The SBDs interact with each other in an upright orientation either back-to-back, front-to-front or front-to-back. (C) The SBDs interact sideways with each other.
Author response image 1
Author response image 2
Author response image 3
Tables
Table 1
ATPase activity of OpuA variants K521C and N414C before and after labeling with maleimide dyes*.
| Activity unlabeled variant (min–1) | Activity labeled variant (min–1) | |
|---|---|---|
| K521C | 342+/-71† | 263+/-52 |
| N414C | 332+/-25 | 246+/-55 |
-
*
Buffer conditions: 50 mM HEPES-K pH 7.0, 100 µM glycine betaine, 10 mM Mg-ATP plus 600 mM KCl.
-
†
The errors refer to the standard deviation over at least two measurements with different protein purifications and membrane reconstitutions, each consisting of three technical replicates.
Table 2
The FRET (E) and Stoichiometry (S) of the FRET states of OpuA-K521C, their relative abundance and the transition rate constants between the states.
| Condition* | Low-FRET state (L) | High-FRET state (H) | Transition rate (s–1) | Number of FRET dwells | |||||
|---|---|---|---|---|---|---|---|---|---|
| S | E | % dwells | S | E | % dwells | L-H | H-L | ||
| 50 mM BIS-TRIS pH 7.0, 0 mM KCl | 0.537 | 0.250 | 64.1 | 0.521 | 0.749 | 35.9 | 118 | 153 | 16,788 |
| 0 mM KCl | 0.531 | 0.248 | 66.9 | 0.519 | 0.742 | 33.1 | 123 | 175 | 27,047 |
| 0 mM KCl, 100 µM glycine betaine | 0.532 | 0.245 | 68.3 | 0.517 | 0.781 | 31.7 | 120 | 166 | 17,364 |
| 50 mM KCl | 0.526 | 0.225 | 68.0 | 0.516 | 0.735 | 32.0 | 88 | 153 | 14,708 |
| 100 mM KCl | 0.525 | 0.202 | 74.6 | 0.513 | 0.691 | 25.4 | 78 | 178 | 13,532 |
| 200 mM KCl | 0.519 | 0.183 | 81.4 | 0.518 | 0.663 | 18.6 | 41 | 153 | 16,454 |
| 400 mM KCl | 0.516 | 0.168 | 82.0 | 0.518 | 0.620 | 18.0 | 28 | 120 | 15,946 |
| 600 mM KCl | 0.497 | 0.180 | 82.6 | 0.490 | 0.628 | 17.4 | 42 | 173 | 38,604 |
| 600 mM KCl (V149Q) | 0.495 | 0.164 | 81.9 | 0.492 | 0.608 | 18.1 | 31 | 112 | 11,034 |
| 1000 mM KCl | 0.505 | 0.148 | 79.9 | 0.511 | 0.591 | 20.1 | 26 | 109 | 12,666 |
| 600 mM KCl, 20 mM Mg-ATP | 0.524 | 0.157 | 81.5 | 0.527 | 0.510 | 18.5 | 16 | 121 | 12,061 |
| 600 mM KCl, 20 mM Mg-ATP, 100 µM glycine betaine | 0.515 | 0.155 | 78.5 | 0.511 | 0.507 | 21.5 | 0 | 52 | 17,155 |
| 600 mM KCl, 20 mM Mg-ATP, 100 µM glycine betaine (E190Q) | 0.540 | 0.141 | 81.4 | 0.547 | 0.505 | 18.6 | 7 | 38 | 10,832 |
| 600 mM KCl, 20 mM Mg-ATP, 100 µM glycine betaine, 500 µM orthovanadate | 0.517 | 0.154 | 78.9 | 0.513 | 0.529 | 21.5 | 17 | 87 | 21,052 |
| 600 mM KCl, 50 mM glutamate, 50 mM arginine | 0.510 | 0.162 | 79.9 | 0.513 | 0.549 | 20.1 | 19 | 133 | 12,722 |
-
*
All conditions, except the first, contained 50 mM HEPES-K pH 7.0.
-
Table 2—source data 1
Burst variance analysis and mpH2MM of the FRET bursts of OpuA-K521C (variants) in different buffers.
(A) From top to bottom: (1) Burst variance analysis of the bursts which were corrected by the leakage, crosstalk, and γ-correction factors and which were selected after removing donor-only and acceptor-only bursts. The standard deviation of FRET in each burst is plotted against its mean FRET. Black squares show average values per FRET bin. Black dotted line shows the expected standard deviation in the absence of within-burst dynamics. (2) 2D E-S histogram shows the same data as in (1), with on both sides a histogram that represents the same bursts. (B) Plot of the ICL-values for each final model. The model used in the downstream analysis and following figures is shown as a star. (C) Plot of the BIC’-values for each final model. The red line represents a 0.05 cut-off. The model used is shown as a star. (D) Burst-based 2D E-S scatter plot. Bursts are colored on the basis of the assigned state of the chosen mpH2MM model. If a burst contains more than one state, it is assigned as being dynamic. (E) Dwell-based 2D E-S scatter plot. Dwells are colored on the basis of the assigned state of the chosen mpH2MM model. The dwells were corrected for leakage, direct excitation and the γ-factor. Black dots in A, D and E represent the average value of each state.
- https://cdn.elifesciences.org/articles/90996/elife-90996-table2-data1-v1.zip
Table 3
The FRET (E) and Stoichiometry (S) of the FRET states of OpuA-N414C, their relative abundance, and the transition rate constants between the states.
| Condition* | Low-FRET state (L) | High-FRET state (H) | Transition rate (s–1) | Number of FRET dwells | |||||
|---|---|---|---|---|---|---|---|---|---|
| S | E | % dwells | S | E | % dwells | L-H | H-L | ||
| 0 mM KCl | 0.527 | 0.099 | 72.2 | 0.543 | 0.509 | 27.8 | 15 | 68 | 12,162 |
| 600 mM KCl | 0.483 | 0.100 | 88.5 | 0.476 | 0.497 | 11.5 | 24 | 193 | 18,130 |
| 600 mM KCl, 20 mM Mg-ATP | 0.548 | 0.090 | 94.4 | 0.536 | 0.456 | 5.6 | 2 | 141 | 10,447 |
| 600 mM KCl, 20 mM Mg-ATP, 100 µM glycine betaine | 0.538 | 0.087 | 95.7 | 0.555 | 0.499 | 4.7 | 2 | 59 | 14,898 |
| 600 mM KCl, 20 mM Mg-ATP, 100 µM glycine betaine (E190Q) | 0.479 | 0.106 | 94.8 | 0.464 | 0.540 | 5.2 | 25 | 317 | 8024 |
| 600 mM KCl, 20 mM Mg-ATP, 100 µM glycine betaine, 500 µM orthovanadate | 0.538 | 0.085 | 94.6 | 0.578 | 0.568 | 5.4 | 5 | 186 | 7236 |
-
*
All conditions contained 50 mM HEPES-K pH 7.0.
-
Table 3—source data 1
Burst variance analysis and mpH2MM of the FRET bursts of OpuA-N414C (variants) in different buffers.
(A) From top to bottom: (1) Burst variance analysis of the bursts which were corrected by the leakage, crosstalk, and γ-correction factors and which were selected after removing donor-only and acceptor-only bursts. The standard deviation of FRET in each burst is plotted against its mean FRET. Black squares show average values per FRET bin. Black dotted line shows the expected standard deviation in the absence of within-burst dynamics. (2) 2D E-S histogram shows the same data as in (1), with on both sides a histogram that represents the same bursts. (B) Plot of the ICL-values for each final model. The model used in the downstream analysis and following figures is shown as a star. (C) Plot of the BIC’-values for each final model. The red line represents a 0.05 cut-off. The model used is shown as a star. (D) Burst-based 2D E-S scatter plot. Bursts are colored on the basis of the assigned state of the chosen mpH2MM model. If a burst contains more than one state, it is assigned as being dynamic. (E) Dwell-based 2D E-S scatter plot. Dwells are colored on the basis of the assigned state of the chosen mpH2MM model. The dwells were corrected for leakage, direct excitation and the γ-factor. Black dots in A, D and E represent the average value of each state.
- https://cdn.elifesciences.org/articles/90996/elife-90996-table3-data1-v1.zip
Table 4
Steady-state anisotropy values of free dyes and dyes which were attached to different proteins.
| Condition* | Alexa Fluor 555† | Alexa Fluor 647† | |
|---|---|---|---|
| Free dye | 50 mM KCl | 0.21 | 0.16 |
| Free dye | 300 mM KCl | 0.21 | 0.16 |
| MalE-T36C-S352C | 300 mM KCl | 0.26 | 0.22 |
| OpuA-K521C | 50 mM KCl | 0.30 | 0.28 |
| OpuA-K521C | 300 mM KCl | 0.29 | 0.27 |
| OpuA-N414C | 50 mM KCl | 0.28 | 0.24 |
| OpuA-N414C | 300 mM KCl | 0.28 | 0.23 |
-
*
All conditions contained 50 mM HEPES-K pH 7.0.
-
†
Standard deviation between triplicates was less than 0.001.
Key resources table
| Reagent type (species) or resource | Designation | Source or reference | Identifiers | Additional information |
|---|---|---|---|---|
| Gene (Lactococcus lactis IL1403) | OpuAA | NA | Q9RQ05 | |
| Gene (Lactococcus lactis IL1403) | OpuABC | NA | Q9KIF7 | |
| Strain, strain background (Lactococcus lactis) | Opu401 | 10.1073/pnas.0603871103; Biemans-Oldehinkel et al., 2006 | Lactococcus lactis NZ9000 with OpuA gene deleted | |
| Strain, strain background (Escherichia coli) | BL21(DE3) | NA | ||
| Recombinant DNA reagent | pNZopuAhis | 10.1073/pnas.97.13.7102; van der Heide and Poolman, 2000 | Expression plasmid for OpuA | |
| Recombinant DNA reagent | pMSP1E3D1 | Addgene | CAT#:20066 | Expression plasmid for MSP1E3D1 |
| Commercial assay or kit | Pierce BCA Protein Assay Kit | ThermoFisher Scientific Inc. | CAT#:23225 | |
| Chemical compound, drug | Alexa Fluor 555 | ThermoFisher Scientific Inc. | CAT#: A20346 | |
| Chemical compound, drug | Alexa Fluor 647 | ThermoFisher Scientific Inc. | CAT#: A20347 | |
| Chemical compound, drug | 1,2-dioleoyl-sn-glycero-3-phosphoethanolamine (DOPE) | Avanti Polar Lipids Inc. | CAT#: 850725 P | |
| Chemical compound, drug | 1,2-dioleoyl-sn-glycero-3-phosphocholine (DOPC) | Avanti Polar Lipids Inc. | CAT#: 850375 P | |
| Chemical compound, drug | 1,2-dioleoyl-sn-glycero-3-phospho-(1'-rac-glycerol) (DOPG) | Avanti Polar Lipids Inc. | CAT#: 840475 P | |
| Chemical compound, drug | n-Dodecyl-β-d-maltoside (DDM) | Glycon Biochemicals GmbH | CAT#: D97002 | |
| Chemical compound, drug | Adenosine 5′-triphosphate (ATP) | Roche Holding AG | CAT#: 10519987001 | |
| chemical compound, drug | ß-Nicotine amide adenine dinucleotide (NADH) | Carl Roth Gmbh | CAT#: AE12.1 | |
| Chemical compound, drug | Phosphoenolpyruvic acid (PEP) | Carl Roth Gmbh | CAT#: 8397.3 | |
| Chemical compound, drug | Pyruvate Kinase/Lactic Dehydrogenase enzymes from rabbit muscle (PK/LDH) | Sigma-Aldrich | CAT#: P0294 | |
| Chemical compound, drug | Glycine betaine | Sigma-Aldrich | CAT#: 61962 | |
| Chemical compound, drug | L-glutamine | Sigma-Aldrich | CAT#: G3126 | |
| Chemical compound, drug | L-arginine | Sigma-Aldrich | CAT#: A5006 | |
| Chemical compound, drug | Orthovanadate | Sigma-Aldrich | CAT#: 450243 | |
| Software, algorithm | FRETbursts | 10.1371/journal.pone.0160716; Ingargiola et al., 2016b | Version 0.7.1 | |
| Software, algorithm | Bursth2m | 10.1038/s41467-022-28632-x; Harris et al., 2022 | Version 0.1.6 | |
| Software, algorithm | Phconvert | phconvert.rtfd.io; Ingargiola et al., 2016a | Version 0.9 | |
| Software, algorithm | Ggplot2 | 10.1007/978-3-319-24277-4; Wickham, 2016 | Version 3.3.5 | |
| Software, algorithm | SymPhoTime 64 | PicoQuant | RRID:SCR_016263 | Version 2.6 |
| Software, algorithm | SerialEM | 10.1016/j.jsb.2005.07.007; Mastronarde, 2005 | Version 4.0.10 | |
| Software, algorithm | FOCUS | 10.1016/J.JSB.2017.03.007; Biyani et al., 2017 | Version 1.0.0 | |
| Software, algorithm | MotionCor2 | 10.1038/nmeth.4193; Zheng et al., 2017 | ||
| Software, algorithm | CTFFIND4 | 10.1016/J.JSB.2015.08.008; Rohou and Grigorieff, 2015 | ||
| Software, algorithm | crYOLO | 10.1038/s42003-019-0437-z; Wagner et al., 2019 | Version 1.8.4 | |
| Software, algorithm | Relion | 10.1042/BCJ20210708; Kimanius et al., 2021 | Version 4.0 | |
| Software, algorithm | cryoSPARC | 10.1038/nmeth.4169; Punjani et al., 2017 | Version 4.1.1 | |
| Software, algorithm | UCSF ChimeraX | 10.1002/pro.3235; Goddard et al., 2018 | Version 1.5 |
Table 5
Primers used in this study to generate mutations in OpuA.
| Oligo nr. | Oligo name | Sequence (from 5' to 3') * |
|---|---|---|
| 9053 | UOpuAC-K521C fw | aaaggttUgaagTGTgaaaatccagaagcttataaag |
| 9054 | UOpuAC-K521C rev | aaaccttUacgaacaatgg |
| 9511 | UOpuAC-N414C fw | aattgaagaUttaacaaatcaagc |
| 9512 | UOpuAC-N414C rev | atcttcaatUgaattaacACAcatataacttggaac |
| 9617 | UOpuAA-E190Q fw | aagctttcUctgctcttgac |
| 9618 | UOpuAA-E190Q rev | agaaagcTUGatccatgagcaaaatc |
| 9619 | UOpuAC-V149Q fw | atttgatUccagcgCAAgcattctttgg |
| 9620 | UOpuAC-V149Q rev | aatcaaaUaaacgaaaccagg |
-
*
Mutated triplets and introduced uracils are in capitals.
Additional files
Download links
A two-part list of links to download the article, or parts of the article, in various formats.
Downloads (link to download the article as PDF)
Open citations (links to open the citations from this article in various online reference manager services)
Cite this article (links to download the citations from this article in formats compatible with various reference manager tools)
The substrate-binding domains of the osmoregulatory ABC importer OpuA transiently interact
eLife 12:RP90996.
https://doi.org/10.7554/eLife.90996.3


