Dysfunctional hippocampal-prefrontal network underlies a multidimensional neuropsychiatric phenotype following early-life seizure
- Department of Neuroscience and Behavioral Sciences, Ribeirão Preto Medical School, University of São Paulo, Brazil
- Department of Physiology and Biophysics Federal University of Minas Gerais, Brazil
- Laboratory of Molecular and Behavioral Neuroscience (LANEC), Federal University of Minas Gerais, Brazil
- Department of Psychiatry, University of Michigan Medical School, United States
- Department of Pathology, State University of Campinas, Brazil
- Neuroscience Discipline, Department of Neurology and Neurosurgery,Universidade Federal de São Paulo, Brazil
Figures
Figure 1
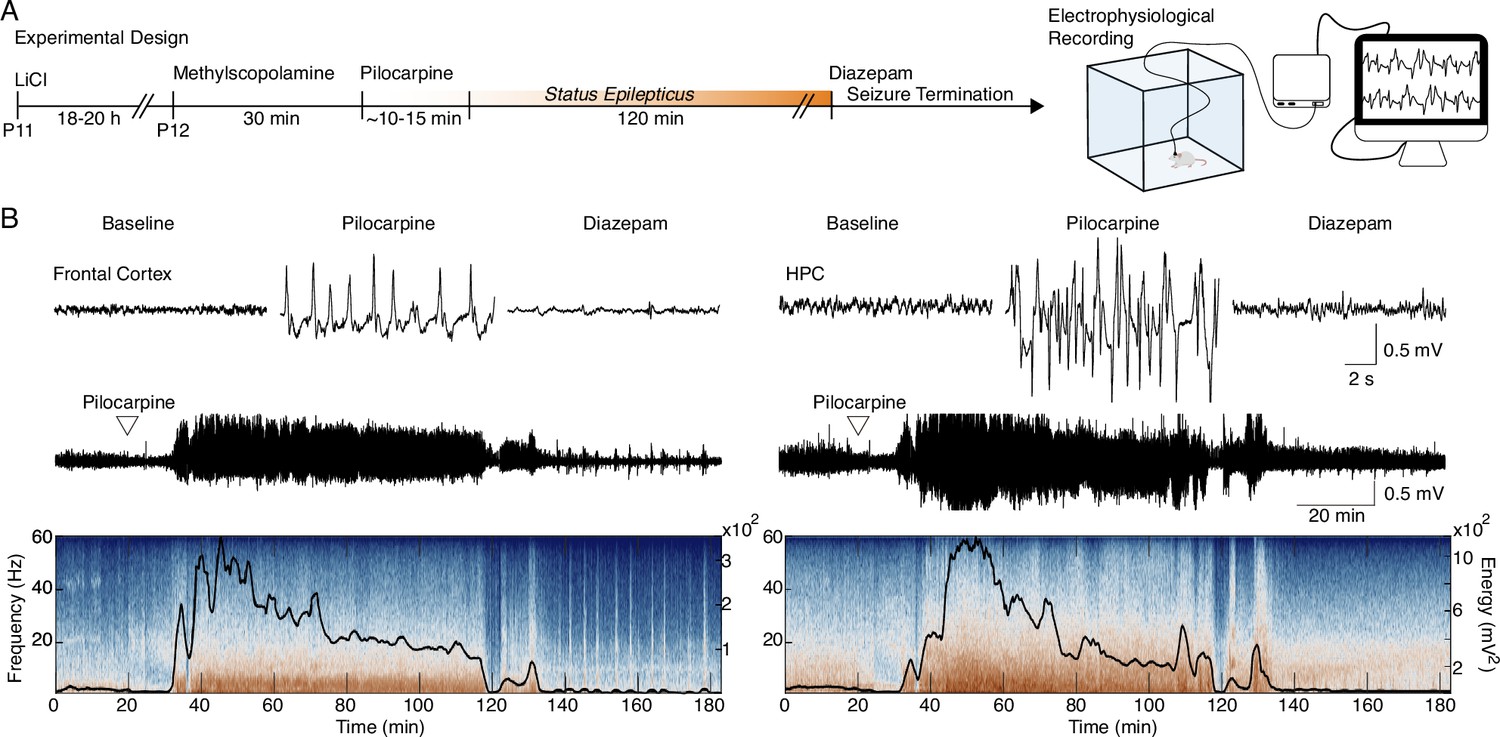
Early-life seizure (ELS) induction.
(A) Experimental design representing early-life Status epilepticus (SE) induction and monitoring. (B) Representative traces of local field potential (LFP) during baseline, motor seizure induced by pilocarpine, and ELS interruption with diazepam injection (top). Representative LFP from the frontal cortex and HPC throughout the experiment (middle). LFPs are aligned with their respective spectrograms and energy curves (bottom). ELS n=5.
Figure 2
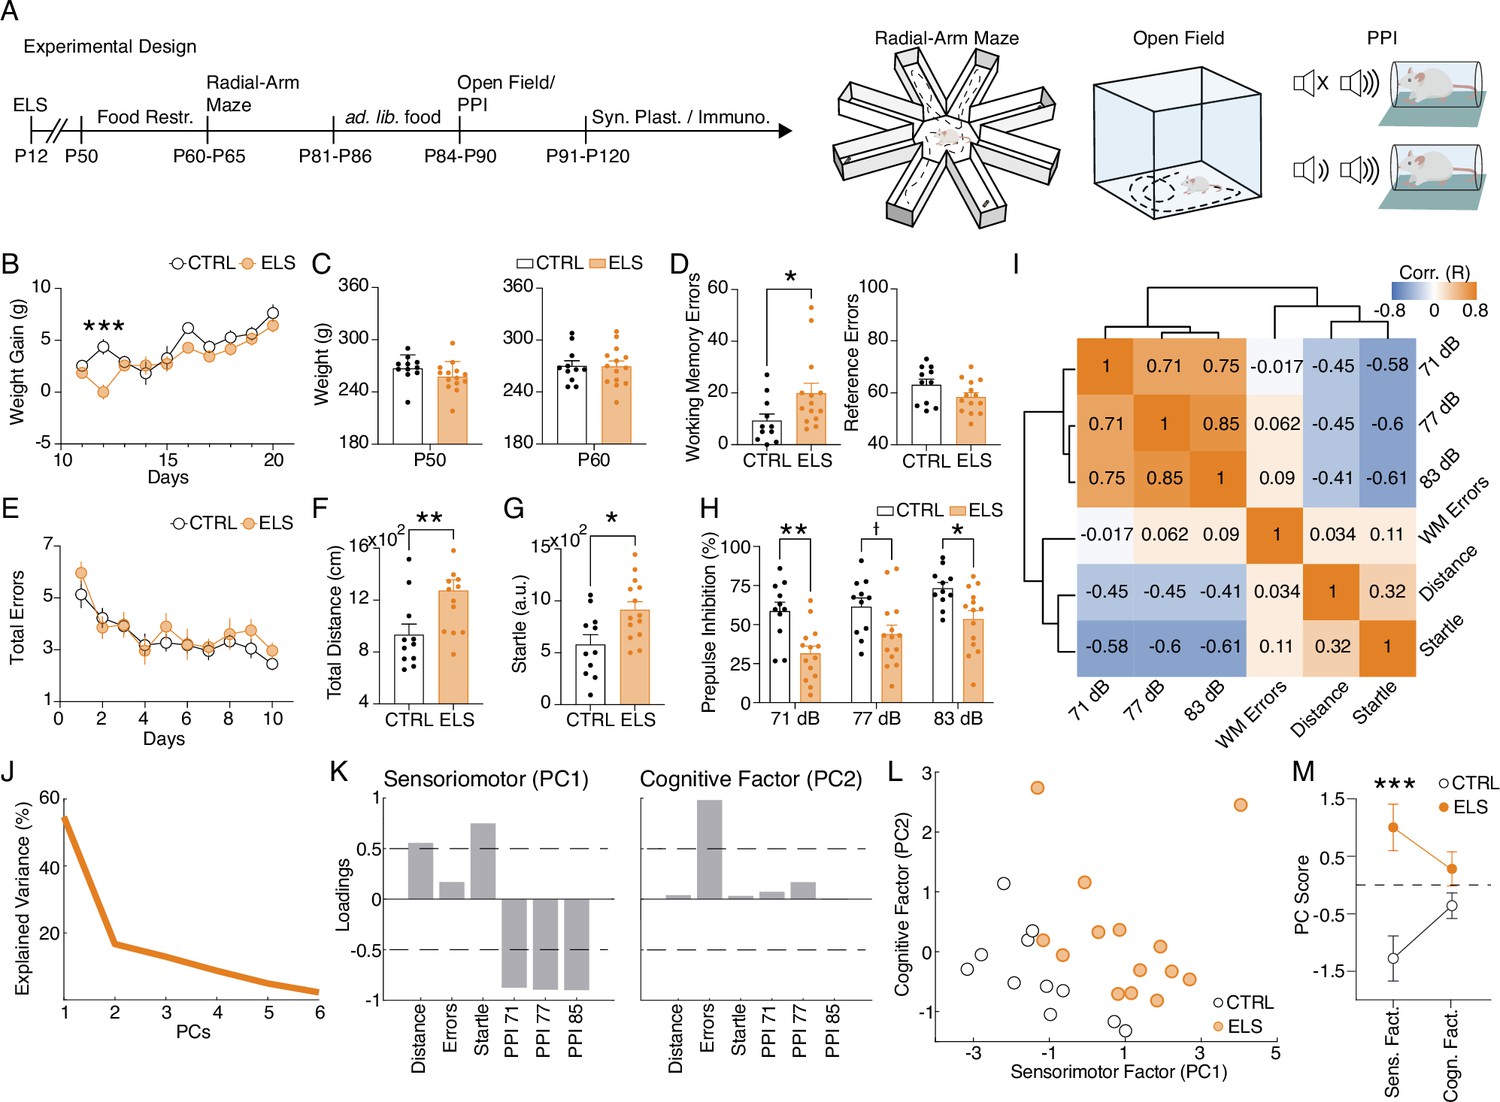
Early-life seizure (ELS) induces cognitive and sensorimotor impairments.
(A) Experimental design representing early-life Status epilepticus (SE) induction, age of the animals during the experiments, and behavioral tests performed. (B) Weight gain after ELS induction. ELS rats showed weight loss only on the ELS induction day (Two-way RM ANOVA). (C) No weight differences between ELS and control (CTRL) throughout experiments in adulthood, regardless if before food restriction (left) or during food restriction (right). (D) Working memory task on the radial-arm maze. ELS rats showed an increase in working memory errors across sessions (left, Mann-Whitney test) without differences in the number of reference errors (right). (E) ELS rats showed a similar learning curve when compared to CTRL. (F) Hyperlocomotion of ELS rats in the open field test (Mann-Whitney test). (G) Higher acoustic startle of ELS rats (t-test). (H) Impaired sensorimotor gating in ELS rats as measured in the prepulse inhibition (PPI) test with three stimulus intensities (Two-way RM ANOVA). (I) Correlation matrix of all behavioral variables. Note a cluster of positive correlations formed by the PPI measures and another cluster of negative correlations formed by the PPI measures with distance traveled on the open field and the acoustic startle. Working memory errors were not correlated with the other behavioral features. (J) Explained variance from principal components analysis (PCA). Note that the two first PCs explain 71.32% of the data. (K) Loadings of the behavioral variables on each principal component (PC) reveal a sensorimotor factor (PC1) and an uncorrelated cognitive factor (PC2). (L) PCA of the behavioral features showing each animal projected onto the new factors. (M) The sensorimotor factor distinguishes ELS from CTRL animals, as we compare the PC scores from each group (t-test). † p<0.1, *p<0.05, **p<0.01, ***p<0.001. CTRL n=11, and ELS n=14. Error bars represent the mean ± SEM.
Figure 3
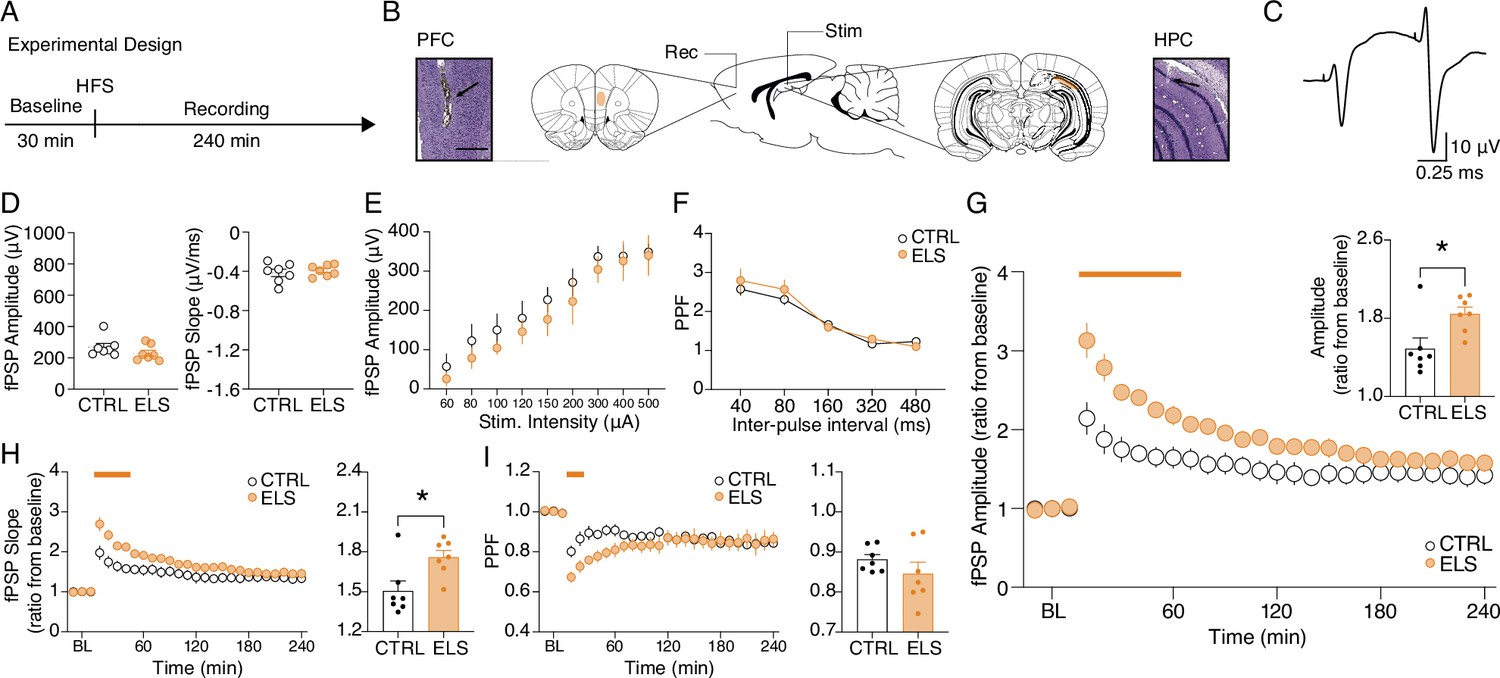
Aberrant hippocampus-prefrontal cortex (HPC-PFC) synaptic plasticity in animals submitted to early-life seizure (ELS).
(A) Experimental design including high-frequency stimulation (HFS) to long-term potentiation (LTP) induction. (B) Electrode placement and representative electrolytic lesions in Cresyl Violet stained coronal sections. (C) Representative evoked field postsynaptic potentials (fPSPs) in the PFC. No difference between ELS and control (CTRL) rats in terms of basal neurotransmission and synaptic efficacy, as shown by: (D) fPSP amplitude (left) and slope (right); (E) input-output curve; and (F) paired-pulse facilitation (PPF) curve.( G) Despite no changes in basal synaptic efficacy, ELS rats showed aberrantly increased LTP, represented by higher fPSP amplitude ratios from baseline (BL) post-HFS, both across time blocks (main curve graph, Two-way RM ANOVA) and their averages (bar graph, inset, t-test). (H) As in (G) but from fPSP slopes. (I) ELS rats showed reduced PPF in the initial 30 min (curve graph). Averaged data resulted in no differences between the groups (bar graph, inset). † p<0.1, *p<0.05, **p<0.01, ***p<0.001. CTRL n=7, and ELS n=7. Error bars represent the mean ± SEM.
Figure 4

Early-life seizure (ELS) induces long-term neural inflammation, but not neuronal loss.
(A) 3-D brain diagram and coronal sections representing the brain regions investigated. (B–E) Representative photomicrographs from immunohistochemistry each pair of columns represents a group comparison (left control (CTRL) and right ELS) and each line is related to CA1 and PL, respectively. (B) NeuN immunohistochemistry showed that ELS rats did not present neuronal loss. Parvalbumin (PV) immunohistochemistry. (D) mGluR5: (E) GFAP, showing increased astrogliosis induced by ELS (Mixed-effects model). GL: Granule layer of dentate gyrus; CA1: Cornu Ammonis 1; EC: Entorhinal cortex; IL: Infralimbic cortex; PL: Prelimbic cortex; TRN: Thalamic Reticular Nucleus. *p<0.05. CTRL n=11, and ELS n=14. Error bars represent the mean ± SEM.
Figure 5
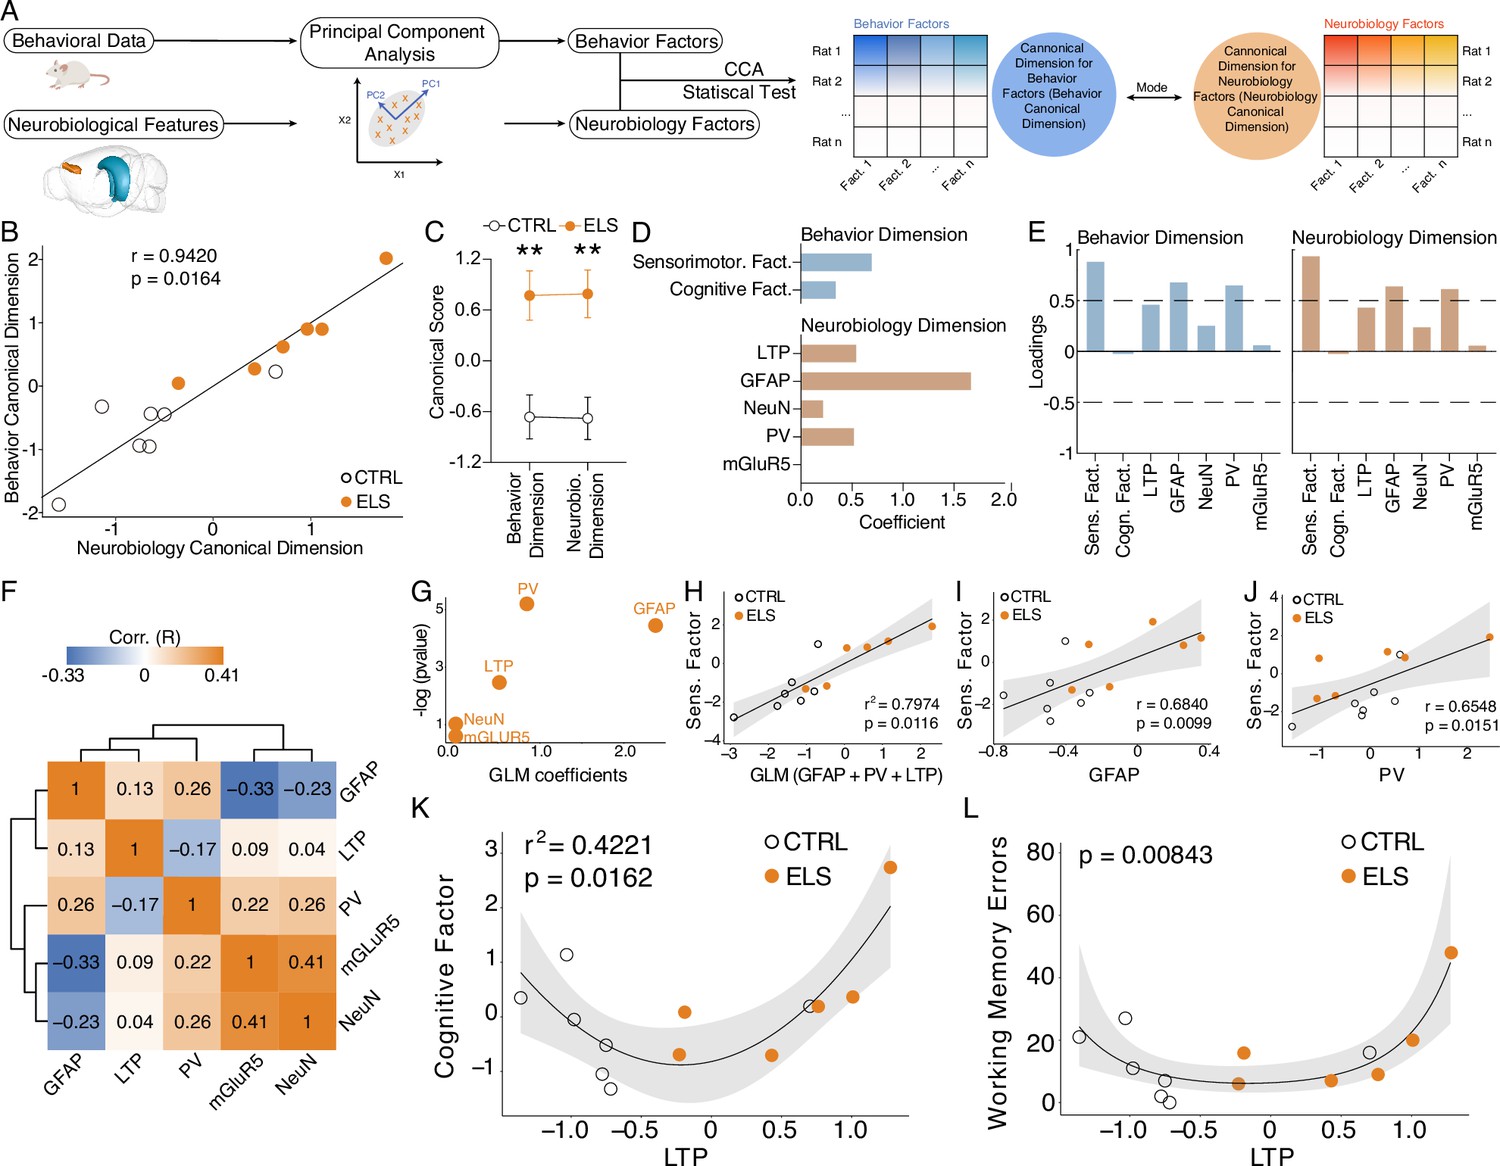
Cognitive impairment and sensorimotor deficits are distinctly correlated with abnormal long-term potentiation (LTP) and neuroinflammation.
(A) Steps performed in data processing and analysis for canonical correlation analysis (CCA). (B) CCA analysis showing control (CTRL) and early-life seizure (ELS) animals projected onto the first canonical correlation. We found a strong correlation between the neurobiology canonical dimension and the behavior canonical dimension (Hotteling-Lawley trace test). (C) Canonical scores showing the clear CTRL vs. ELS difference that the CCA was able to capture (t-test). (D) Coefficients for behavior and neurobiology canonical dimensions, showing greater contributions of the sensorimotor factor, glial fibrillary acidic protein (GFAP), parvalbumin (PV), and LTP for the correlation. (E) Loadings of the behavioral and neurobiological variables on each canonical correlation dimension indicating an association between GFAP and PV with the sensorimotor factor. (F) Correlation matrix showing only weak correlations between the neurobiological features. (G) Generalized linear model (GLM) regression between neurobiological features and the sensorimotor factor. (H) GLM model between neurobiological features and the sensorimotor factor show a strong association with GFAP, PV, and LTP. (I) GLM regression between LTP and the cognitive factor shows a quadratic association (left). This quadratic association was further confirmed by performing a quasi-Poisson regression between LTP and raw values of working memory errors (right). **p<0.01. CTRL n=7, and ELS n=6. Error bars represent the mean ± SEM.
Figure 6
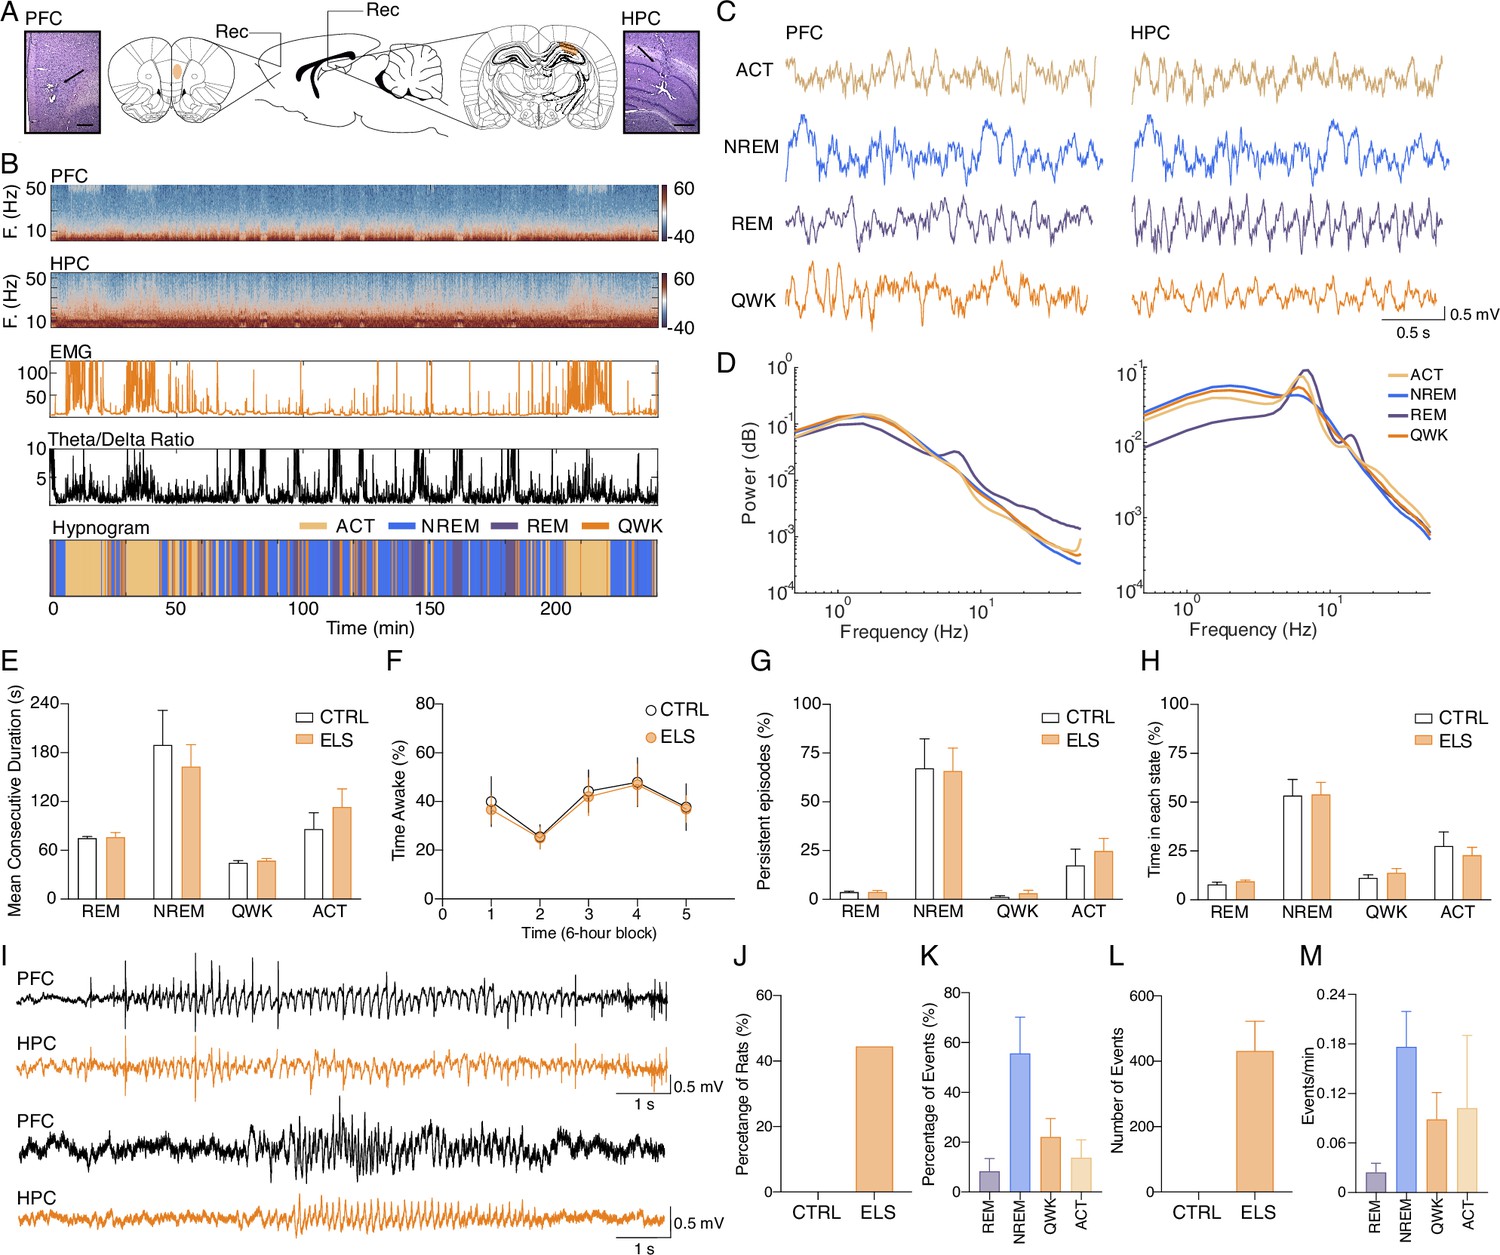
Classification of sleep-wake states and electrographic discharges in early-life seizure (ELS) rats.
(A) Electrode placement and representative electrolytic lesions in Nissl-stained coronal sections. (B) Representative spectrogram, electromyogram (EMG) root mean squared (RMS), and HPC theta/delta ratio used to score the sleep-wake cycle and to generate the hypnogram (bottom). (C) Representative local field potentials (LFPs) (top) recorded from PFC and HPC during active wake (ACT), non-REM (NREM), rapid eye movement (REM), and quiet wake (QWK). (D) Average power spectral density for each state in the PFC and HPC of a representative control (CTRL) animal. Note the increase in HPC theta power during ACT and REM. ELS rats did not present alterations in the sleep-wake cycle. (E–H) There were no differences between ELS and CTRL in the (E) Mean duration of consecutive epochs for each state, (F) percentage of time awake across 6 hr blocks, and in the (G) number of persistent episodes (episodes lasting longer than 3 s, top) or the (H) percentage of time spent in each state (bottom). (I) Representative LFP from PFC and HPC showing a representative spike-wave discharge (SWD, top) and a poly-spike discharge (bottom). (J) Electrographic discharges were found in 44.5% of ELS animals and were absent in CTRL animals. (K) Percentage of events occurring in each sleep-wake stage. (L) Average total number of SWD events in CTRL and ELS animals. (M) Frequency of SWDs occurring per state. SWDs events rarely occurred during REM. CTRL n=6, and ELS n=9. Error bars represent the mean ± SEM.
Figure 7
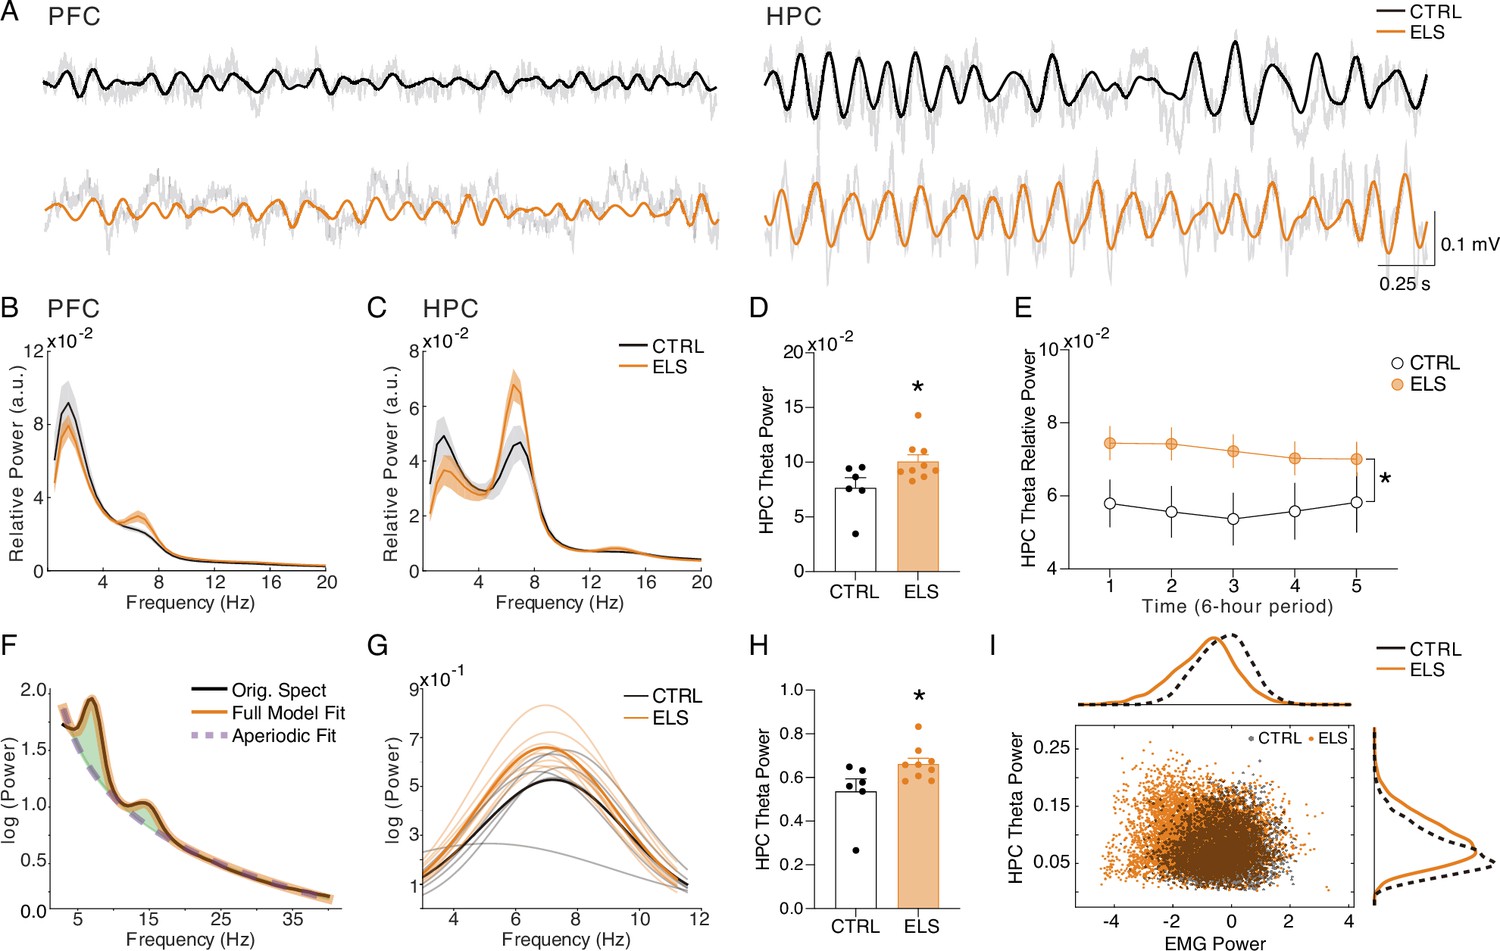
Increased HPC theta power during behavioral activity in early-life seizure (ELS) animals.
(A) Representative raw local field potentials (LFPs) (transparent black lines) and theta-filtered signal of control (CTRL) (black) and ELS (orange) from the PFC (left) and HPC (right) during active wake (ACT). (B) Relative power spectrum densities (PSD) of the PFC during ACT. (C) Relative PSD of the HPC during ACT. (D) ELS rats present an enhanced HPC theta power during ACT (t-test). (E) Theta relative power during each of the 6 hr periods of recording, showing a general increase in the ELS animals that is more pronounced in the initial 18 hr of recording (linear mixed-effects model). (F) Parametric model used to distinguish oscillatory from aperiodic component. (G) Oscillatory components extracted from ACT PSDs used to calculate theta power (Mann-Whitney). (H) Theta power increase in ELS rats is due to a true oscillatory component and not from the aperiodic activity in ACT states. (I) Theta power increase in ELS rats is independent of locomotor activity. Note from the distribution of relative theta power and Z-scored EMG (trapezius) values for all rats that EMG power is not related to the regions of greater theta power in the ELS animals. *p<0.05. CTRL n=6, and ELS n=9. Error bars represent the mean ± SEM.
Figure 8

Early-life seizure (ELS) promotes abnormal gamma coordination in the PFC during behavioral activity.
ELS rats present an abnormal gamma activity in the PFC. (A) Grand-average amplitude correlogram for control (CTRL) (left) and ELS (right) group. Note the absence of amplitude correlation between theta and gamma activity in the ELS group. (B) High-gamma (65–100 Hz) correlation with low-frequency activity. Note the peak around theta oscillation in the CTRL group and the absence in ELS. (C) ELS present an impaired theta-gamma amplitude correlation (t-test). (D) There is no difference between the low- (top) and high-gamma (bottom) average power. (E) Aperiodic activity extracted from the PFC of each rat during active wake (ACT) state. (F) Distribution of the parameters of the aperiodic component (exponent and offset) for each rat. (G) ELS rats show a tendency to reduction (p=0.0656, t-test) in the exponent parameter of the aperiodic component, as illustrated by the flatter spectra. † p<0.1, *p<0.05. CTRL n=6, and ELS n=9. Error bars represent the mean ± SEM.
Figure 9

ELS impairs hippocampus-prefrontal cortex (HPC-PFC) coherence during rapid eye movement (REM) sleep.
(A) Power spectrum densities (PSD) in the PFC during REM. (B) PSD in the HPC during REM. No significant alterations in theta power during REM are observed in early-life seizure (ELS) rats. (C) Theta coherence is diminished in ELS rats. (D) Significant effect on the HPC-PFC theta coherence by averaging the entire recording (left, t-test) and across all periods (right, linear mixed-effects model). (E) Time domain cross-correlation between PFC and HPC LFPs during rapid eye movement (REM) epochs highlighting control (CTRL) (left) and ELS (right) group averages. (F) Reduction in the peak of correlation between –80 to –20 ms in ELS rats (t-test). (G) Average cross-spectrum power density showing a reduced theta peak in the ELS rats. (H) Theta HPC-PFC coherence increases from active wake (ACT) to REM states. We can observe that all the CTRL rats present an increase from ACT to REM (paired t-test), while in ELS rats this is not observed. Paired t-test *p<0.05. (I) Theta coherence dynamics across the sleep-wake cycle. CTRL rats display a homogeneous dynamics with theta coherence being maximal at REM, minimal in quiet wake (QWK), and intermediate in ACT states. This dynamic is disrupted in ELS rats that display a higher variance between animals, with some animals displaying similar coherence in REM and ACT. (J) Entropy of the theta coherence dynamics is higher in ELS rats, representing the more homogeneous values across states (t-test). CTRL n=6, and ELS n=9.
Figure 10
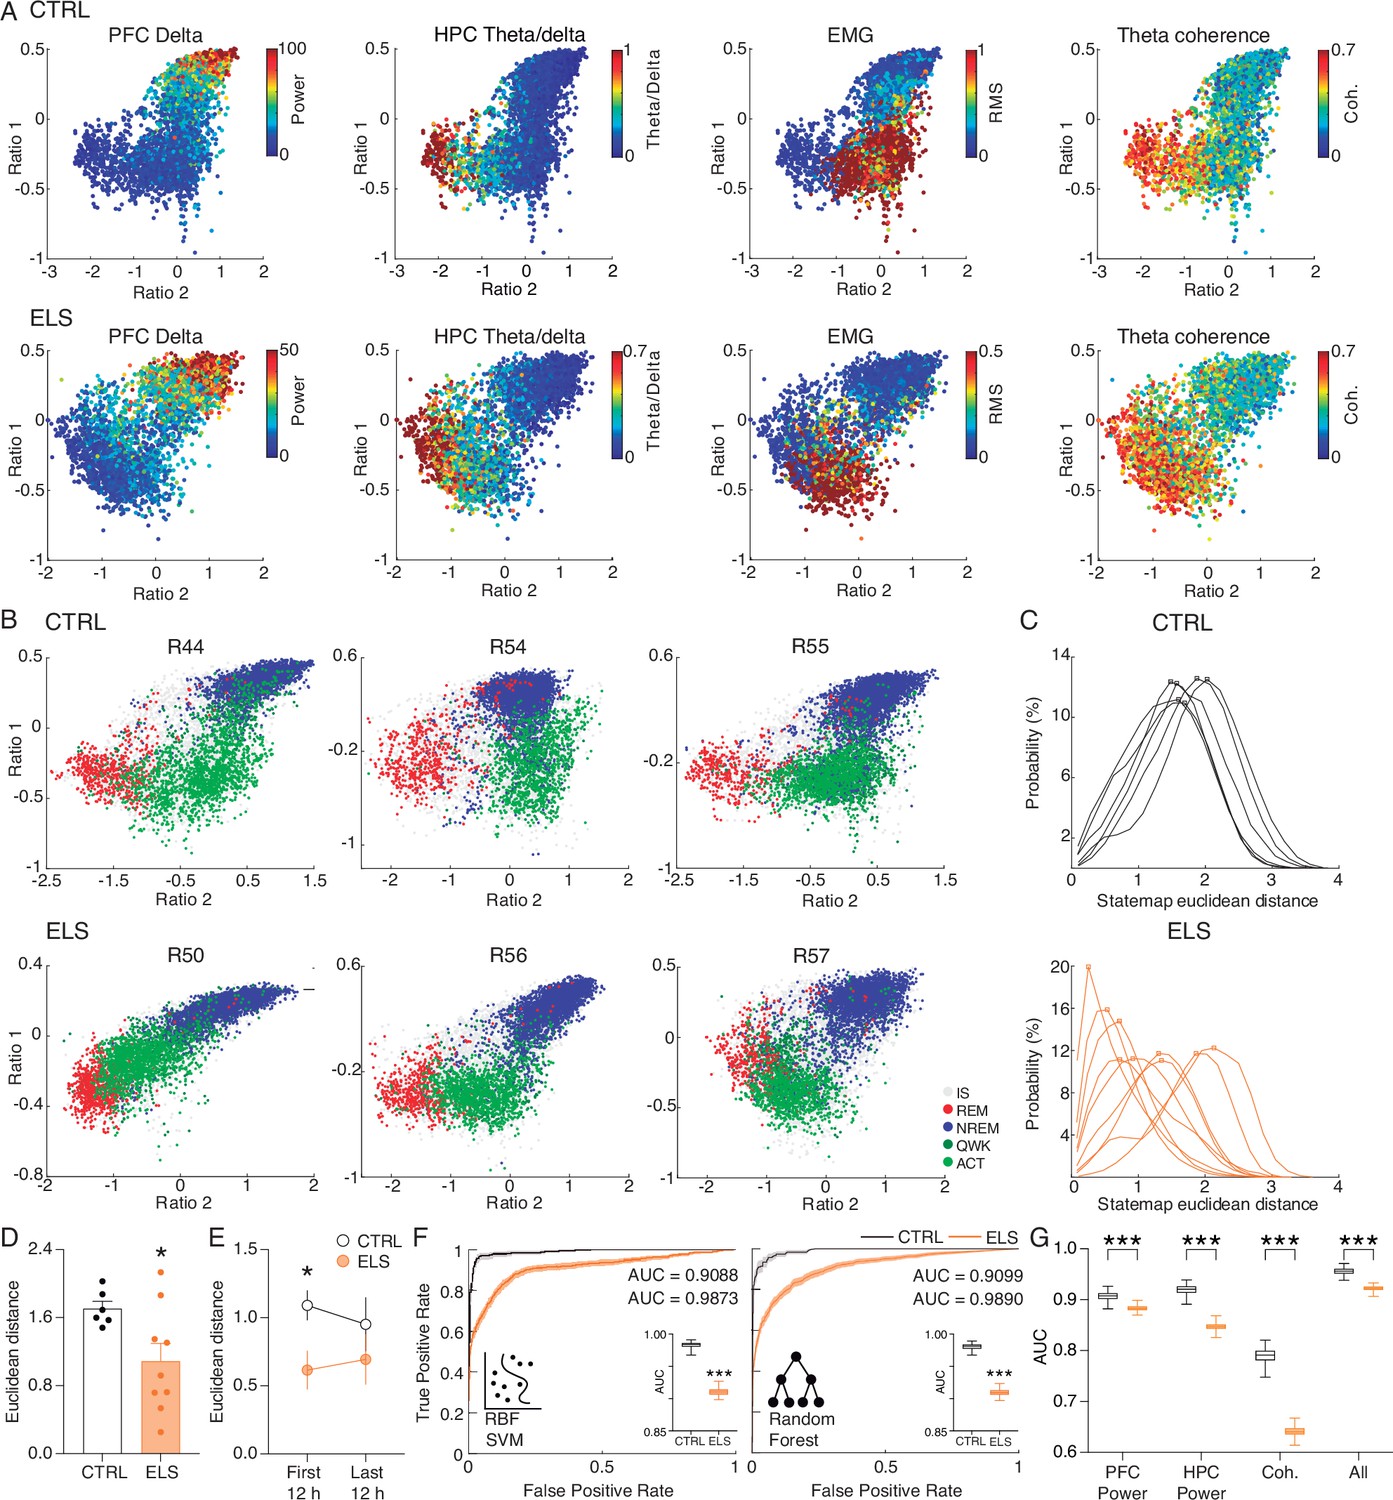
Early-life seizure (ELS) rats display rapid eye movement (REM)-like oscillatory dynamics during active behavior.
(A) State map construction reflects the sleep-wake cycle and spectral dynamics for one representative control (CTRL) (top) and ELS (bottom) rat. PFC delta power is evident during non-REM (NREM), theta/delta ratio is maximum in REM, electromyogram (EMG) power describes active wake (ACT) states, and hippocampus-prefrontal cortex (HPC-PFC) theta coherence is stronger close to REM. Note that in the ELS rat, the coherence is also broadly high during the ACT state. (B) Representative state maps from three CTRL (top) and three ELS (bottom) rats. CTRL rats displayed a clear separation between REM (red), ACT (light green), and NREM (blue) clusters. ELS displayed an overlap between REM and ACT states. (C) Distributions of the Euclidean distances between each REM and ACT epoch for CTRL (top) and ELS (bottom) rats. ELS distributions were heterogeneous, many of which were skewed to shorter distances. (D) Average Euclidean distance showing that ELS rats have REM-like oscillatory dynamics during active behavior (t-test). (E) REM-like oscillations during ACT were more pronounced in ELS during the initial 12 hr of recording (t-test). (F) Machine learning approach to decode REM versus ACT states. We used radial basis function support vector machine (SVM) and random forest (RF) algorithm in order to classify REM and ACT epochs in CTRL (black) or ELS (orange) rats. Using a bootstrapped confidence interval, we observed that the discriminative performance was worse in ELS animals, even when using ‘brute-force’ algorithms. (G) A machine learning algorithm (random forest) fitted on whole-spectrum data also shows a significantly worse performance in ELS for PFC power, HPC power, coherence, and all estimates combined (t-test). † p<0.1, *p<0.05, **p<0.01, ***p<0.001. CTRL n=6, and ELS n=9. Error bars represent the mean ± SEM.
Figure 11
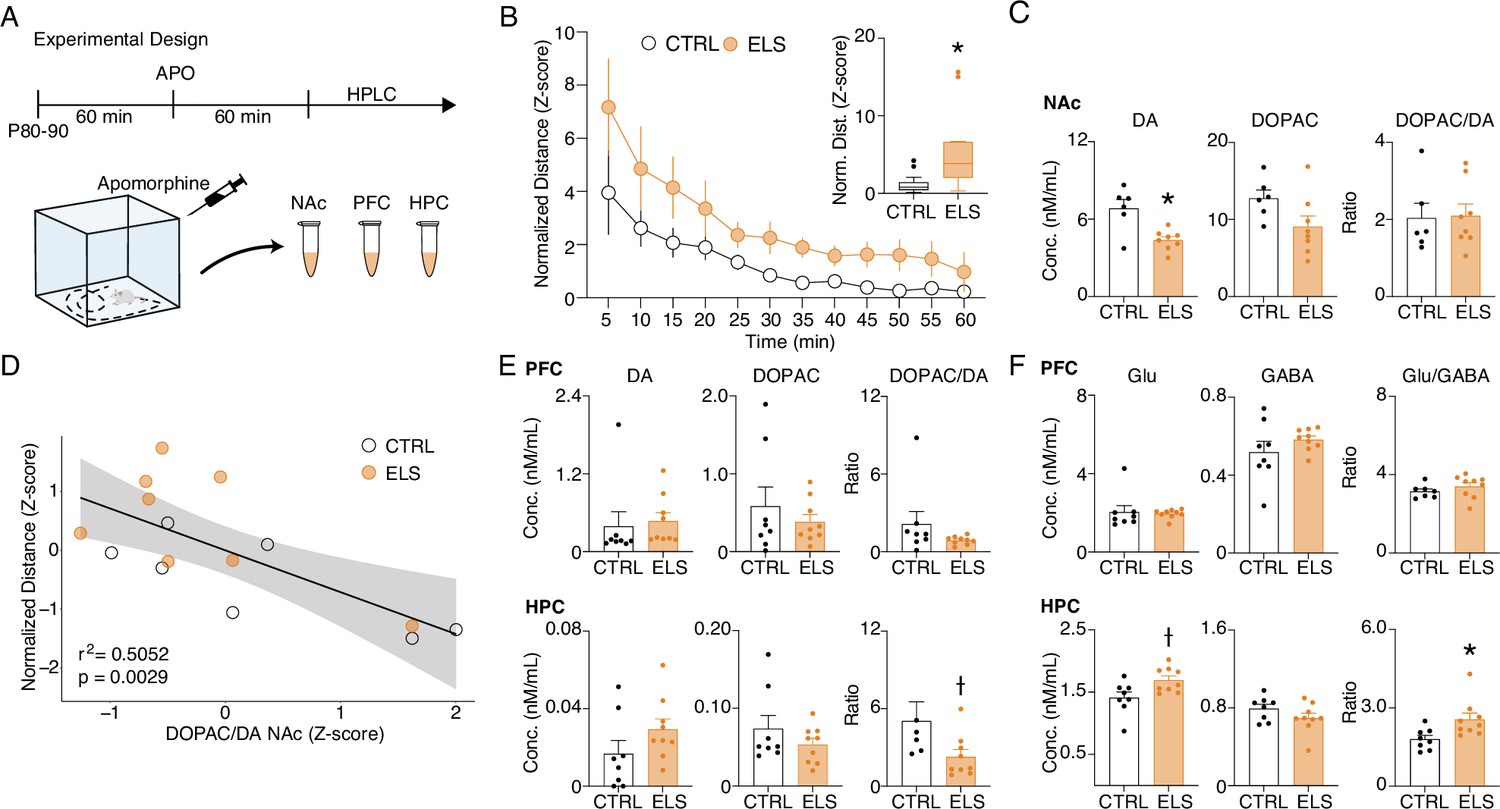
Early-life seizure (ELS) rats present behavioral and neurochemical sensitivity to dopaminergic activation.
(A) Experimental design representing quantification of locomotion in the open field, apomorphine (APO) injection, and neurochemical analysis. (B) Normalized locomotion across time blocks after APO injection, demonstrating increased locomotion of ELS rats induced by APO (Two-way RM ANOVA). Average normalized locomotion after APO injection (inset, Mann-Whitney). CTRL n=15, and ELS n=14. (C) Concentration of dopamine and metabolites in the NAc. (D) Generalized linear model (GLM) for the total distance after APO indicating 3,4-dihydroxyphenylacetic acid (DOPAC)/dopamine (DA) ratio in the nucleus accumbens (NAc) as a strong significant variable associated with behavioral sensitivity to APO. (E) Concentration of dopamine and metabolites (left) in the PFC (upper panel) and HPC (lower panel). Concentration of glutamate and gamma-aminobutyric acid (GABA) (right) in the PFC (upper panel) and HPC (lower panel), using Sidak’s multiple correction procedure for statistical comparison. CTRL n=8, and ELS n=9. †Uncorrected p<0.05, * multiple comparison corrected p<0.05. Error bars represent the mean ± SEM.
Figure 12
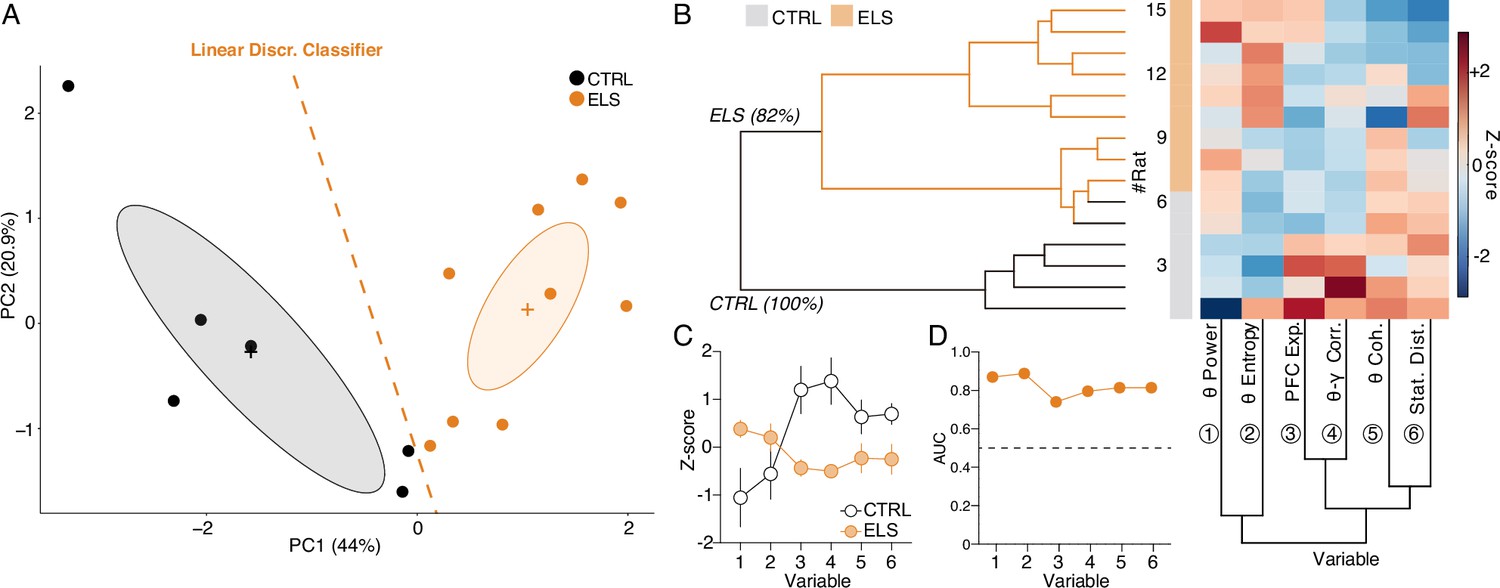
HPC and PFC oscillatory dynamics discriminate early-life seizure (ELS) rats.
(A) A linear discriminant classifier (dotted orange line) using the first two principal components (PCs) of relevant electrophysiological variables completely distinguishes ELS from control (CTRL) rats (100% accuracy; 93.34% leave-one-out cross-validation). Note that the PC1 alone completely discriminates ELS rats. (B) Unsupervised hierarchical clustering using the electrophysiological variables (bottom dendrogram) almost completely dissociates ELS from CTRL rats (left dendrogram). Inside the ELS cluster, we can observe one complete ELS branch, but the other overlapping with some CTRL animals, suggesting a graduality in the pathophysiological effects of ELS. (C) Z-score values of each variable, showing distinct patterns of activity for each group. (D) All the electrophysiological variables are good discriminators of CTRL and ELS rats (AUC-ROC >0.7). CTRL n=6, and ELS n=9. Error bars represent the mean ± SEM.
Additional files
Download links
A two-part list of links to download the article, or parts of the article, in various formats.
Downloads (link to download the article as PDF)
Open citations (links to open the citations from this article in various online reference manager services)
Cite this article (links to download the citations from this article in formats compatible with various reference manager tools)
Dysfunctional hippocampal-prefrontal network underlies a multidimensional neuropsychiatric phenotype following early-life seizure
eLife 12:RP90997.
https://doi.org/10.7554/eLife.90997.3


