Resistance exercise protects mice from protein-induced fat accretion
- Department of Medicine, University of Wisconsin-Madison, United States
- William S. Middleton Memorial Veterans Hospital, United States
- Nutrition and Metabolism Graduate Program, University of Wisconsin- Madison, United States
- Cellular and Molecular Biology Graduate Program, University of Wisconsin-Madison, United States
- Comparative Biomedical Sciences Graduate Program, University of Wisconsin-Madison, United States
- School of Veterinary Medicine, University of Wisconsin-Madison, United States
- University of Wisconsin Carbone Cancer Center, United States
Figures
Figure 1
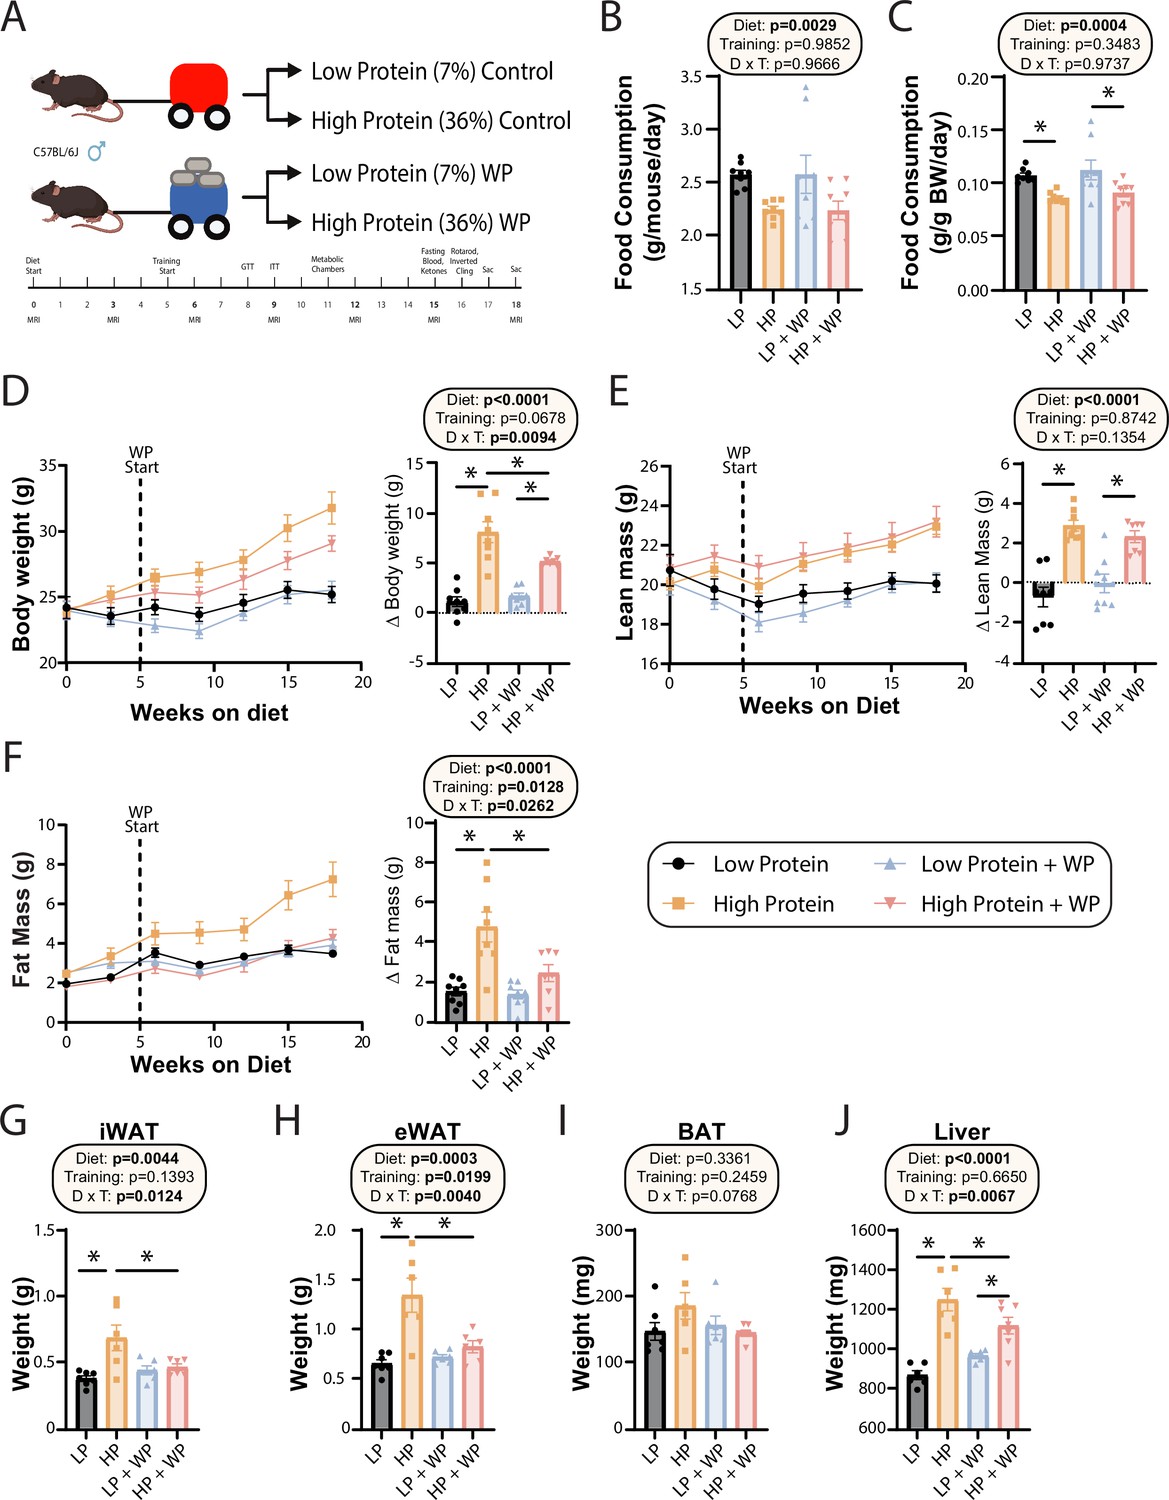
Weight pulling protects from high-protein diet-induced weight and fat gain.
(A) Experimental design. (B, C) Food consumption per mouse (B) or normalized to body weight (C) after ~6 wk on the indicated diets. n = 8/group. (D–F) Body weight (D), lean mass (E), and fat mass (F) over time, and change (Δ) from the beginning to end of study. n = 7–8 mice/group. (G–J) Weight of the inguinal white adipose tissue (iWAT) (G), epididymal white adipose tissue (eWAT) (H), brown adipose tissue (BAT) (I), and liver (J) at the conclusion of the study. n = 6–7 mice per group. (B–J) Statistics for the overall effects of diet, training, and the interaction represent the p-value from a two-way ANOVA; *p<0.05, Sidak’s post-test examining the effect of parameters identified as significant in the two-way ANOVA. Data represented as mean ± SEM.
-
Figure 1—source data 1
Weight pulling protects from high-protein diet-induced weight and fat gain.
- https://cdn.elifesciences.org/articles/91007/elife-91007-fig1-data1-v1.xlsx
Figure 2
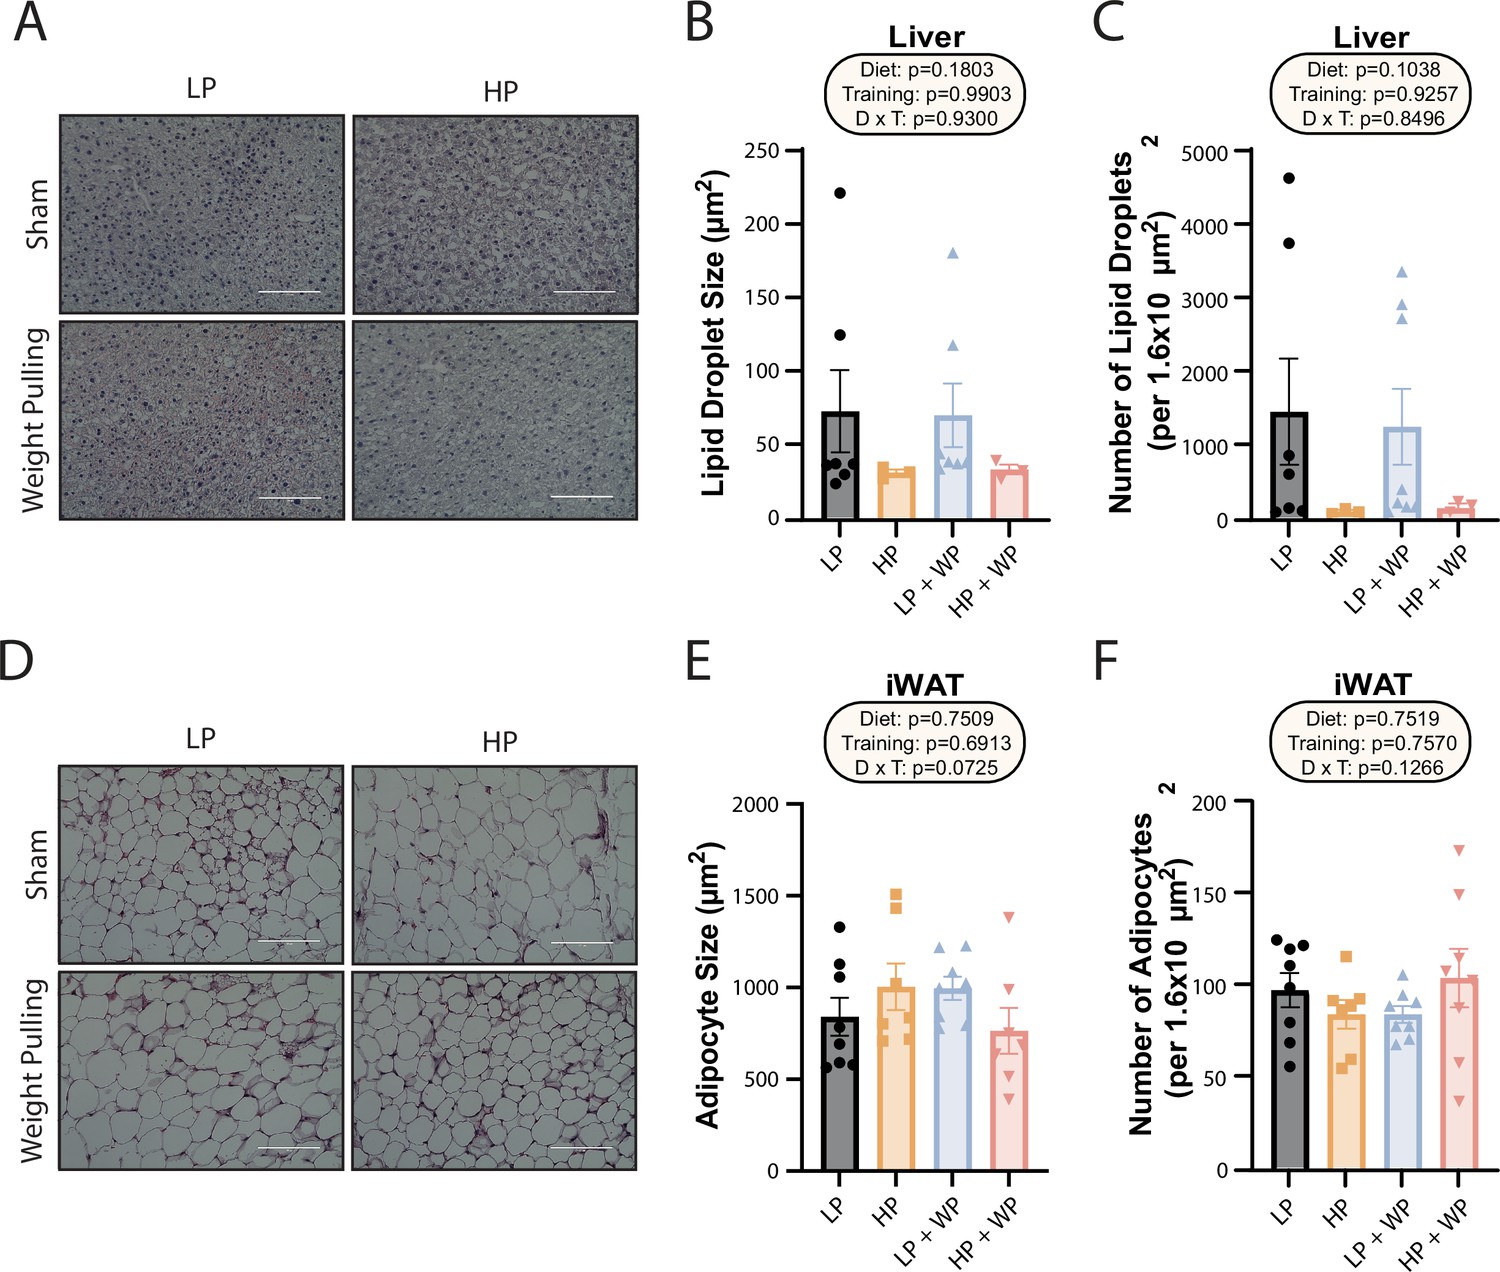
Dietary protein content and resistance training did not significantly impact liver lipid droplet or inguinal white adipocyte size.
(A–C) Representative Oil-Red-O-stained liver sections from mice in the indicated groups, with quantification of average lipid droplet size (B) and number (C). n = 3–7/group. (D–F) Representative H&E-stained inguinal white adipose tissue (iWAT) sections from mice in the indicated groups, with quantification of average lipid droplet size (E) and number (F). n = 7–8/group. (B–C, E–F) Statistics for the overall effects of diet, training, and the interaction represent the p-value from a two-way ANOVA; *p<0.05, Sidak’s post-test examining the effect of parameters identified as significant in the two-way ANOVA. Scale bar = 100 µM. Data represented as mean ± SEM.
-
Figure 2—source data 1
Dietary protein content and resistance training did not significantly impact liver lipid droplet or inguinal white adipocyte size.
- https://cdn.elifesciences.org/articles/91007/elife-91007-fig2-data1-v1.xlsx
Figure 3 with 1 supplement
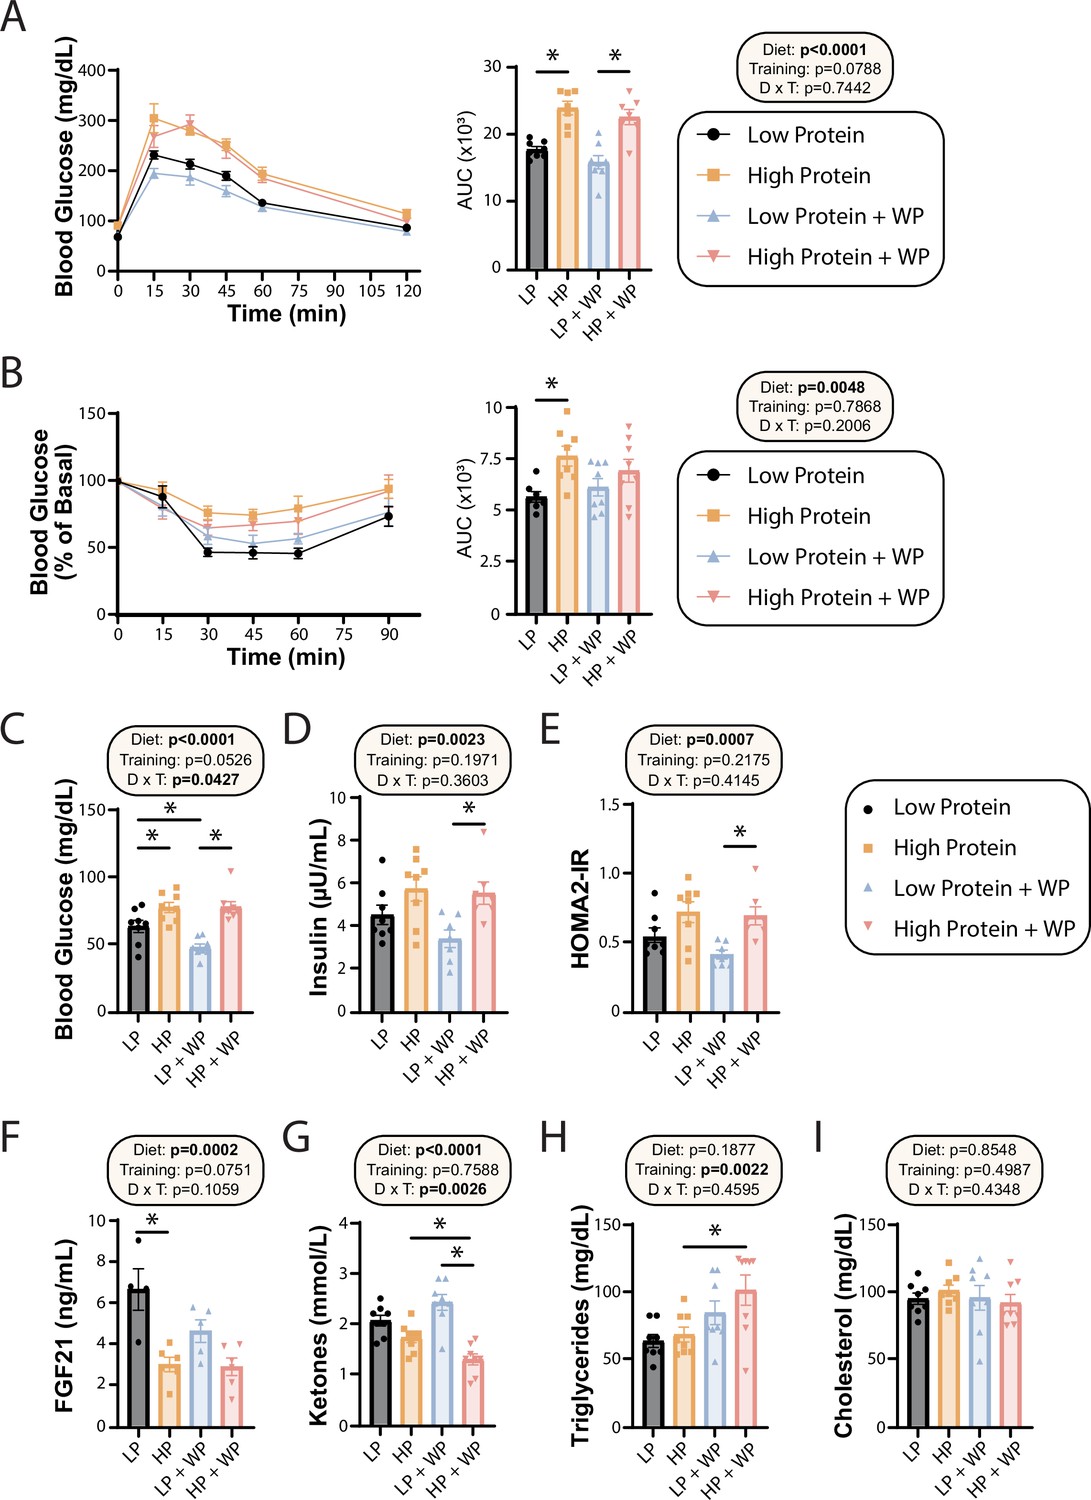
Effect of diet and exercise on glycemic control and blood metabolites.
(A, B) Glucose (A) and insulin (B) tolerance tests were performed after 9–10 wk on the diet, respectively, and area under the curve (AUC) was calculated. n = 7–8 mice/group. (C–E) Blood was collected from animals after a 16 hr overnight fast; fasting blood glucose (C) and insulin (D) were determined and used to calculate HOMA2-IR (E). n = 7–8 mice/group. (F–I) Blood was collected from animals after a 16 hr overnight fast after 16 wk on the diets. Fasting FGF21 (F), ketones (G), triglycerides (H), and cholesterol (I) were determined. n = 4–8 mice/group. (A–I) Statistics for the overall effects of diet, training, and the interaction represent the p-value from a two-way ANOVA, *p<0.05, Sidak’s post-test examining the effect of parameters identified as significant in the two-way ANOVA. Data represented as mean ± SEM.
-
Figure 3—source data 1
Effect of diet and exercise on glycemic control and blood metabolites.
- https://cdn.elifesciences.org/articles/91007/elife-91007-fig3-data1-v1.xlsx
Figure 3—figure supplement 1
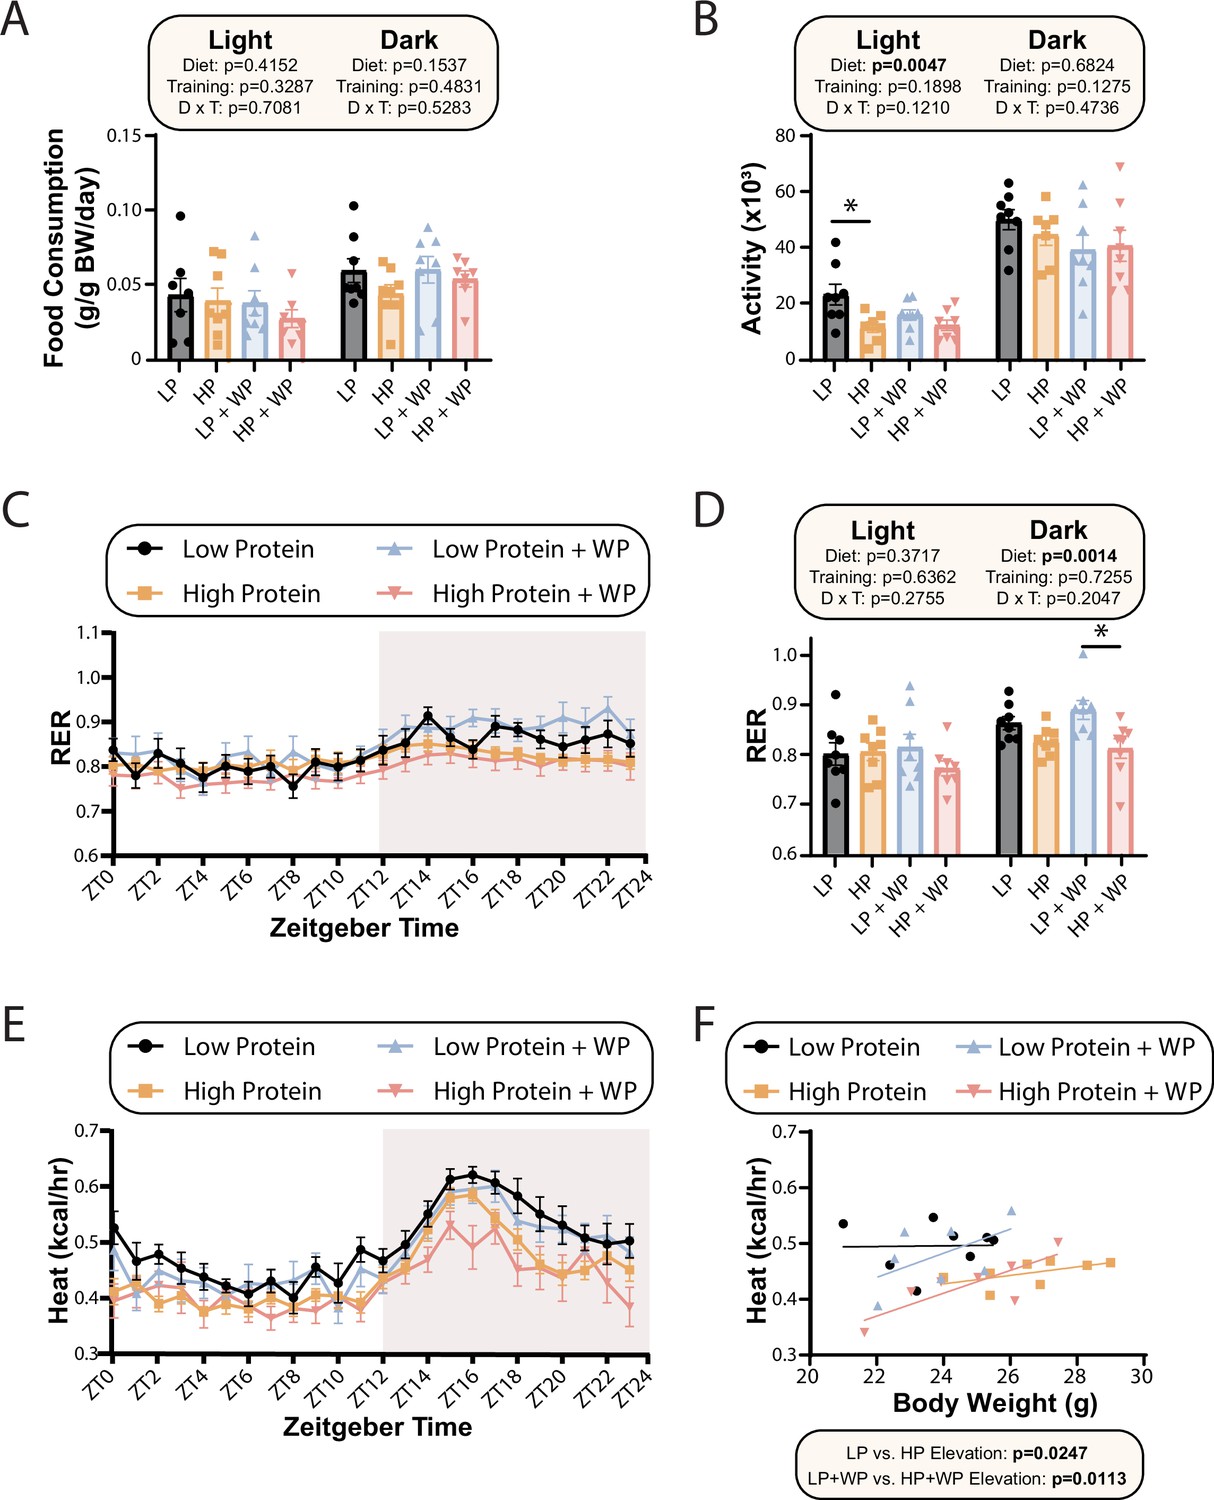
Low-protein-fed animals have increased energy expenditure (EE) regardless of training regimen.
(A–F) Metabolic chambers were used to examine metabolic parameters after mice were fed the indicated diets for 8–9 wk. These included food consumption (A), spontaneous activity (B), respiratory exchange ratio (RER) (C, D), and EE (E) over a 24 hr period. (F) EE as a function of body weight was calculated (data for each individual mouse are plotted, and slopes and intercepts were calculated using ANCOVA). n = 7–8 mice/group. (A, B, D) Statistics for the overall effects of diet, training, and the interaction represent the p-value from a two-way ANOVA conducted separately for the light and dark cycles; *p<0.05 from a Sidak’s post-test examining the effect of parameters identified as significant in the two-way ANOVA. Data represented as mean ± SEM.
-
Figure 3—figure supplement 1—source data 1
Low-protein-fed animals have increased energy expenditure regardless of training regimen.
- https://cdn.elifesciences.org/articles/91007/elife-91007-fig3-figsupp1-data1-v1.xlsx
Figure 4
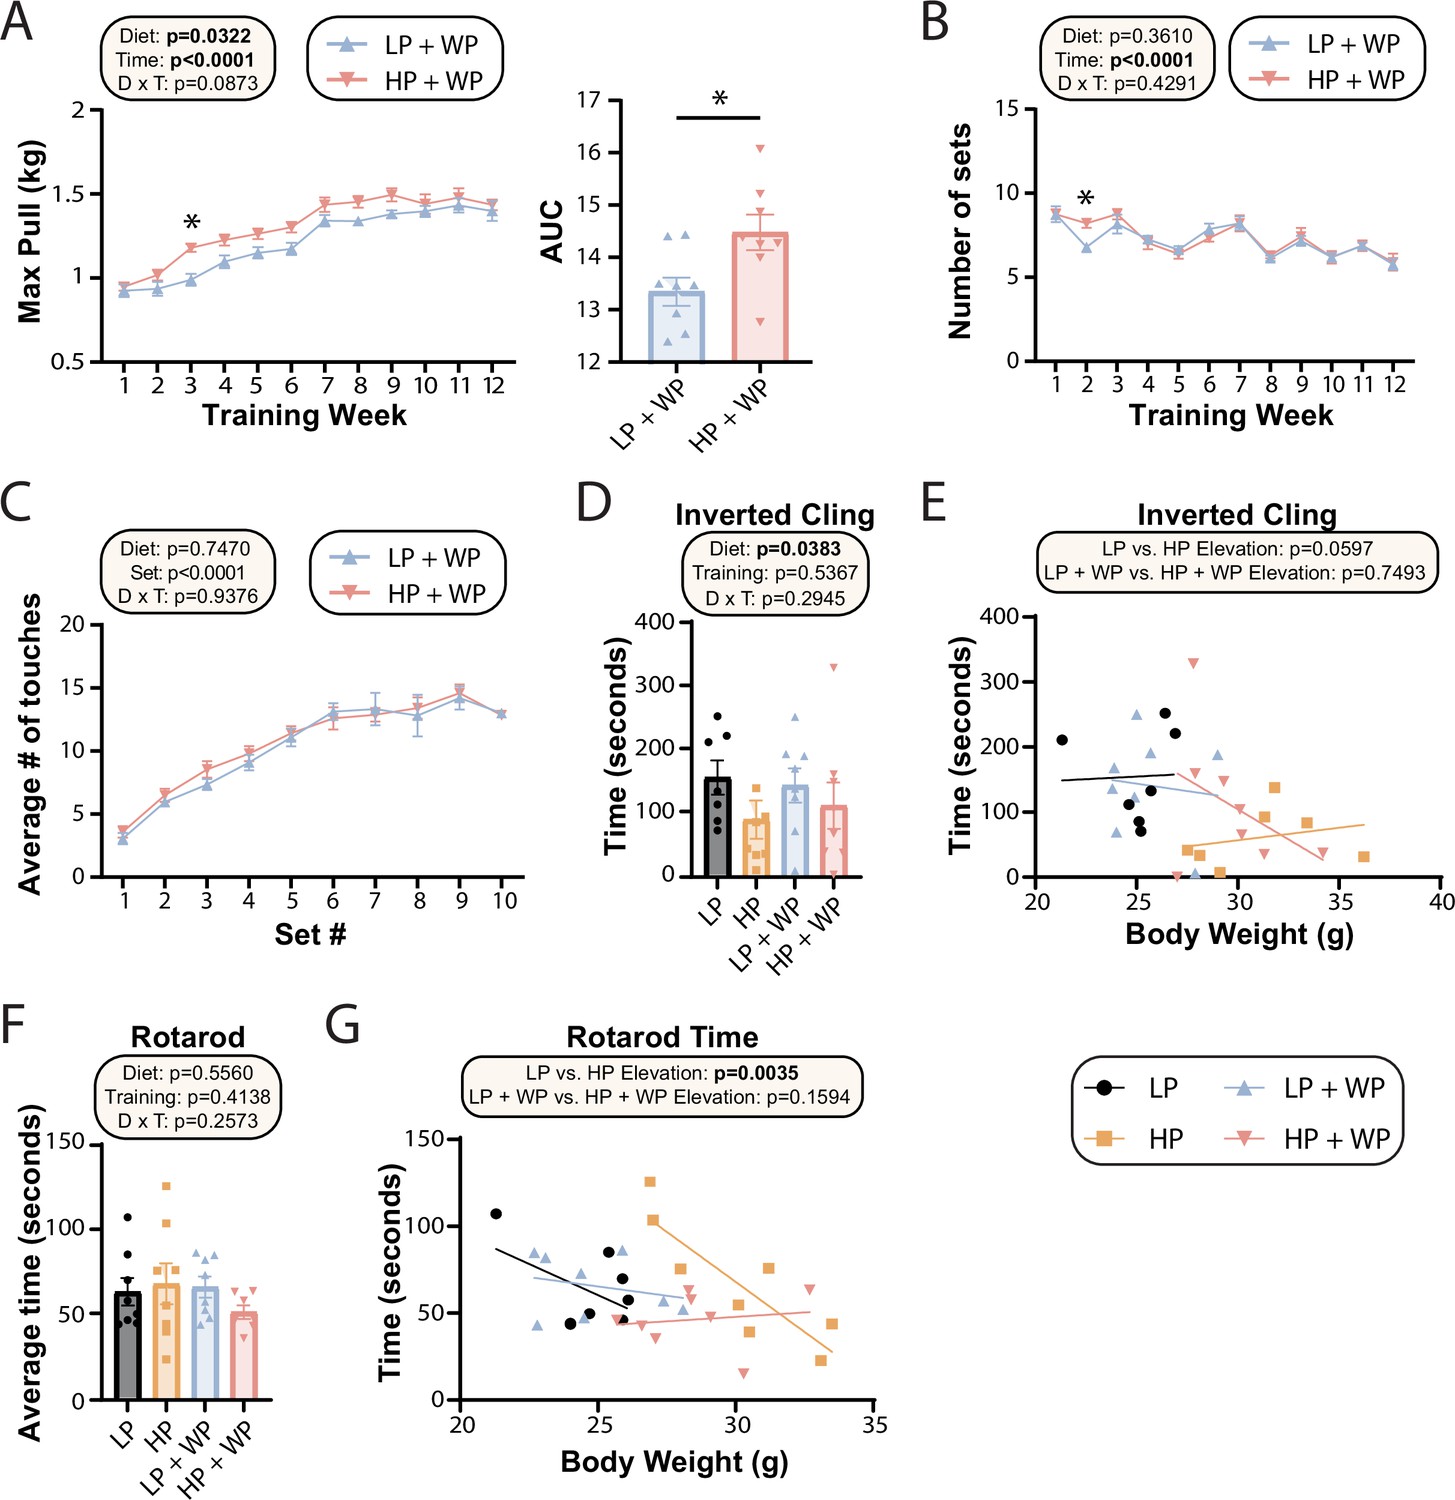
Strength and muscle growth is maximized by high protein and progressive resistance exercise.
(A–C) Weight pulling was performed three times per week for 12 wk. The average maximum weight pulled each week with area under the curve (AUC) (A) and the number of sets achieved (B) is shown. Similarly, the number of stimulatory touches (C) by the investigator on all mice was averaged through multiple weeks of training and plotted per set. (A–C) n = 8 mice/group (A, B); for (C) values for eight mice/group were assayed over n = 5 wk. Statistics for the overall effects of diet, time or set, and the interaction represent the p-value from a two-way repeated measures (RM) ANOVA or restricted maximum likelihood (REML); *p<0.05 from a Sidak’s post-test examining the effect of parameters identified as significant in the 2two-way ANOVA. (D–G) Physical performance was assessed by an inverted cling test (D–, E) or rotarod test (F, G). (E, G) Cling time (E) or rotarod time (G) as a function of body weight was calculated (data for each individual mouse are plotted, and slopes and intercepts were calculated using ANCOVA). n = 7–8 mice/group. Statistics for the overall effects of diet, training, and the interaction represent the p-value from a two-way ANOVA, *p<0.05, Sidak’s post-test examining the effect of parameters identified as significant in the two-way ANOVA. Data represented as mean ± SEM.
-
Figure 4—source data 1
Strength and muscle growth is maximized by high protein and progressive resistance exercise.
- https://cdn.elifesciences.org/articles/91007/elife-91007-fig4-data1-v1.xlsx
Figure 5 with 1 supplement
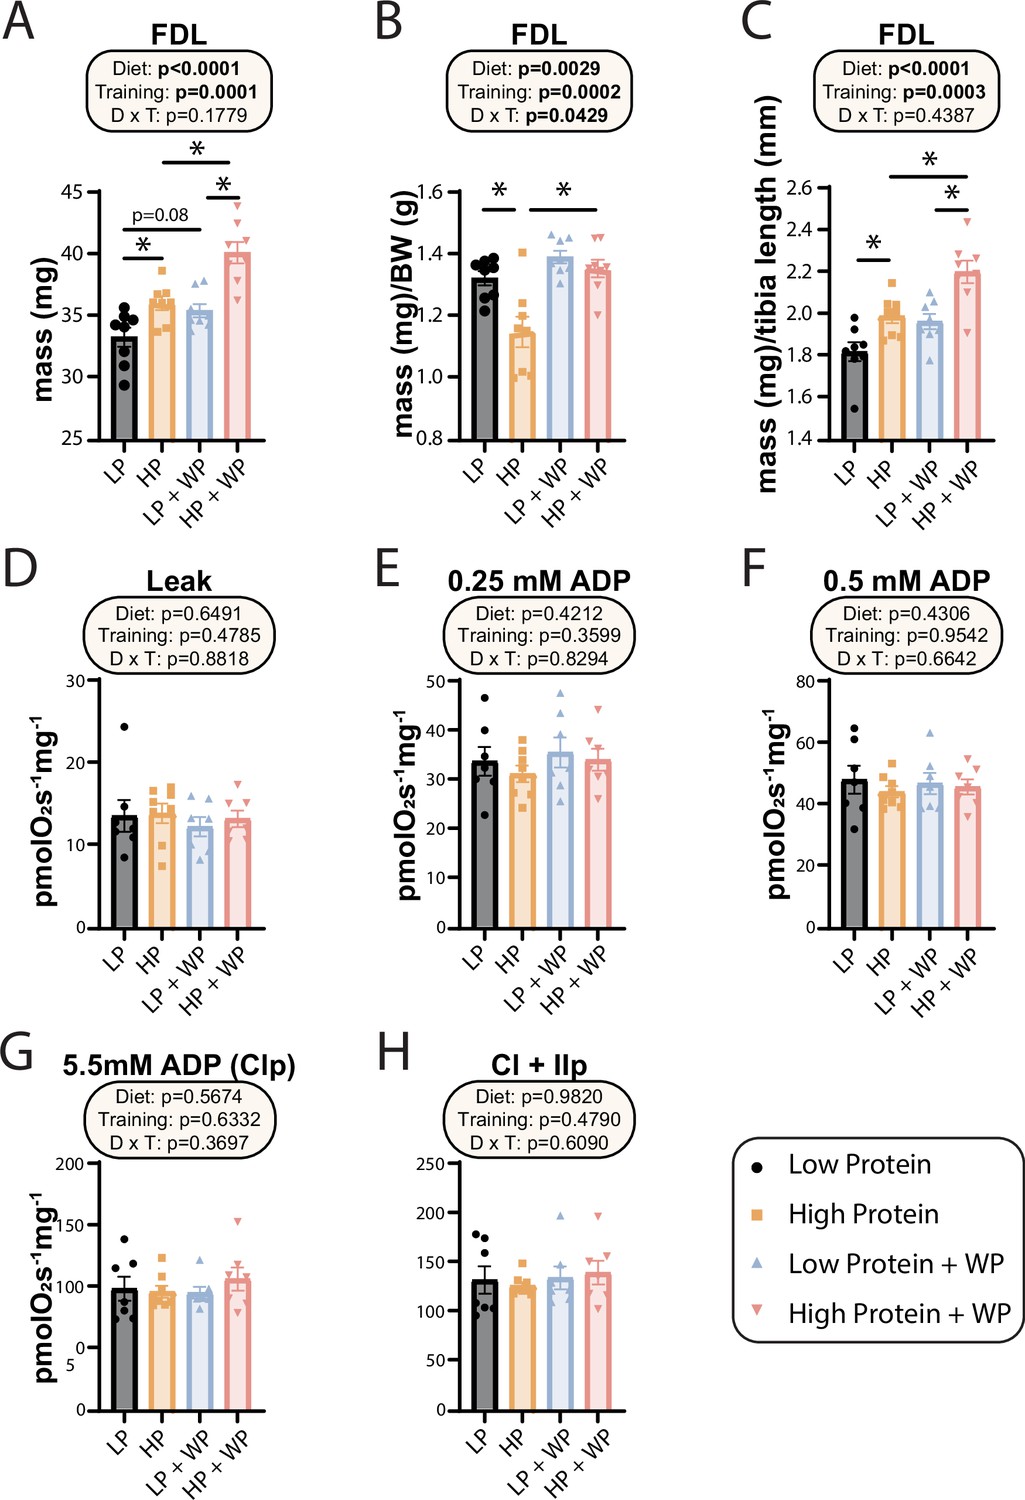
Weight pulling and high-protein diet increased flexor digitorum longus (FDL) mass but not mitochondrial respiration.
(A–C) The muscle mass of the FDL in absolute mass (A), normalized to body weight (B), and (C) normalized to tibia length. n = 8/group. (D–H) Mitochondrial respiration parameters as measured in the FDL, including mitochondrial leak (D), and following addition of 0.25 mM (E), 0.5 mM (F), and 5.5 mM ADP (G). (H) 10 mM succinate was provided to evaluate complex I and II-driven respiration. n = 7–8 mice/group. (A–H) Statistics for the overall effects of diet, training, and the interaction represent the p-value from a two-way ANOVA, *p<0.05, Sidak’s post-test examining the effect of parameters identified as significant in the two-way ANOVA. Data represented as mean ± SEM.
-
Figure 5—source data 1
Weight pulling and high-protein diet increased flexor digitorum longus (FDL) mass but not mitochondrial respiration.
- https://cdn.elifesciences.org/articles/91007/elife-91007-fig5-data1-v1.xlsx
Figure 5—figure supplement 1
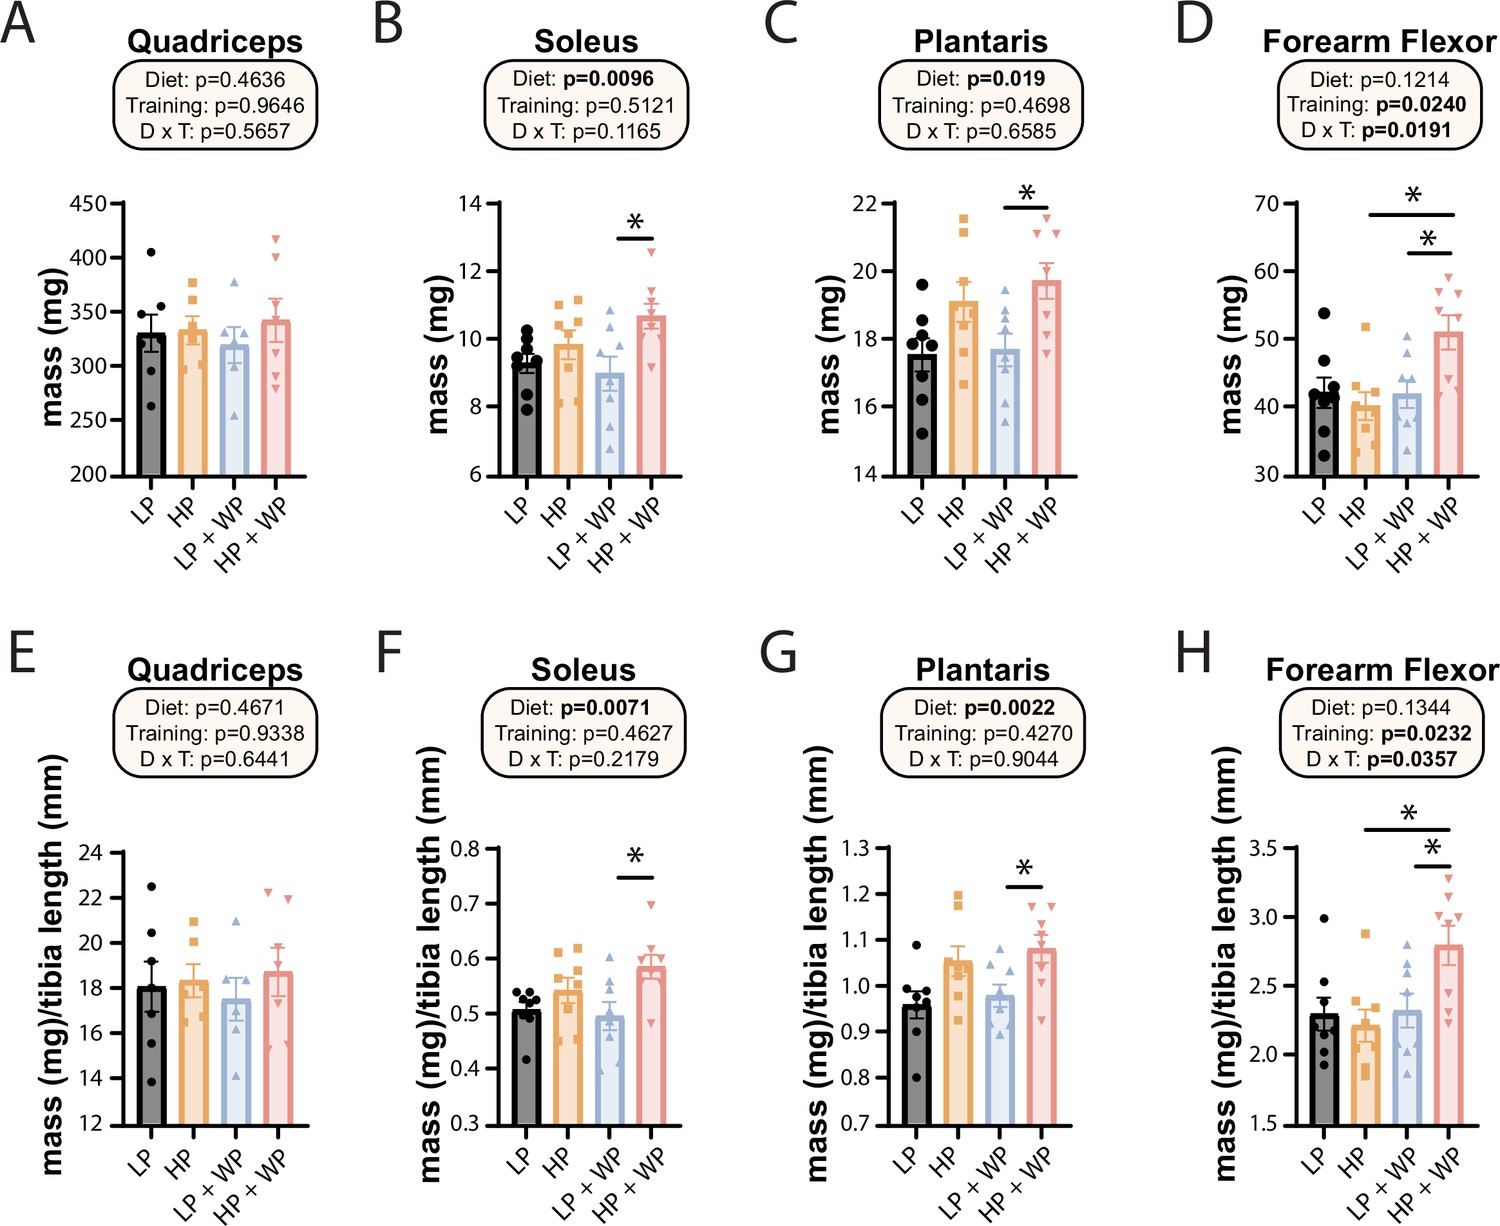
Weight pulling and high-protein diet increase the mass of specific muscles.
(A–H) The mass of muscles was measured in absolute terms (A–D) and normalized to tibia length (E–H). The muscles measured were the quadriceps (A, E), soleus (B, F), plantaris (C, G), and forearm flexor complex (D, H). n = 6–8 mice/group. Statistics for the overall effects of diet, training, and the interaction represent the p-value from a two-way ANOVA, *p<0.05, Sidak’s post-test examining the effect of parameters identified as significant in the two-way ANOVA. Data represented as mean ± SEM.
-
Figure 5—figure supplement 1—source data 1
Weight pulling and high-protein diet increase the mass of specific muscles.
- https://cdn.elifesciences.org/articles/91007/elife-91007-fig5-figsupp1-data1-v1.xlsx
Figure 6
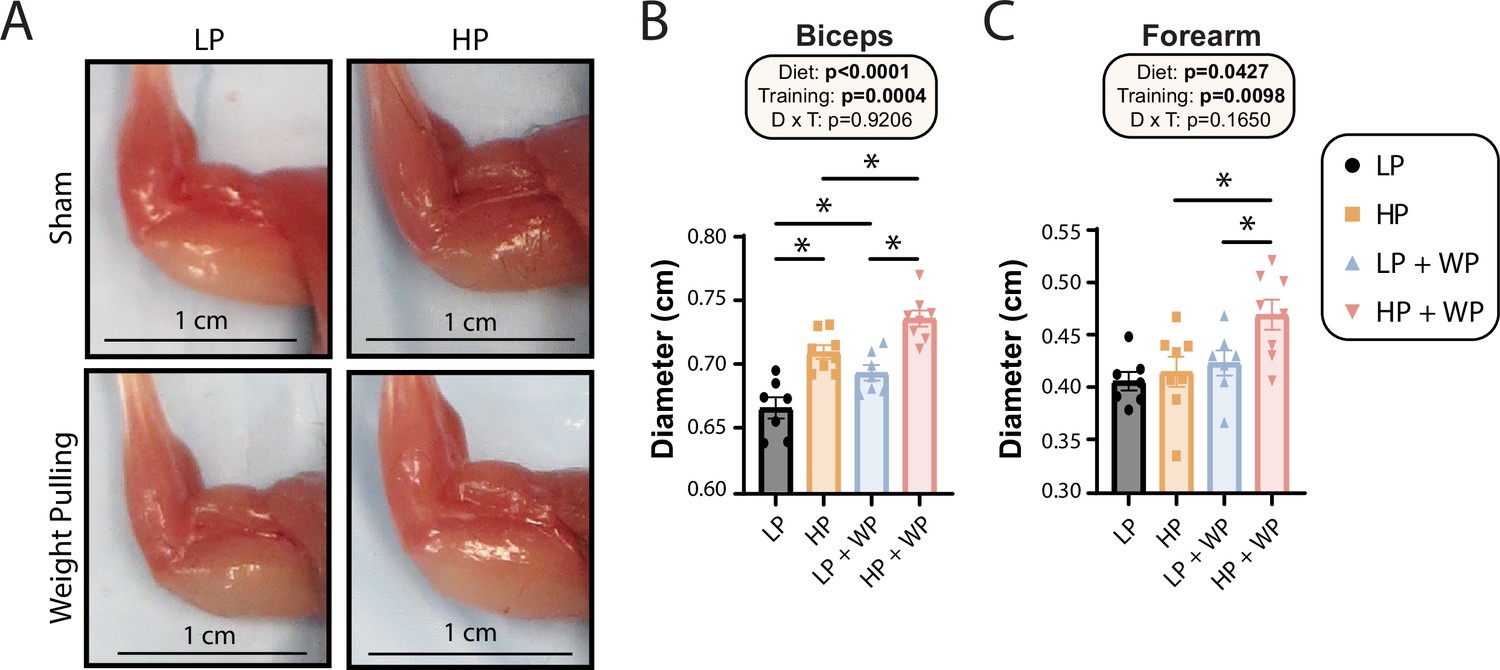
Bicep and forearm hypertrophy is maximized by high-protein (HP) diets and weight pulling (WP).
(A–C) Representative images of arm musculature (A) with quantification of biceps (B) and forearm (C) diameter. (B, C) n = 7–8 mice per group. Statistics for the overall effects of diet, training, and the interaction represent the p-value from a two-way ANOVA, *p<0.05, Sidak’s post-test examining the effect of parameters identified as significant in the two-way ANOVA. Data represented as mean ± SEM.
-
Figure 6—source data 1
Bicep and forearm hypertrophy is maximized by high-protein (HP) diets and weight pulling (WP).
- https://cdn.elifesciences.org/articles/91007/elife-91007-fig6-data1-v1.xlsx
Figure 7
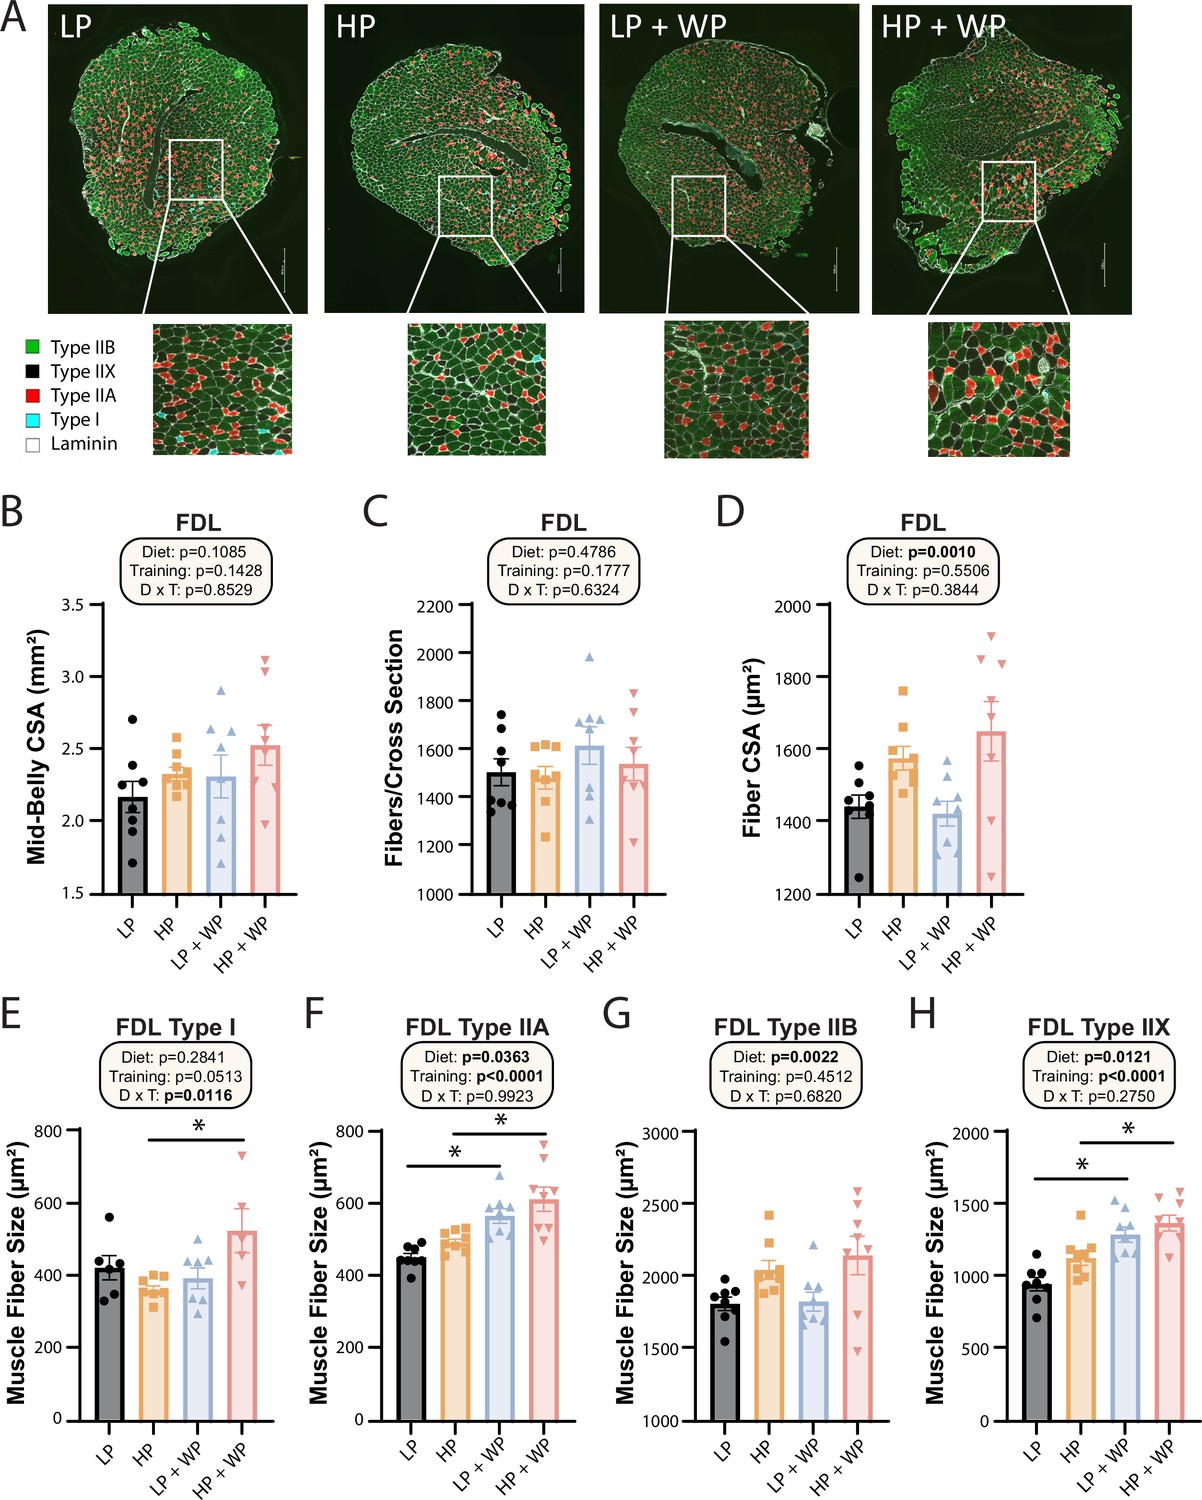
Flexor digitorum longus (FDL) fiber-type hypertrophy is maximized by high-protein diets and weight pulling.
(A–H) Representative images of the FDL and fiber type with quantification of mid-belly cross-sectional area (CSA) (B), fibers per cross section (C), fiber CSA (D), and individual muscle fiber type size: type I (E), type IIA (F), type IIB (G), and type IIX (H).n = 5–8 mice per group. Statistics for the overall effects of diet, training, and the interaction represent the p-value from a two-way ANOVA, *p<0.05, Sidak’s post-test examining the effect of parameters identified as significant in the two-way ANOVA. Data represented as mean ± SEM.
-
Figure 7—source data 1
Flexor digitorum longus (FDL) fiber-type hypertrophy is maximized by high-protein diets and weight pulling.
- https://cdn.elifesciences.org/articles/91007/elife-91007-fig7-data1-v1.xlsx
Tables
Table 1
Diet composition.
| Amino acid-defined diets | Low protein | High protein |
|---|---|---|
| Teklad diet name | 7% protein calories | 36% protein calories |
| Teklad diet number | TD.140712 | TD.220097 |
| Color | Blue | Green |
| Formula | g/kg | g/kg |
| Sucrose | 291.248 | 214.867 |
| Corn starch | 232.4 | 110.7 |
| Maltodextrin | 232.4 | 110.7 |
| Corn oil | 52.0 | 52.0 |
| Olive oil | 29.0 | 29.0 |
| Cellulose | 30.0 | 30.0 |
| Mineral mix, AIN-93G-MX (94046) | 35.0 | 35.0 |
| Calcium phosphate, dibasic | 8.2 | 8.2 |
| Vitamin mix, Teklad (40060) | 10.0 | 10.0 |
| % kcal from | ||
| Protein | 7.1 | 36.4 |
| Carbohydrate | 74.4 | 44.7 |
| Fat | 18.5 | 18.9 |
| kcal/g | 3.9 | 3.9 |
| Amino acid profile | g/kg | g/kg |
| l-Lysine HCl | 6.64 | 33.308 |
| l-Methionine | 2.18 | 10.95 |
| l-Cystine | 2.34 | 11.767 |
| l-Arginine | 2.05 | 10.296 |
| l-Phenylalanine | 2.15 | 10.787 |
| l-Tyrosine | 2.25 | 11.277 |
| l-Histidine HCl, monohydrate | 1.15 | 7.518 |
| l-Isoleucine | 2.54 | 12.748 |
| l-Leucine | 8.27 | 41.512 |
| l-Threonine | 3.16 | 15.853 |
| l-Tryptophan | 1.1 | 5.557 |
| l-Valine | 2.735 | 13.729 |
| l-Aspartic acid | 6.7 | 33.634 |
| l-Glutamic acid | 9.43 | 47.347 |
| l-Alanine | 3.05 | 15.33 |
| Glycine | 0.96 | 4.838 |
| l-Proline | 2.41 | 12.111 |
| l-Serine | 2.41 | 12.111 |
Key resources table
| Reagent type (species) or resource | Designation | Source or reference | Identifiers | Additional information |
|---|---|---|---|---|
| Strain, strain background (Mus musculus), male | C57BL/6J | The Jackson Laboratory | Cat# JAX:000664; RRID:IMSR_JAX:000664 | |
| Antibody | Anti-laminin | Millipore Sigma | #L9393 | 1:500 |
| Antibody | Myosin heavy chain type I | Developmental Studies Hybridoma Bank | #BA-D5-s | 1:100 |
| Antibody | Myosin heavy chain type IIA | Developmental Studies Hybridoma Bank | #SC-71-s | 1:100 |
| Antibody | Myosin heavy chain type IIB | Developmental Studies Hybridoma Bank | #BF-F3-s | 1:10 |
| Antibody | Rabbit IgG (H+L) Cross-Adsorbed Secondary Antibody in ICC/IF | Invitrogen | #A11011 | 1:5000 |
| Antibody | Alexa Fluor 647 AffiniPure Goat Anti-Mouse IgG, Fcγ subclass 2b specific | Jackson ImmunoResearch | #115-605-207 | 1:100 |
| Antibody | Alexa Fluor 488 AffiniPure Goat Anti-Mouse IgG, Fcγ subclass 1 specific | Jackson ImmunoResearch | #115-545-205 | 1:3000 |
| Antibody | Goat anti-Mouse IgM (Heavy chain) Cross-Adsorbed Secondary Antibody, Alexa Fluor 350 | Invitrogen | #A-31552 | 1:500 |
| Antibody | ProLong Gold Antifade Mountant | Invitrogen | #P36930 | |
| Commercial assay or kit | Mouse/Rat FGF21 ELISA | R&D Systems | #MF2100 | |
| Commercial assay or kit | Mouse insulin ELISA | Crystal Chem | #90080 | |
| Commercial assay or kit | Cholesterol | Pointe Scientific | #23-666-200, #23-666-202, #23-666-201 | |
| Commercial assay or kit | Triglycerides | Pointe Scientific | #23-666-411, #23-666-410, #23-666-412 |
Additional files
Download links
A two-part list of links to download the article, or parts of the article, in various formats.
Downloads (link to download the article as PDF)
Open citations (links to open the citations from this article in various online reference manager services)
Cite this article (links to download the citations from this article in formats compatible with various reference manager tools)
Resistance exercise protects mice from protein-induced fat accretion
eLife 12:RP91007.
https://doi.org/10.7554/eLife.91007.3


