Causal role of the angular gyrus in insight-driven memory reconfiguration
- Department of Cognitive Psychology, Institute of Psychology, Universität Hamburg, Germany
- Radboud University, Donders Institute for Brain, Cognition and Behaviour, Netherlands
- Kavli Institute for Systems Neuroscience, Centre for Neural Computation, The Egil and Pauline Braathen and Fred Kavli Centre for Cortical Microcircuits, Jebsen Centre for Alzheimer’s Disease, Norwegian University of Science and Technology, Norway
- Max-Planck-Insitute for Human Cognitive and Brain Sciences, Germany
- Wilhelm Wundt Institute of Psychology, Leipzig University, Germany
Figures
Figure 1
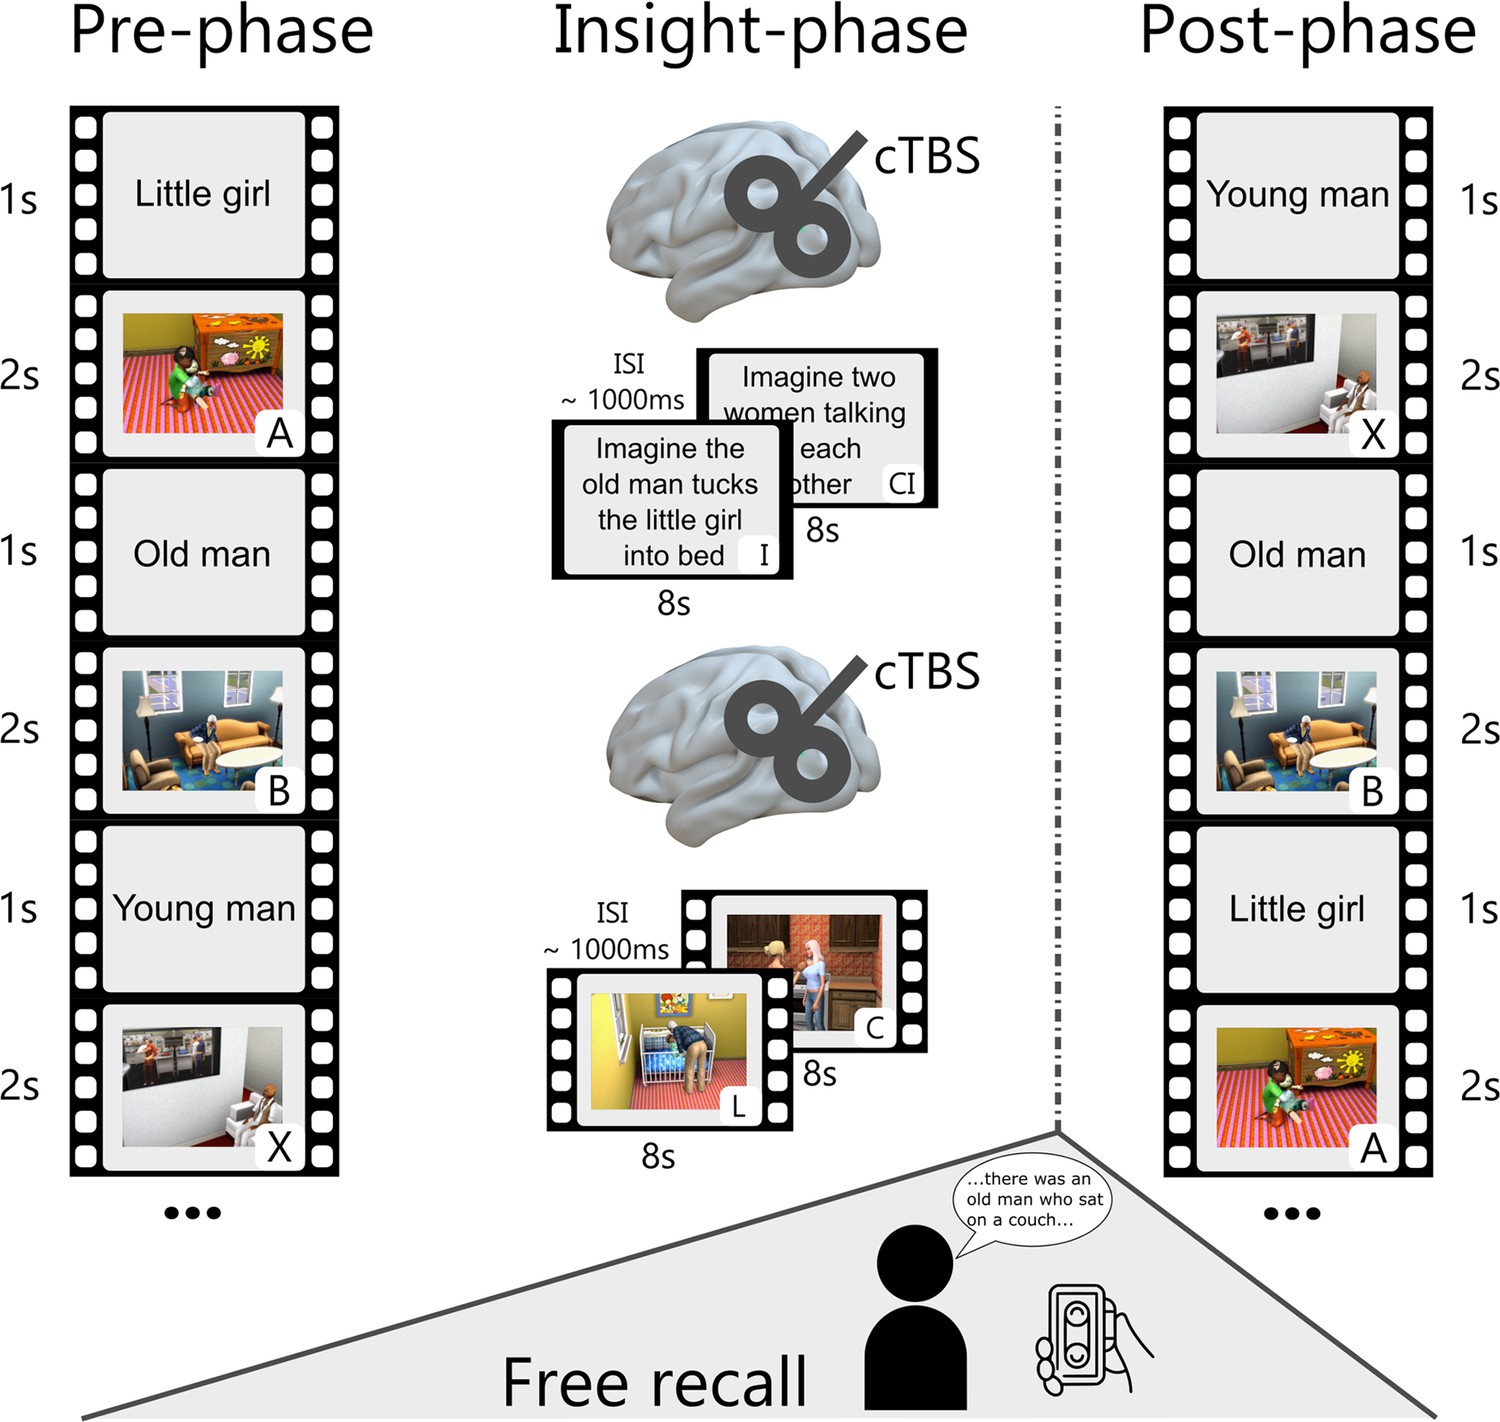
Modified narrative-insight task and procedure.
During the pre-phase, participants viewed video events (A, B, and X) from 10 different storylines. Each event was preceded by a title (1 s) and repeated 18 times. The inter-stimulus interval (ISI) was ~1000ms. The subsequent insight-phase consisted of two parts. In one part, participants gained insight through a written imagination instruction (I) interspersed with a control instruction (CI). In the other part, they gained insight through a linking video (L) interspersed with a control video (C). The order of gaining insight through imagination or video observation was counterbalanced across participants. Before each insight part, participants received, depending on the experimental group, either a sham or cTBS stimulation over the left angular gyrus (MNI: −48,–67, 30). After the insight-phase, participants had a 30-min break and then completed a free recall for a maximum of 20 min in a different room. In the post-phase, all video events were presented in the same manner as the pre-phase.
Figure 2 with 3 supplements
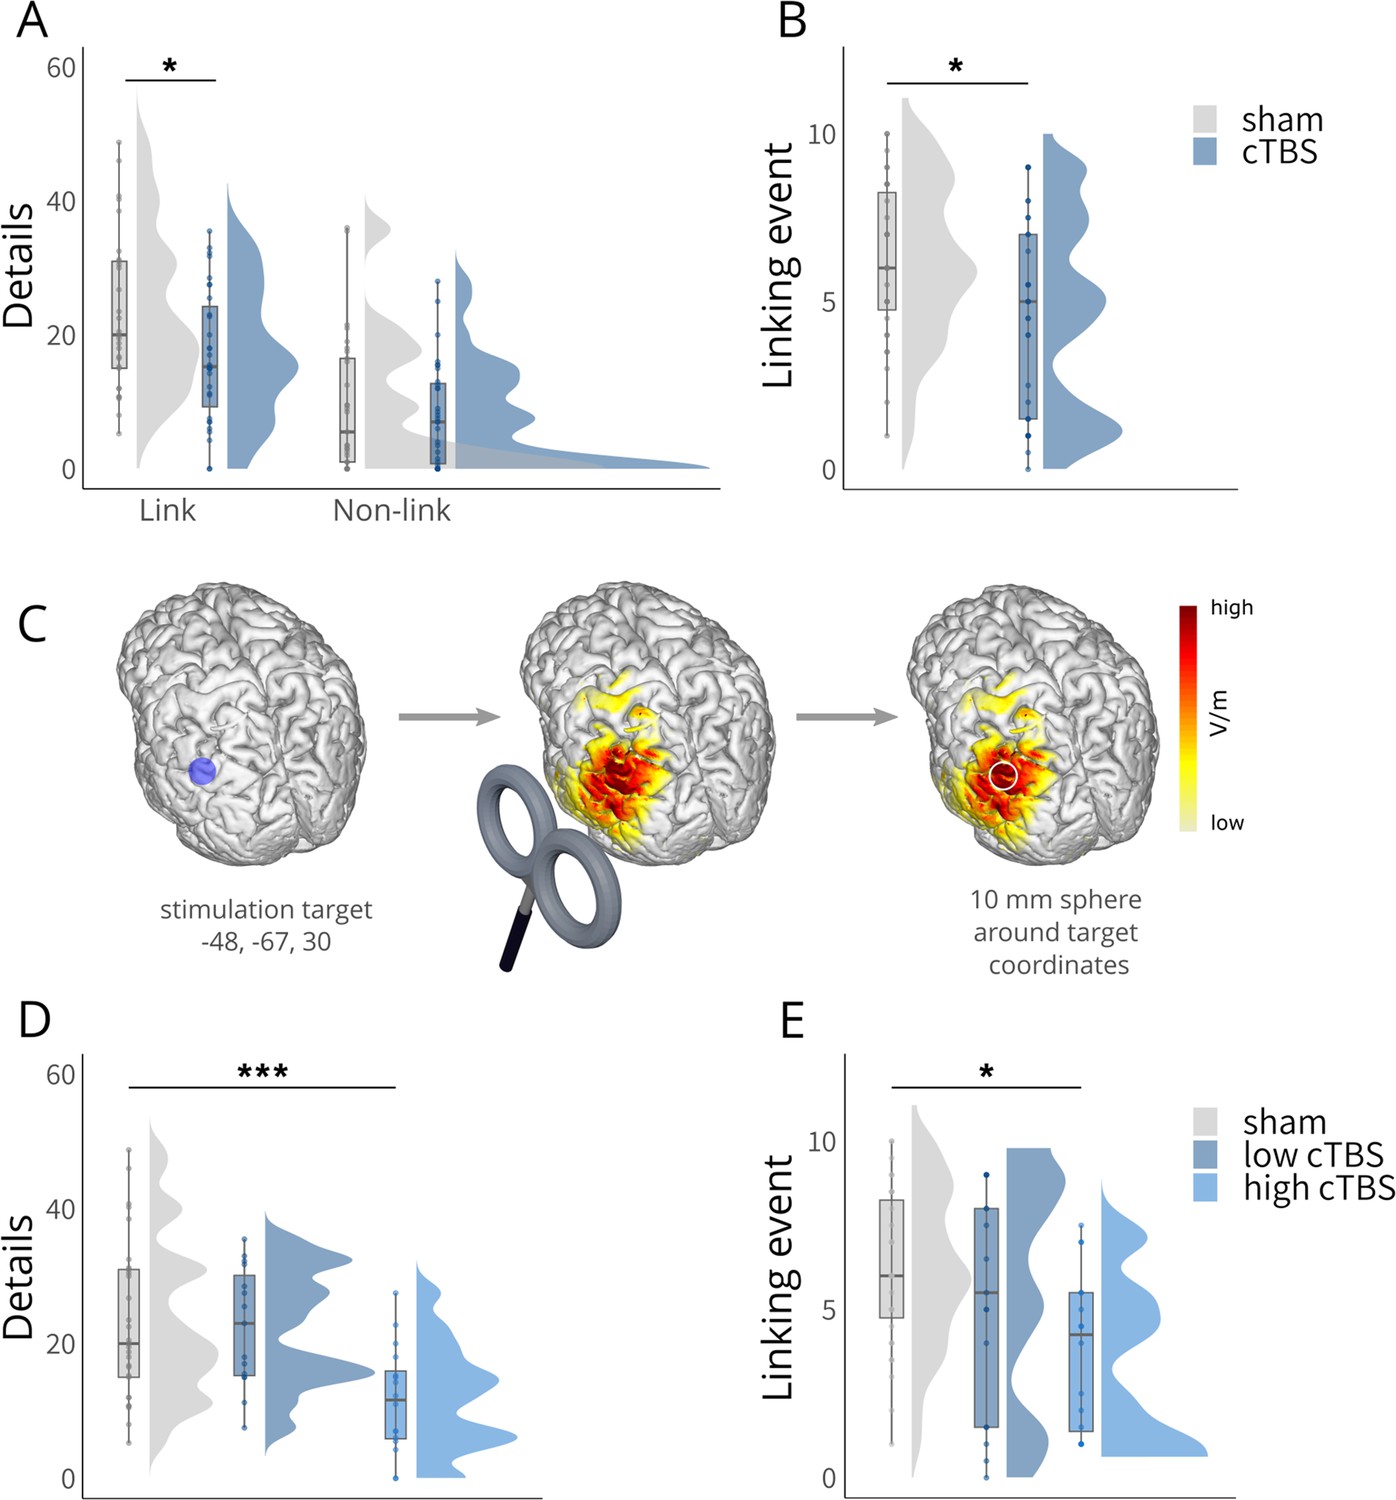
Behavioral results.
(A) Significantly reduced recall of details for linked events in the cTBS group compared to the sham group, with no significant difference for the non-linked events. (B) Significantly reduced recall of the linking events in the cTBS group compared to the sham group. (C) Schematic overview of electric field modeling: Simulation was performed for the angular gyrus coordinate (MNI: x = –48, y = –67, z = 30) using a Magstim 70 mm figure-of eight coil at 80% of individual motor thresholds, reflecting the applied setup. The resulting electric field was averaged within a 10 mm spherical ROI and centered on the target coordinate and extracted for subsequent analyses. Please note that in the study, the coil handle was oriented upwards; however, in this illustration, it has been intentionally depicted as pointing downwards for better visibility purposes. (D) Significantly reduced number of details recalled for linked events specifically in the high cTBS group (based on a median-split on simulated electric field strengths). (E) Significantly reduced recall of the linking events specifically in the high cTBS group (based on a median-split on simulated electric field strengths). Boxplots show the median for each group. Boxplot whiskers extend to the minimum or maximum value within 1.5 times the interquartile range. Points within the boxplot indicate individual data points per each group. Density plots indicate data distribution per group. The belongingness ratings for the linked and non-linked events are shown in Figure 2—figure supplement 1, the data of the multiple arrangements task in Figure 2—figure supplement 2, and the data of the forced-choice recognition test in Figure 2—figure supplement 3. Statistical differences stem from pairwise post-hoc tests of marginal means. *p<0.05, ***p<0.001.
Figure 2—figure supplement 1
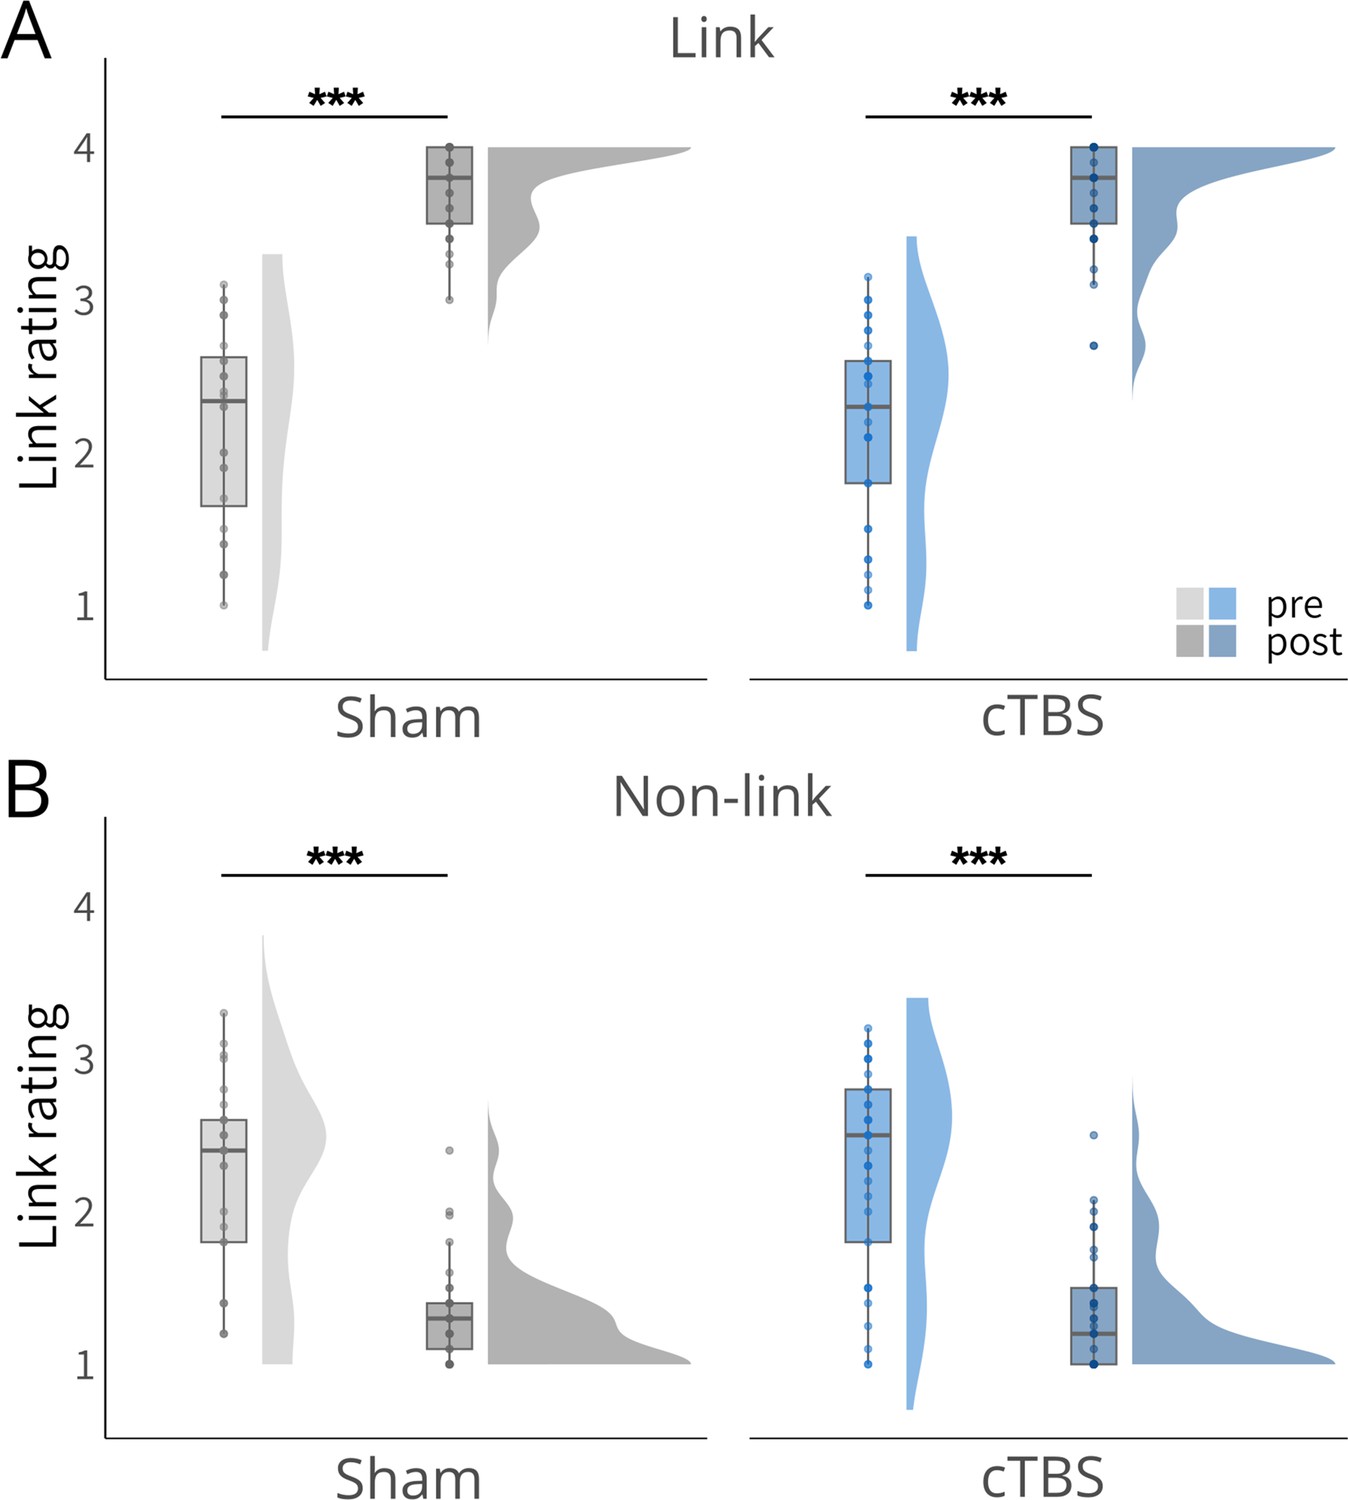
Results of the narrative-insight task (NIT).
(A) Significant increases in ratings for linked events from the pre- to the post-phase for both, the sham and the cTBS groups. There were no significant group differences. (B) Significant decreases in ratings for non-linked events from the pre- to the post-phase for both, the sham and the cTBS groups. There were no significant group differences. Boxplots show the median link ratings for each group at each time point. Boxplot whiskers extend to the minimum or maximum value within 1.5 times the interquartile range. Points within the boxplot indicate individual data points in each group. Density plots indicate data distribution per group and time. Statistical differences stem from pairwise post-hoc tests of marginal means. ***p<0.001.
Figure 2—figure supplement 2
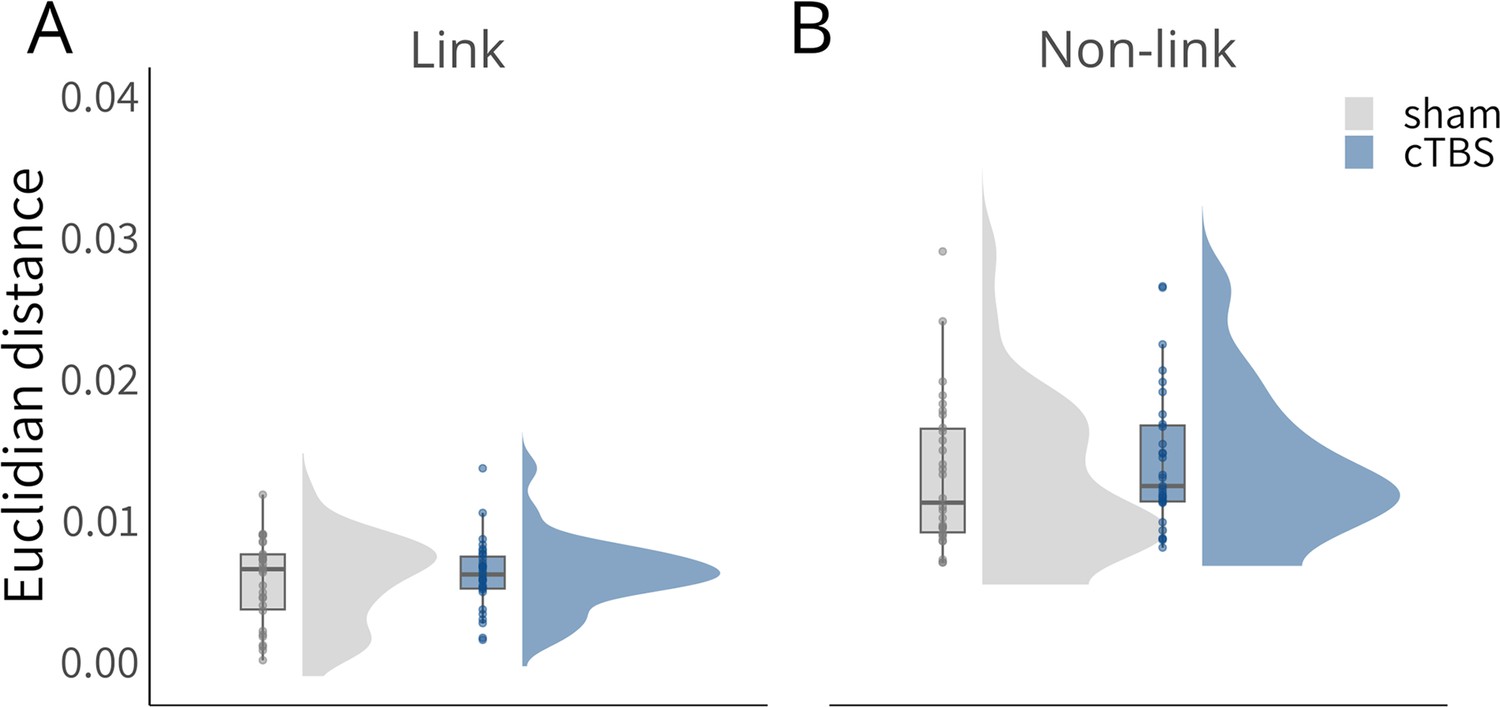
Results of the multiple-arrangements task (MAT).
Both groups arranged linked events closer to each other than non-linked events, without differences between groups. Boxplots show the median Euclidian distance for each group at each time point. Boxplot whiskers extend to the minimum or maximum value within 1.5 times the interquartile range. Points within the boxplot indicate individual data points in each group. Density plots indicate data distribution per group.
Figure 2—figure supplement 3
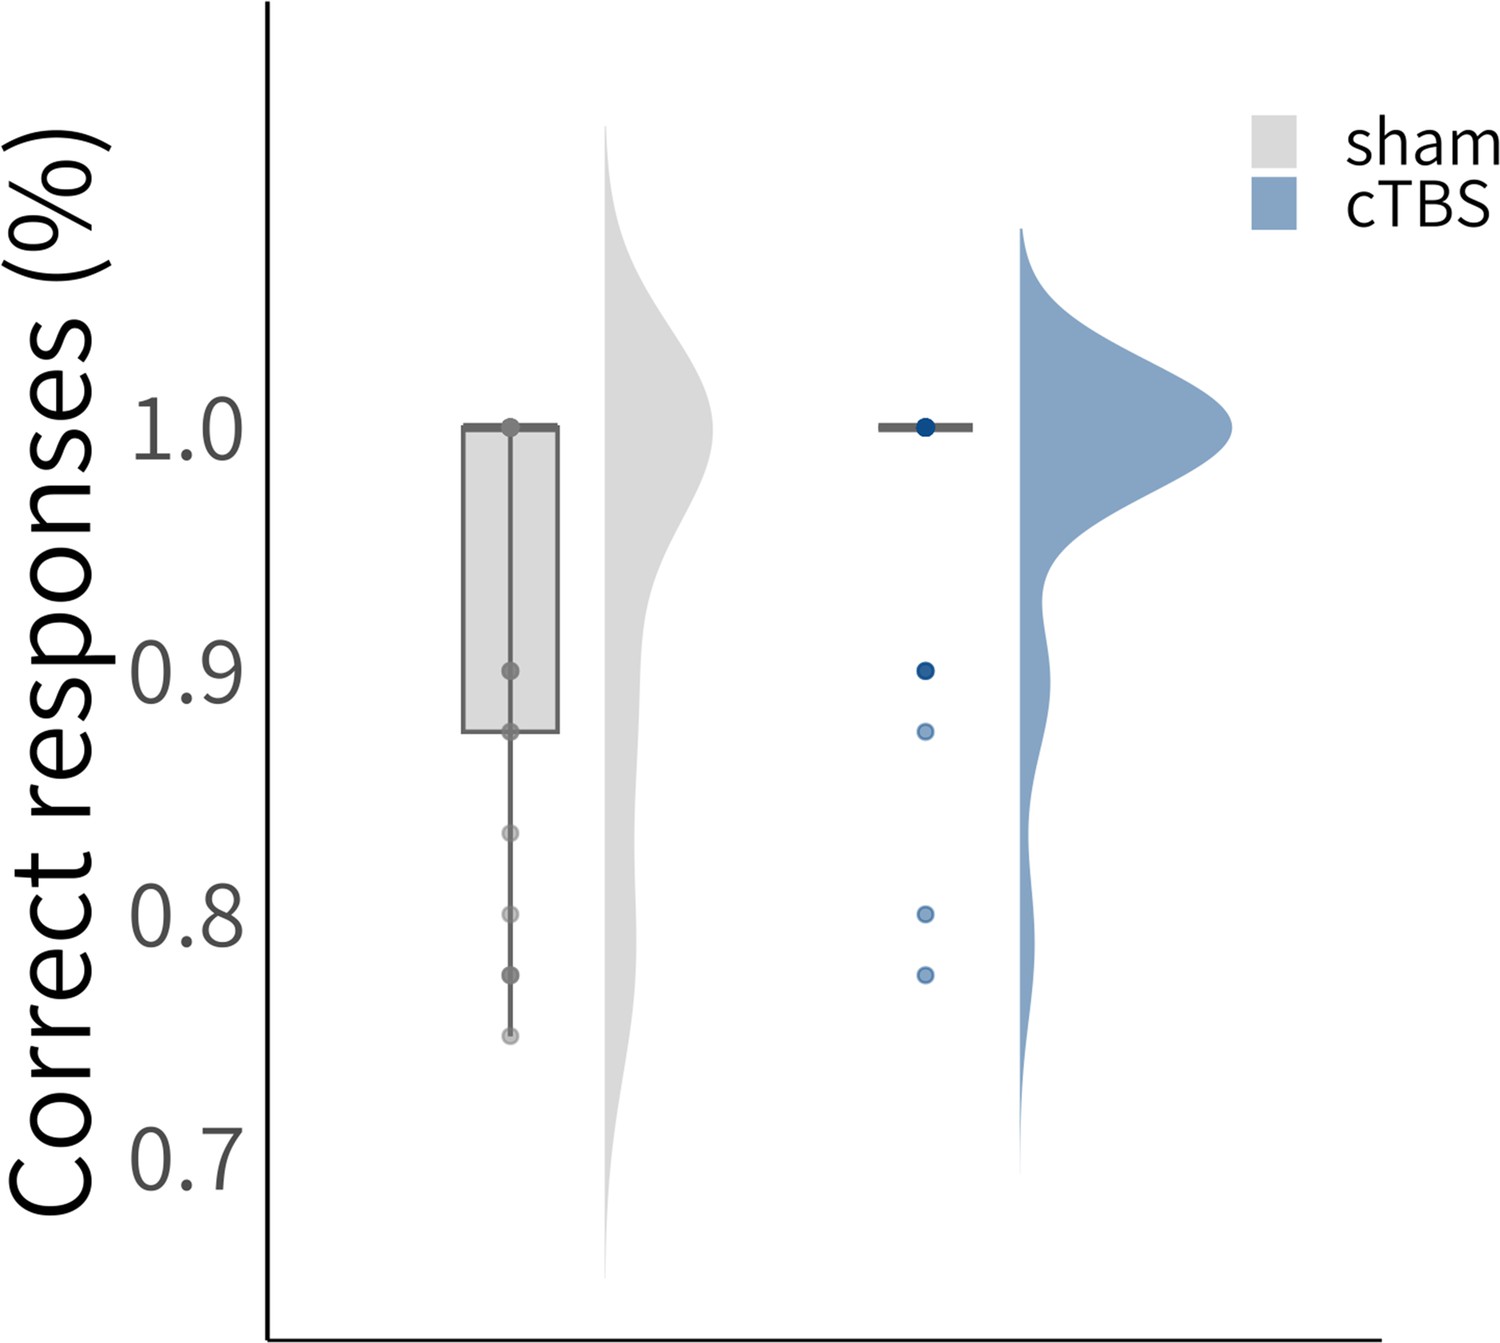
Results of the forced-choice recognition task.
Both groups performed very well in this task, without group differences. Boxplots show the median correct responses (%) for each group. Boxplot whiskers extend to the minimum or maximum value within 1.5 times the interquartile range. Points within the boxplot indicate individual data points in each group. Density plots indicate data distribution per group.
Figure 3 with 2 supplements

Representational pattern changes.
(A), Conceptual overview of the representational similarity analysis (RSA) on theta oscillations. First, time-frequency data was computed, and the theta power values (4–7 Hz) were extracted. Using these feature vectors, Pearson’s correlations were computed to compare the power patterns across time points of events (here: event A and B). These correlations resulted in a time × time similarity map. (B), Significant cluster, denoted by white dotted line for illustrative purposes, for the change from post-pre and imagination-observation between the cTBS and sham groups using an independent sample cluster-based permutation t-test for linked events (A and B). In the middle panel, follow-up tests on stories linked via imagination revealed increased similarity for the sham group, while no significant effect was observed for the cTBS group. In the lower panel, follow-up tests on stories linked via observation showed decreased similarity for the sham group and increased similarity for the cTBS group. (C), Significant cluster, denoted by white dotted line for illustrative purposes, for the change from post-pre and imagination-observation between the cTBS and sham groups using an independent sample cluster-based permutation t-test for non-linked events (A and X). In the middle panel, follow-up tests on stories linked via imagination revealed increased similarity for the cTBS group, while no significant effect was observed for the sham group. In the lower panel, follow-up tests on stories linked via observation showed decreased similarity for the cTBS group and no significant effect for the sham cTBS group. Boxplots show the median similarity for each group at each time point. Boxplot whiskers extend to the minimum or maximum value within 1.5 times the interquartile range. Points within the boxplot indicate individual data points in each group. Density plots indicate data distribution per group and time. *p<0.05, **p<0.01, ***p<0.001.
Figure 3—figure supplement 1
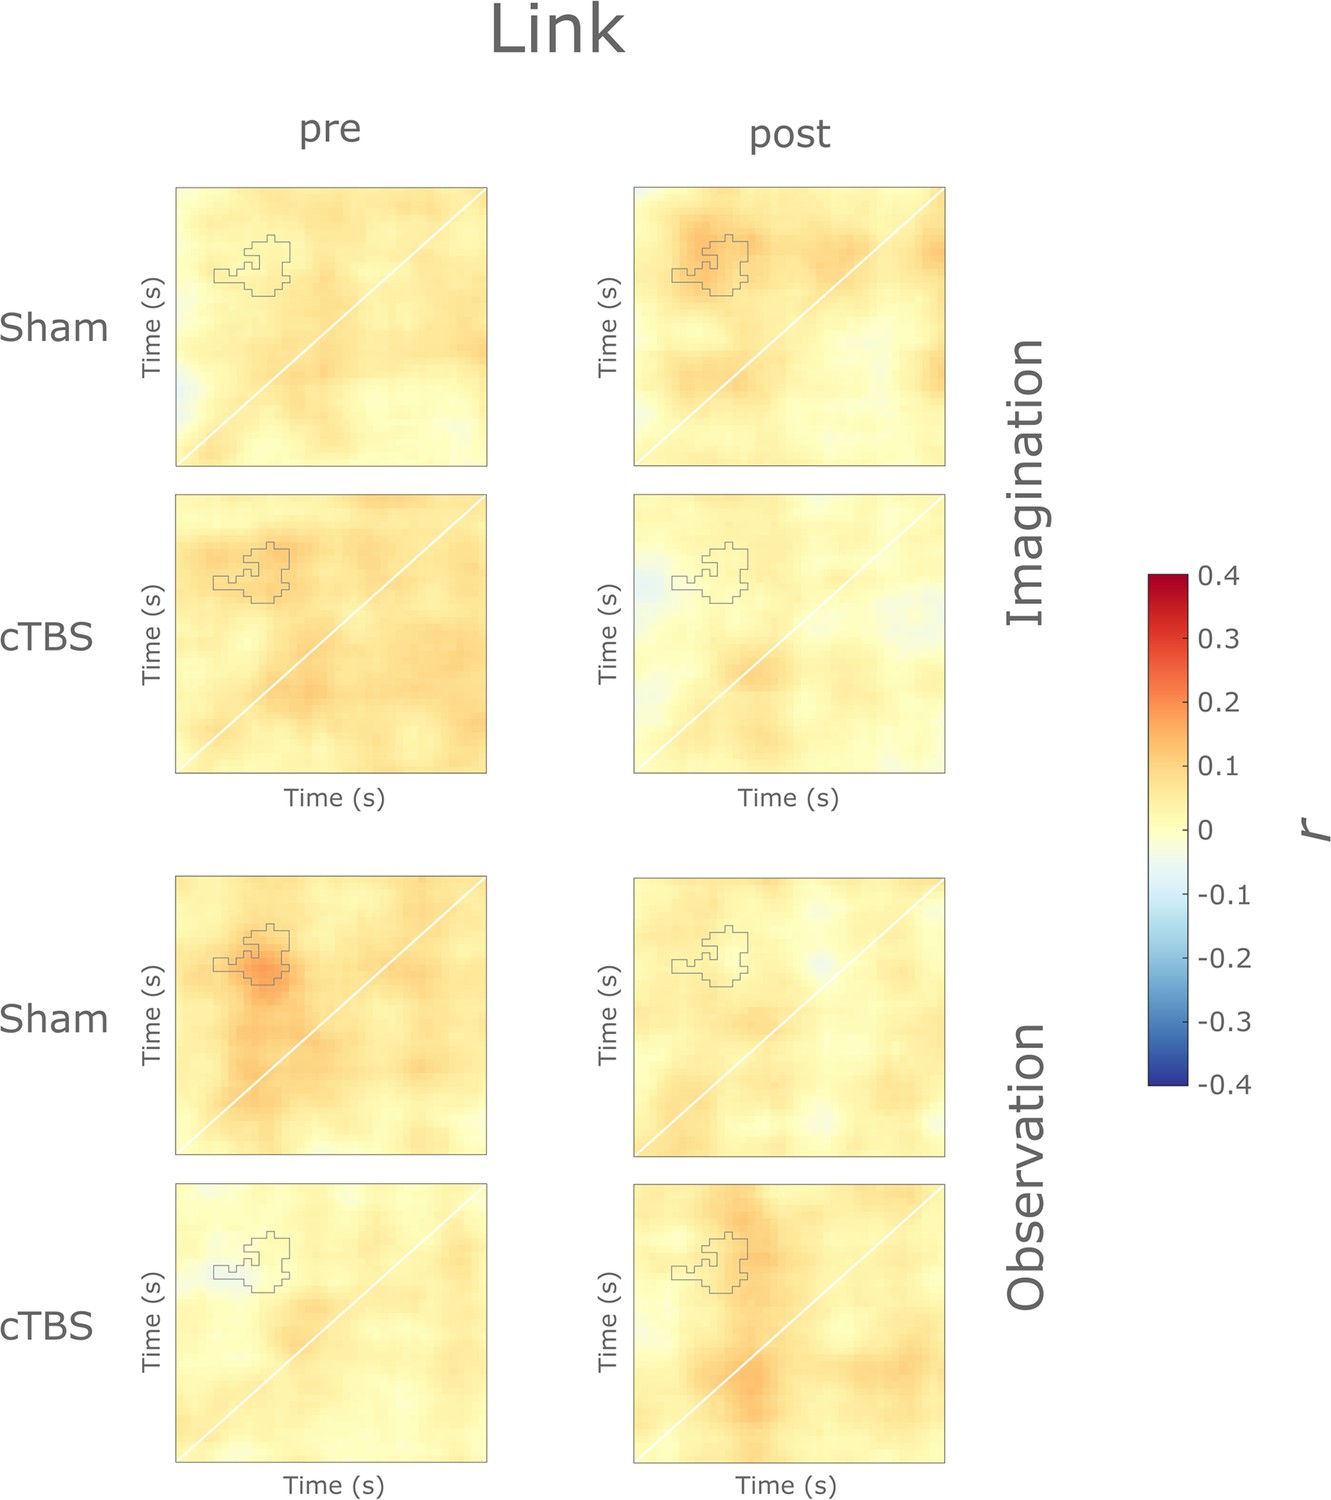
Raw representational dissimilarity maps for linked events.
Time × time similarity maps depict Pearson’s r between theta frequency vectors of event A and B at each time point. The grey line denotes the average significant cluster for the change from pre to post, the difference between imagination and observation and between the cTBS and the sham groups as found for linked events across the electrodes T7, TP7, and P7.
Figure 3—figure supplement 2
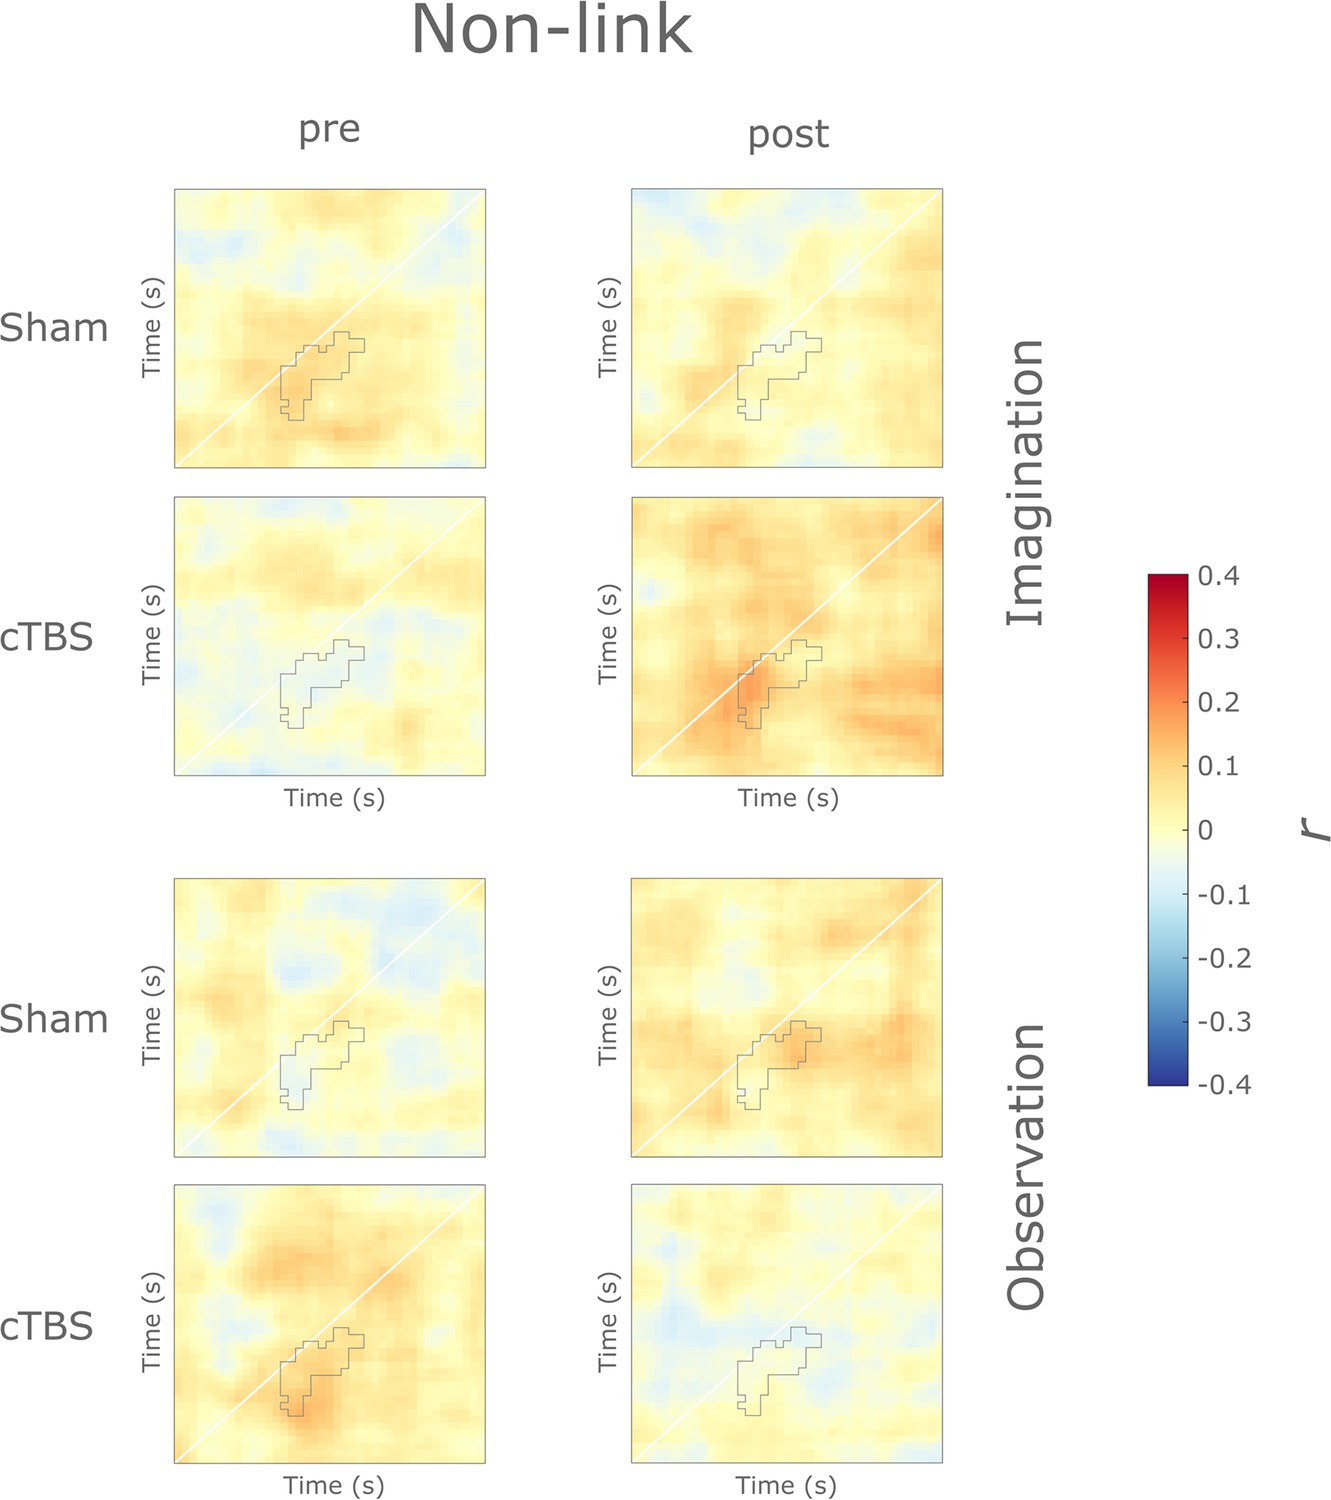
Raw representational dissimilarity maps for non-linked events.
Time × time similarity maps depict Pearson’s r between theta frequency vectors of event A and X at each time point. The grey line denotes the average significant cluster for the change from pre to post, the difference between imagination and observation and between the cTBS and the sham groups as found for non-linked events at the electrode FT7.
Figure 4

Connectivity change for linked events.
(A), Conceptual depiction of the negative cluster (centro-temporal and frontal). In the upper panel, the connections are presented separately for each electrode pair. The lower panel illustrates the cluster coherence based on the electrode locations relative to the brain. (B), Follow-up tests for events linked via imagination indicated decreased coherence between centro-temporal and frontal electrodes for the cTBS group, while no change was observed for the sham group. (C), Significant positive correlation, indicating that the less the coherence between centro-temporal and frontal electrodes changed from pre to post for imagination (vs. observation), the fewer details for linked events via imagination were recalled. Please note, that this correlation became even stronger when the outlier was removed (r = 0.38, t(58) = 3.11, p = 0.003). (D), Follow-up tests for events linked via observation indicated decreased coherence between centro-temporal and frontal electrodes for the sham group, while the cTBS group showed a significant increase in coherence. Boxplots show the median coherence for each group at each time point. Boxplot whiskers extend to the minimum or maximum value within 1.5 times the interquartile range. Points within the boxplot indicate individual data points in each group. Density plots indicate data distribution per group and time. *p<0.05, **p<0.01, ***p<0.001.
Tables
Table 1
Control variables.
| Sham | cTBS | ||||
|---|---|---|---|---|---|
| Measure | M | SD | M | SD | puncorr |
| FFIS-C | 24.06 | 4.24 | 23.59 | 4.64 | 0.066 |
| FFIS-D | 16.84 | 5.42 | 17.86 | 5.22 | 0.446 |
| FFIS-E | 13.84 | 7.16 | 15.00 | 7.10 | 0.514 |
| FFIS-F | 27.87 | 8.96 | 28.21 | 9.63 | 0.885 |
| STAI-T | 34.13 | 9.27 | 38.62 | 11.15 | 0.082 |
| STAI-S | 35.35 | 7.60 | 39.65 | 10.08 | 0.056 |
| TICS | 11.97 | 8.54 | 13.41 | 9.95 | 0.531 |
| BDI | 6.84 | 6.88 | 7.65 | 7.57 | 0.654 |
| BFI-2 E | 43.10 | 5.66 | 40.59 | 8.54 | 0.165 |
| BFI-2 N | 27.13 | 6.94 | 30.12 | 10.09 | 0.166 |
| BFI-2 O | 47.16 | 6.99 | 46.68 | 6.89 | 0.779 |
| BFI-2 C | 40.42 | 8.06 | 40.71 | 6.78 | 0.878 |
| BFI-2 A | 48.94 | 5.06 | 46.74 | 5.76 | 0.106 |
| Age | 25.45 | 4.62 | 23.62 | 3.82 | 0.088 |
| MT | 53.03 | 14.59 | 54.82 | 12.93 | 0.608 |
-
Note. The questionnaires FFIS with its dimensions: FFIS-C (complexity of imagination), FFIS-D (directedness of imagination), FFIS-E (emotional valence of imagination), FFIS-F (frequency of imagination); STAI-T and STAI-S; TICS; BDI; BFI-2 with its dimensions: BFI-2 E (extraversion), BFI-2 N (neuroticism), BFI-2 O (openness to experience), BFI-2 C (conscientiousness), BFI-2 A (agreeableness) were completed during the 30-min break after the insight-phase. Age in years. Motor thresholds (MT) in percent of maximum stimulator capacity. No significant group differences were observed on any of these measures. p Values are displayed uncorrected for multiple comparisons. Data represents means (+/-SD).
Key resources table
| Reagent type (species) or resource | Designation | Source or reference | Identifiers | Additional information |
|---|---|---|---|---|
| Software, algorithm | Psychophysics Toolbox | Brainard, D. H., & Vision, S. (1997). The psychophysics toolbox. Spatial vision, 10(4), 433–436. | RRID: SCR_002881 | |
| Software, algorithm | MATLAB | The MathWorks Inc, Natick, Massachussetts, USA | RRID: SCR_002881 | |
| Software, algorithm | ActiView | BioSemi B.V., Amsterdam, the Netherlands | RRID: SCR_023671 | |
| Software, algorithm | PowerMag View! System | MAG & More GmbH, Munich, Germany | RRID: SCR_023670 | |
| Software, algorithm | FieldTrip | Oostenveld et al., 2011 | RRID: SCR_004849 | |
| Software, algorithm | SimNIBS 4 | Thielscher, A., Antunes, A., & Saturnino, G. B. (2015, August). Field modeling for transcranial magnetic stimulation: a useful tool to understand the physiological effects of TMS?. In 2015 37th annual international conference of the IEEE engineering in medicine and biology society (EMBC) (pp. 222–225). IEEE, https://doi.org/10.1109/EMBC.2015.7318340 | RRID: SCR_014109 | |
| Software, algorithm | Nonparametric cluster-based statistical testing of EEG data | Maris and Oostenveld, 2007 | ||
| Software, algorithm | R version 4.04 | R Core Team (2014). R: A language and environment for statistical computing. R Foundation for Statistical Computing, Vienna, Austria. URL http://www.R-project.org/ | RRID:SCR_001905 |
Additional files
-
MDAR checklist
- https://cdn.elifesciences.org/articles/91033/elife-91033-mdarchecklist1-v1.pdf
-
Supplementary file 1
Supplementary material.
- https://cdn.elifesciences.org/articles/91033/elife-91033-supp1-v1.docx
Download links
A two-part list of links to download the article, or parts of the article, in various formats.
Downloads (link to download the article as PDF)
Open citations (links to open the citations from this article in various online reference manager services)
Cite this article (links to download the citations from this article in formats compatible with various reference manager tools)
Causal role of the angular gyrus in insight-driven memory reconfiguration
eLife 12:RP91033.
https://doi.org/10.7554/eLife.91033.3


