The proteolysis of ZP proteins is essential to control cell membrane structure and integrity of developing tracheal tubes in Drosophila
- Research Group Molecular Organogenesis, Department of Molecular Developmental Biology, Max Planck Institute for Multidisciplinary Sciences, Germany
- Cell biology, Institute for Biology, Leipzig University, Germany
- Facility for electron microscopy, Max Planck Institute for Multidisciplinary Sciences, Germany
Figures
Figure 1 with 2 supplements
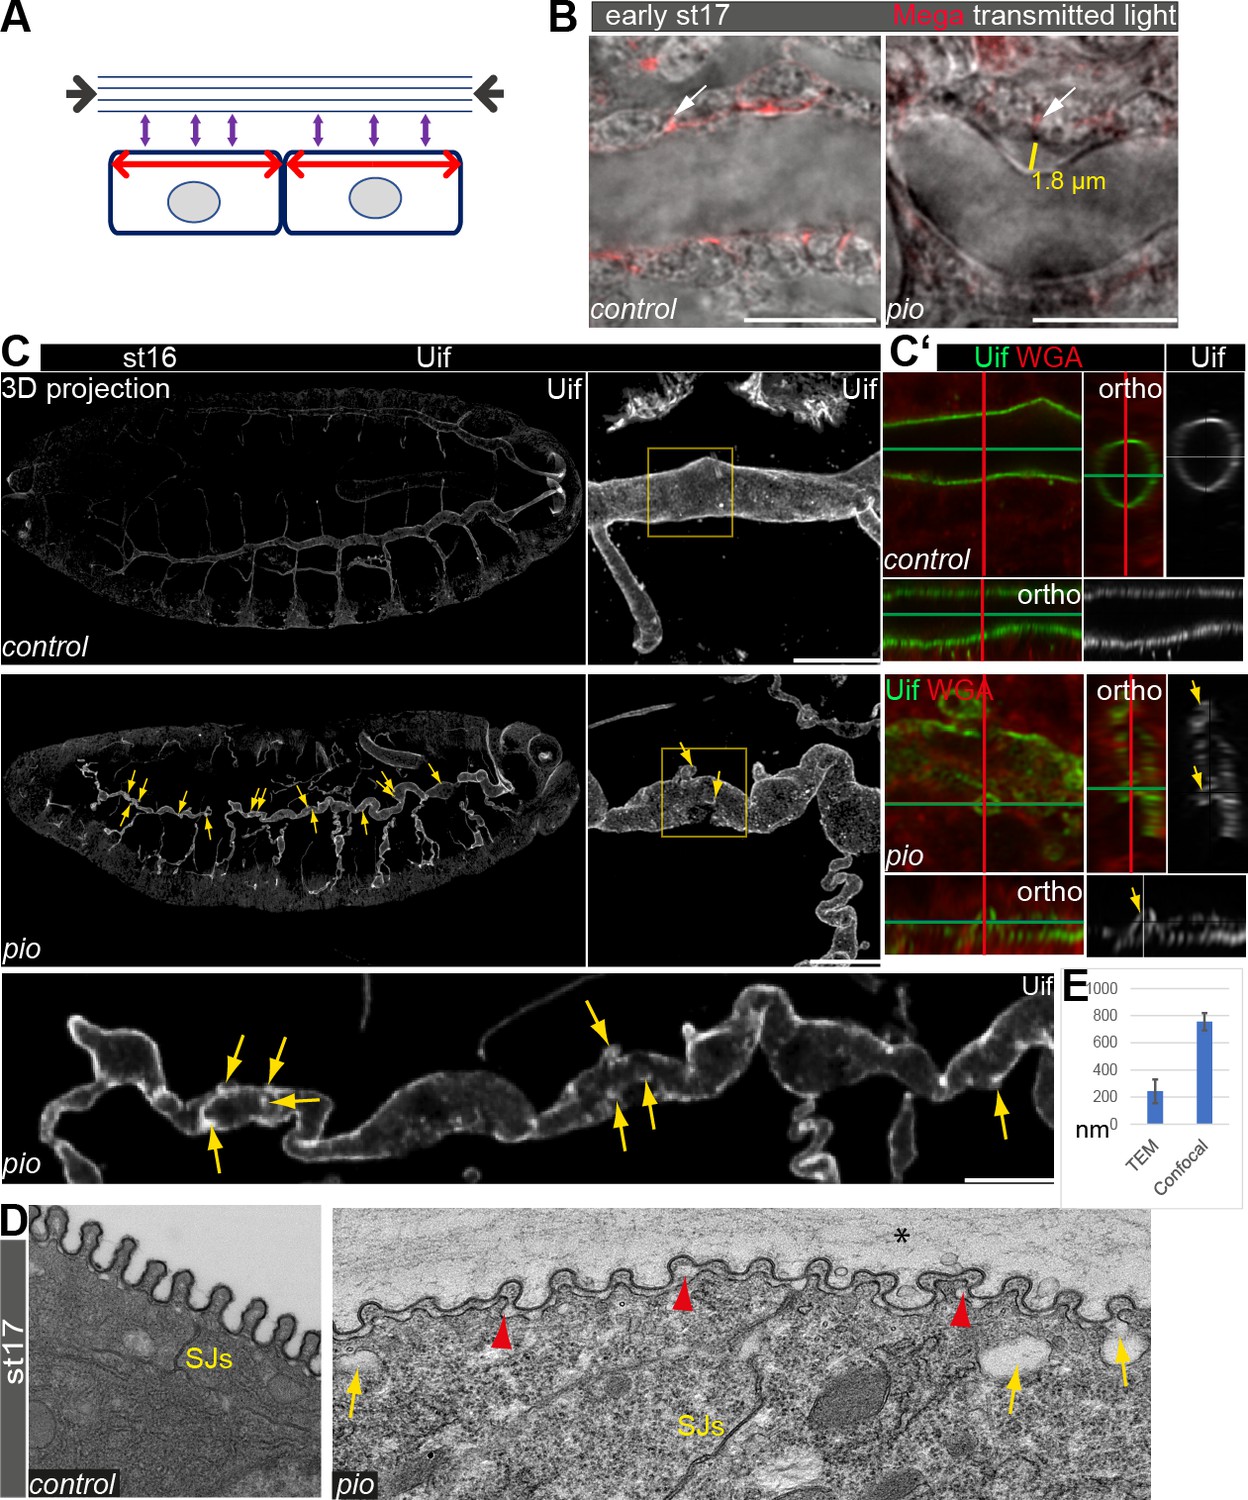
Pio supports structural continuity of the apical cell membrane.
(A) Model implicates the axial and longitudinal forces (arrows) acting apical on cell membrane and extracellular matrix of stage (st) 16 embryos when tracheal lumen expands in growing tubes. (B) Confocal images of wt and pio mutant stage 17 embryos. Lateral membrane is marked by Megatrachea (Mega; red, arrows) immunostaining, and transmission light visualizes the tracheal cells and lumen. The yellow line indicates the distance between the apical cell surface and the detached luminal apical extracellular matrix (aECM). Scale bars represent 10 µm. (C, C’) Confocal LSM Z-stack (overview) and Airyscan (close up) images of immunostainings are displayed as maximum intensity (3D projection) and orthogonal (ortho) projections (C’) using Uif antibody and WGA. Scale bars indicate 10 µm. Stage 16 control embryo showed straight apical cell membrane and tracheal tubes. All pio null mutant (n=10) embryos revealed curly elongated tracheal tubes and unusual bulge-like apical cell membrane deformations (yellow arrows in overview and close-up images). The Uif (green) and WGA (red) stainings on the right panel show airyscan images of the region, which is marked by the yellow frame in close left. Position of membrane deformations are marked by the green and red lines (XY axes) with the ZEN orthogonal projection. The corresponding orthogonal projections are indicated. Note that membrane bulge-like structures interfere with the tube lumen integrity (ortho-target cross in mutant). Control and pio mutant embryos were fixed and stained together. (D) TEM analysis of late-stage 17 wt embryos reveal SJs and chitin-rich taenidial folds and a cleared tube lumen. The corresponding pio mutant embryos (n=4) showed normal SJs formation but unusual apical cell membrane bulge-like deformations (yellow arrow), reduced chitin (red arrowheads), taenidial folds with disorganized pattern, and unusual extracellular matrix contents within the tube lumen (*). Scale bars represent 500 nm. (E) Quantification of pio mutant bulge-like apical cell membrane deformations sizes in nm of airyscan Z-stacks (mean value 750 nm, n=15) and TEM (mean value 230 nm, n=61) images. Standard deviations are indicated. It is of note that measurements of TEM images do not always capture the three-dimensionality of bulges and may show only parts of them.
-
Figure 1—source data 1
Bulge-like gaps between the Mega-marked cell membrane and apical matrix in stage 17 embryos.
- https://cdn.elifesciences.org/articles/91079/elife-91079-fig1-data1-v1.zip
-
Figure 1—source data 2
Bulge-like gaps between the Mega-marked cell membrane and apical matrix in stage 17 embryos.
- https://cdn.elifesciences.org/articles/91079/elife-91079-fig1-data2-v1.zip
-
Figure 1—source data 3
Uif marked unusual apical cell membrane deformations at the dorsal trunk in stage 16 embryos and quantification.
- https://cdn.elifesciences.org/articles/91079/elife-91079-fig1-data3-v1.zip
Figure 1—figure supplement 1
Generation and ultrastructure analysis of pio mutant embryos.
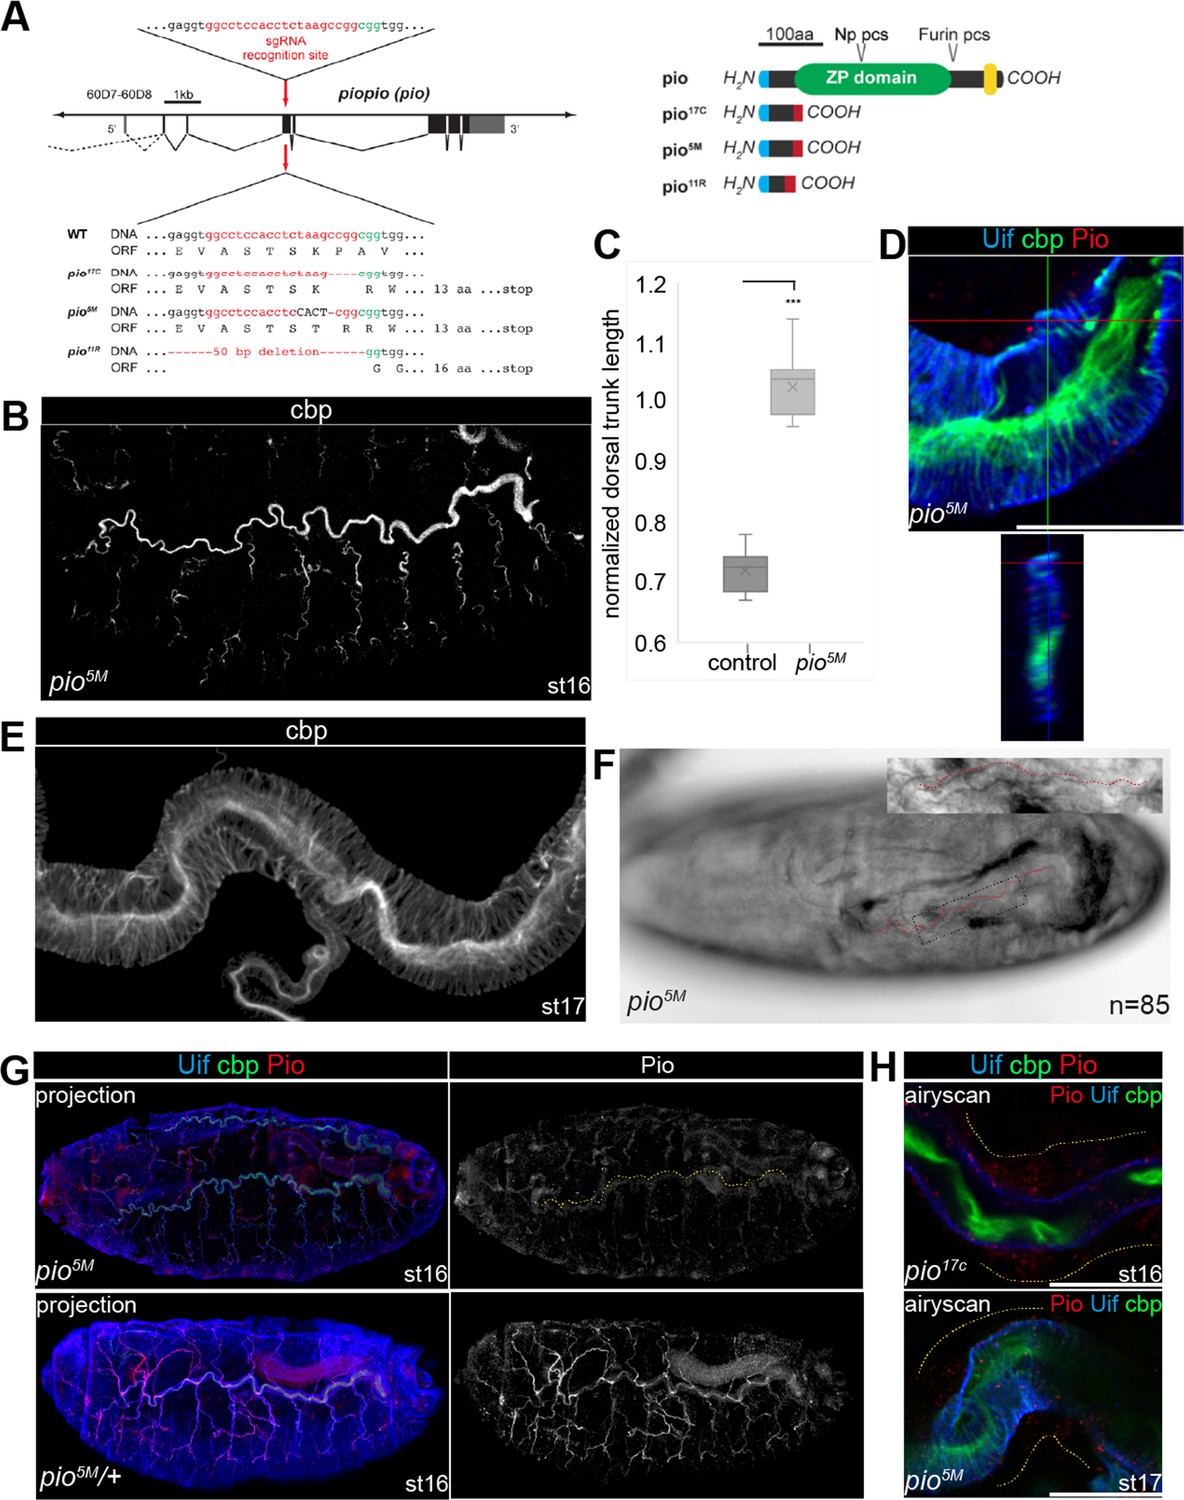
(A) Generation of three independent pio mutant alleles which lack all relevant protein domains. Schema of CRISPR/Cas9-mediated mutagenesis to generate frame shift mutations in the 5' region of the pio ORF. Map of genomic pio region and of single guide RNA (sgRNA) target site (red letters) with PAM (green letters), ORF (black boxes), and UTRs (gray boxes). Alleles of pio with generated indels that cause ORF frame shifts in pio17c, pio5M, and pio11R mutant alleles. Frame shifts result in the expression of truncated Pio proteins. Signal peptide (blue), ZP domain (green), transmembrane domain (yellow), frame shifted amino acid sequence (red), and protease cleavage sites (pcs) are indicated. SMART analysis of Pio (PB_FBpp0072219) supports previous findings by Jaźwińska et al., 2003. N-terminal ZP module (66–351aa) and C-terminal transmembrane domain (TM, 410–432aa) are indicated. The anti-Pio antibody (kindly provided by the Affolter lab) recognizes a polypeptide stretch between 186 and 200aa within (arrow) the ZP module. Thus, anti-Pio antibody detects Pio also after Furin (predicted site at 355aa) and Np processing. (B,C) The pio5m mutant stage 16 embryos show sinusoidal tube overexpansion phenotype with chitin staining and quantification reveals significantly increased dorsal trunk length (n=10 embryos). Bars represent ± SD and p-value from t-test is indicated with an asterisk (***, p<0.0001). (D) Orthogonal projection shows a bulge-like apical cell membrane deformation pio5m mutant dorsal trunk at beginning of stage 17 and collapsed tube lumen. The Pio (red) and Uif (blue) antibodies stainings are shown together with chitin (green). Note that Pio staining is strongly reduced in pio5m mutant stage 16 embryos when compared with control (Figure 2). (E,F) The pio5m mutant stage 17 embryos show loose taenidial fold formation and airway gas-filling defects (n=147). Altogether, tracheal phenotypes of pio5M and pio17c alleles are similar. The tracheal phenotypes include the branch disintegration phenotype observed from pio2R-16 point mutation allele. (G) Confocal Z-stack projections of pio5M and pio5M/+ heterozygous control embryos. In contrast to control, pio5M mutants show strongly reduced Pio staining indicated in red (left) and as single channel in gray (middle panel). Yellow dashes mark the tracheal dorsal trunk. (H) Airyscan images of dorsal trunks. Tracheal Pio staining is strongly reduced in stage 16 and stage 17 in pio17c and pio5M mutant embryos. Scale bars represent 10 µm.
Figure 1—figure supplement 2
Cell membrane deformations in pio mutant embryos.
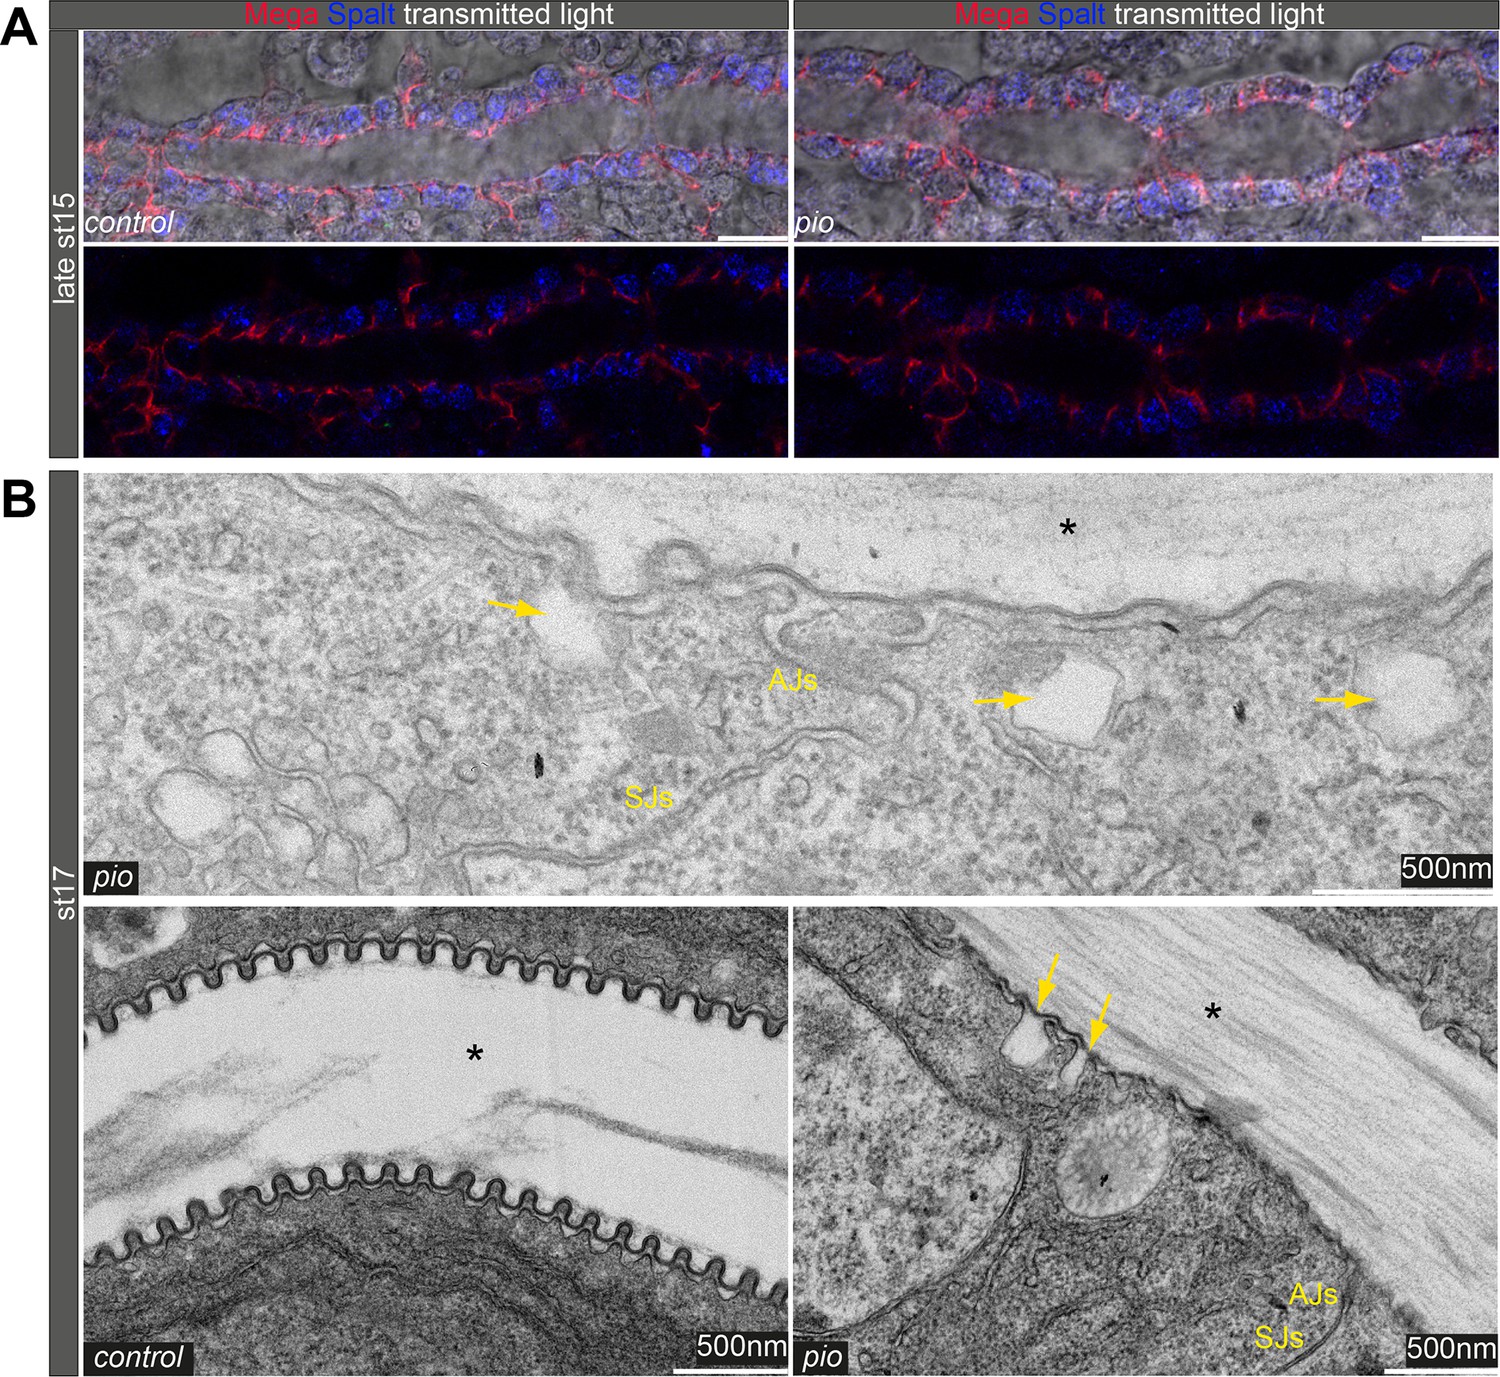
(A) Confocal images of wt and pio mutant stage 15 embryos. The lateral membrane of dorsal trunks is marked with Megatrachea (Mega; red, arrows), and transmission light visualizes the tracheal cells and lumen. In addition, the transcription factor Spalt (blue) is detectable in nuclei of wt and pio mutant tracheal cells of the dorsal trunk. Lower panels show Mega and Spalt expression in tracheal cells. Scale bars indicate 10 µm. (B) TEM analysis of late-stage 17 wt embryos. The control embryo is shown in the lower panel left-hand image. The pio mutant embryos (upper and lower right-hand images) show normal AJs and SJs formation. However, pio mutant embryos contained bulges of the apical cell membrane (yellow arrow), and the pattern of taenidial folds was disorganized. Note that differences of taenidial fold disorganization phenotypes (compare with Figure 1D) can reflect the variations of individuals of stage 17 embryos. The luminal extracellular matrix material within the tube lumen is indicated (*). Magnification is indicated in the images with scale bars.
Figure 2 with 2 supplements
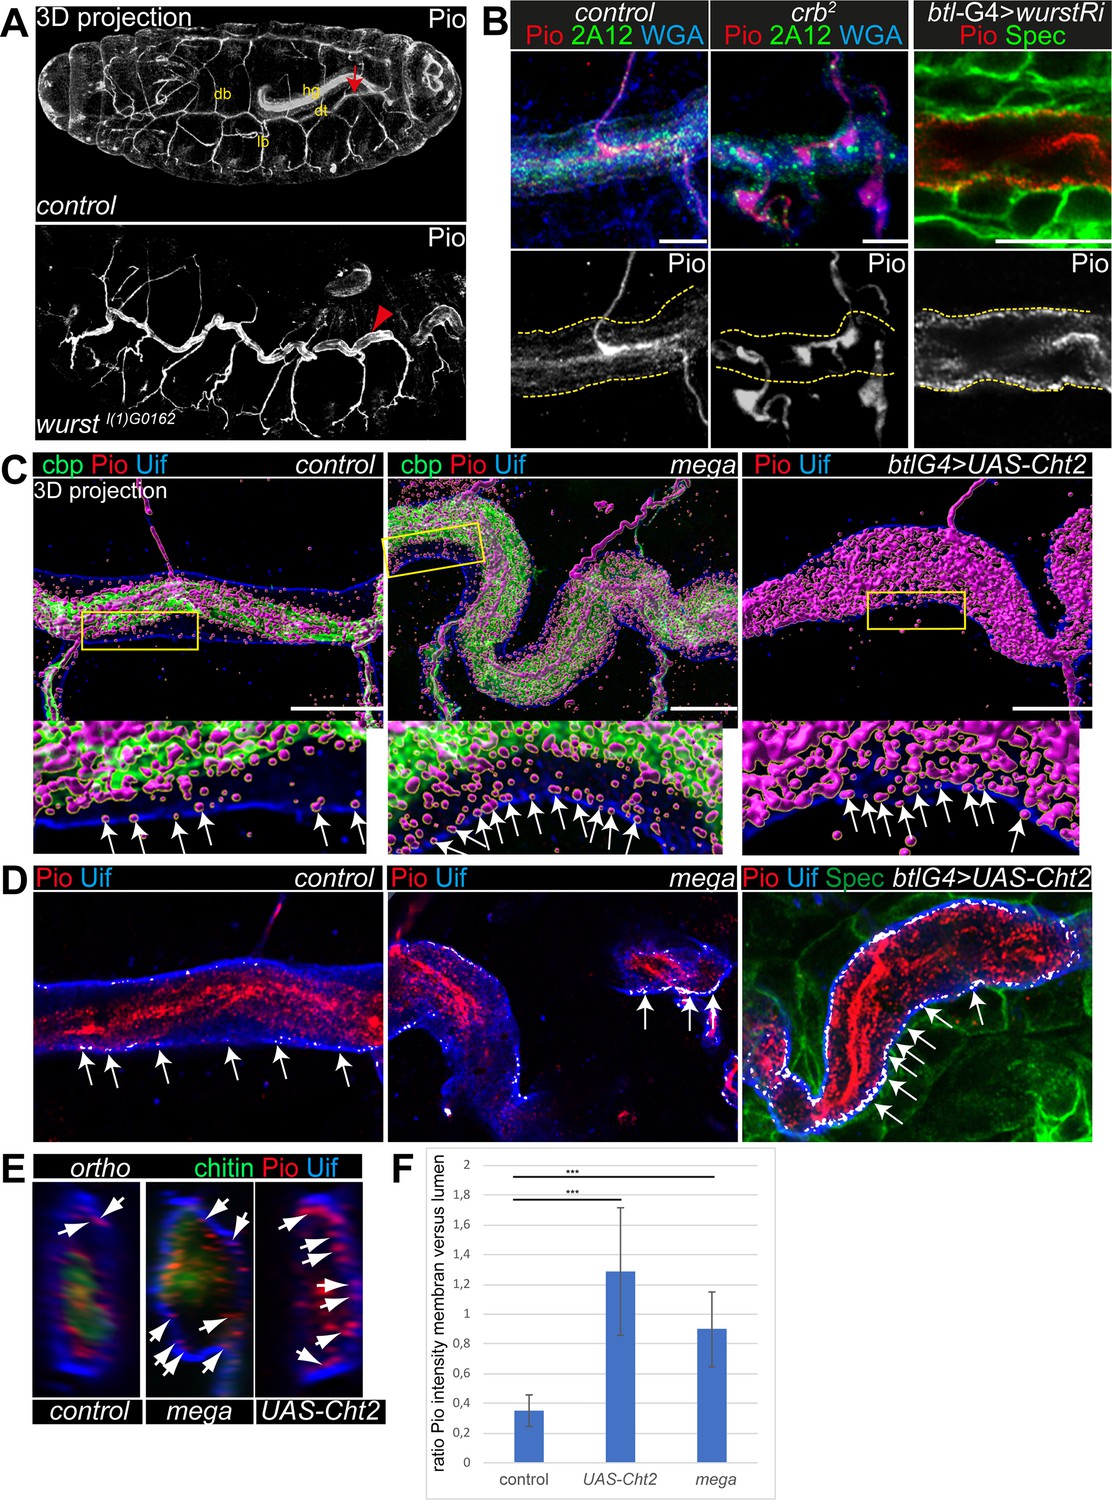
Pio localization depends on the apical membrane and supports tracheal air-filling.
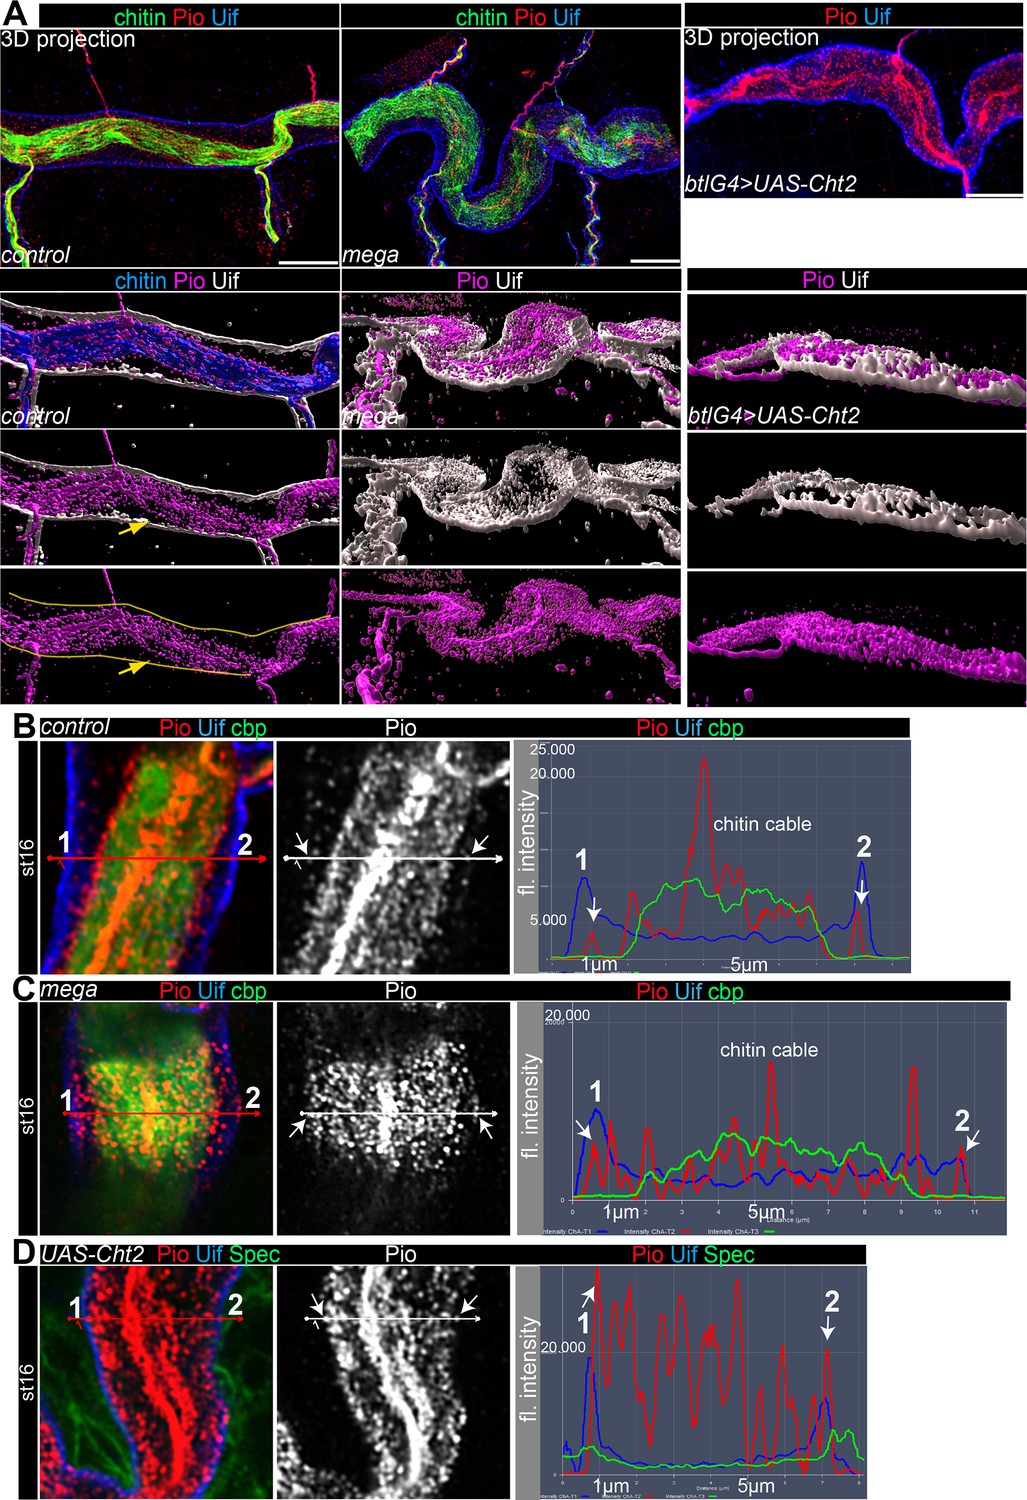
Shown are stage 16 embryos. Maximum intensity projections of confocal Z-stacks are shown in A, single confocal images in B, and Airyscan microscopy in C–E. Scale bars indicate 10 µm. (A) Pio protein is expressed in tracheal tubes (db, dorsal branches; lb, lateral branches; dt, dorsal trunk) and other ectodermal epithelial organs. Pio accumulates in the tracheal lumen (arrow) of control embryos. In contrast, Pio staining showed unusual accumulation at the apical cell membrane of wurst mutant embryos (arrowheads point to Pio accumulation). It is of note that embryos were stained together. Shown are whole-mount embryos. hg, hindgut. (B) In crb mutant embryos, Pio staining is within the luminal matrix but not at the apical cell membrane (indicated by yellow dashes). Corresponding control embryos showed Pio at the membrane and predominantly within the lumen. The tracheal-specific wurst knockdown shows Pio accumulation at the apical cell membrane similar to the wurst mutant embryo (compare with A). 2A12 detects the apical extracellular matrix (aECM) protein Gasp. WGA stains cell membrane surfaces and chitin predominantly. (C) Imaris 3D projection. In wt Pio (magenta) is detectable in a punctuate pattern at the tracheal apical cell membrane, partially overlapping with Uif (blue) in stage 16 control embryos. Chitin-binding probe (cbp; green) labels chitin. The stage 16 mega mutant embryo (n=5) showed Pio accumulation at the apical cell surface. The tracheal expression of the Chitinase 2 (n=5) showed a disturbed Pio pattern, including accumulation of Pio puncta at the apical cell surface. The lower panel shows close-ups of the apical cell membrane of the framed area in the upper images. The white arrows indicate Pio puncta at the Uif marked apical cell membrane. We chose comparable regions where a gap formed between the cell membrane and chitin matrix to detect the apical Pio puncta. Note that mega mutant embryo (20 Pio puncta) contains twice as much Pio puncta at the Uif stained apical cell membrane as the control (9 Pio puncta); both show tracheal metamers 7–9. (D) ZEN co-localization, which compares histograms of fluorescence intensities between the two channels, airyscan images. The overlapping Pio (red) and Uif (blue) puncta are colored in white. Arrows point to such overlapping Uif and Pio puncta at the apical cell membrane. (E) Images show representative orthogonal projections of dorsal trunks (metamere 6–8) of control, mega mutant, and Cht2 overexpression embryos. Arrows point to Pio puncta (red) at and near the apical cell membrane marked with Uif (blue). Chitin is shown in green. (F) Quantification of the ratio of maximum fluorescence intensity values between membranes and tube lumen. The control embryos showed a ration at 0.35, the Cht2 overexpression at 1.29, and mega mutants a ration of at 0.9. Bars represent ± SD and p-values from t-test are indicated with asterisks (***, p<0.0001).
-
Figure 2—source data 1
Quantification of Pio distribution across the dorsal trunks in different stress situations in stage 16 embryos.
- https://cdn.elifesciences.org/articles/91079/elife-91079-fig2-data1-v1.zip
Figure 2—figure supplement 1
Tube luminal matrix and Pio turnover in tracheal cells.
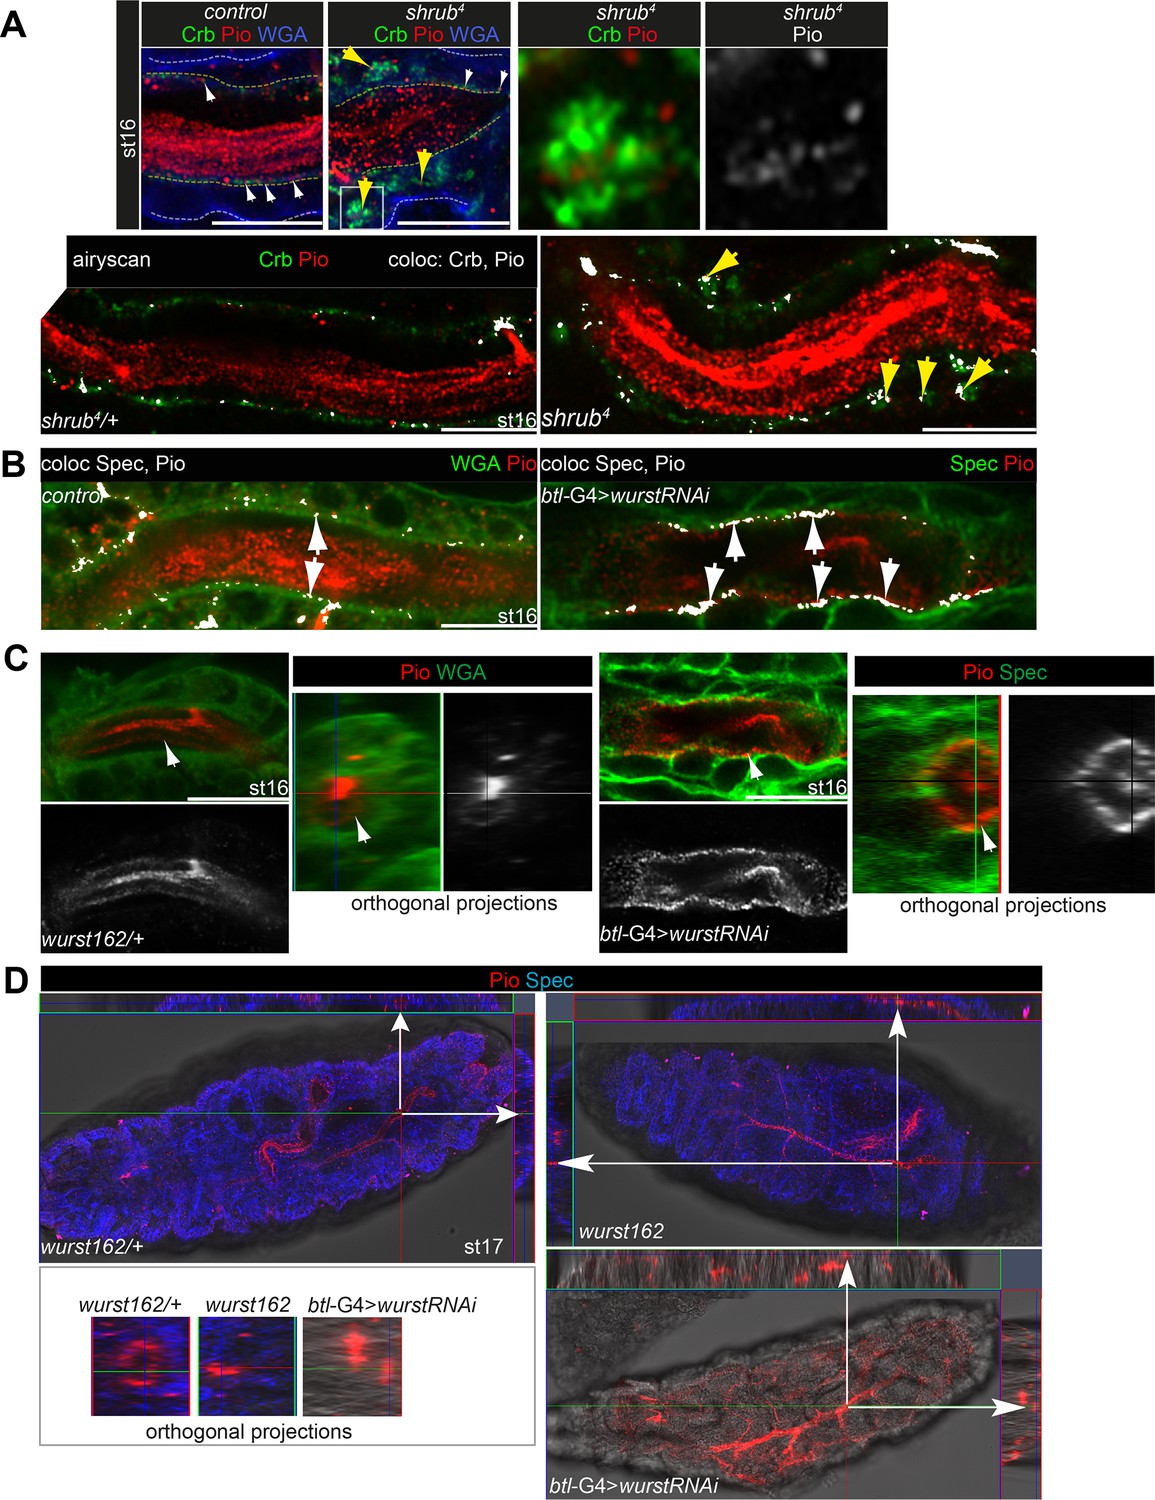
(A) Confocal images of Pio and Crb in control and shrub mutant embryos and analyzed with the ZEN co-localization tool (lower panel, co-localization is indicated with white puncta). Pio is shown in red, Crb in green, and overlap of both proteins in white in st16 embryos. Pio puncta overlap with Crb at the apical cell membrane (white arrows) in control and shrub mutant embryos and additionally in shrub mutants intracellularly in Crb marked swollen endosomes (yellow arrows). (B) Confocal images of Pio, wheat germ agglutinin (WGA), and α-Spectrin in control and btl-Gal4-driven UAS-wurst RNAi knockdown stage 16 embryos, analyzed with the ZEN co-localization tool (co-localization is indicated with white puncta). Pio is shown in red, WGA and α-Spectrin in green, and overlap in white. Control embryos show Pio puncta at the apical cell surface (white arrows). wurst knockdown embryos show accumulation of Pio puncta at the apical cell membrane (white arrows). (C) Confocal images and orthogonal projections of the tube lumen after ‘express’ deconvolution with SVI Huygens pro (wurst162/+) and Airyscan mode (wurst RNAi). Pio is shown in red, WGA in green, and α-Spectrin in green. White arrows point to Pio accumulation at the apical cell surface upon btl-Gal4>UAS-wurst RNAi knockdown. (D) Confocal images and corresponding (white arrows) orthogonal projections of whole-mount stage 17 wurst mutant, heterozygous control siblings, and tracheal-specific btl-Gal4>UAS-wurst RNAi knockdown embryos. Pio is shown in red, the cell membrane marker α-Spectrin in blue. While control embryos clear Pio from their tracheal tube lumen, wurst mutant and wurst knockdown embryos failed to clear luminal Pio. Magnifications of the orthogonal projections are shown left in the lower panel. Late-stage 17 wurst162 heterozygous control embryos show Pio at the apical cell surface but not within the tracheal tube lumen. Comparable wurst162 mutant and wurst RNAi knockdown embryos show Pio staining within the tube lumen. Scale bars indicate 10 µm.
Figure 2—figure supplement 2
Pio localization in mega mutant and Cht2 overexpressing embryos.
(A) 3D images (upper panel in A) of dorsal trunks of airyscan Z-stacks show Pio (red), Uif (blue), and chitin (chitin-binding probe; green). Lower panels in A show 3D visualization of Imaris surfaces of voxel data resulting from airyscan Z-stacks, Pio (magenta), Uif (gray), and chitin-binding probe (blue). Control embryos show Pio staining accumulation in the lumen and some puncta (yellow arrows) at and near the apical cell membrane (yellow line in A). Mega mutant and Cht2 overexpressing embryos show luminal Pio but also Pio puncta enrichment at and near the apical cell membrane. Scale bars indicate 10 µm. (B–D) Airyscan Z-stack images of Pio and Uif antibody stainings in stage 16 embryos analyzed with the ZEN profile tool. Focusing across the tube lumen, as indicated with red and white lines in the images (left and middle panels), revealed overlapping peak fluorescence intensities of Pio staining (red) with Uif (blue, indicated as ‘1’ and ‘2’) at the apical cell membranes and with chitin (cbp, green) at the luminal chitin cable in control dorsal trunk (B). The right panel shows the fluorescence intensity profile, white arrows point to Pio peak overlapping with the Uif peak (indicated as ‘1’ and ‘2’) at the apical cell membranes. The distance is indicated in µm at the X axis and fluorescence intensities at the Y axis. The profile tool identifies highest Pio intensity peak at the chitin cable which fits to the intensive Pio staining enriched in a wide core-like structure in the tube lumen. The dorsal trunk Pio peak intensity profiles of of mega mutant and Cht2 ovexpressing embryos are presented in C and D. They show a Pio core-like structure in the tracheal lumen, and, in contrast to control, increasing Pio fluorescence intensities at and next to the apical cell membrane, which can be assessed by the ratio between membrane and lumen. The corresponding quantification of two different embryos at 10 different dorsal trunk positions (n=20) of each genotype is presented in Figure 2.
Figure 3 with 2 supplements
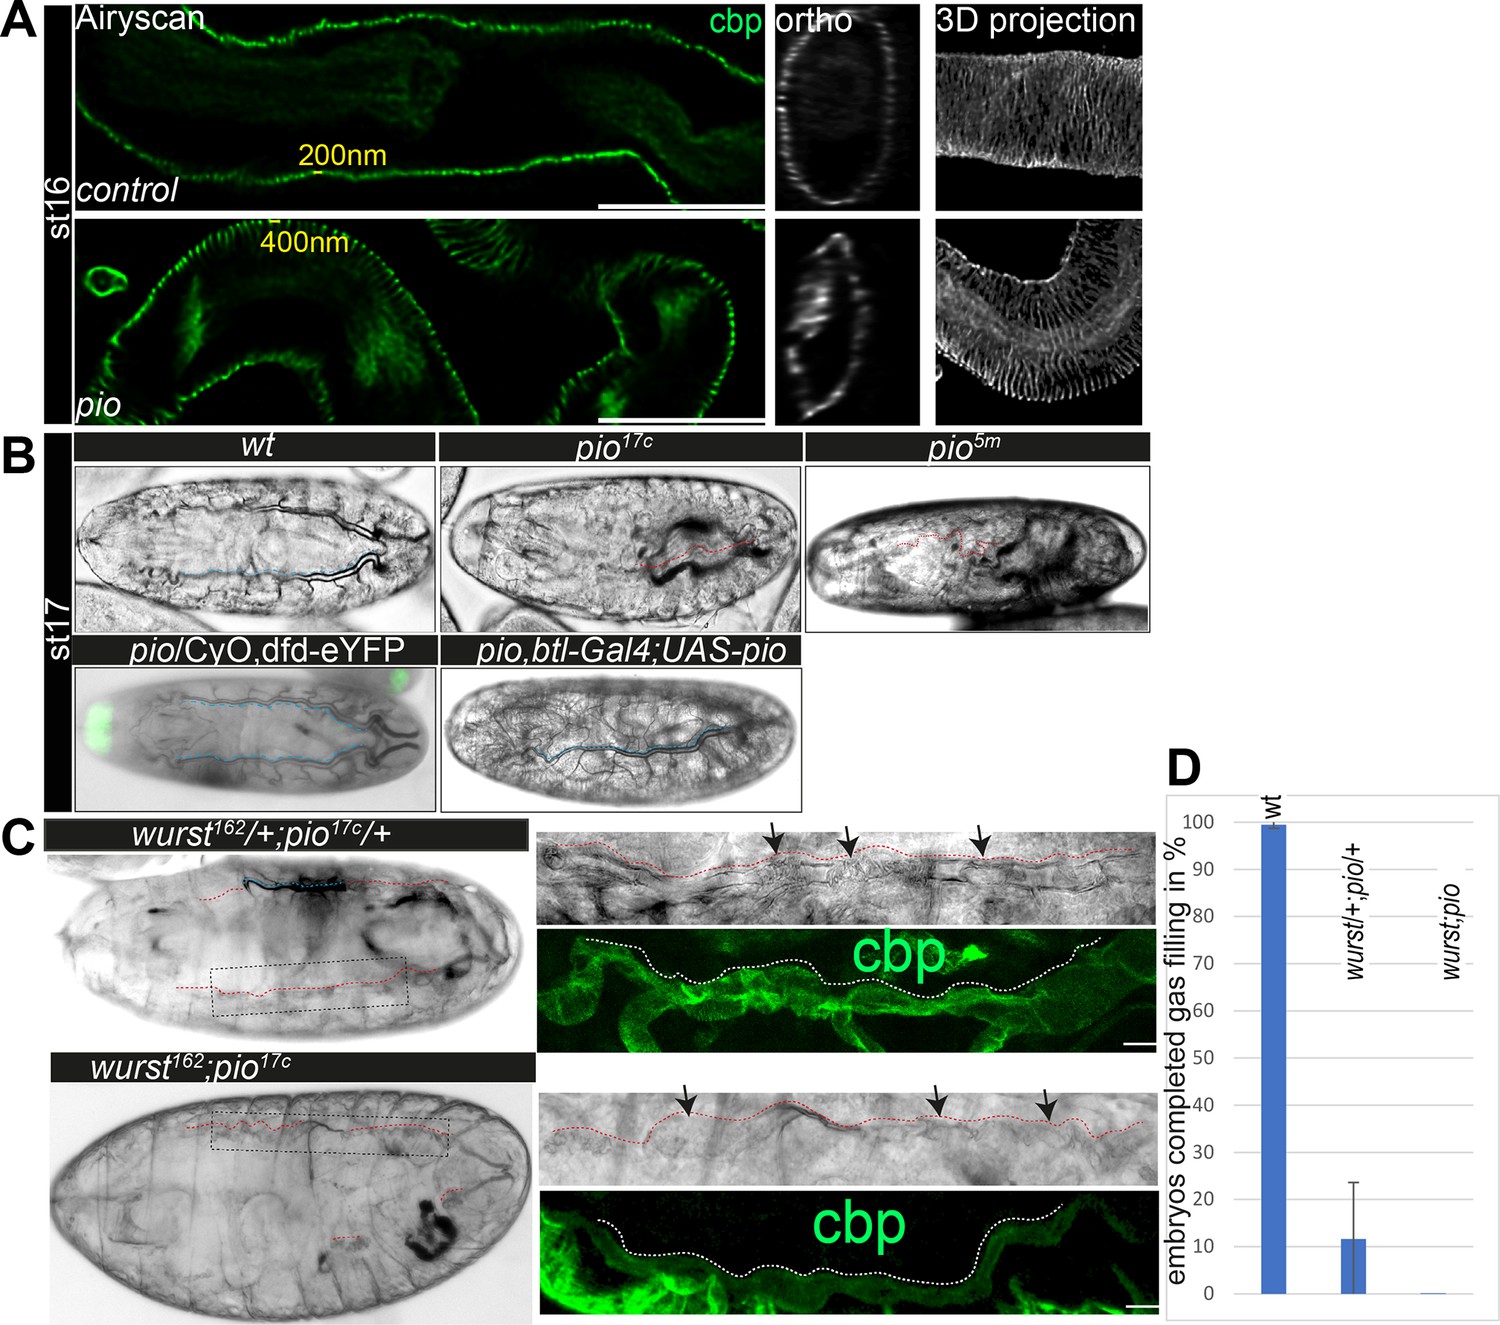
Pio is required for taenidial fold morphology and airway gas-filling.
(A) Airyscan images (left) and orthogonal (middle) and 3D projections (right) of control and pio mutant late-stage 16 embryos. cbp (in green and gray) detects chitin at the taenidial folds and within the tracheal lumen of control and pio mutant embryos. The pio mutant embryos show loose taenidial fold patterns with enlarged distances between the ridges. (B) Late-stage 17 wt embryos revealed normal tracheal air-filling (indicated with blue dashes). All pio (n=20) mutant embryos mutant embryos showed tracheal air-filling defects (red dashes indicate liquid filled airways), while almost none of the control embryos showed defects (n=100). Tracheal air-filling defects in embryos were displayed as dark gray bars, and normal air-filling as light gray bars. Error bars indicate the standard deviation. Heterozygous pio mutant embryos (n=10) as well as the btl-Gal4 driven tracheal expression of Pio in pio mutant embryos (n=10) revealed normal tracheal air-filling at the end of stage 17 (indicated with blue dashes). Green signal indicates eYFP expression from the balancer chromosome in the heterozygous pio mutant embryo. (C) The transheterozygous wurst;pio and wurst;pio double mutant stage 17 embryos showed tracheal air-filling defects (red dashes) in bright-field microscopy. Whole-mount embryos are shown left, framed parts of dorsal trunks are shown as close-ups right. Dorsal trunk tubes are indicated with red dashes. Confocal 3D projection of cbp (chitin, green) revealed collapsed and irregular tube lumen morphology in the mutant embryos. Scale bars indicate 10 µm. (D) Quantification of completed air-filling in late-stage 17 embryos. 89% of the transheterozygous (n=27) and all 11 wurst;pio double mutant embryos revealed incomplete air-filling whereas nearly all control embryos managed to complete air-filling. Error bars indicate the standard deviation.
-
Figure 3—source data 1
Pattern of taenidial folds in stage 16 embryos.
- https://cdn.elifesciences.org/articles/91079/elife-91079-fig3-data1-v1.zip
-
Figure 3—source data 2
Quantification of tracheal air-filling in stage 17 embryos.
- https://cdn.elifesciences.org/articles/91079/elife-91079-fig3-data2-v1.zip
Figure 3—figure supplement 1
CRISPR-Cas9-mediated pio mutagenesis and caused phenotypes and mCherry:Pio generation and expression.
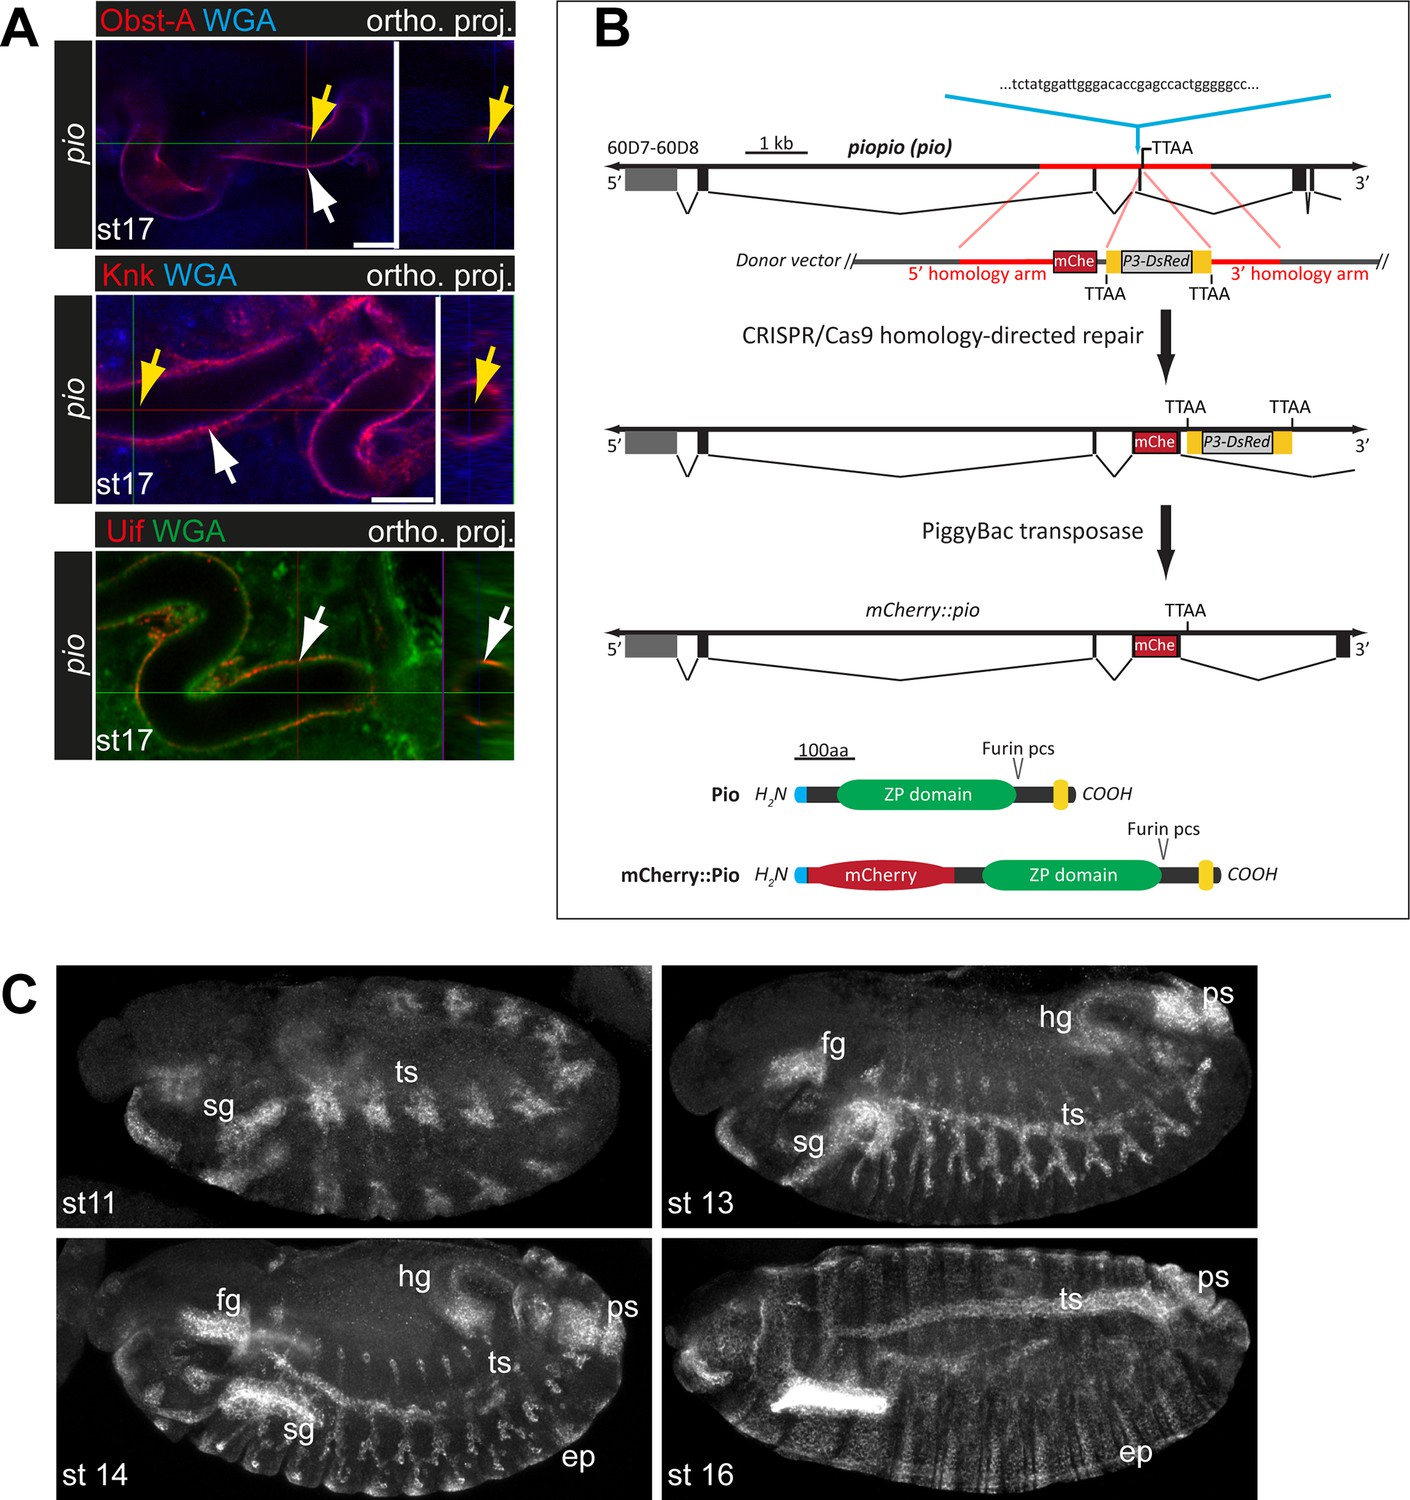
(A) The stage 17 pio loss-of-function embryos are able to clear chitin-matrix proteins from tracheal tube lumina, as indicated by Obst-A (red), Knk (red), and WGA (blue) stainings. Shown are confocal overview and higher magnification images and the corresponding orthogonal projections of the tube lumen (right hand). White arrows point to the apical cell membrane and yellow arrows to the tube lumen area from which orthogonal projections were generated. Scale bars represent 10 µm. (B) Schema of the 5’ region of the pio genomic locus together with the donor vector containing two homology arms (red) and mCherry encoding sequences followed by a 3xP3-DsRed marker gene flanked by PiggyBac transposon ends (yellow). The sgRNA recognition site (magenta), PAM (green), translated DNA (black boxes), and UTRs (gray boxes) are indicated before and after CRISPR/Cas9-mediated homology-directed repair. Signal peptides (blue), mCherry (red), ZP domains (green), Furin cleavage sites (pcs), and transmembrane domains are indicated below in Pio and mCherry::Pio proteins. (C) Confocal maximum intensity projections of anti-mCherry immunostainings of whole-mount embryos. mCherry::Pio shows a Pio-characteristic ectodermal expression pattern. ep: epidermis, fg: foregut, hg: hindgut, ps: posterior spiracle, ts: tracheal system, sg: salivary glands.
Figure 3—figure supplement 2
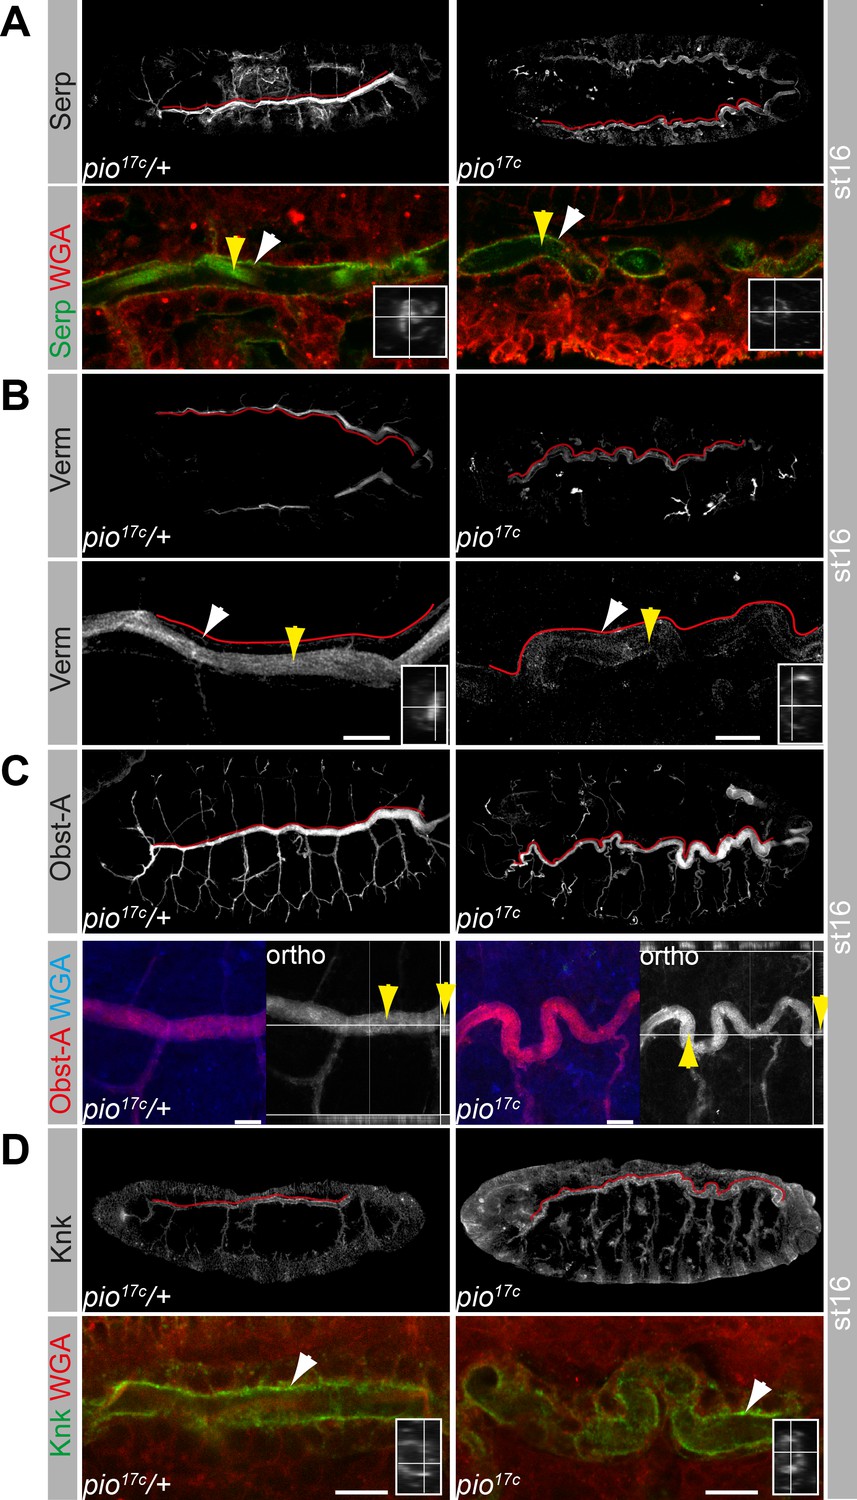
Localization of chitin-matrix proteins in pio mutant embryos.
Confocal images and maximum intensity projections (3D) of pio loss-of-function (right) mutant stage 16 embryos and heterozygous control siblings (left).Yellow arrows point to luminal staining; white arrows to staining at the apical surface. Dorsal trunk is indicated by red line. Scale bars represent 10 µm. (A, B) Serp is shown in green, WGA in red, and single channels in gray. Overview and magnifications of the trachea (lower rows) reveal normal Serp (green) localization in pio mutants. Overview and magnifications of Verm reveal normal Verm (gray) localization within the chitin-matrix of pio mutant embryos. Framed inlays are orthogonal projections showing Serp or Verm within the tracheal lumen. Note the reduced luminal Serp and Verm staining (yellow arrows) in pio mutant embryos when compared to the surface staining (white arrow) and control embryos. (C, D) Z-stack projections of tracheal Obst-A and Knk stainings. Overview (upper) and magnifications (lower rows) reveal normal subcellular Obst-A and Knk localization within the chitin matrix of pio mutant embryos. Framed inlays are orthogonal projections showing Knk within the tracheal lumen when compared with the control embryos. Ortho (in C); orthogonal projection of X and Y axis showing Obst-A within the lumen. Scale bars indicate 10 µm.
Figure 4 with 1 supplement
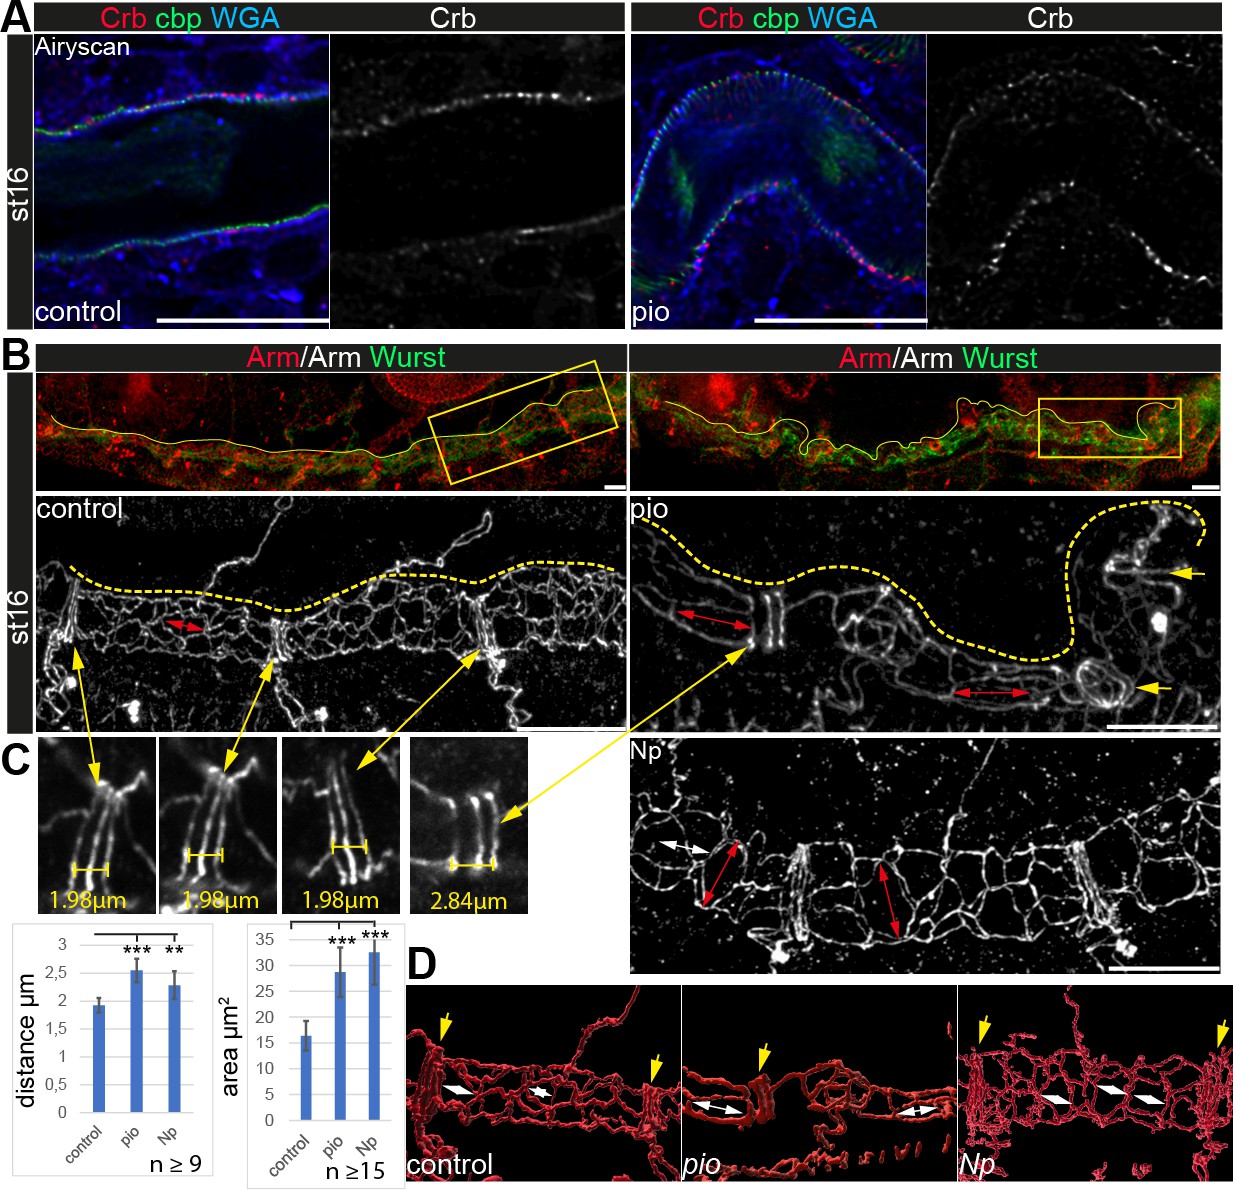
Apical polarity and AJs localization in pio and Np mutant embryos.
Confocal LSM Z-stacks of tracheal dorsal trunk show single layer (A) and 3D projections (B, C) of stage 16 and 17 embryos. (A) Control and pio mutant late-stage 16 embryos show Crb (red) staining at the apical membrane, the cell surface marker WGA (blue), and cbp (green) in the tracheal apical extracellular matrix (aECM) at the apical cell surface and in the luminal cable-like ECM. A single Crb channel is indicated in gray. (B) Maximum intensity projections of confocal Z-stacks of control and pio mutant late-stage 16 embryos and Np mutant early stage 17 embryo. Upper panels show immunostainings with Armadillo (red) and Wurst (green) at the dorsal tracheal trunk. Yellow dashes mark the tracheal tube. Magnifications of the framed regions in the top panel show Armadillo staining in gray (bottom). Red double arrows indicate tracheal cells. Yellow arrows point to AJs of fusion cells. (C) Yellow double arrows point to magnifications of the Armadillo staining of dorsal trunk fusion cells. The distance of AJs of fusion cells in control, pio, and Np mutant embryos are indicated in representative images. Plots show AJ distances of fusion cells (n>9) in µm and apical cell area in µm2 (n>15). Bars represent ± SD and p-values for AJs distance (pio p=5.8e-5; Np p=0.0022) and cell area (pio p=1.6e-6, Np p=2,5e-10), unpaired t-test. (D) 3D reconstruction (Imaris surface rendering) of confocal Armadillo immunostainings marking the AJs of control, pio, and Np mutant embryos. Yellow arrows point to AJs of fusion cells; white double arrows indicate cell length in the axial direction.
-
Figure 4—source data 1
Pattern of adherens junctions in dorsal trunk fusion cells in stage 16 pio mutant embryo and quantifications.
- https://cdn.elifesciences.org/articles/91079/elife-91079-fig4-data1-v1.zip
-
Figure 4—source data 2
Pattern of adherens junctions in dorsal trunk fusion cells in stage 16 Np mutant embryos.
- https://cdn.elifesciences.org/articles/91079/elife-91079-fig4-data2-v1.zip
-
Figure 4—source data 3
Quantification of pattern of adherens junctions in dorsal trunk fusion cells.
- https://cdn.elifesciences.org/articles/91079/elife-91079-fig4-data3-v1.zip
Figure 4—figure supplement 1
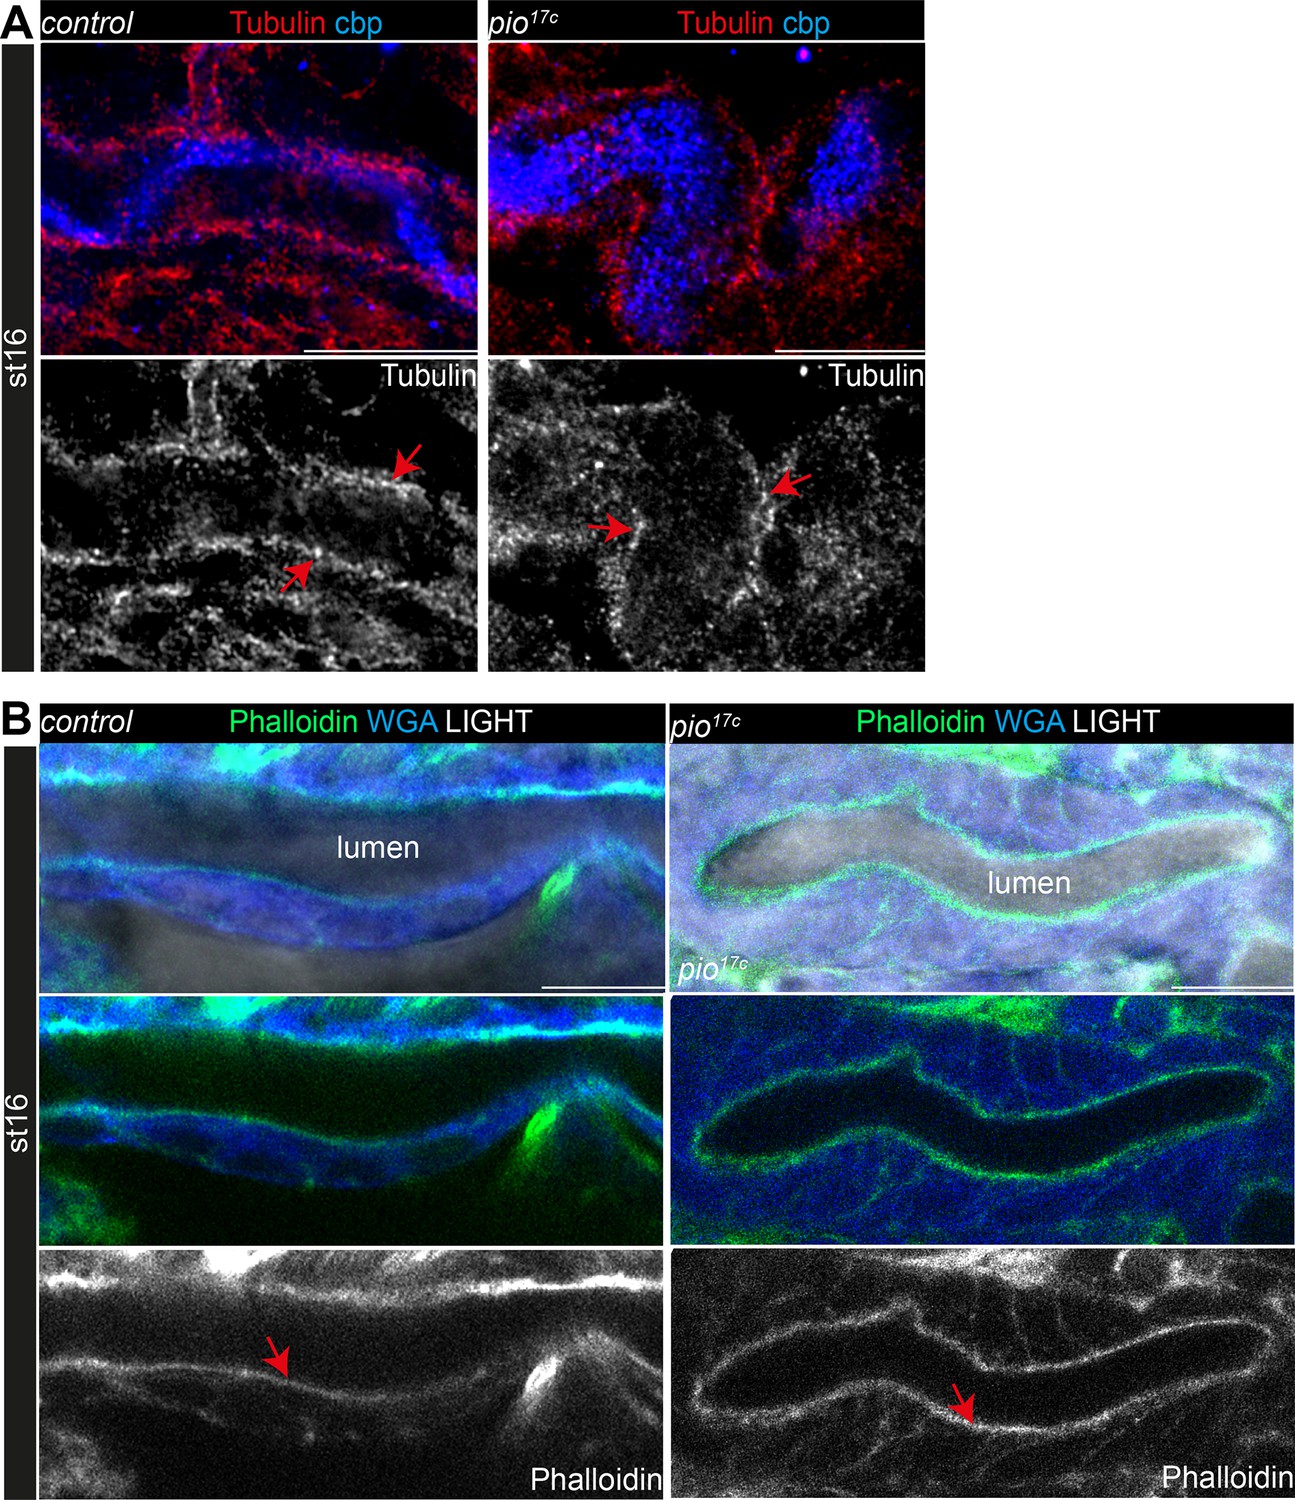
Tubulin and F-actin show normal distribution in pio null mutant embryos.
(A) Confocal images show tubulin in red staining and chitin (cbp) in blue. Single tubulin channels are indicated in gray below. Arrows point to cortical enrichment of tubulin in dorsal trunk cells of stage 16 control and pio mutant embryos. (B) Confocal images of phalloidin conjugated with Alexa488 in green and WGA stainings in blue. The transmission light is indicated in gray in the upper panel images. Middle panels show phalloidin and WGA. Single phalloidin channels are indicated in gray in the lower panel. Arrows point to cortical enrichment of F-actin in dorsal trunk cells of stage 16 control and pio mutant embryos. Scale bars represent 10 µm.
Figure 5 with 5 supplements
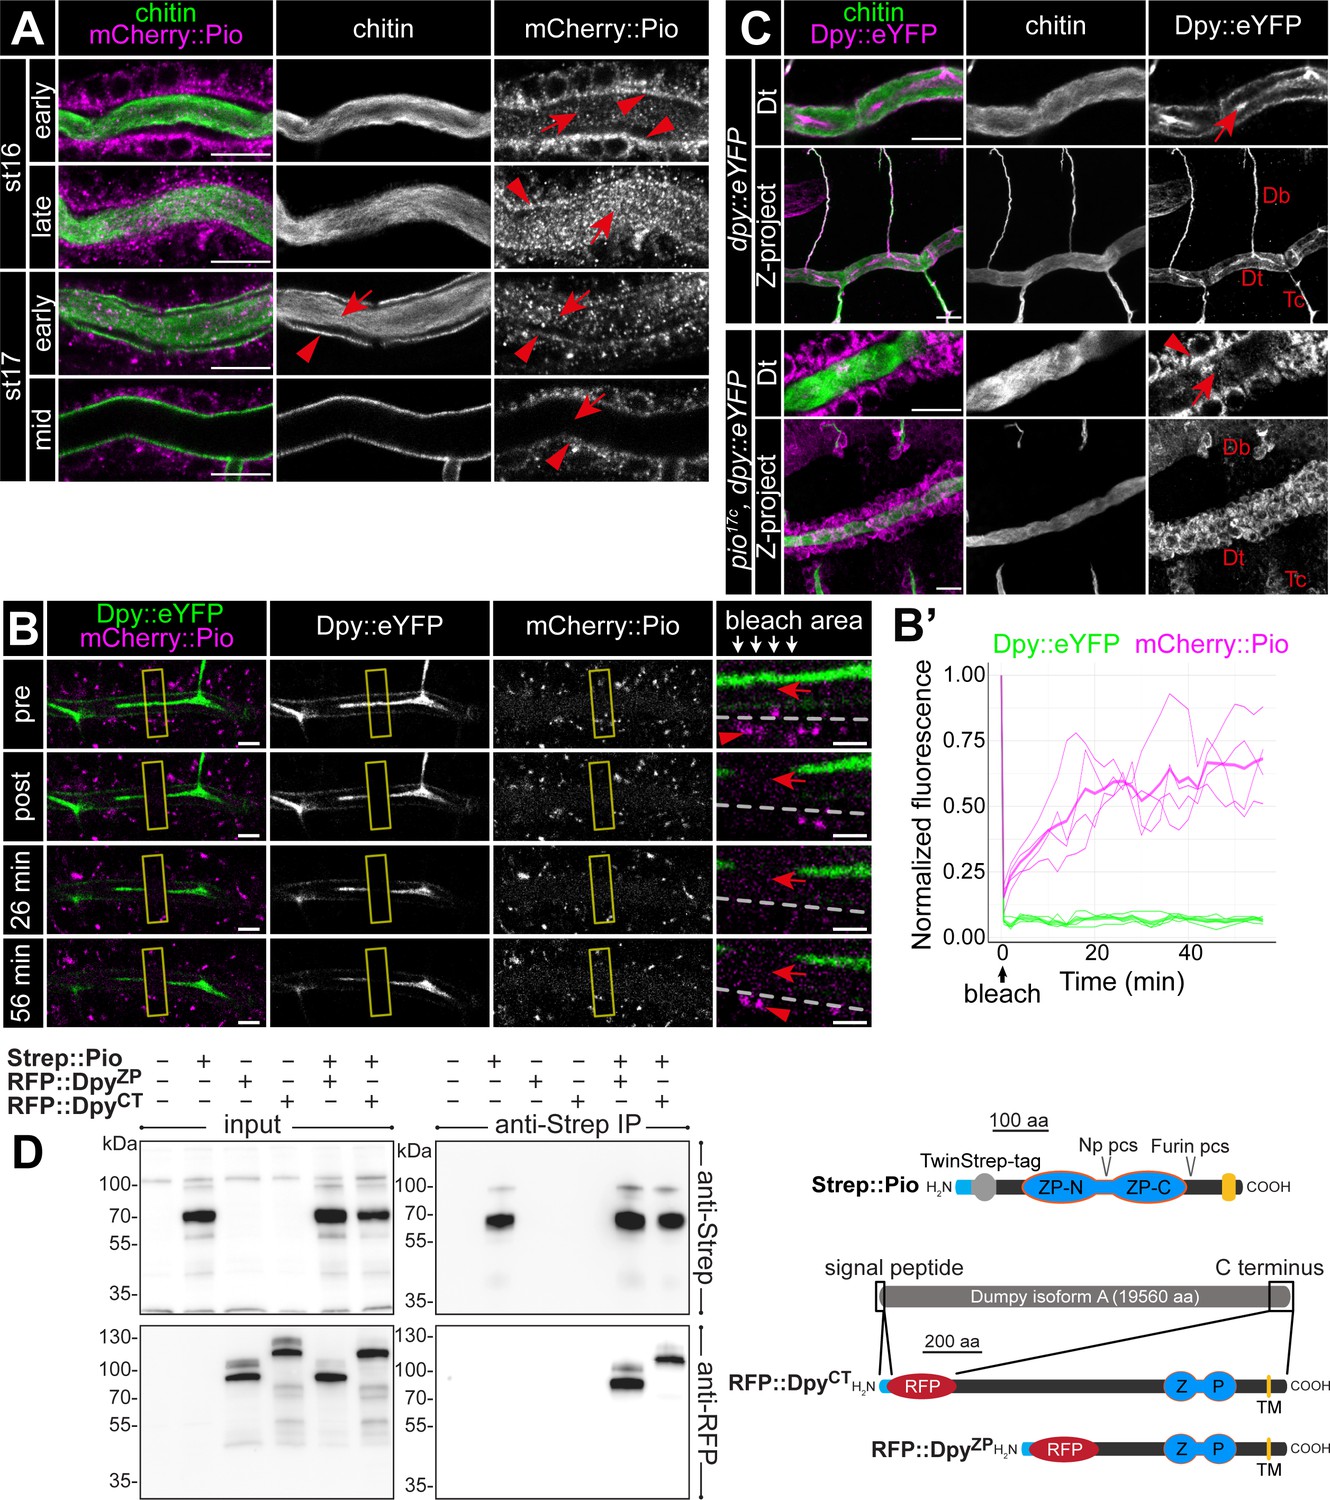
Pio is dynamically localized at the membrane and controls Dumpy secretion.
(A) Confocal LSM images of dorsal trunks of embryos with endogenous mCherry:: Pio expression stained with anti-mCherry antibody (magenta) and cbp (chitin; green) at indicated embryonic stages. In early stage 16 embryos, mCherry:: Pio enriches apically (arrowheads) and is present in the lumen (arrow). In contrast, at the end of stage 16 mCherry::Pio predominantly localizes within the tracheal lumen (arrows). The luminal mCherry:: Pio staining disappeared during stage 17. (B, B’) Confocal images of a representative fluorescence recovery after photobleaching (FRAP) experiment (n=4) in a live embryo with endogenous expression of Dpy::eYFP and mCherry::Pio and quantification of normalized fluorescence in the bleached area of n=4 embryos (right) are shown. Yellow frames indicate the bleached area. Close-ups (right-most images) show details of the bleached area (below arrows in header). The dashed line indicates apical cell membranes, red arrows indicate luminal mCherry::Pio, and red arrowheads indicate intracellular or membrane-associated mCherry::Pio. A representative movie of an FRAP experiment is presented in Movie S2. Fluorescence intensities refer to the bleached regions of interest (ROIs) as indicated with the frame in corresponding Movie S2 and was measured after correction for embryonic movements. The mCherry::Pio (magenta) reveals recovery of small Pio puncta in the bleached area including the tracheal lumen, while Dpy::eYFP (green) shows no recovery even after 56 min. Scale bars indicate 5 µm in overview panels and 2 µm in bleach close-ups. (C) Confocal LSM images of endogenous expression of Dumpy:eYFP stained with anti-GFP antibody. The wt-like stage 16 control embryos show extracellular Dumpy:eYFP (magenta) in the apical extracellular matrix (aECM) at the cell surface and in the luminal cable (arrow) overlapping with cbp (chitin; green). In contrast, in pio mutant embryos Dumpy::eYFP did not overlap with chitin (cbp, green), but remained intracellularly (arrowhead). Upper rows focus on the dorsal trunk, lower rows show 3D maximum intensity projections of whole tracheal segments. Note the dorsal branch disruption known from hypomorphic pio point mutation allele (Jaźwińska et al., 2003). Single channels are indicated in gray. Db, dorsal branch; Dt, dorsal trunk; Tc, transverse connective. Scale bars indicate 10 µm. (D) Immunoblotting of co-immunoprecipitation (Co-IP) assay of RFP-tagged Dpy constructs and Strep-tagged Pio expressed in Drosophila S2R+ (Schneider) cells reveals binding of Dpy and Pio. Schemata of expressed proteins used in the assay are shown on the right. Strep::Pio is the full-length Pio protein with a Twin-Strep tag inserted C-terminal to the signal peptide (light blue). RFP::DpyZP and RFP::DpyCT both contain the endogenous Dpy signal peptide (light blue) followed by mCherry (RFP) and different length of the C-terminal region of the Dpy isoform A protein as indicated. Transmembrane (TM) domains (yellow), ZP domains (blue), and Furin and Np protease cleavage sites (pcs) in Pio are indicated. Western blots of input cell lysates (left) and anti-Strep IP elutions (right) stained with anti-Strep (top) and anti-RFP (bottom) antibodies are shown. Both RFP::Dpy proteins are only detectable in IP elutions when they were co-expressed with Strep::Pio.
-
Figure 5—source data 1
Confocal Z-stack images of dorsal trunk showing mCherry::Pio expression during stages 16 and 17 of embryogenesis.
- https://cdn.elifesciences.org/articles/91079/elife-91079-fig5-data1-v1.zip
-
Figure 5—source data 2
Confocal Z-stack images of dorsal trunk showing mCherry::Pio expression during late stages 16.
- https://cdn.elifesciences.org/articles/91079/elife-91079-fig5-data2-v1.zip
-
Figure 5—source data 3
Confocal Z-stack images of dorsal trunk showing mCherry::Pio expression during early stage 17.
- https://cdn.elifesciences.org/articles/91079/elife-91079-fig5-data3-v1.zip
-
Figure 5—source data 4
Confocal Z-stack images of dorsal trunk showing mCherry::Pio expression during mid stage 17.
- https://cdn.elifesciences.org/articles/91079/elife-91079-fig5-data4-v1.zip
-
Figure 5—source data 5
Confocal Z-stack images of dorsal trunk showing Dpy::YFP expression in control and pio mutant embryos.
- https://cdn.elifesciences.org/articles/91079/elife-91079-fig5-data5-v1.zip
-
Figure 5—source data 6
Confocal Z-stack images of dorsal trunk showing Dpy::YFP expression in pio mutant embryos.
- https://cdn.elifesciences.org/articles/91079/elife-91079-fig5-data6-v1.zip
-
Figure 5—source data 7
Uncropped western blots.
- https://cdn.elifesciences.org/articles/91079/elife-91079-fig5-data7-v1.pdf
Figure 5—figure supplement 1
The mCherry::Pio shows localization at the apical cell surface and in the tube lumen.
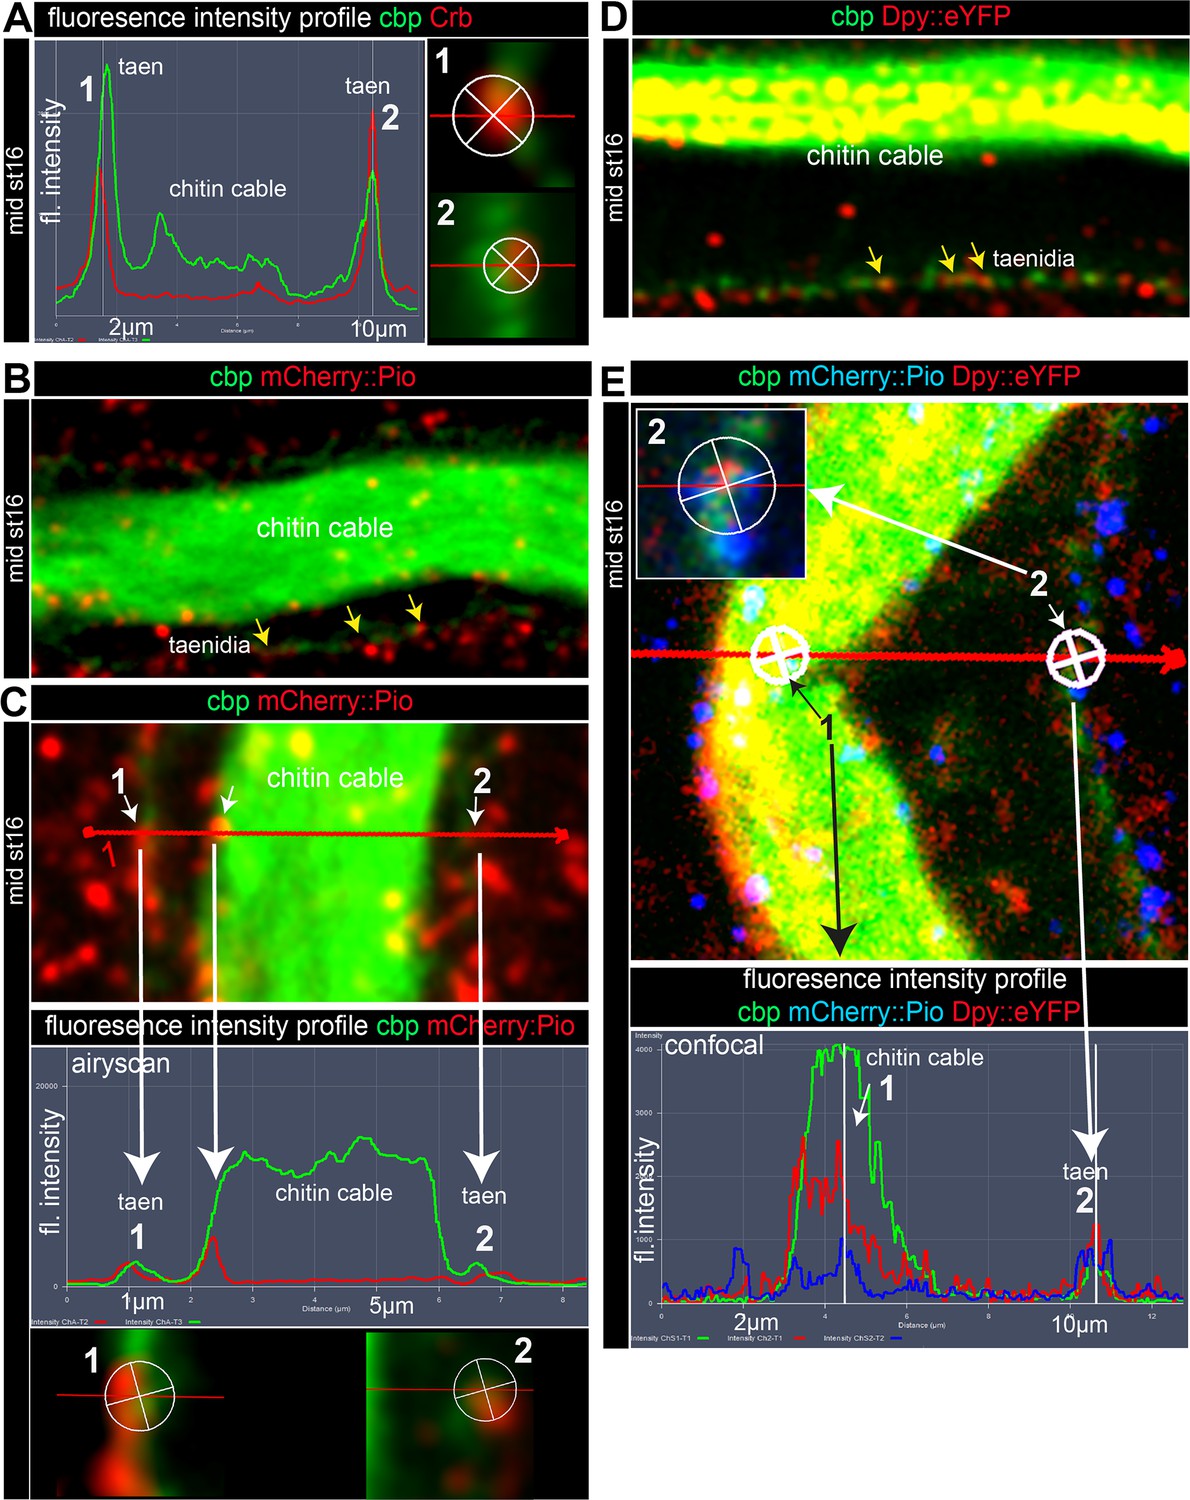
(A) Confocal images of cbp (chitin, green) and Crb (red) antibody stainings in stage 16 embryos analyzed with the ZEN profile tool. The cbp stained chitin of taenidial folds overlap with Crb, which marks the apical cell surface. Focusing across the tube lumen revealed the overlapping peak fluorescence intensities of taenidial fold marked cbp (red) with Crb staining. Numbers ‘1’ and ‘2’ indicate Crb peak levels at the apical cell membrane and responding cbp peaks at the cell surface. Close-ups of confocal images of areas ‘1’ and ‘2’ are shown right. (B) Red arrows point to punctuate mCherry::Pio staining which overlaps with cbp at the apical cell surface. The repeating cbp pattern indicates the area of mCherry::Pio overlap belongs to the taenidial folds at the dorsal trunk cells of stage 16 embryos. This pattern resembles the Pio antibody staining. Further, punctuate mCherry::Pio staining overlaps with cbp in the chitin cable. Also, Pio antibody stainings overlap with the chitin cable, but appears enriched in a core-like structure. (C) Confocal image and the corresponding fluorescence intensity profile (ZEN). White arrows point to mCherry::Pio puncta and corresponding fluorescence intensity peaks overlapping with the cbp at the apical cell surface (‘1’ and ‘2’). The distance is indicated in µm at the X axis and fluorescence intensities at the Y axis. Lowe panel images show close-up of the areas where mCherry::Pio puncta overlap with cbp at the cell surface. (D) Arrows point to punctuate Dpy::eYFP (red) staining that overlaps with cbp (green) at the apical cell surface where taenidial folds form. (E) Apical punctuate Dpy::eYFP (red) staining overlaps with mCherry::Pio (blue) and cbp (green) staining at taenidial folds at the apical cell surface (‘2’) and at the luminal chitin cable (‘1’) in the confocal image of a stage 16 embryo. The corresponding fluorescence intensity profile across the dorsal trunk tube lumen (indicated by the red line in the image) is shown below and a close-up of the apical cell surface is show in inset. The Dpy::eYFP (red), mCherry::Pio (blue), and cbp fluorescence intensity peaks overlap in ‘2’ at the taenidial fold at the cell surface and in ‘1’ in the chitin cable. Distances are indicated in µm at the X axis and fluorescence intensity at the Y axis.
Figure 5—figure supplement 2
Pio is involved in Dpy secretion and Notopleural and Matriptase activity controls Pio localization.
(A) Confocal images of single or co-expression of FLAG-tagged Pio, and RFP-tagged Dpy C-terminal region (ZPD domain, transmembrane domain, cytoplasmic region) in the Drosophila S2R+ (Schneider) cells. Single FLAG-tagged Pio expression reveals Flag::Pio staining at the cell surface. Singly RFP-tagged Dpy expression revealed predominant intracellular staining of RFP::Dpy. Co-expression of FLAG-tagged Pio and RFP-tagged Dpy revealed predominant RFP::Dpy staining at the cell surface co-localizing with Flag::Pio. See Figure 4 for a schematic representation of the expressed recombinant proteins. Here, the RFP::DpyZP construct was used but the same results were also observable with the RFP::DpyCT construct (not shown). (B) Live cell confocal images show UAS/Gal4-mediated GFP (green) and mCherry::Pio (magenta) expression in Drosophila Kc167 cells. Control cells (left panel) reveal mCherry::Pio signals predominantly at the cell surface (arrowhead). Upon co-expression of Np or Matriptase, cell surface mCherry::Pio signal was lost (middle panels). The co-expression of the catalytical inactive NpS990A mutant did not affect extracellular mCherry::Pio signals (arrowhead, right panel).
Figure 5—figure supplement 3
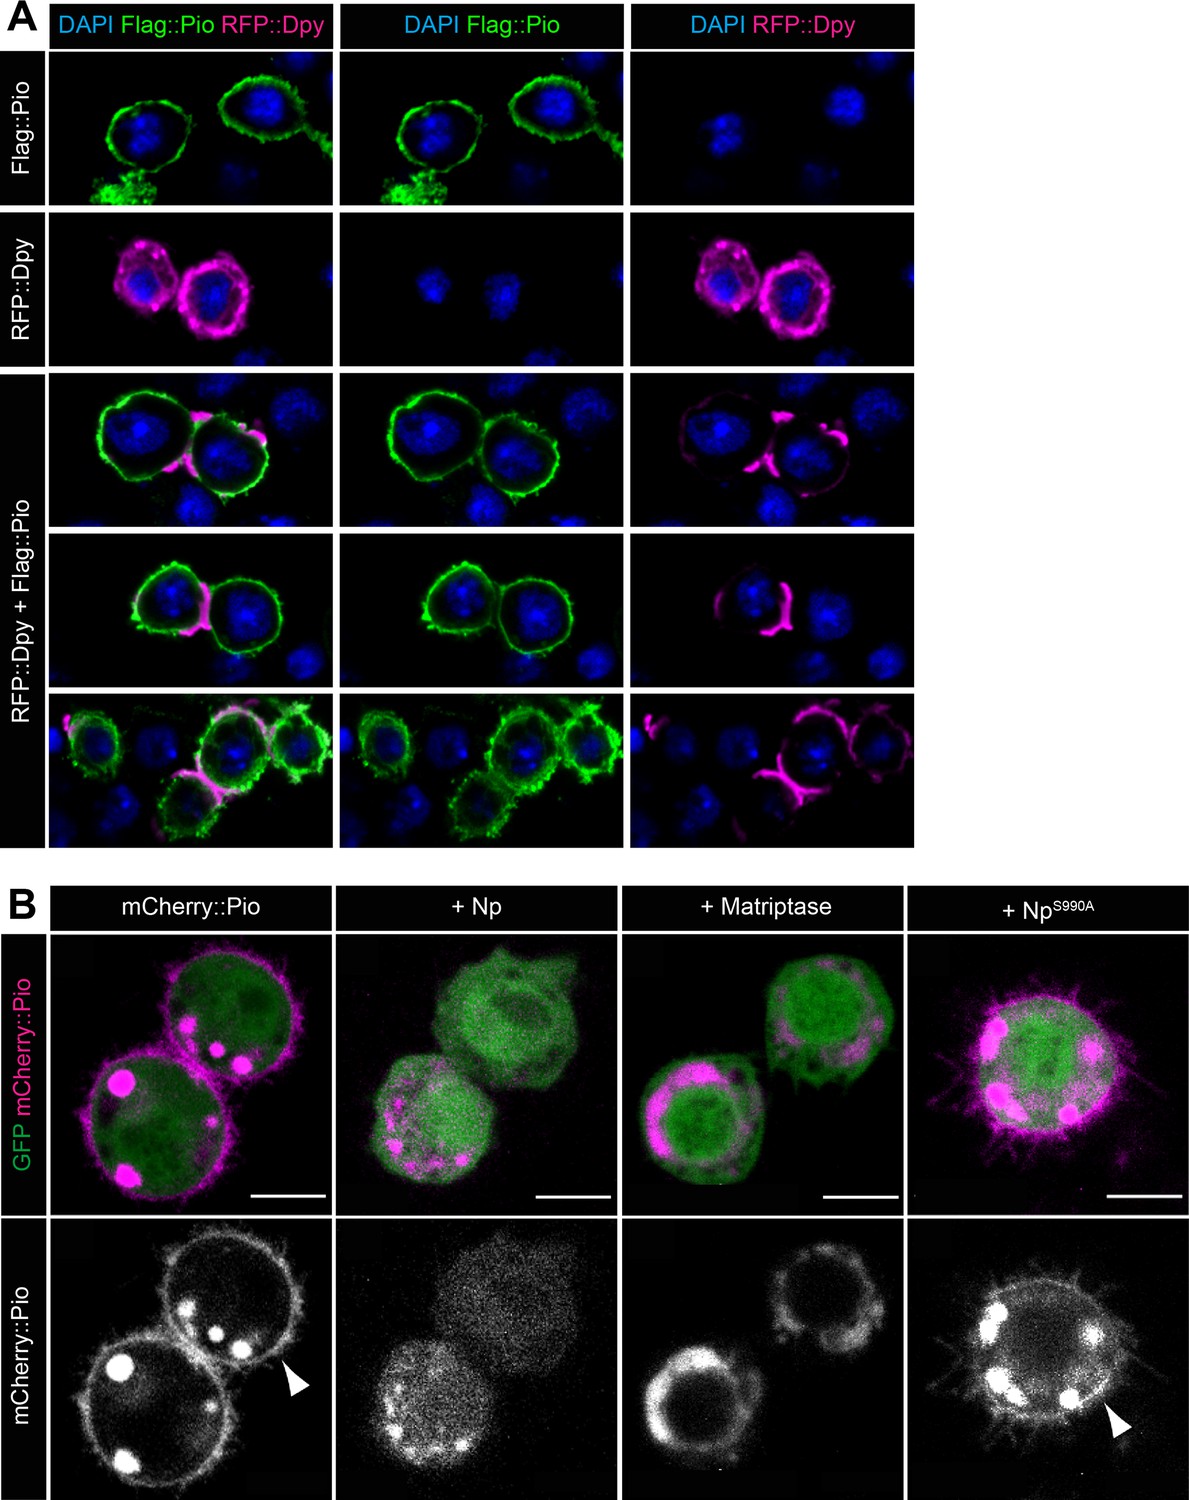
Tracheal phenotypes and Pio mislocalization in dpy mutant embryos Airyscan images (left), orthogonal (middle) and 3D projections (right) of of late-stage 16 dpyolvr mutant embryos (n=8).
(A) Dorsal view of dorsal trunks tubes. Chitin (cbp) is visualized in green (left) and gray (middle) and Pio antibody staining in red and gray (right). The mutant embryo showed characteristic dorsal branch disintegration (white arrows point). In contrast to control (see Figure 2), Pio staining did not enrich in a core cable-like structure. (B) 3D projection shows the sinusoidal tube and unusual bulge-like apical cell membrane deformations (yellow arrows) stained with Uif. Yellow frame covers a bulge, which is analyzed in close-up in C. (C) The orthogonal projection of the Uif-marked membrane deformation (frame in B) shows strong Pio staining (red) at the tip of the bulging membrane. Uif is marked in green and chitin in blue. Note the collapsed tube lumen. (D) Fluorescence intensity profile across the tube lumen of a stage 16 dpyolvr mutant dorsal trunk shows Pio (red) speak fluorescence intensities overlapping with Uif (green) peaks but not with luminal chitin-cable (blue) observed in control (see Figure 2—figure supplement 2). (E) Airyscan image of stage 16 embryo dorsal trunk shows that punctuate Pio (red) staining is not enriched in a central core chitin structure (green).
Figure 5—video 1
Confocal time-lapse movie of endogenously expressed Dpy::eYFP (magenta) and mCherry::Pio (green) in wt.
The wt shows tracheal Pio and Dumpy localization in the dorsal trunk from stage 16 until mid of stage 17. The mCherry::Pio dynamic trafficking reveals ongoing secretion, apical localization, and subsequent shedding into the tubular lumen. Dpy::eYFP shows static luminal localization and undergoes degradation during stage 17. In Np mutant embryo, mCherry::Pio shows intracellular and apical localization but no luminal shedding. The Dpy::eYFP shows static luminal localization but is not degraded during tracheal maturation. Images were obtained every 10 min.
Figure 5—video 2
Representative confocal time-lapse movie of a fluorescence recovery after photobleaching (FRAP) experiment in a wt control embryo with endogenous expression of Dpy::eYFP (green) and mCherry::Pio (magenta).
The bleached area is indicated by a white box. The first frame is before bleaching and subsequent images were obtained every 2 min as indicated in the middle panel. mCherry::Pio shows fast recovery in the tube lumen already after 2 min and steady recovery of intracellular foci during the 56 min time lapse. Luminal Dpy::eYFP shows no recovery in the bleached area.
Figure 6 with 3 supplements
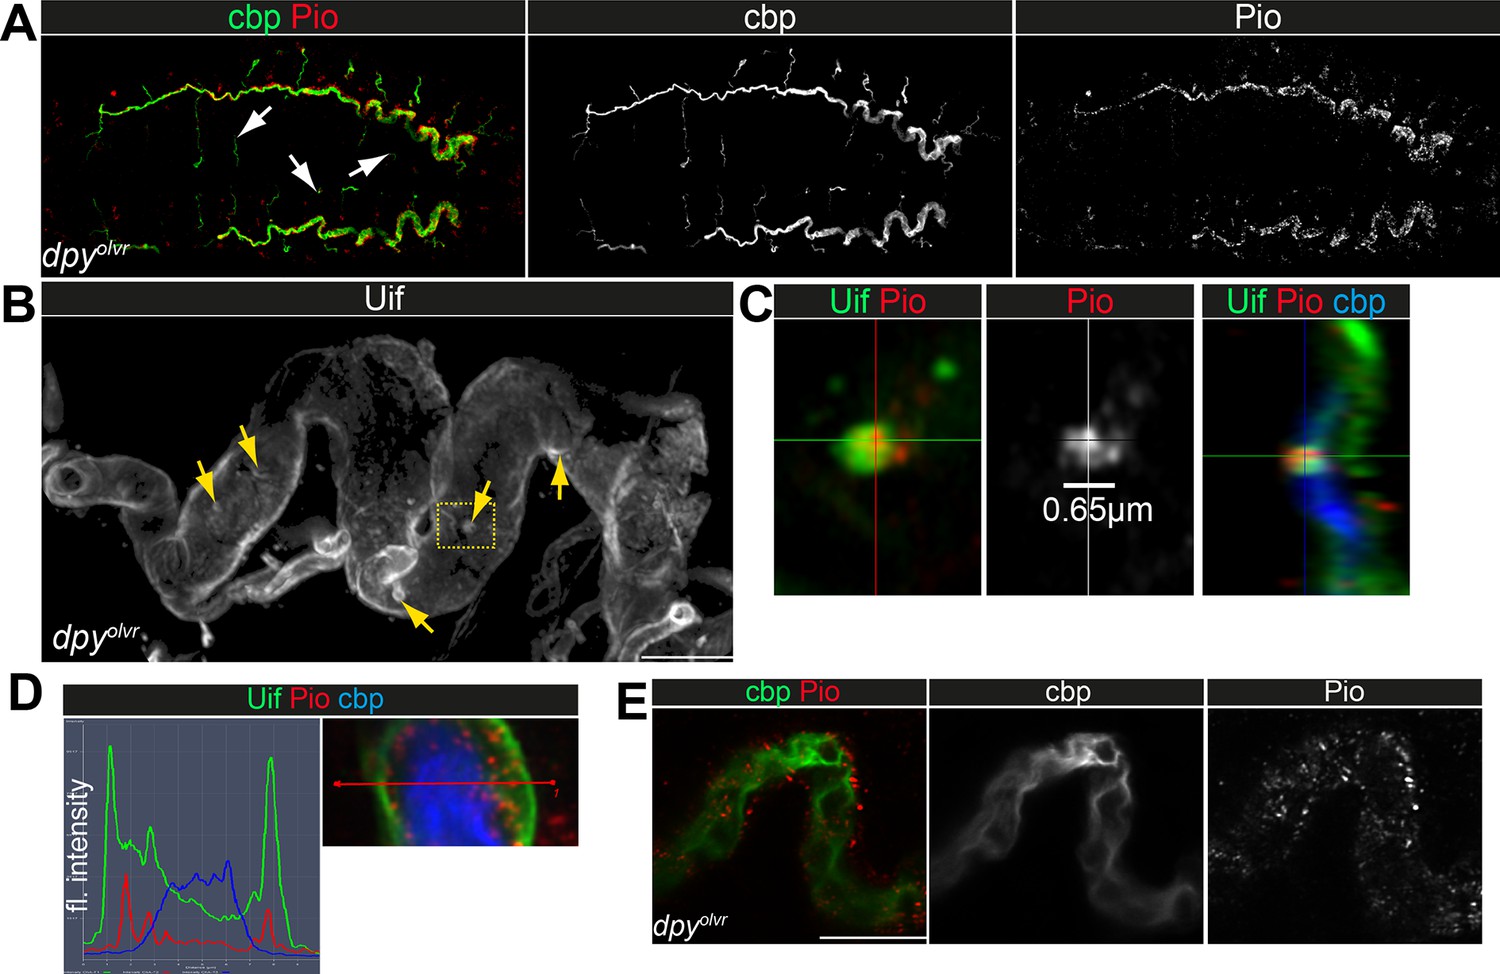
Np-mediated ZP domain shedding controls Pio dynamics at the apical cell membrane.
(A) Left: Immunoblot of protein lysates from embryos of stages 16 and 17 stained with anti-mCherry antibody show three specific bands in samples from mCherry::Pio expressing embryos. Middle: Schematic presentation of the mCherry::Pio fusion protein with signal peptide (light blue), mCherry (red), ZP domain (blue), and transmembrane domain (yellow). Furin and Np protease cleavage sites (pcs) and expected molecular weights of resulting fragments are indicated. Right: Proportional intensity of the Np-cleaved 60 kDa mCherry::Pio fragment to the whole signal from all three mCherry::Pio fragments normalized to β-tubulin intensity. Data from three biological replicates show that proteolytic processing of mCherry::Pio at the Np cleavage site is highly increased in stage 17 embryos compared to stage 16 embryos in wt genetic background. This difference is not detectable in samples from Np mutant embryos. The endogenous Pio protein has a calculated mass of about 50.82 kDa. (B) Cleavage assay within the Pio ZP domain is mediated by proteolytic activity of Np and the human Matriptase. Immunoblotting of cell lysates and supernatant precipitates from Drosophila S2R+ cells expressing mCherry::Pio alone or together with Np, catalytically inactive NpS990A or human Matriptase with anti-mCherry antibody. Np and human Matriptase cleave mCherry::pio, causing shedding of the mCherry::Pio extracellular domain and a substantial increase of the 60 kDa mCherry::Pio, which correlates in size with cleavage at the ZP domain, in cell culture supernatants. This effect is not observable for catalytically inactive NpS990A. (C) Confocal images of a representative fluorescence recovery after photobleaching (FRAP) experiment in a live Np mutant embryo with endogenous expression of Dpy::eYFP and mCherry::Pio and quantification of normalized fluorescence in the bleached area (yellow frames) of n=4 embryos (right) are shown. Close-ups (right-most images) show details of the bleached area (below arrows in header). The dashed line indicates apical cell membranes, arrowheads indicate intracellular or membrane-associated mCherry::Pio. Arrowhead points mCherry::Pio at the apical cell surface in the untreated area. Representative movie of the FRAP experiments is presented in Figure 6—video 1 (Np mutant), compare with Figure 5—video 2 (wt). The fast recovery of small mCherry::Pio puncta in the tracheal lumen is impeded in Np mutant embryos (compare with wt in Figure 4D). As in wt embryos, Dpy::eYFP (green) shows no recovery even after 56 min. Scale bars indicate 5 µm in overview panels and 2 µm in bleach close-ups. (D) Confocal images of tracheal dorsal trunks of Np mutant embryos with endogenous expression of mCherry::Pio at indicated developmental stages stained with cbp (chitin; green) and anti-mCherry antibody (magenta). Single channels are indicated in gray. Stage 16 Np mutant embryos show intracellular mCherry::Pio at the apical cell surface (arrowhead), which is similar to control embryos (see Figure 4A). In contrast to control embryos, the luminal mCherry::Pio (arrow) is strongly reduced in stage 16 and 17 Np mutant embryos, while the non-luminal mCherry::Pio accumulates in stage 17. The luminal chitin cable is degraded normally in Np mutant embryos but does not condense (Drees et al., 2019) during early stage 17 and instead, remains attached to the tracheal cell surface and fills the whole lumen during degradation (compare with control in Figure 5A). The asterisks mark bulges in Np mutant tubes. Note the two layers of chitin visible at the membrane bulges and the adjacent apical extracellular matrix (aECM) indicating disintegration of the tracheal chitinous aECM (see also Figure 6). Scale bars indicate 10 µm. (E) The tracheal trypsin-like S1A Serine transmembrane protease Filzig (Flz) shows high sequence homology to Np (Drees et al., 2019) and acts in processing the lumen matrix (Rosa et al., 2018). Confocal images of dorsal trunks of flz mutant embryos with endogenous expression of mCherry::Pio at indicated developmental stages stained with cbp (chitin; green) and anti-mCherry antibody (magenta). Single channels are indicated in gray. The flz mutant embryos revealed normal Pio expression, luminal shedding, and clearance from airways (compare with wt in Figure 4A). In contrast to Np mutant embryos, the luminal aECM cable condensed during early stage 17 luminal clearance (arrows) as in wt embryos (compare with Np mutant in D and wt in Figure 4A and A). Scale bars indicate 10 µm.
-
Figure 6—source data 1
Confocal Z-stack images of dorsal trunk showing mCherry::Pio expression in Np mutant embryos during stages 16 and 17.
- https://cdn.elifesciences.org/articles/91079/elife-91079-fig6-data1-v1.zip
-
Figure 6—source data 2
Confocal Z-stack images of dorsal trunk showing mCherry::Pio expression in Np mutant late stage 16 embryo.
- https://cdn.elifesciences.org/articles/91079/elife-91079-fig6-data2-v1.zip
-
Figure 6—source data 3
Confocal Z-stack images of dorsal trunk showing mCherry::Pio expression in Np mutant early stage 17 embryo.
- https://cdn.elifesciences.org/articles/91079/elife-91079-fig6-data3-v1.zip
-
Figure 6—source data 4
Confocal Z-stack images of dorsal trunk showing mCherry::Pio expression in Np mutant mid stage 17 embryo.
- https://cdn.elifesciences.org/articles/91079/elife-91079-fig6-data4-v1.zip
-
Figure 6—source data 5
Confocal Z-stack images of dorsal trunk showing mCherry::Pio expression in flz mutant embryos during stages 16 and 17.
- https://cdn.elifesciences.org/articles/91079/elife-91079-fig6-data5-v1.zip
-
Figure 6—source data 6
Confocal Z-stack images of dorsal trunk showing mCherry::Pio expression in flz mutant stage 17 embryo.
- https://cdn.elifesciences.org/articles/91079/elife-91079-fig6-data6-v1.zip
-
Figure 6—source data 7
Uncropped western blots (Figure 6A).
- https://cdn.elifesciences.org/articles/91079/elife-91079-fig6-data7-v1.pdf
-
Figure 6—source data 8
Uncropped western blots (Figure 6B).
- https://cdn.elifesciences.org/articles/91079/elife-91079-fig6-data8-v1.pdf
Figure 6—figure supplement 1
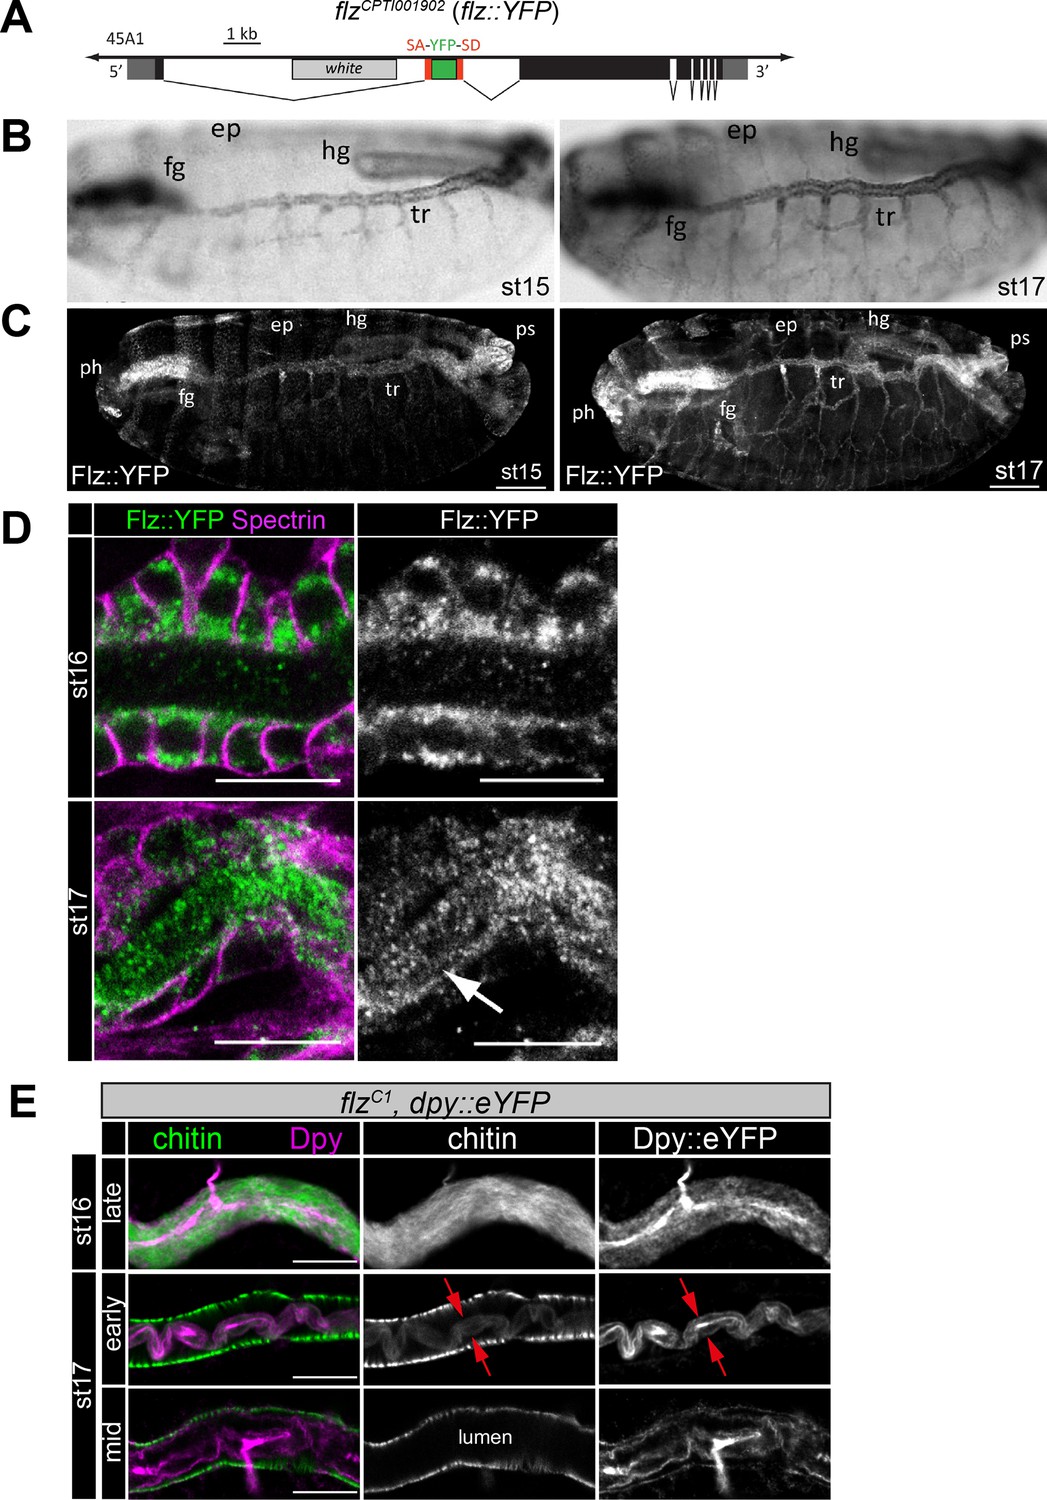
The tracheal expression and localization of the serine protease Filzig (Flz).
(A) The flz allele includes YFP coding sequence (green box) flanked by splice acceptor (SA) and donor (SD) sites. (B) Bright-field microscopy of stainings of in situ RNA hybridization of DIG-labeled flz antisense probe. The stage 16 and 17 embryos show tracheal flz RNA expression in ectodermal epithelia (ep, epidermis; fg, foregut; hg, hindgut; tr, trachea). (C,D) Embryonic Flz::YFP expression (C) resembles flz RNA pattern (B). Confocal images of anti-GFP (green) and anti α-Spectrin (magenta) antibody stainings reveal predominant Flz::YFP localization within the tracheal lumen (arrow) of stage 17 embryos but not at stage 16. Scale bars represent 50 µm (C) or 10 µm (D). (E) Confocal images of dorsal trunks of flz mutant stage 16 (upper), early stage 17 (middle), and mid-stage 17 (lower panel) embryos with endogenous expression of Dpy::eYFP stained with anti-GFP antibody (magenta) and cbp (chitin; green). Single channels are indicated in gray. The flz mutant embryos reveal normal Dpy release and extracellular localization but no clearance of luminal Dpy as in wt embryos (see Figure 5—video 1). However, the luminal Dpy and chitin cable condenses (red arrows) during chitin degradation as in wt (compare with Figure 6A). Scale bars represent 10 µm.
Figure 6—video 1
In Np mutant embryo, mCherry::Pio foci are visible intracellularly as in wt, but almost no mCherry::Pio is detectable in the tracheal lumen.
After bleaching, mCherry::Pio shows no recovery in the lumen and only minor intracellular recovery compared to wt. Dumpy:eYFP showed no recovery after bleaching, similar to wt embryos. The scale bar represents 10 µm.
Figure 6—video 2
Confocal time-lapse movie of endogenously expressed Dpy::eYFP (magenta) and mCherry::Pio (green) in Np mutant embryo.
The wt shows tracheal Pio and Dumpy localization in the dorsal trunk from stage 16 until mid of stage 17. The mCherry::Pio dynamic trafficking reveals ongoing secretion, apical localization, and subsequent shedding into the tubular lumen. Dpy::eYFP shows static luminal localization and undergoes degradation during stage 17. In Np mutant embryo, mCherry::Pio shows intracellular and apical localization but no luminal shedding. The Dpy::eYFP shows static luminal localization but is not degraded during tracheal maturation. Images were obtained every 10 min.
Figure 7 with 1 supplement
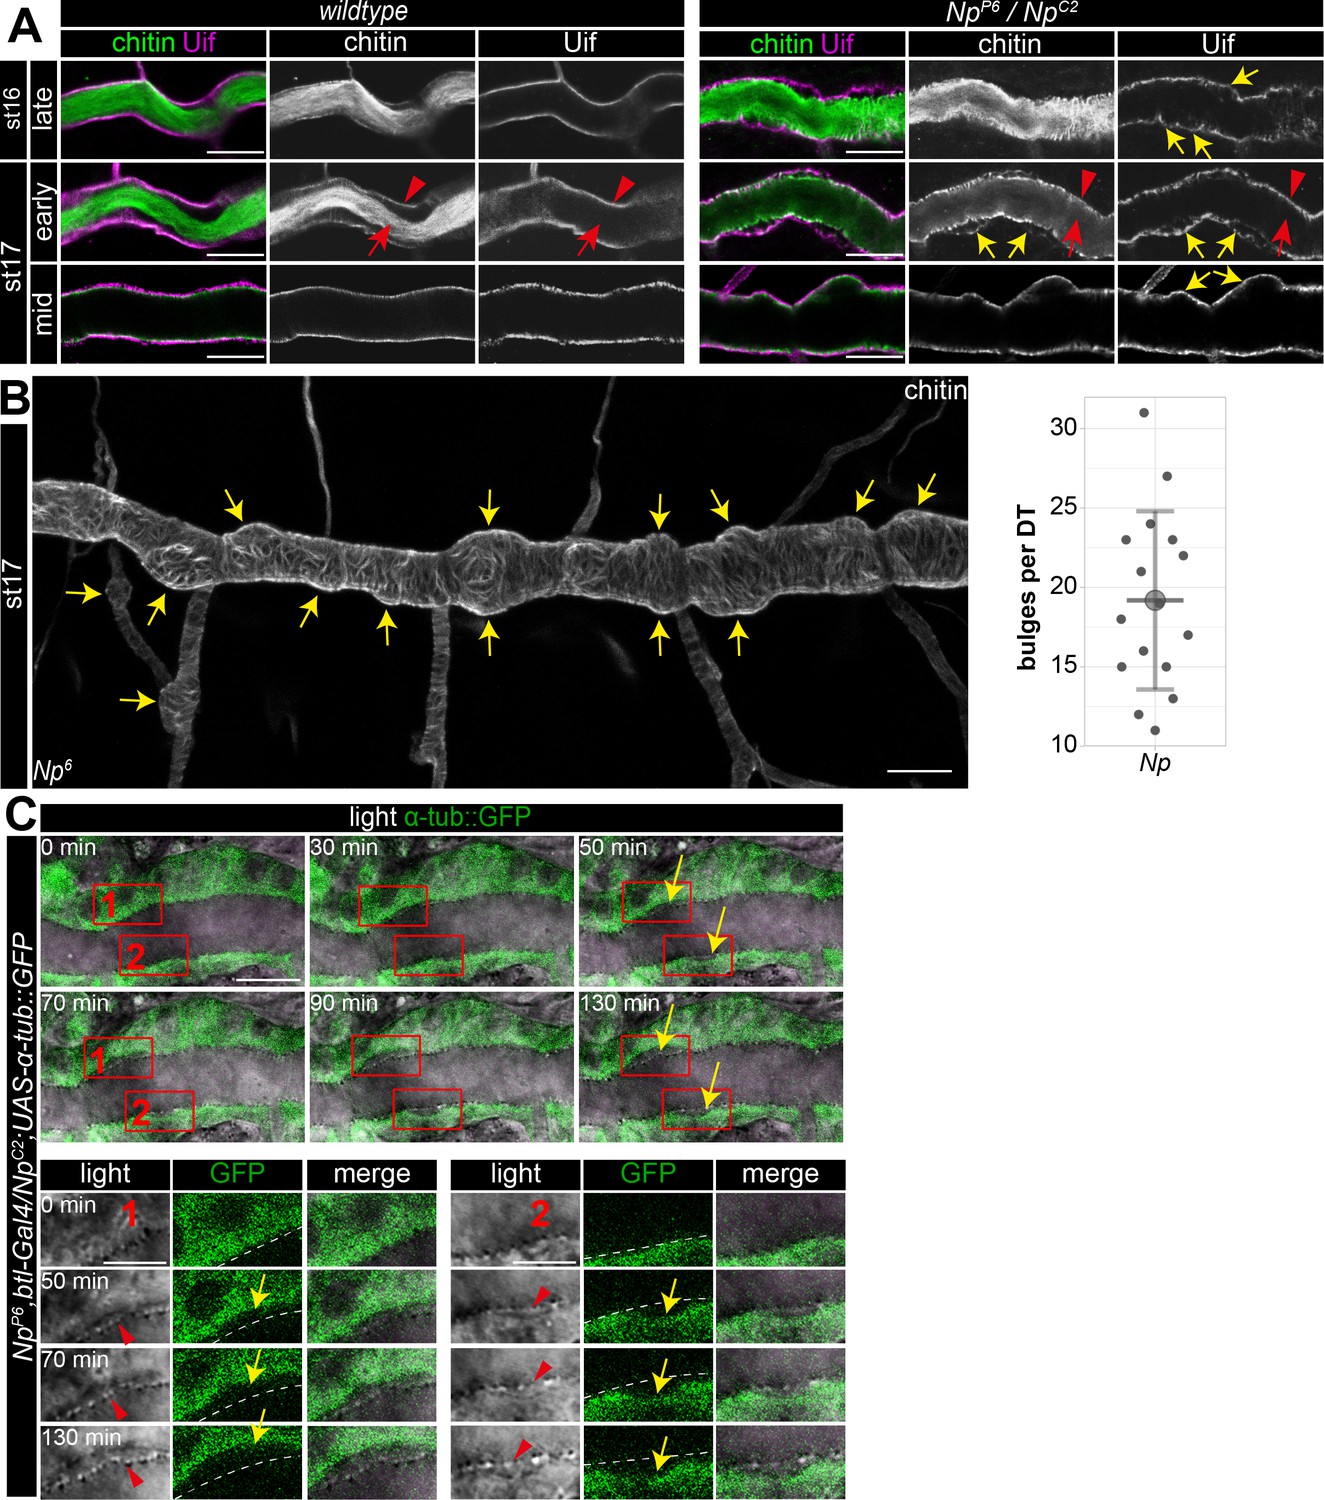
Np supports structural cell membrane integrity.
(A) Bulge-like tracheal apical membrane deformations appeared in Np mutant embryos as stable structures that grow during late stage 16. Confocal images of dorsal trunks of wt embryos and NpP6/NpC2 embryos stained with cbp (chitin; green) and anti-Uif antibody (magenta) as a marker for apical tracheal membranes. (B) Confocal Z-stack projections of cbp staining of stage 17 Np mutant shows several bulges (arrows) at the dorsal trunk. Quantification of bulges per dorsal trunk (n=16) in Np mutants is shown right. (C) The in vivo time-lapse series of 130 min show bulges arising at Np mutant embryos' dorsal trunk cell membranes. Tracheal cells express Tubulin::GFP in transheterozygous NpP6;NpC2 mutant embryos. Frames 1 and 2 are shown as close-ups (below) of forming bulges. The cell membrane of GFP-expressing cells and parts of the misorganized tracheal cuticle apical extracellular matrix (aECM) (dashed line) separate, as shown in the time-lapse. Yellow arrows point to membrane deformations; red arrowheads point to the tracheal cuticle at the apical cell surface, and red arrows to the luminal aECM cable. Note that chitin is detectable in two layers at the sites of bulges, while Uif is detectable only at the bulges, indicating a disintegration of the tracheal chitinous aECM (A). Scale bars are 10 µm (overviews) and 3.5 µm (details). Note that bulges grew as time progressed (up to 130 min).
-
Figure 7—source data 1
Quantification and confocal Z-stack images of bulges at dorsal trunks of Np mutant embryos.
- https://cdn.elifesciences.org/articles/91079/elife-91079-fig7-data1-v1.zip
-
Figure 7—source data 2
Quantification of bulges at dorsal trunks of Np mutant embryos.
- https://cdn.elifesciences.org/articles/91079/elife-91079-fig7-data2-v1.zip
Figure 7—figure supplement 1
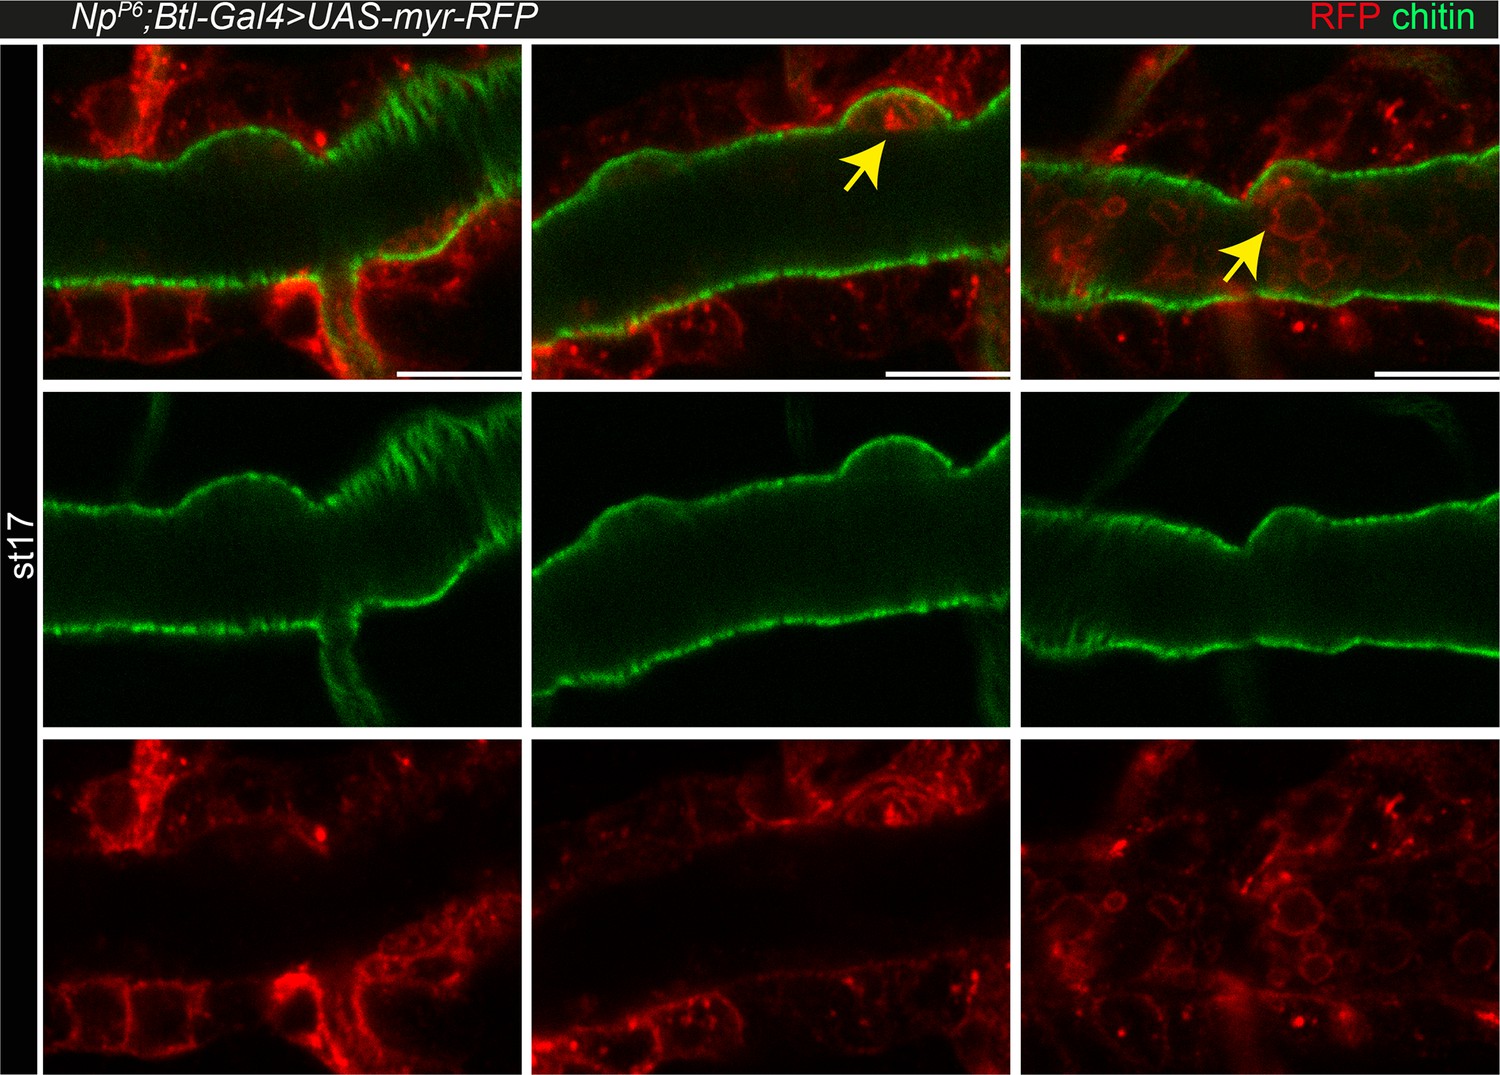
Tracheal expression of myr-RFP in Np mutant embryos.
Confocal images of btl-Gal4-driven expression of UAS-myr-RFP in stage 17 Np mutant embryos. Antibody stainings show RFP (red) and chitin (cbp; green) in mid to late (left to right) stage 17 embryos. Arrows point to unusual luminal RFP staining. The RFP stain was first detected at the apical extracellular matrix (aECM) bulge and subsequently in the tube lumen. This indicates disintegration of apical cell membrane at bulges and subsequent leaking of cellular content into the lumen. Scale bars indicate 10 µm.
Figure 8 with 1 supplement
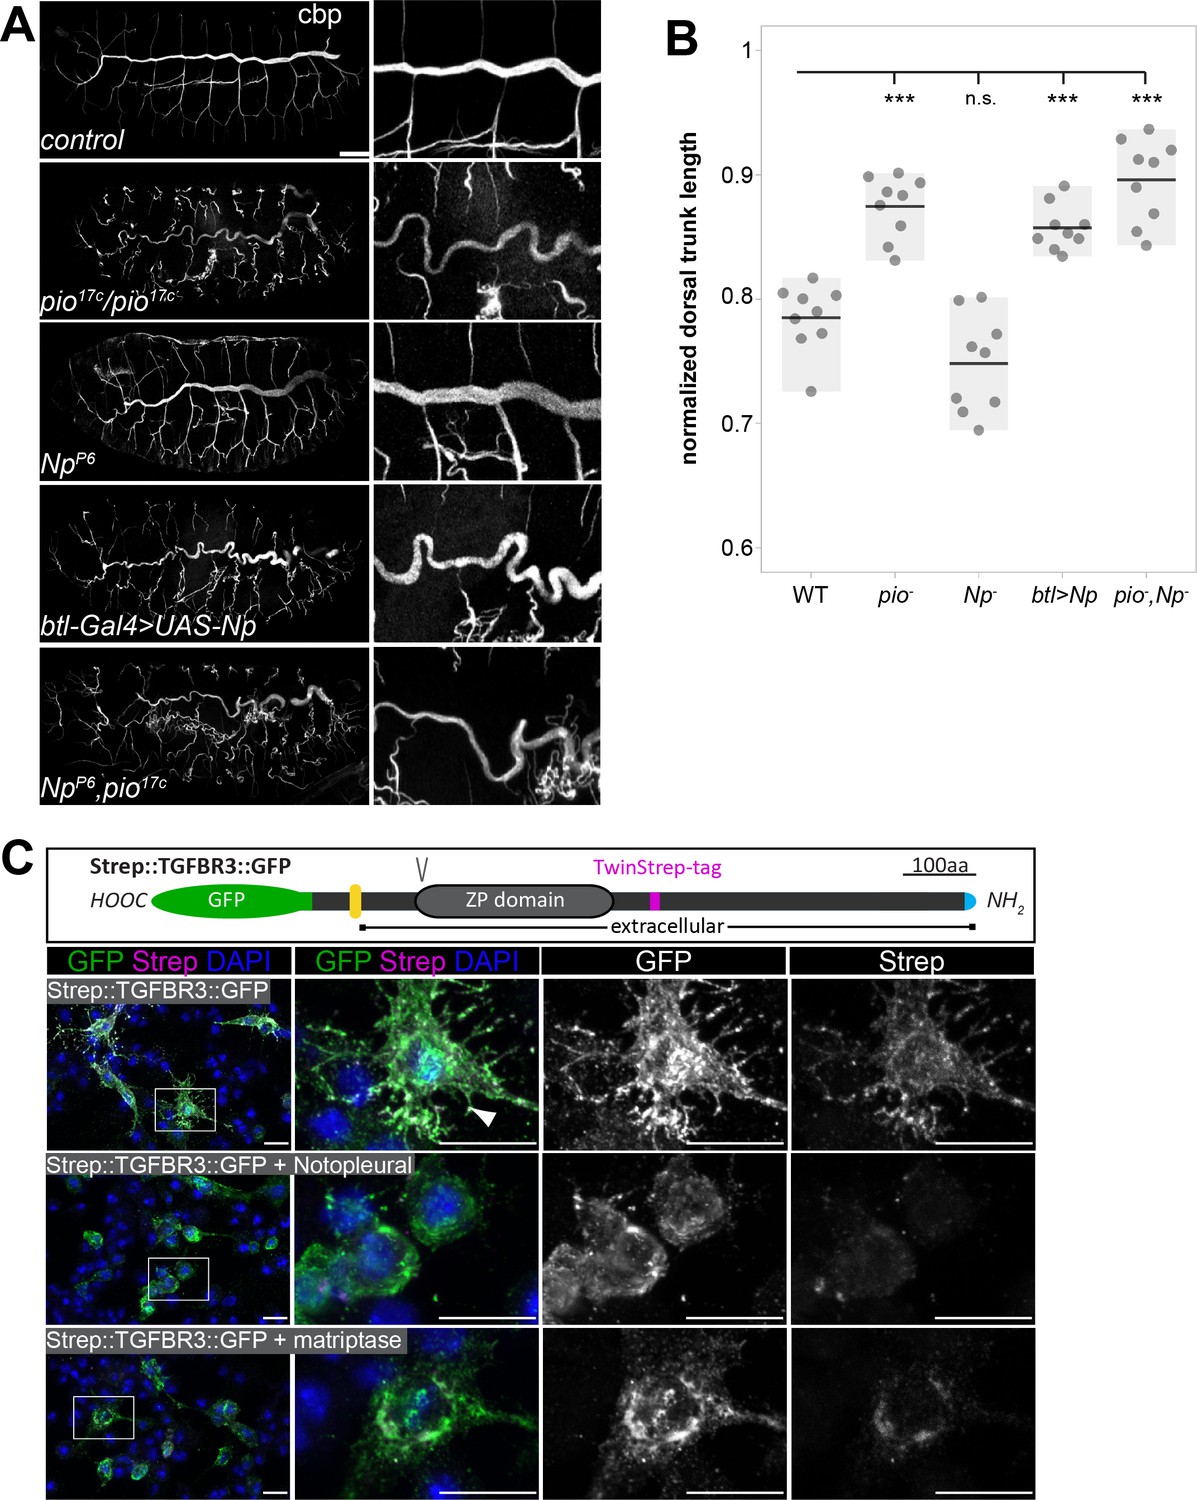
Pio and Np control tube size and their regulatory mechanisms of ZP domain shedding is conserved.
(A) Confocal Z-stack projections of whole-mount stage 16 embryos stained with cbp (chitin) focusing on the tracheal system and close-ups at the right. In contrast to straight branches of control embryos, pio17C null mutant embryos revealed curly elongated tubes indicating excess tube expansion. Note dorsal branch disruption known from a hypomorphic pio point mutation (Jaźwińska et al., 2003). Np mutant embryos show straight wt-like tubes. Embryos that overexpress Np in the tracheal system (btl-Gal4>UAS-Np) show curly elongated tubes and dorsal branch disruption, phenocopying the pio mutant phenotype. Np;pio double mutant embryos do not exacerbate pio mutant tube size defects and show a similar phenotype as pio mutant embryos, respectively. (B) Quantification of normalized dorsal trunk length from 9 stage 16 embryos of each genotype. Anterior-posterior dorsal trunk length was divided by the anterior-posterior length of the embryo. Normalized dorsal trunk length in pio mutant embryos, btl-Gal4>UAS-Np embryos and Np,pio double mutant embryos is significantly increased when compared with wt (p=0.00013, p=0.00007, p=0.00019). Notably, the Np mutant dorsal trunk is relatively straight, while control embryos show slightly convoluted tubes. Also, statistical analysis reveals the tendency of slightly shortened dorsal trunk length in Np mutant. Individual points represent the respective embryos. (C) Human TGFβ type III receptor (TGFβRIII) is a widely expressed ZP domain containing protein. Human TGFβRIII with a cytoplasmic GFP tag and an extracellular Strep tag was expressed in Drosophila S2R+ cells either alone or together with Drosophila Np or human Matriptase. A schema of the tagged TGFβRIII is shown (top). The ZP and transmembrane (yellow) domains, the N-terminal Strep tag (magenta), C-terminal GFP (green) Furin protein cleavage site, (V) and the signal peptide (blue) are indicated. Images display maximum intensity projections of confocal Z-stacks. Shown are S2R+ cells that expressed the Strep::TGFβRIII::GFP construct alone or together with Np or human Matriptase stained with DAPI (blue) anti-GFP (green) and anti-Strep (magenta) antibodies. Single channel panels are indicated in gray. Control cells contain co-localizing GFP and Strep signals. The co-expression of Np or Matriptase reveals strong GFP but faint Strep signals due to extracellular cleavage and shedding of the TGFβRIII ectodomains. Framed boxes in overview images display details in panels on the right side. Scale bars indicate 10 µm.
-
Figure 8—source data 1
Quantification of dorsal trunks lengths.
- https://cdn.elifesciences.org/articles/91079/elife-91079-fig8-data1-v1.zip
Figure 8—figure supplement 1
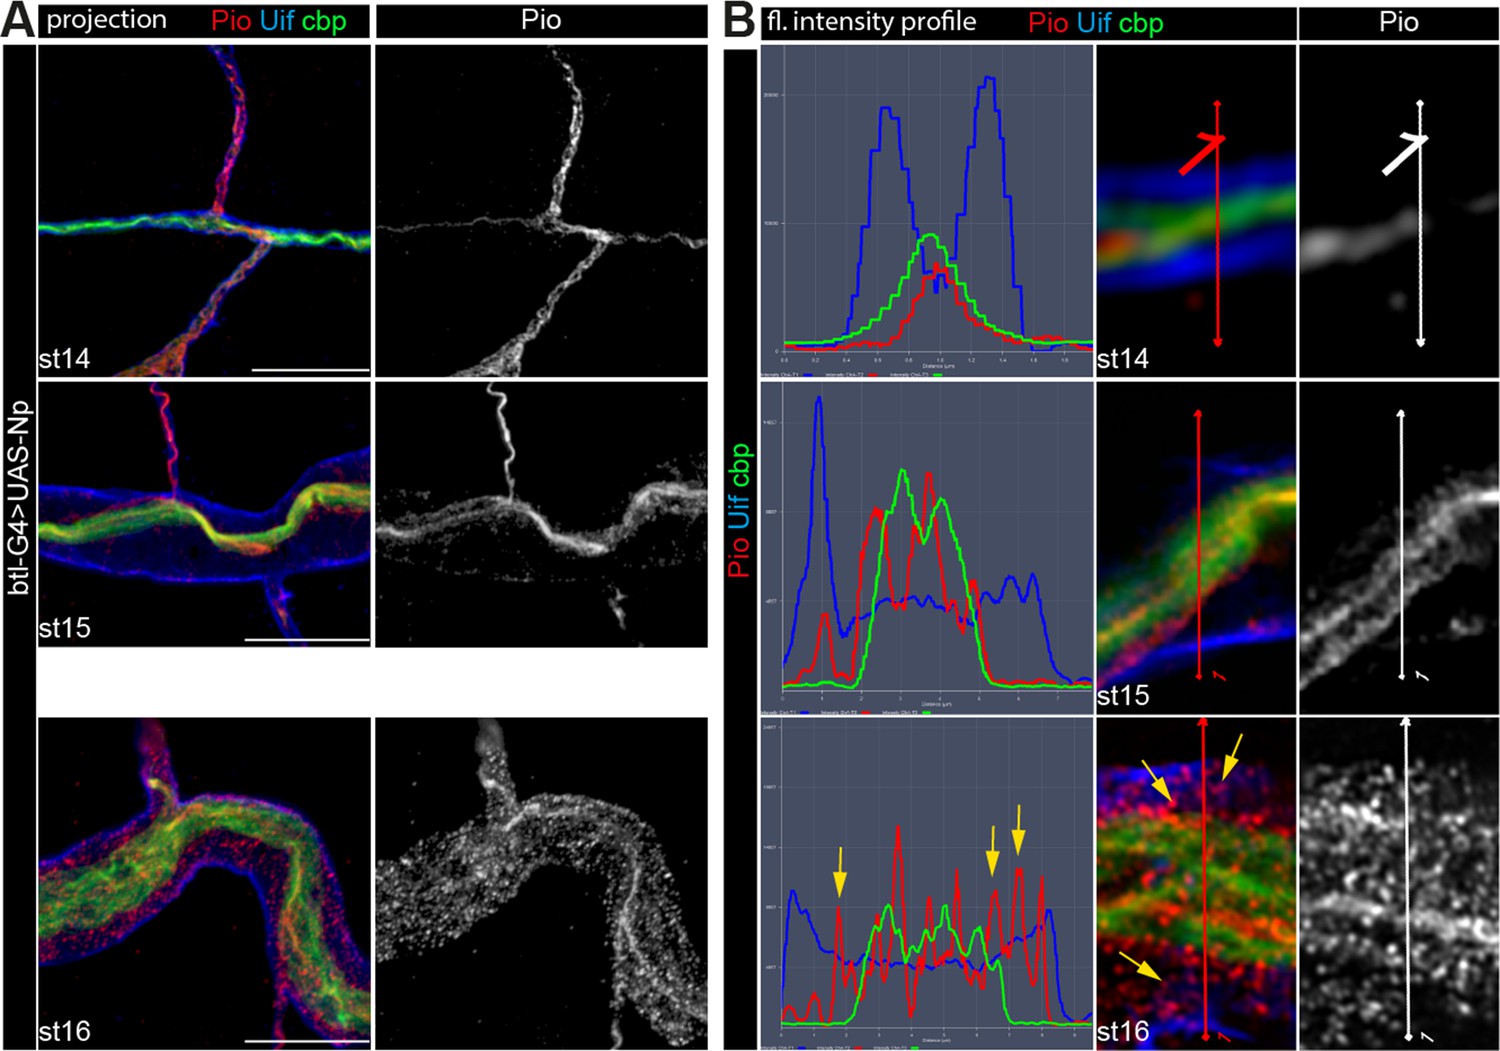
Np controls Pio shedding into the tube lumen during tube expansion.
(A) Z-stack Airsycan projection of dorsal trunks of stages 14, 15, and 16 btl-G4-driven UAS-Np embryos. In stages 14 and 15, Pio shows luminal staining predominantly at the chitin cable. Upon Np overexpression 16 Pio puncta distribute at the entire tracheal tube lumen in stage 16. Scale bars indicate 10 µm. (B) Fluorescence intensity profiles (left) across the dorsal trunk tubes and corresponding airyscan images (middle and right) of btl-G4-driven UAS-Np embryos. The stage 14 and 15 dorsal trunks reveal Pio stainings predominantly at the chitin cable. In contrast, stage 16 dorsal trunk shows Pio puncta across the entire tube lumen, including chitin cable distant areas (yellow arrows point to such Pio puncta). Pio is indicated in red and gray, Uif in blue, and chitin in green (cbp). The red and white arrows mark the position of the ZEN profile tool.
Figure 9
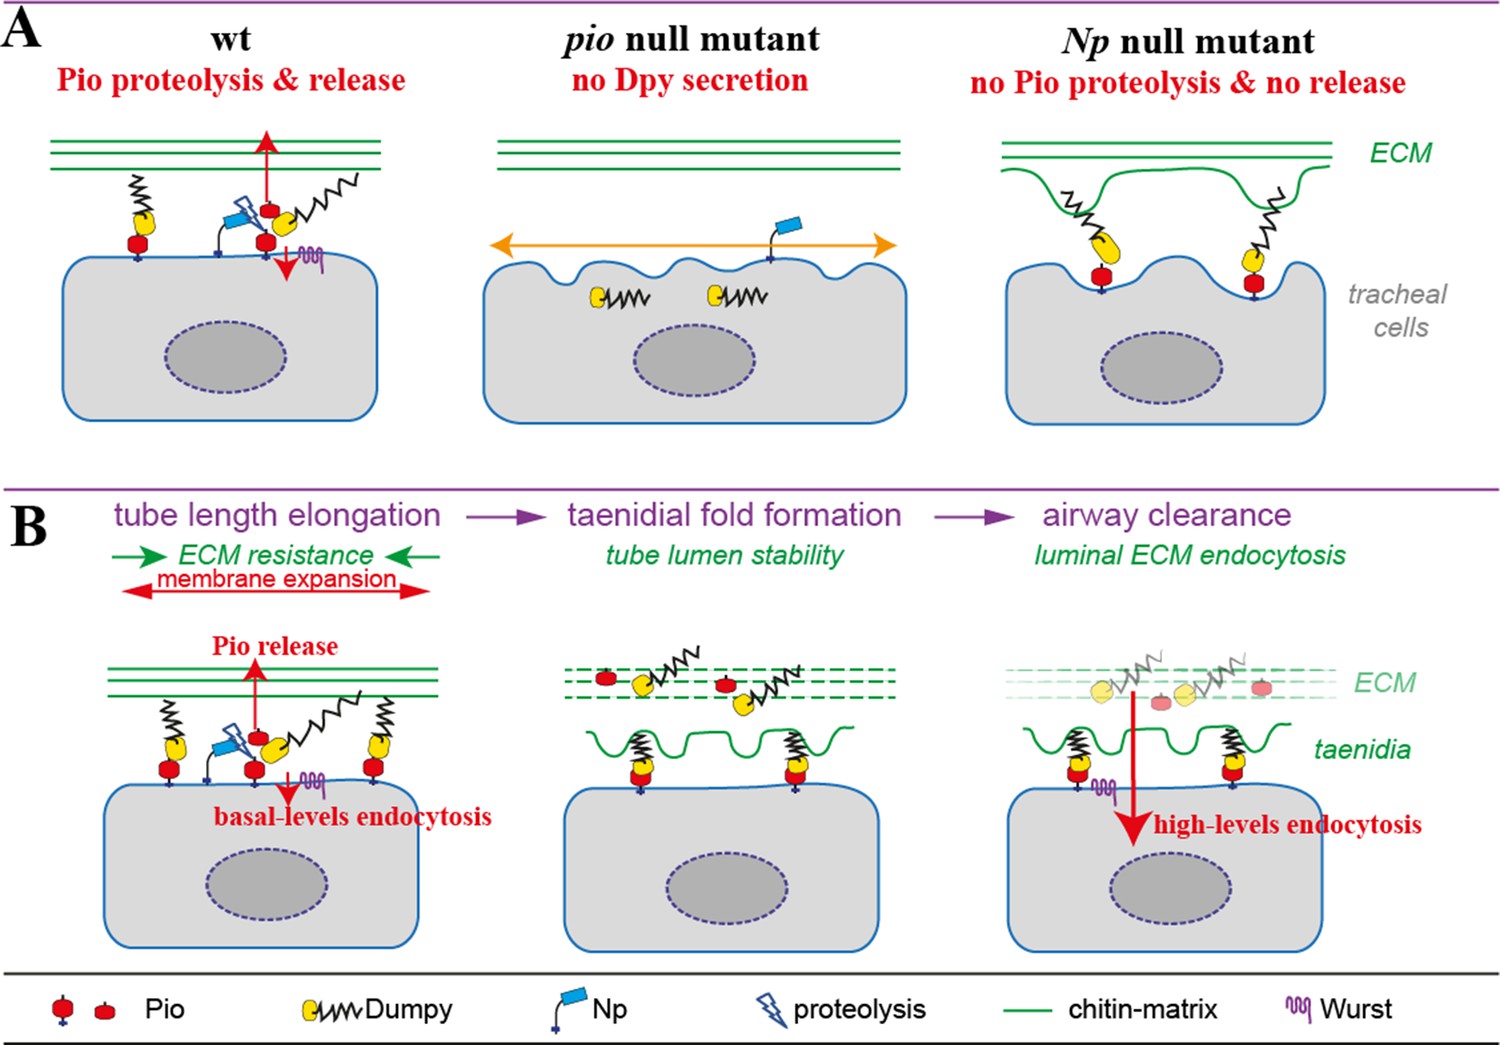
Model of apical Pio and Dpy matrix at the apical cell surface and Pio proteolysis and release.
(A) The simplified model shows a Pio-mediated Dpy secretion, the apical ZP domain protein matrix formation, and subsequent Pio ectodomain shedding by Np at wt tracheal cells. In pio null mutant embryos, Dpy is not secreted. The loss of the apical ZP proteins led to membrane matrix disconnection. This results in unstable membrane structures with numerous unusual gaps between membrane and matrix, excess apical cell shape expansion (indicated by the orange double arrow) in the axial direction, and dorsal trunk overexpansion. In contrast, apical ZP domain protein matrix forms in Np mutant embryos, but apical Pio ectodomain shedding is prevented. This led to membrane bulging and rupture (indicated by green arrows) of the apical ECM at bulges and slightly shortened dorsal trunks. (B) Simplified illustration of late embryonic tracheal development. The ZP proteins stabilize the apical membrane-matrix during tube expansion, subsequent taenidial fold formation, and airway clearance. Np cleaves Pio ZP domain at the membrane during tube expansion and sheds luminal Dpy during airway protein clearance. Wurst enables endocytosis at the apical membrane. This altogether enables precise tube length expansion (stage 16), lumen stability and airway gas-filling (stage 17). Basal (stage 16) and high-level (stage 17) endocytosis at the apical cell membrane have been described recently by Tsarouhas et al., 2019.
Tables
Key resources table
| Reagent type (species) or resource | Designation | Source or reference | Identifiers | Additional information |
|---|---|---|---|---|
| Antibody | Mouse, anti-Crb, monoclonal | DSHB | Cq4 | 1:10 |
| Antibody | Mouse anti-Flag, monoclonal | Merck | F3165 | 1:500 |
| Antibody | Mouse anti-Gasp/Obst-C, monoclonal | DSHB | 2A12 | 1:5 |
| Antibody | Chicken anti-GFP, polyclonal | Abcam | ab13970 | 1:1000 |
| Antibody | Rabbit anti-GFP, polyclonal | Synaptic Systems132003 | 132003 | IF: 1:500 WB: 1:10,000 CIF: 1:1000 |
| Antibody | Rabbit anti-Knk, polyclonal | Moussian et al., 2006 | Moussian | 1:50 |
| Antibody | Mouse anti-Mega, monoclonal | Jaspers et al., 2012 | Schuh | 1:50 |
| Antibody | Rabbit anti-mCherry, polyclonal | Rockland | 600-401P16 | IF: 1:500 WB: 1:10,000 |
| Antibody | Rabbit anti-Obst-A, polyclonal | Petkau et al., 2012 | Behr | 1:50 |
| Antibody | Rabbit anti-Pio, polyclonal | Jaźwińska et al., 2003 | Affolter | 1:100 |
| Antibody | Rabbit anti-Serp, polyclonal | Luschnig et al., 2006 | Luschnig | 1:50 |
| Antibody | Rabbit anti-Spalt, polyclonal | Kühnlein et al., 1994 | Schuh | 1:25 |
| Antibody | Mouse anti-α-Spectrin, monoclonal | DSHB | 3A9 | 1:10 |
| Antibody | Anti-Strep-HRP, mouse monoclonal | IBA | 1-1509-001 | 1:10,000 |
| Antibody | Mouse anti-β-Tubulin, monoclonal | DSHB | E7 | 1:100 |
| Antibody | Guinea pig ani-Uif, polyclonal | Zhang and Ward, 2009 | Ward | 1:100 |
| Antibody | Rabbit anti-Verm, polyclonal | Luschnig et al., 2006 | Luschnig | 1:50 |
| Antibody | Donkey anti-goat Alexa488, polyclonal | Dianova | 705-545-003 | 1:400 |
| Antibody | Donkey anti-guinea pig Cy3, polyclonal | Dianova | 706-165-148 | 1:400 |
| Antibody | Donkey anti-mouse Alexa647, polyclonal | Dianova | 715-605-020 | 1:400 |
| Antibody | Donkey anti-mouse Alexa647, polyclonal | Dianova | 715-605-020 | 1:400 |
| Antibody | Donkey anti-rabbit Cy3, polyclonal | Dianova | 711-167-003 | 1:400 |
| Antibody | Donkey anti-rabbit-AlexaFluor488, polyclonal | Thermo Fisher Scientific | A-11034 | 1:500 |
| Antibody | Donkey anti-rabbit-AlexaFluor568, polyclonal | Thermo Fisher Scientific | A-21069 | 1:500 |
| Antibody | Goat anti-mouse-HRP, polyclonal | Thermo Fisher Scientific | G-21040 | WB: 1:10,000 |
| Antibody | Goat anti-rabbit-HRP, polyclonal | Thermo Fisher Scientific | Thermo Fisher ScientificG-21234 | 1:10,000 |
| Reagent | WGA, Alexa Flour 633 | Invitrogen | W21404 | 1:100 |
| Reagent | Cbp, Alexa488 | New England Biolabs | 1:200 | |
| Reagent | Phalloidin- PromoFluor-488 | PromoKine, VWR | PROMOPK-PF488P-7 | 1:75 |
| Genetic reagent | btl-Gal4 | Bloomington Drosophila Stock Center (BDSC) | ||
| Genetic reagent | crb2 (crb11A22) | BDSC | Stock ID 3448 | https://flybase.org/reports/FBal0001817.html |
| Genetic reagent | dpyolvR/SM5 | BDSC | Stock ID 280 | https://flybase.org/reports/FBal0002971#phenotypic_data_sub |
| Genetic reagent | Dumpy::eYFP [CPTI-001769] | Lye et al., 2014 | Sanson | |
| Genetic reagent | megaG0012/FM7, act-GFP | Behr et al., 2003 | Schuh; U Schäfer | |
| Genetic reagent | shrub4/Cyo | Dong et al., 2014 | Hayashi | |
| Genetic reagent | w1118 | BDSC | https://flybase.org/reports/FBal0018186.html | |
| Genetic reagent | w*; mCherry::pio/CyO, dfd-eYFP | This manuscript | Drees | Generation as described in the supplement, available from MB |
| Genetic reagent | w*; flzC1 | This manuscript | Drees | Generation as described in the supplement, available from MB |
| Genetic reagent | w*; flzC1, mCherry::pio/CyO, dfd-eYFP | This manuscript | Drees | Generation as described in the supplement, available from MB |
| Genetic reagent | w1118;PBac{681 .P.FSVS-1}flzCPTI001902 | Kyoto Stock Center | Stock ID 115246 | https://flybase.org/reports/FBti0143804 |
| Genetic reagent | w*; pio5M/CyO, dfd-eYFP | This manuscript | Drees | Generation as described in the supplement, available from MB |
| Genetic reagent | w*; pio17C/CyO, dfd-eYFP | This manuscript | Dress | Generation as described in the supplement, available from MB |
| Genetic reagent | w*; NpP6/CyO, dfd-eYFP | Drees et al., 2019 | Drees | Available from MB |
| Genetic reagent | w*; NpP6, P{Gal4-btl}/CyO, dfd-eYFP | Drees et al., 2019 | Drees | Available from MB |
| Genetic reagent | w*; NpC2, P{UAS-NpS990A}/CyO, dfd-eYFP | Drees et al., 2019 | Drees | Available from MB |
| Genetic reagent | w*; NpC2/CyO, dfd-eYFP; P{UASp-GFPS65C-alphaTub84B}3/TM3, Sb1 | Drees et al., 2019 | Drees | Available from MB |
| Genetic reagent | w*; NpP6, mCherry::pio/CyO, dfd-eYFP | Drees et al., 2019 | Drees | Available from MB |
| Genetic reagent | w*; P{UAS-NpS990A}/P{UAS-NpS990A} | Drees et al., 2019 | Drees | Available from MB |
| Genetic reagent | w*; P{UAS-Np}/P{UAS-Np} | Drees et al., 2019 | Drees | Available from MB |
| Genetic reagent | wurst162/FM7-actin-GFP | Behr et al., 2007 | Behr | Available from MB |
| Genetic reagent | UAS-Cht2 | Tonning et al., 2005 | Uv | |
| Genetic reagent | w[1118]; P{w[+mC]=UAS-myr-mRFP}1 | BDSC | Stock ID 7118 | https://flybase.org/reports/FBst0007118.html |
| Genetic reagent | UAS-wurst-RNAi | Stümpges and Behr, 2011 | VDRC | |
| Cell line (D. melanogaster) | S2R+ cells | Drees et al., 2019 | DGRC | https://flybase.org/reports/FBtc0000150.html#:~:text = S2R%2B%20is%20an%20isolate%20of,to %20the%20original%20S2%20line.&text = S2R%2B%20is%20an%20isolate%20of%20S2 %20that%20has%20receptors%20for%20wg%20signalling. |
| Cell line (D. melanogaster) | Kc167 | Drees et al., 2019 | DGRC | https://flybase.org/reports/FBtc0000001.html |
| Sequence-based reagent | pio-sgRNA-sense | Eurofins Genomic | CTTCGATTGGGACACCGAGCCACT | |
| Sequence-based reagent | pio-sgRNA-antisense | Eurofins Genomics | AAACAGTGGCTCGGTGTCCCAATC | |
| Sequence-based reagent | flz-sgRNA-sense | Eurofins Genomics | CTTCGTGGGTTACGCCGG CCTCAA | |
| Sequence-based reagent | flz-sgRNA-antisense | Eurofins Genomics | AAACTTGAGGCCGGCGTA ACCCAC | |
| Sequence-based reagent | UAS-mCherry::pio-for | Eurofins Genomics | GAATTCATGAAGACAGGCACTCGAATGGACGCTTTCCACACGGCGCTGCACTTAATCACAATCGCAGCTCTGACGACG | |
| Sequence-based reagent | UAS-mCherry::pio-rev | Eurofins Genomics | CTCGAGGCCGCCTTTGTAAAGCTCATCC | |
| Sequence-based reagent | Pio-5’-HA1-for | Eurofins Genomics | ACTAGTCCGAATTCGCAGG TGATTATCGCCTCTCGGCC ATCAG | |
| Sequence-based reagent | Pio-5’-HA1-rev | Eurofins Genomics | AAGCTTCTTTAATTAAAGG GGAAATTTCG | |
| Sequence-based reagent | Pio-5’-HA2-for | Eurofins Genomics | ACTAGTGGCAAGCTTACTG GCGATGGATTAGGCC | |
| Sequence-based reagent | Pio-5’-HA2-rev | Eurofins Genomics | CACCTGCGATCTTAATCTT GCCAGCGTCTGTC | |
| Sequence-based reagent | Pio-3’-HA-for | Eurofins Genomics | TTAAGGAAGAGCACACAG TTGGGCGCTTTGTTAGTCG | |
| Sequence-based reagent | Pio-3’-HA-rev | Eurofins Genomics | CGGGGAAGAGCGACGAGA TTGCGCCGGAAAATAAG | |
| Sequence-based reagent | UAS-pio-ORF-for | Eurofins Genomics | CTCGAGCCAACGGCAATGAAAGATGCCC | |
| Sequence-based reagent | UAS-pio-ORF-rev | Eurofins Genomics | TCTAGATTAGCTGCTGTGCGAGAAG | |
| Sequence-based reagent | Dpy-ZP-for | Eurofins Genomics | GCTTTACAAAGGTTACACGGGTAATCCG | |
| Sequence-based reagent | Dpy-CT-for | Eurofins Genomics | GCTTTACAAAGGTGGAAATGCCAGGATTG | |
| Sequence-based reagent | Dpy-CTZP-rev | Eurofins Genomics | GTGGAGCCGGCCACCATTTATGGAGGTTTC | |
| Sequence-based reagent | Dpy-ZP-for | Eurofins Genomics | GGCCACCATTTATGGAGGTTTC | |
| Sequence-based reagent | Dpy-ZP-rev | Eurofins Genomics | GGTTCCTTCACAAAGATCCTTTAGGATATGTAATCCGGCG | |
| Sequence-based reagent | Strep::TGFBR3::GFP1-for | Eurofins Genomics | CTGAATAGGGAATTGGGAATTCATGACTTCCCATTATG | |
| Sequence-based reagent | Strep::TGFBR3::GFP1-rev | Eurofins Genomics | CACCGCTGCCACCTCCTGATCCGCCACCCTTTTCAAACTGCGGATGACTCCATGCACTTTGCACCTCTTCTGGCTCTC | |
| Sequence-based reagent | Strep::TGFBR3::GFP2-for | Eurofins Genomics | ATCAGGAGGTGGCAGCGGTGGAAGTGCATGGAGCCATCCCCAATTCGAGAAGGGGAGCGTGGATATTGCCCTG | |
| Sequence-based reagent | Strep::TGFBR3::GFP2-rev | Eurofins Genomics | TCACCATACCGCCGCTAGCGGCCGTGCTGCTGCTG | |
| Plasmid | pJet1.2 | Thermo Fisher Scientific | ||
| Plasmid | pUAST | GAL4/UAS-mediated overexpression; Brand and Perrimon, 1993 | ||
| Plasmid | pBFv-U6.2 | Expression of single sgRNA; Kondo and Ueda, 2013 | ||
| Plasmid | pBFv-U6.2B | Expression of two sgRNAs; Kondo and Ueda, 2013 | ||
| Plasmid | pHD-ScarlessDsRed | Scarless genome editing via HDR | DGRC | |
| Plasmid | actin5C-Gal4 | Expression of Gal4 in cultured cells; Usui et al., 1999 | ||
| Software, algorithm | Clustal omega algorithm | https://www.ebi.ac.uk/Tools/msa/clustalo/ | ||
| Software, algorithm | DNASTAR software suite | Lasergene Software | Lasergene Software | |
| Software, algorithm | Flybase | https://www.flybase.org | https://www.flybase.org | BLASTP algorithm |
| Software, algorithm | Huygens professional | SVI | 20.10 | |
| Software, algorithm | Illustrator | Adobe | CS6 | https://www.adobe.com |
| Software, algorithm | Imaris 9.7.2 | Oxford Instruments | Oxford Instruments | https://imaris.oxinst.com/ |
| Software, algorithm | NetOGlyc | DTU Health Tech | https://services.healthtech.dtu.dk/ | |
| Software, algorithm | Office 365 (Word, Excel) | Microsoft | Microsoft | https://www.microsoft.com |
| Software, algorithm | ProP | DTU Health Tech | https://services.healthtech.dtu.dk/ | |
| Software, algorithm | SignalP | DTU Health Tech | https://services.healthtech.dtu.dk | |
| Software, algorithm | Photoshop CS6 | Adobe | CS6 | https://www.adobe.com |
| Software, algorithm | SMART | EMBL | EMBL | |
| Software, algorithm | Serial Cloner | Serial basics | 2.6.1 | |
| Software, algorithm | TMHMM 2.0 algorithm | DTU Health Tech | https://services.healthtech.dtu.dk/ | |
| Software, algorithm | ZEN 2.3 | Zeiss | Zeiss | 2.3, black |
Additional files
Download links
A two-part list of links to download the article, or parts of the article, in various formats.
Downloads (link to download the article as PDF)
Open citations (links to open the citations from this article in various online reference manager services)
Cite this article (links to download the citations from this article in formats compatible with various reference manager tools)
The proteolysis of ZP proteins is essential to control cell membrane structure and integrity of developing tracheal tubes in Drosophila
eLife 12:e91079.
https://doi.org/10.7554/eLife.91079


