Intramolecular feedback regulation of the LRRK2 Roc G domain by a LRRK2 kinase-dependent mechanism
- German Center for Neurodegenerative diseases (DZNE), Germany
- Department of Cell Biochemistry, University of Groningen, Netherlands
- YETEM-Innovative Technologies Application and Research Centre, Suleyman Demirel University West Campus, Turkey
- Core Facility for Medical Bioanalytics, Institute for Ophthalmic Research, Center for Ophthalmology, University of Tübingen, Germany
Figures
Figure 1
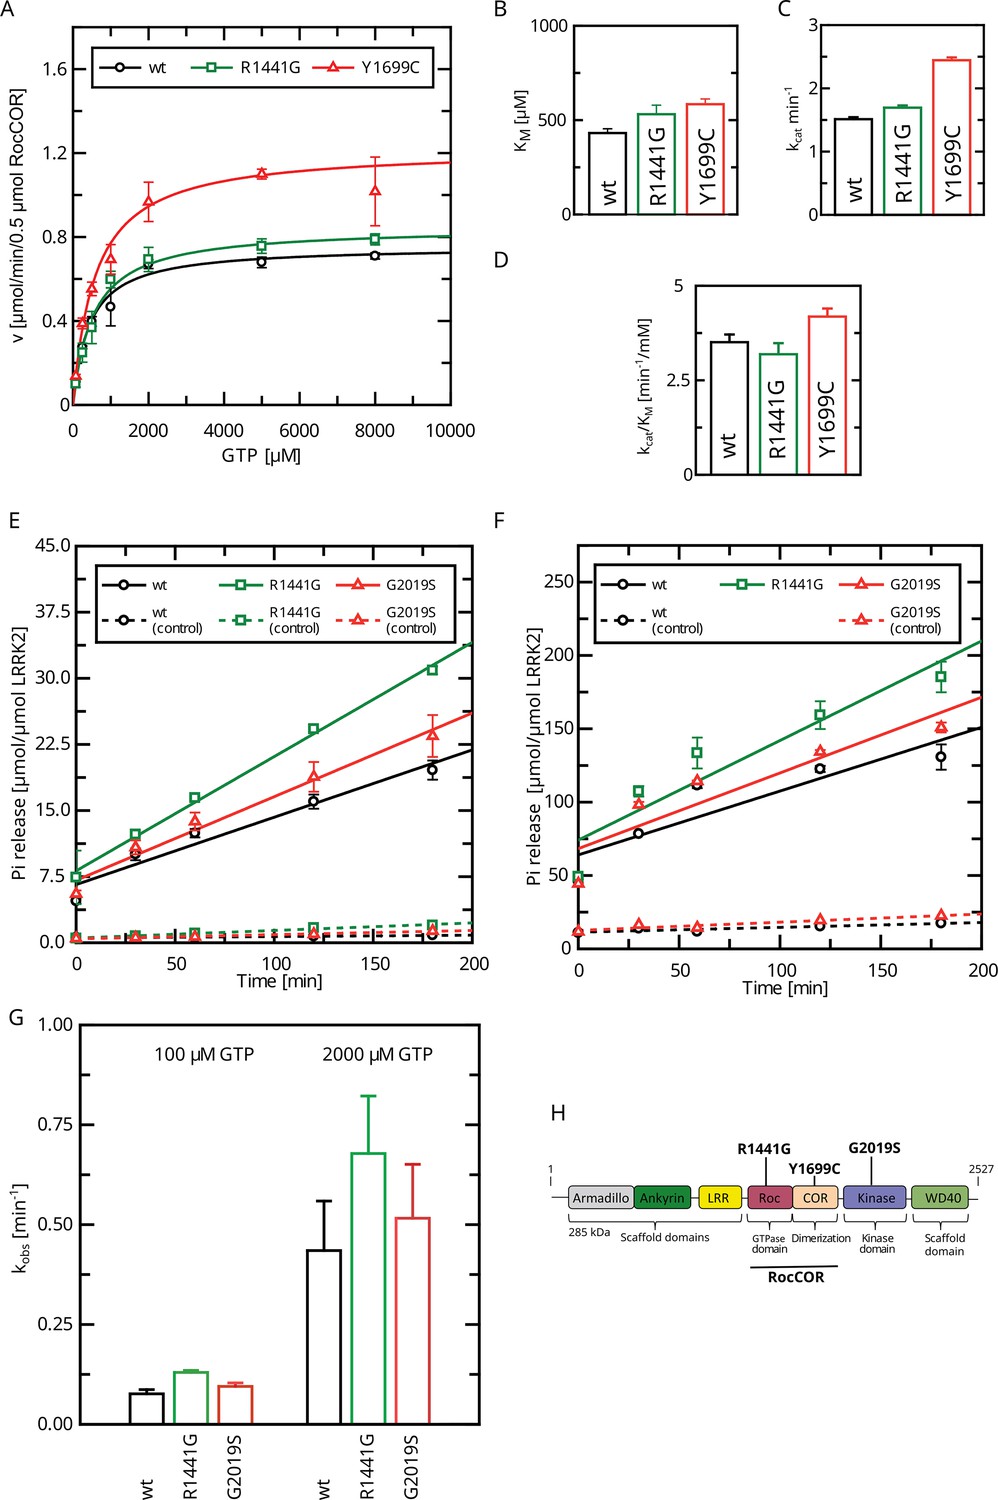
Determination of kinetic parameters for LRRK2 GTP hydrolysis of Parkinson’s disease (PD) variants by the charcoal assay.
(A) Michaelis–Menten kinetics for pathogenic variant within the RocCOR module. (B) Comparison of KM values (n: wt=5, R1441G=6, Y1699C=5). (C) Comparison of kcat values (n: wt=5, R1441G=6, Y1699C=5). (D) Catalytic efficiency (kcat/KM) (n: wt=5, R1441G=6, Y1699C=5). (E–G) Determination of kobs values for full-length LRRK2 at 100 µM (E) and 2000 µM (F) GTP (both: n=4). (H) Domain structure of LRRK2 and the position of PD variants analyzed in this study.
Figure 2 with 1 supplement
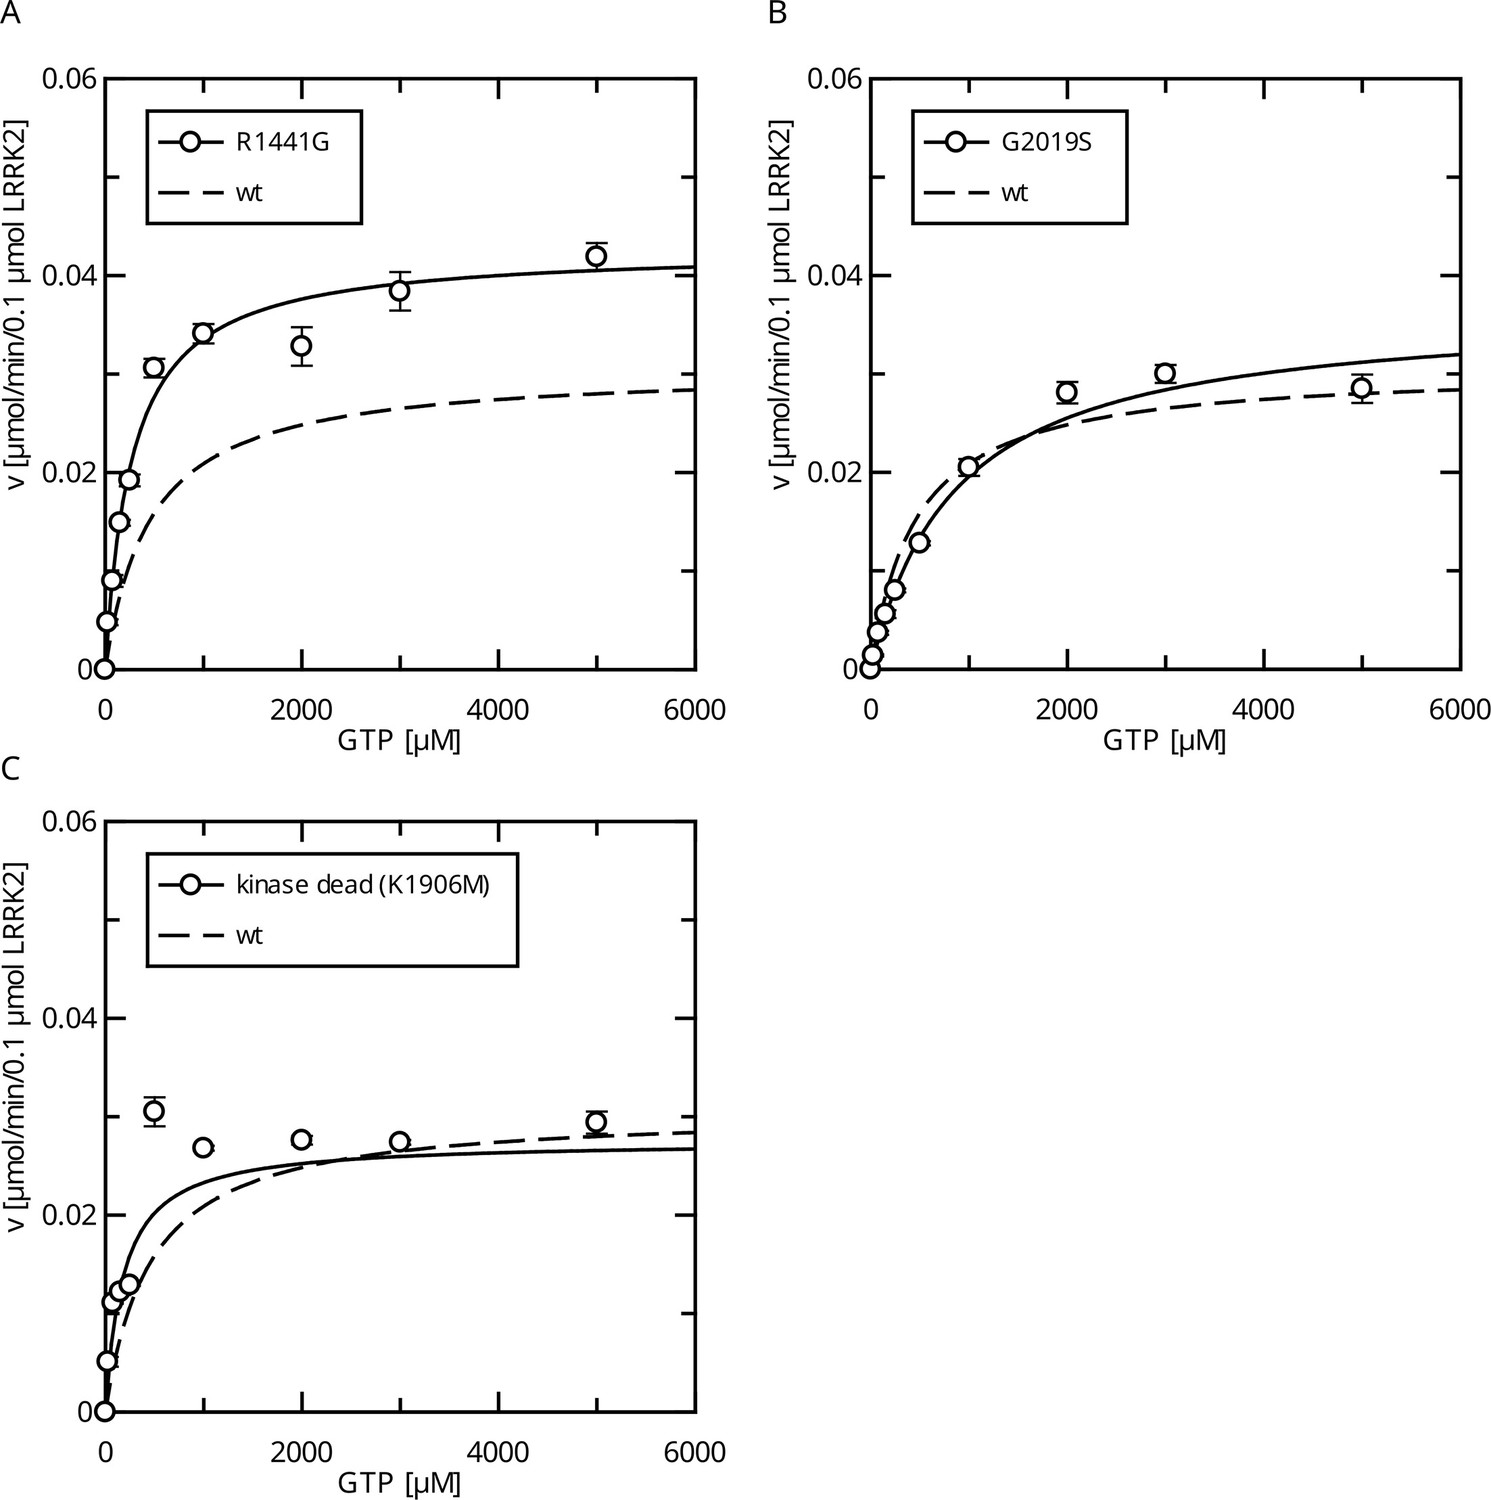
Comparison of Parkinson’s disease (PD) mutants in the HPLC-based GTPase assay for the LRRK2 full-length protein.
(A) Michaelis–Menten kinetics for the R1441G Roc-domain variant compared to LRRK2 wt. (B) Michaelis–Menten kinetics for the G2019S kinase-domain variant compared to LRRK2 wt. (C) Michaelis–Menten kinetics for a kinase-dead variant compared to LRRK2 wt.
Figure 2—figure supplement 1
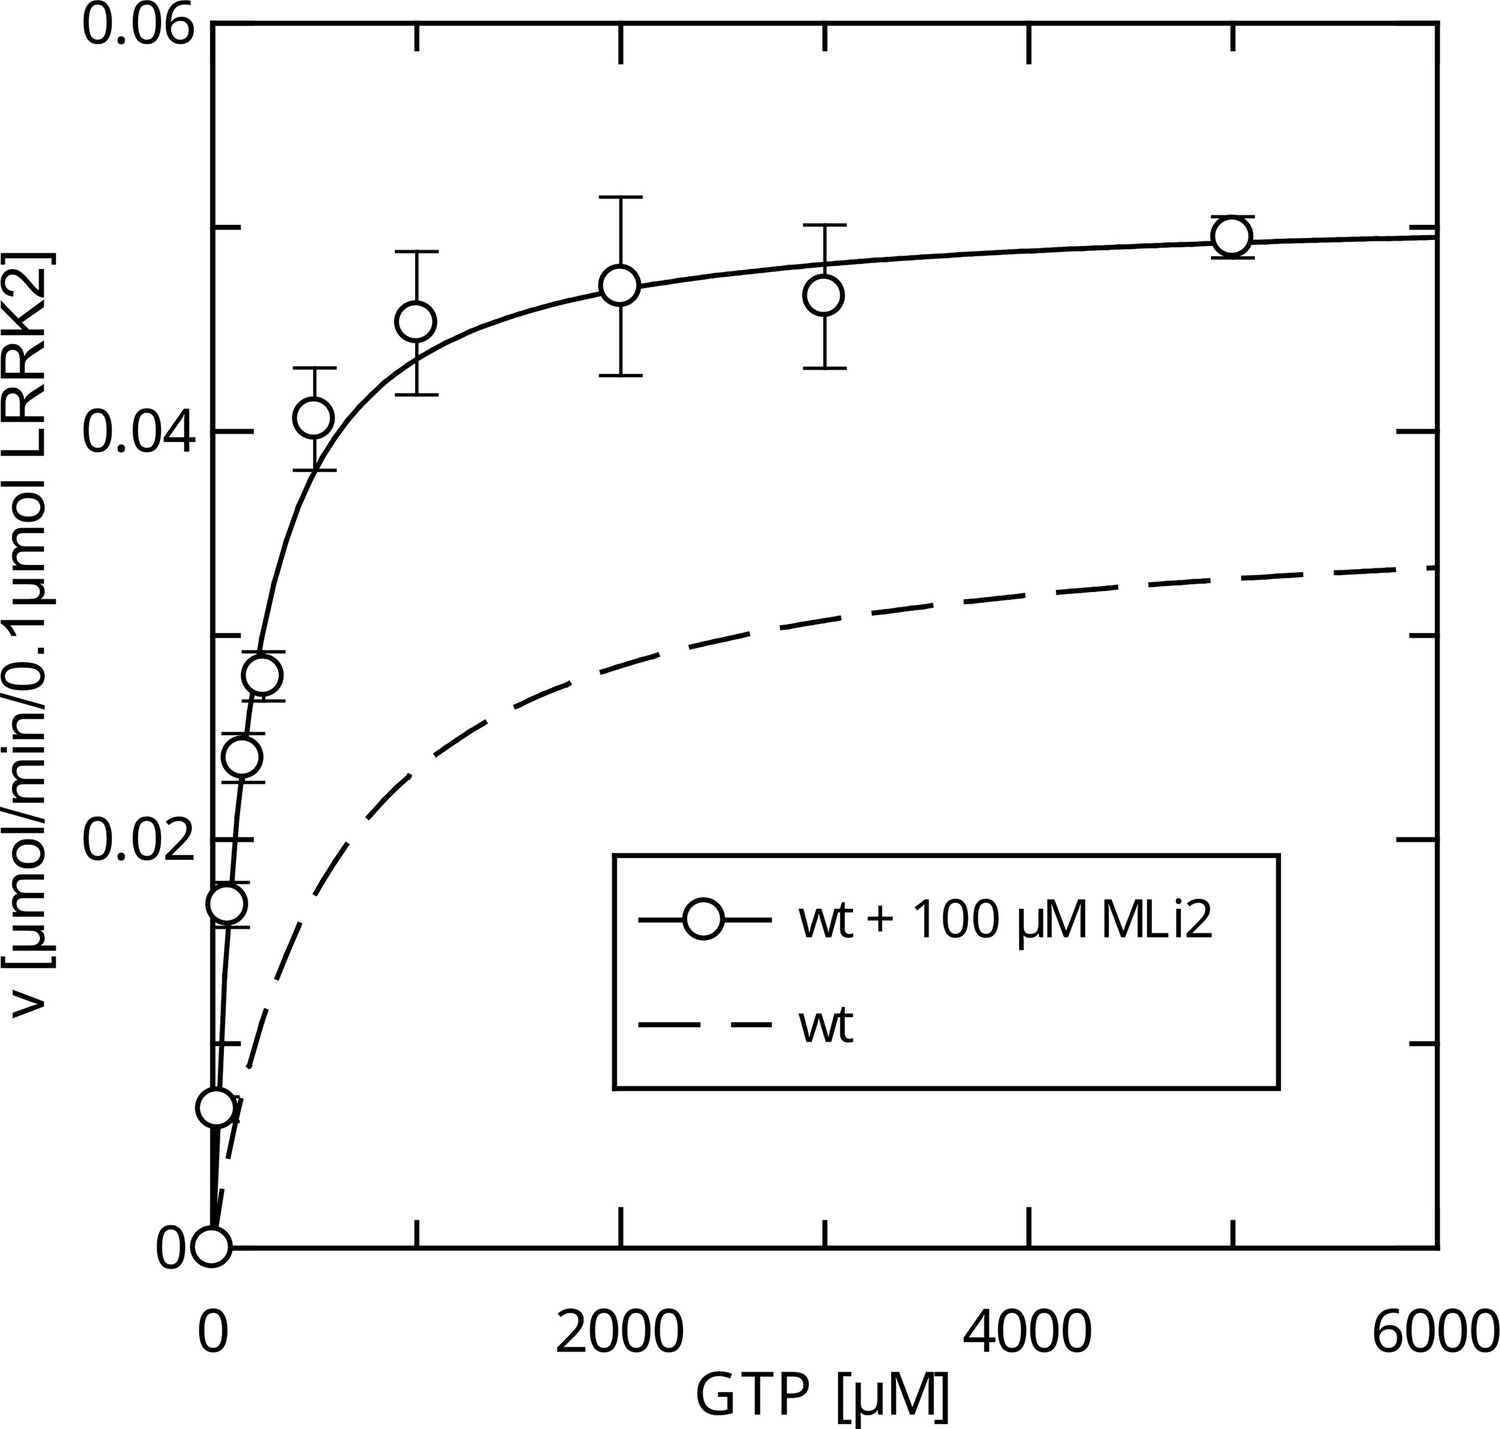
Michaelis–Menten kinetics for MLi-2-treated LRRK2 wt.
Figure 3 with 2 supplements
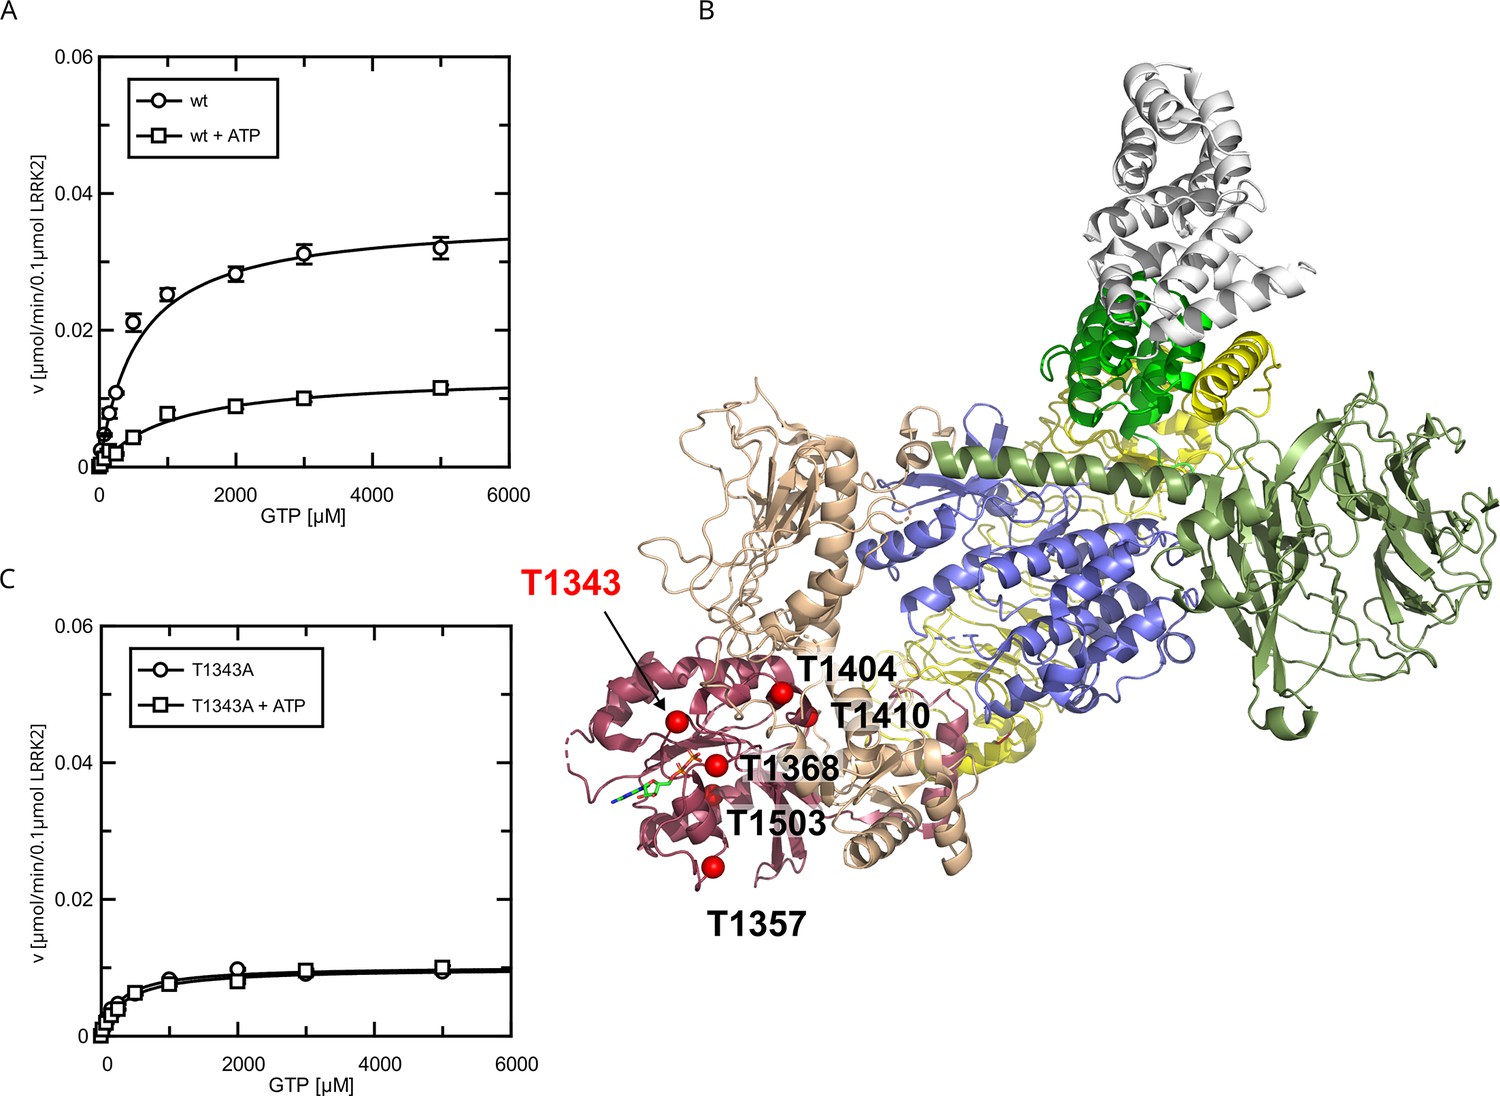
Identification of T1343 as relevant autophosphorylation site for a negative feedback loop.
(A) Michaelis–Menten kinetics for LRRK2 wt+/-ATP, (B) Phosphosite screen: position of the LRRK2 phosho-sites within the Roc domain which were included in the screen mapped on PDB:7LHW (Myasnikov et al., 2021). Individual domains are highlighted in color as follows: Armadillo (gray), Ankyrin (green), LRR (yellow), Roc (magenta), COR (wheat), Kinase (blue), and WD40 (dark green). (C) Michaelis–Menten kinetics for T1343A LRRK2+/-ATP.
Figure 3—figure supplement 1
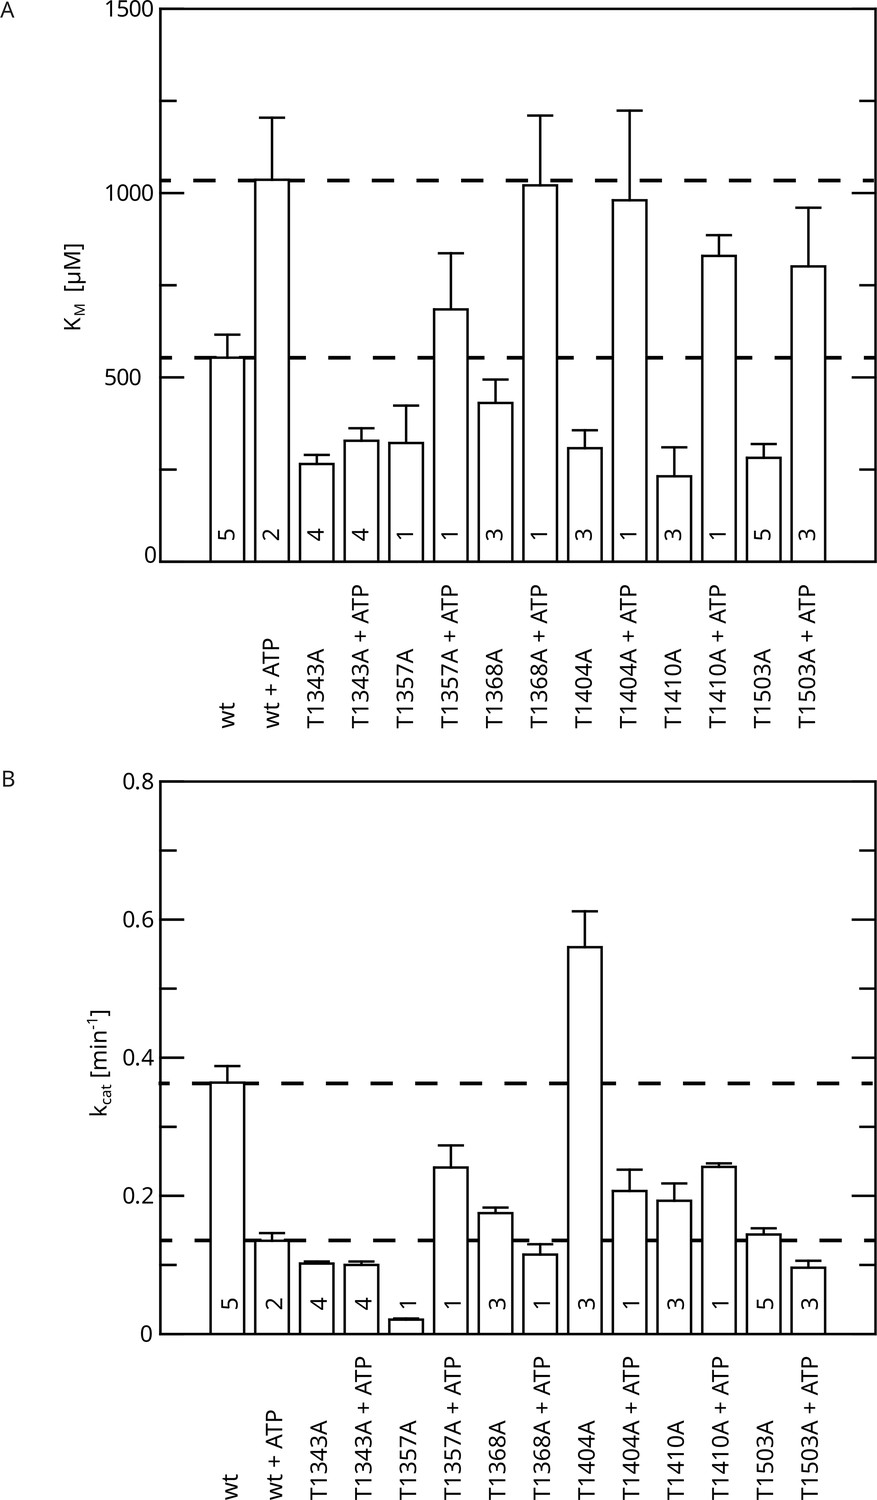
Initial phosphosite screen (alanine screen).
Michaelis–Menten parameters were determined in dependence of ATP pre-incubation. (A) KM values. (B) kcat values. The number of replicates is indicated.
Figure 3—figure supplement 2
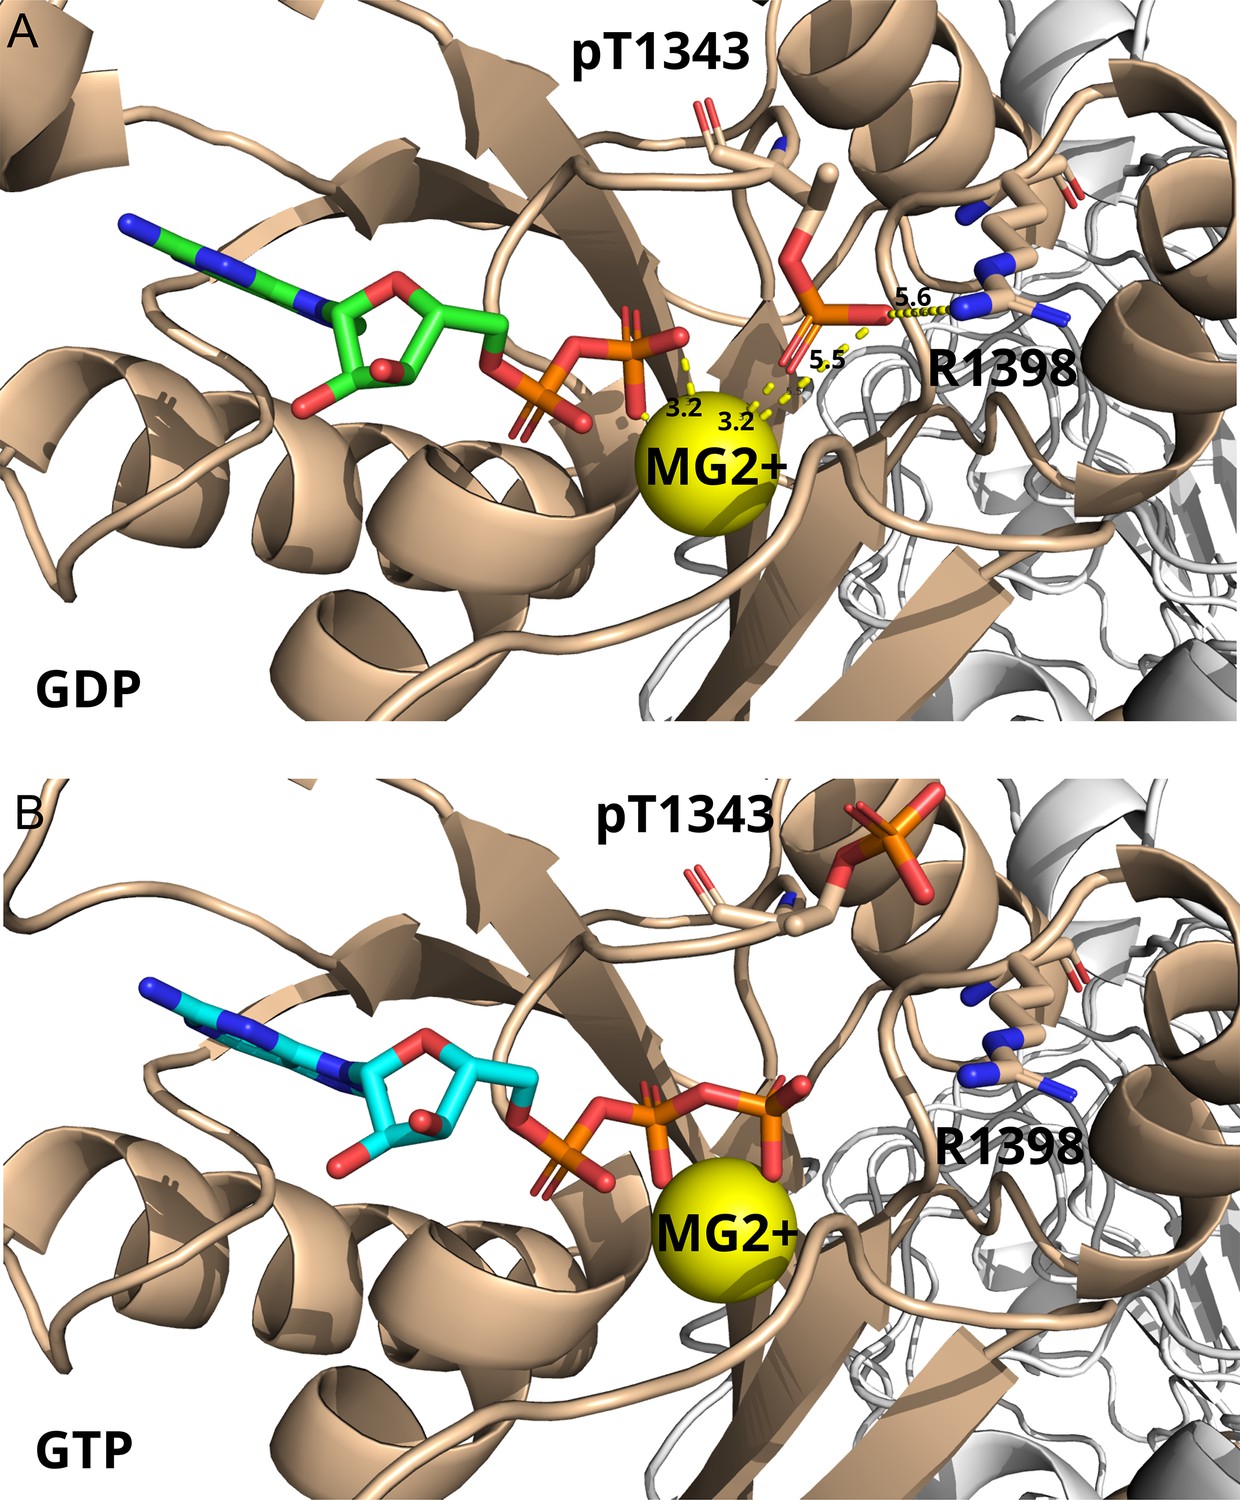
AlphaFold3 models of pT1343 LRRK2, in the presence of either (A) GDP (Mg2+) or (B) GTP (Mg2+).
Besides the residue pT1343, R1398 is highlighted in the structures. R1398 is in the homologous position to an invariant glutamine in the structure of small G proteins. The Q61 residue in Ras has been shown to be essential for the hydrolysis reaction as it coordinates the catalytic water molecule (Vetter and Wittinghofer, 2001). Distances shown in yellow report values in Ångström. Overall, the AF3 model represents the open (auto-inhibited state of LRRK2).
Figure 4
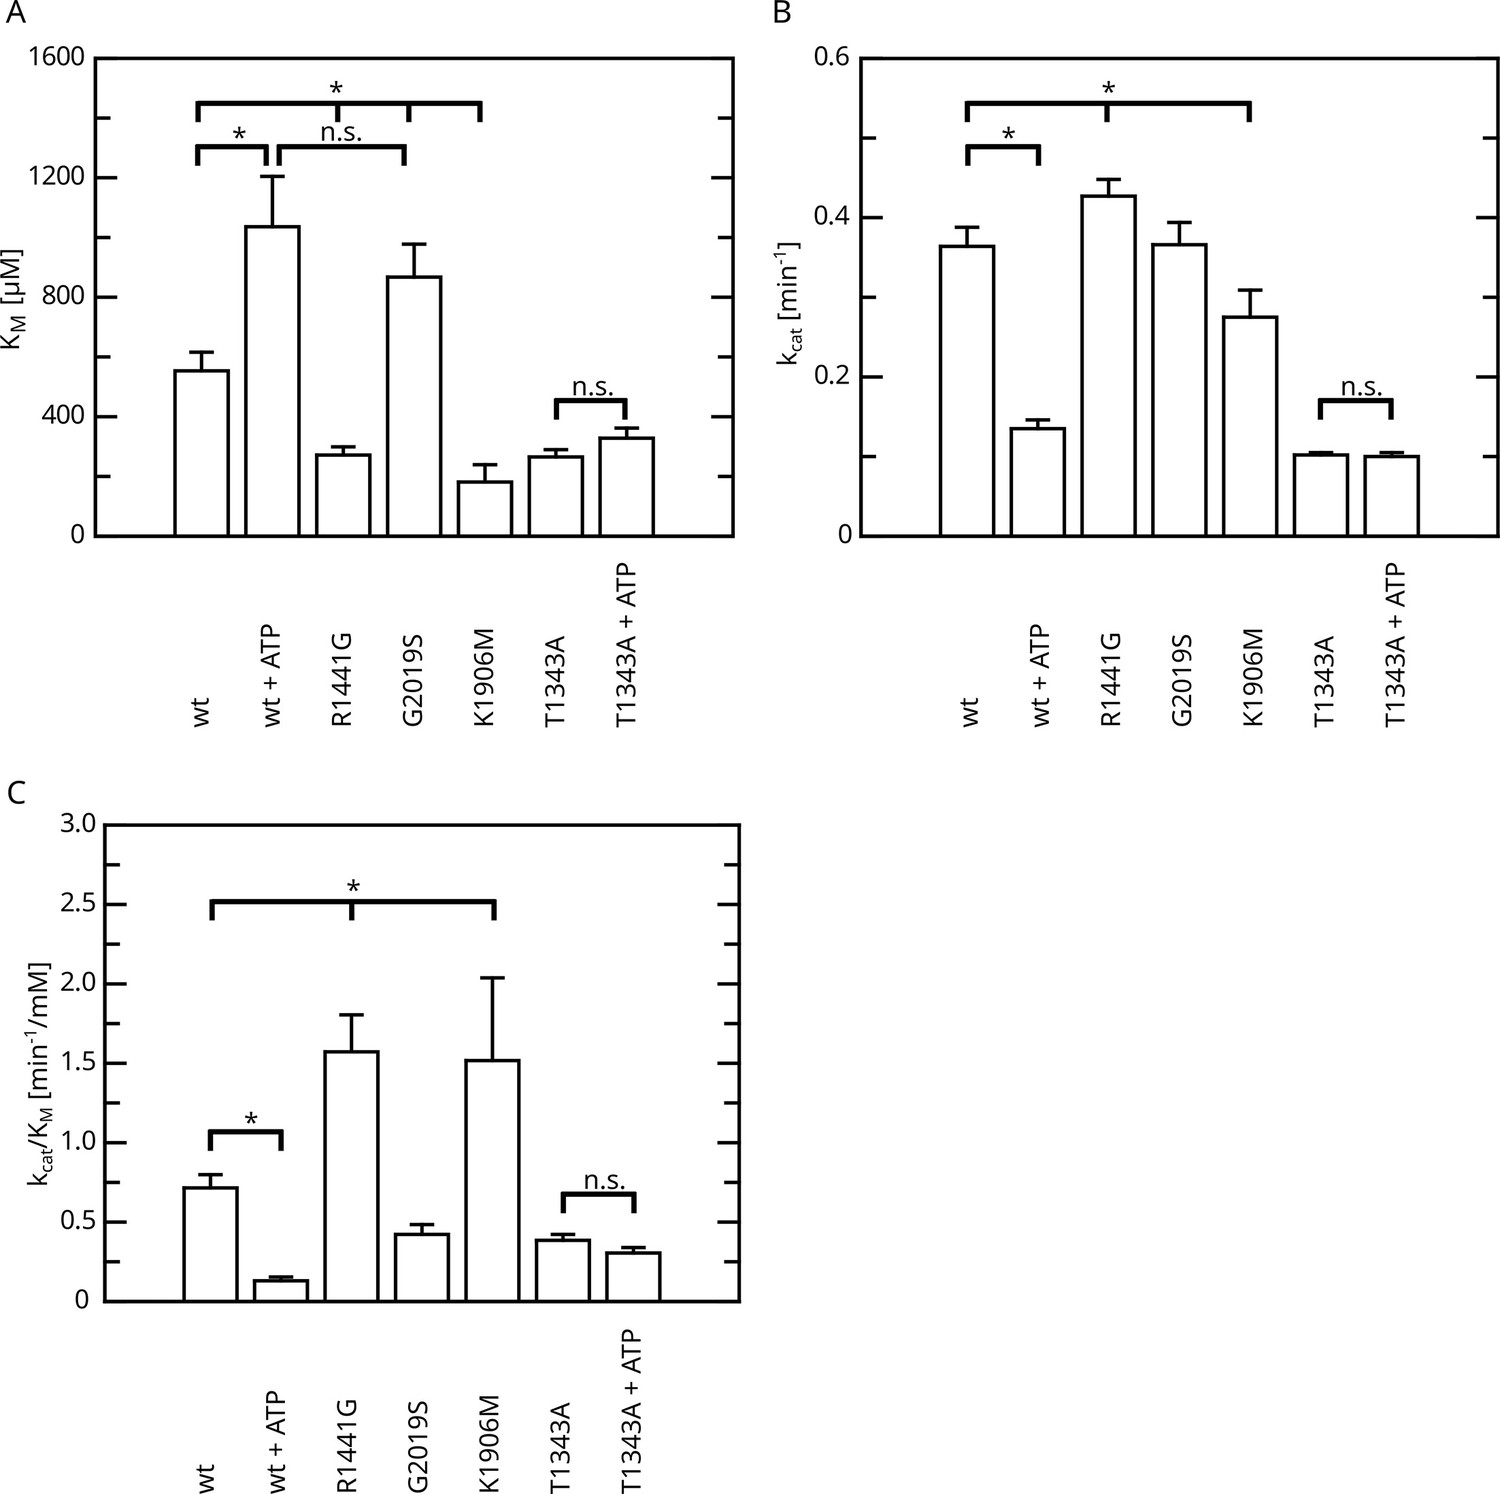
Overview of the kinetic parameters for fl.LRRK2 GTPase determined by the HPLC assay.
(A) KM values. (B) kcat values. (C) Catalytic efficiency (kcat/KM). Significant differences have been determined by an ANOVA followed by a post hoc test (n: wt=5, wt+ATP=2, R1441G=4, G2019S=4, K1906M=3, T1343A=4, T1343A+ATP=4, *p=0.05).
-
Figure 4—source data 1
Detailed statistical analysis.
- https://cdn.elifesciences.org/articles/91083/elife-91083-fig4-data1-v1.zip
Figure 5
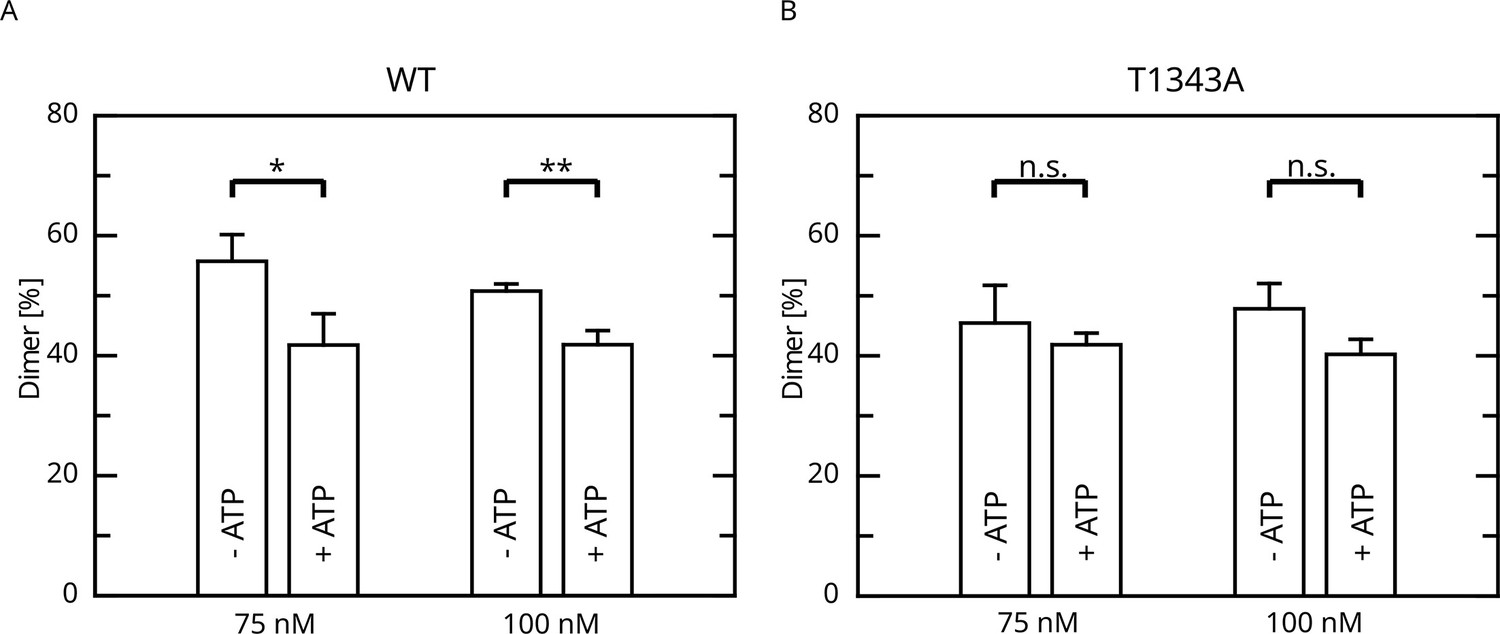
Effect of ATP incubation on the LRRK2 M/D equilibrium.
(A) Mass photometry assays for LRRK2 wt and (B) T1343A LRRK2. Significance has been determined by a t-test (n=3, *p=0.05; **p=0.01).
Figure 6 with 2 supplements
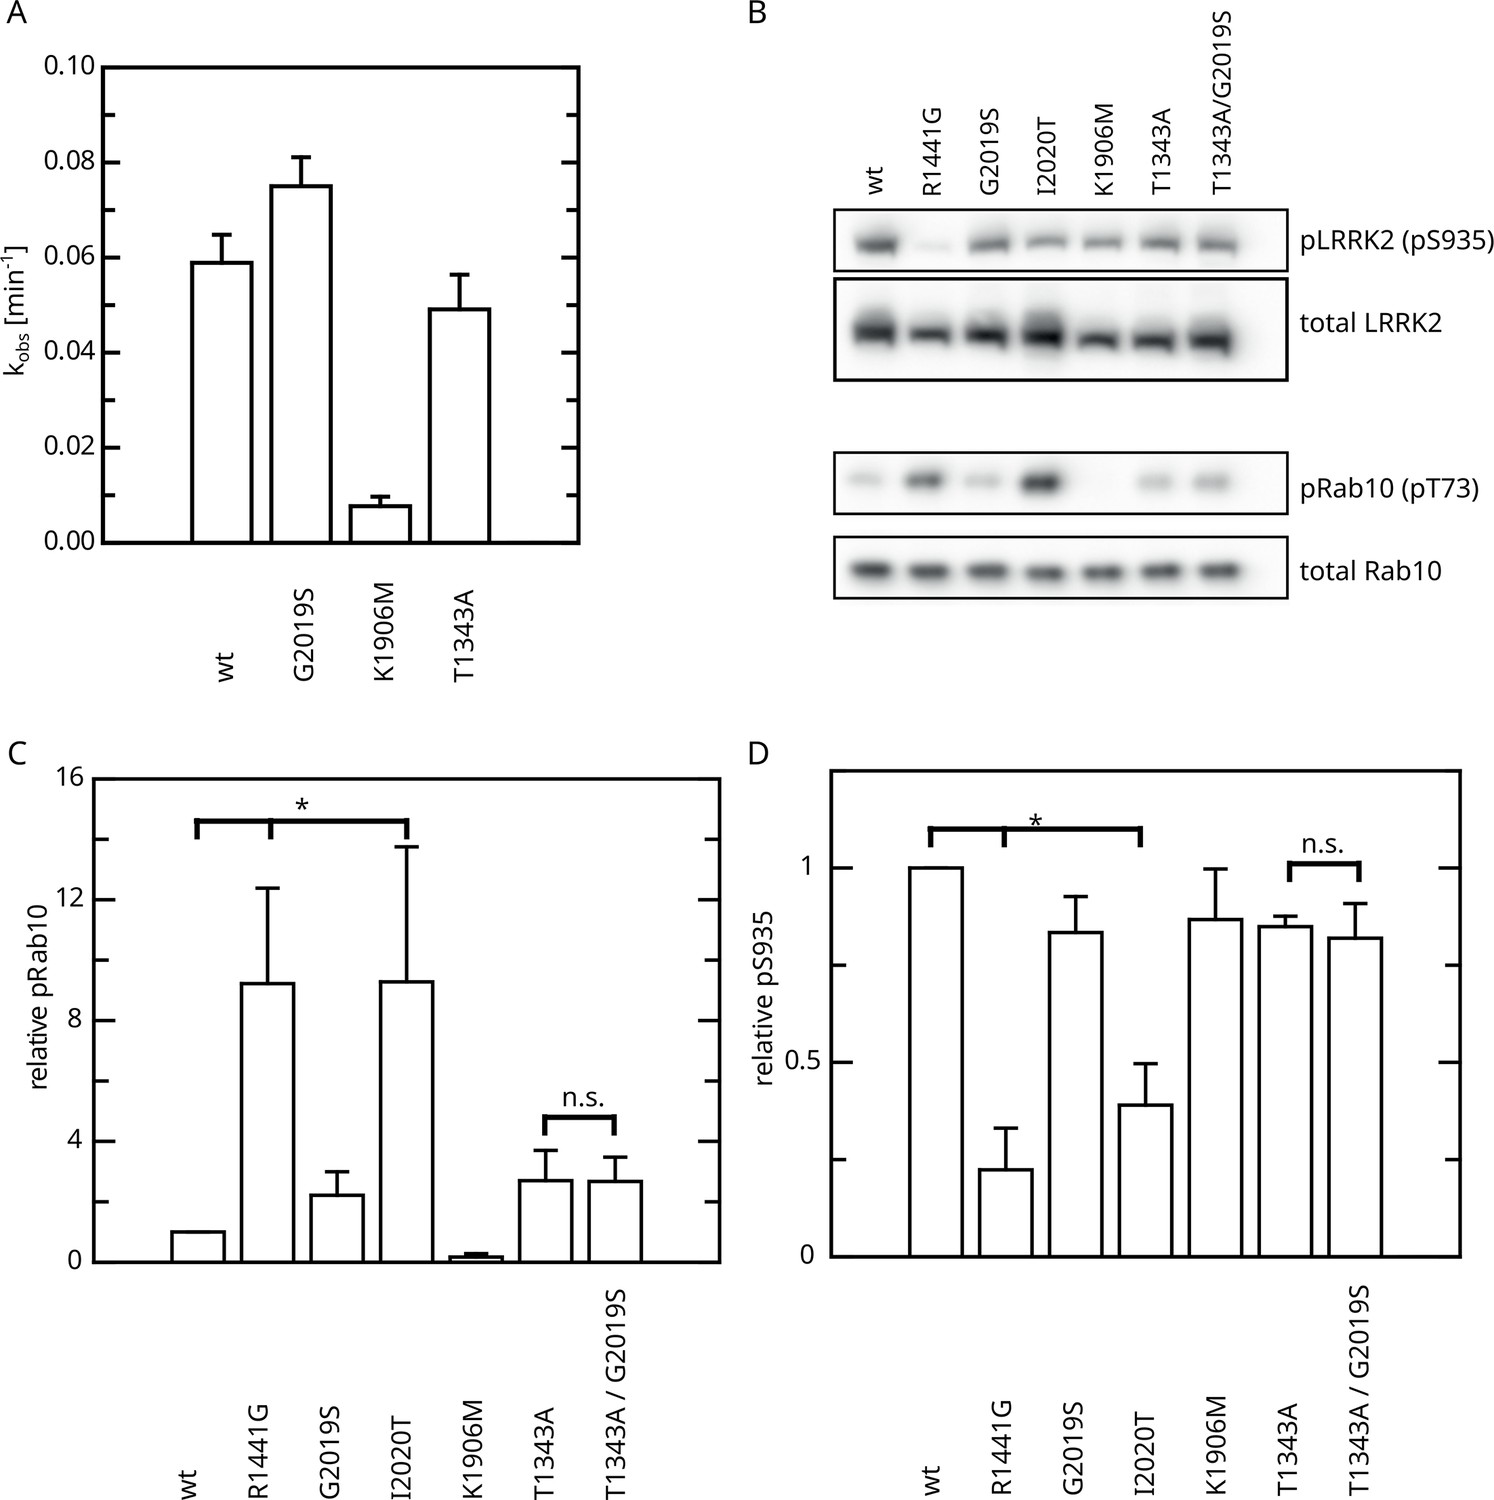
Effect of Roc T1343A on LRRK2 kinase activity and comparison to Parkinson’s disease (PD) variants.
(A) In vitro LRRKtide HPLC-based kinase assay (n=2). (B) Western blot for LRRK2 pS935, total LRRK2, Rab10 pT73, and total Rab10. (C) Relative Rab phosphorylation levels. (D) Relative LRRK2 pS935 levels. Significant differences have been determined by an ANOVA followed by a post hoc test (n=3, *p=0.05).
Figure 6—figure supplement 1
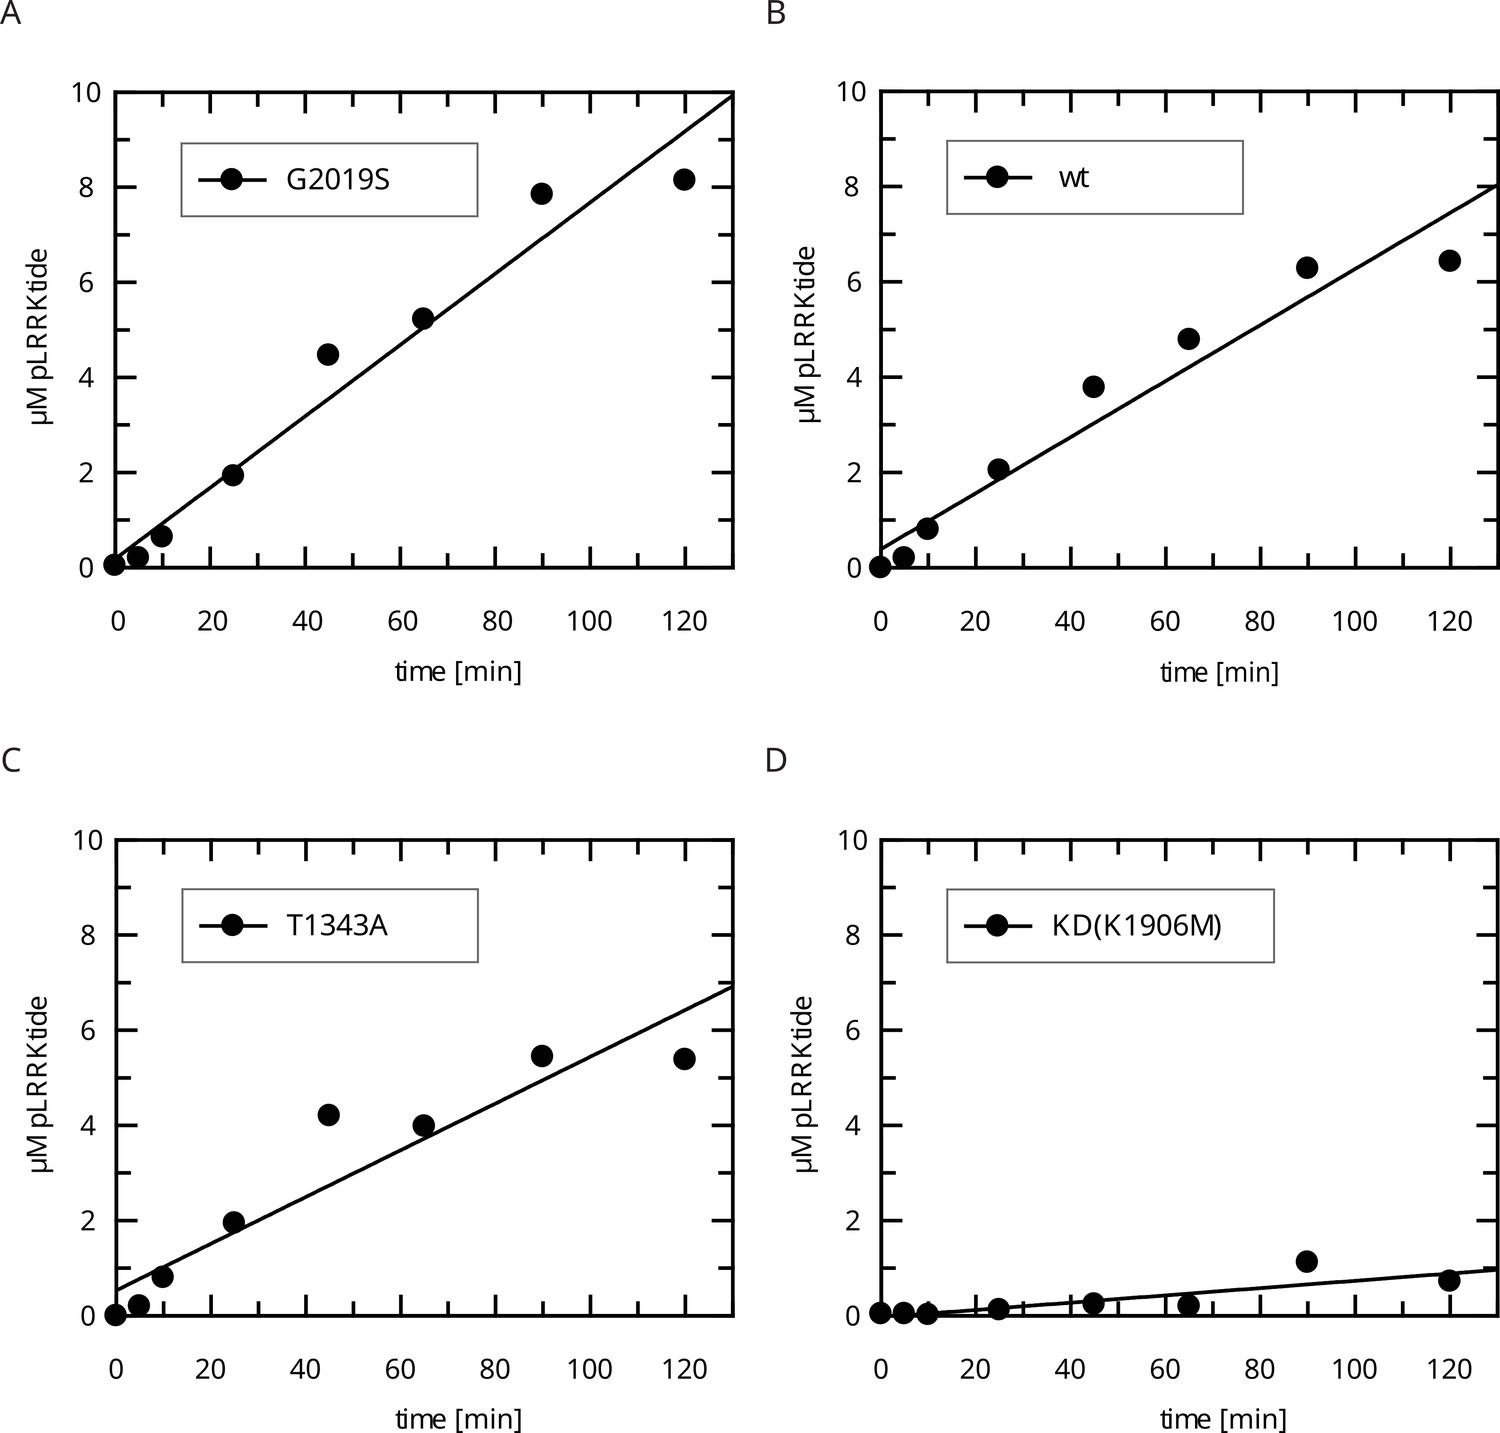
Raw data for the In vitro LRRKtide HPLC assay (determination of kobs values).
(A) LRRK2 G2019S, (B) LRRK2 wt, (C) LRRK2 T1343A, and (D) kinase-dead (KD) LRRK2 K1906M.
Figure 6—figure supplement 2
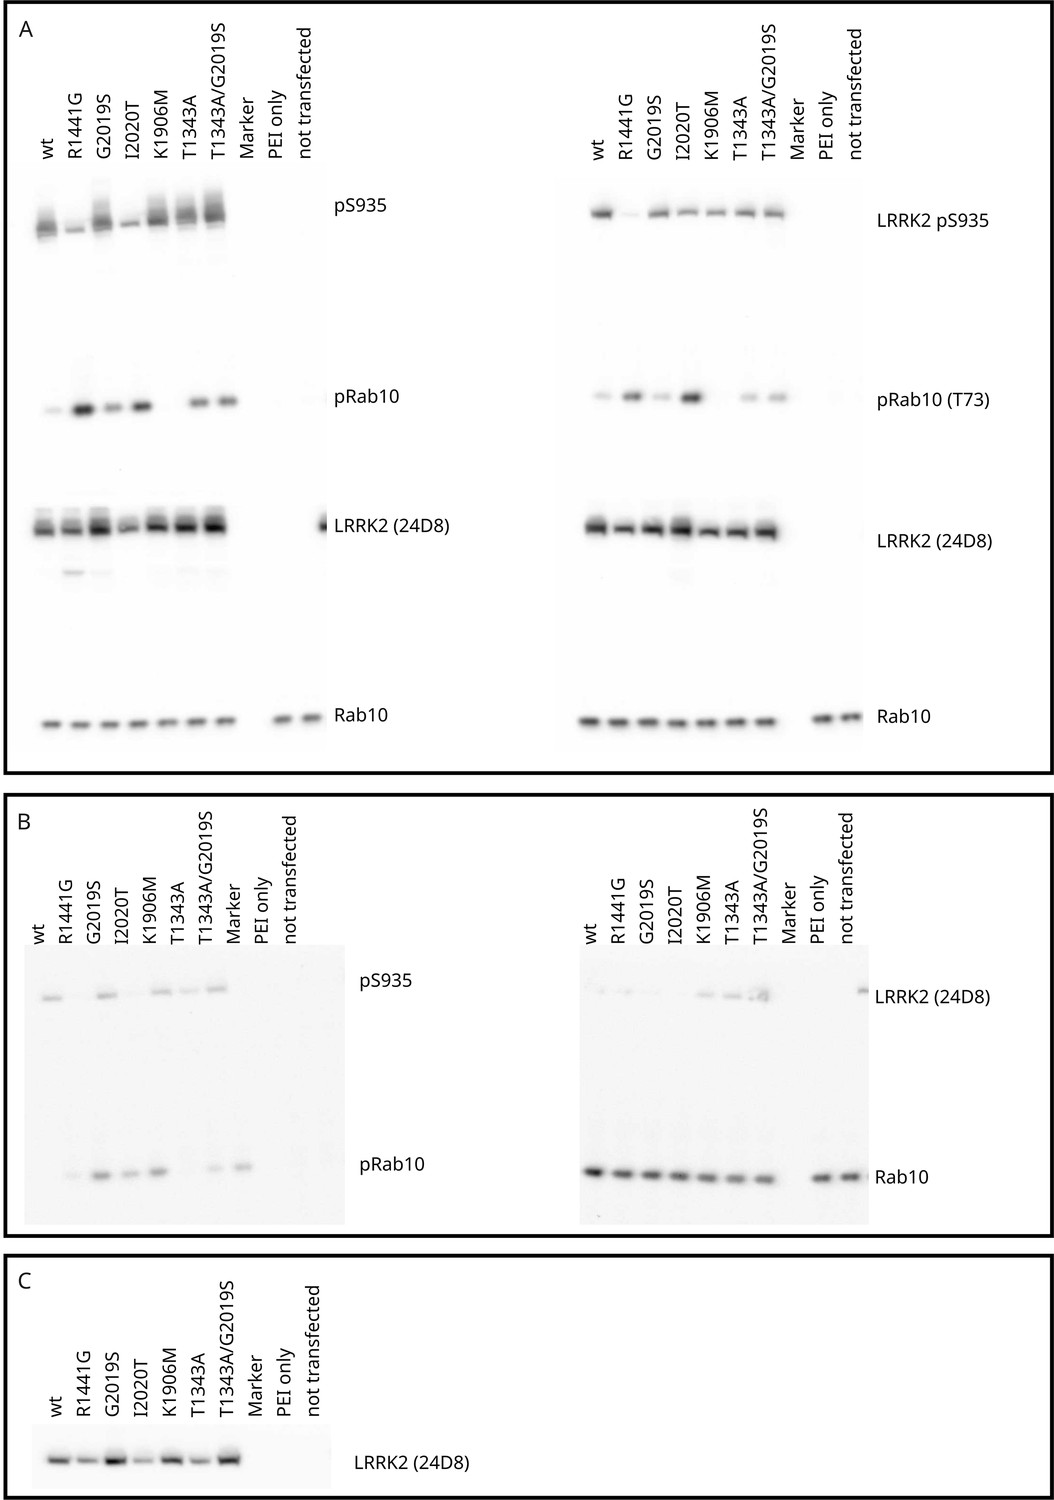
Cell-based phospho-Rab assays, blot raw images (Stella imaging system, ECL+) used for quantification (ImageJ).
(A–C) Biological replicates. Panel (C) shows the total-LRRK2 blot (24D8) for panel (B) (replication of the western blot B to allow quantification of the reference). The blots were sliced and upper and lower parts were incubated with different antibodies (see ‘Materials and methods’). After incubation with the ECL+ reagent, the membranes shown in one panel were imaged together using the Stella system (Raytest). Raw images used for quantification with ImageJ are deposited on Zenodo (https://doi.org/10.5281/zenodo.11242229).
Tables
Table 1
HPLC-based full-length LRRK2 Michaelis–Menten kinetics.
| LRRK2 variant | KM (µM) | kcat (min–1) | kcat/KM (min–1/mM) |
|---|---|---|---|
| wt | 554 ± 62 | 0.36 ± 0.02 | 0.71 ± 0.08 |
| wt+ATP | 1036 ± 169 | 0.14 ± 0.01 | 0.13 ± 0.02 |
| R1441G | 272 ± 28 | 0.43 ± 0.02 | 1.57 ± 0.23 |
| G2019S | 867 ± 110 | 0.37 ± 0.03 | 0.42 ± 0.06 |
| K1906M | 181 ± 58 | 0.28 ± 0.03 | 1.52 ± 0.52 |
| T1343A | 265 ± 25 | 0.10 ± 0.01 | 0.38 ± 0.04 |
| T1343A+ATP | 328 ± 34 | 0.10 ± 0.01 | 0.30 ± 0.03 |
Additional files
-
Supplementary file 1
Michaelis-Menten kinetic parameters determined for LRRK2-catalyzed GTP hydrolysis.
(a) MBP-RocCOR Michaelis–Menten kinetics as measured by charcoal-based GTPase assay. (b) GTPase activity (kobs) as measured by charcoal-based GTPase assay. (c) Cell-based phospho-Rab assays. Quantification of western blots.
- https://cdn.elifesciences.org/articles/91083/elife-91083-supp1-v1.docx
-
MDAR checklist
- https://cdn.elifesciences.org/articles/91083/elife-91083-mdarchecklist1-v1.pdf
Download links
A two-part list of links to download the article, or parts of the article, in various formats.
Downloads (link to download the article as PDF)
Open citations (links to open the citations from this article in various online reference manager services)
Cite this article (links to download the citations from this article in formats compatible with various reference manager tools)
Intramolecular feedback regulation of the LRRK2 Roc G domain by a LRRK2 kinase-dependent mechanism
eLife 12:RP91083.
https://doi.org/10.7554/eLife.91083.4


