A maximum of two readily releasable vesicles per docking site at a cerebellar single active zone synapse
- Université Paris Cité, SPPIN-Saints Pères Paris Institute for the Neurosciences, CNRS, France
Figures
Figure 1

Experimental approach to estimate the maximal readily releasable pool (RRP) size at parallel fiber to molecular layer interneuron (PF–MLI) synapses.
(A) Two-step model of a single release site. At rest, such a site can accommodate up to two synaptic vesicles (SVs): one SV attached to the distal replacement site (RS) and one SV attached to the proximal docking site (DS). The RRP is comprised of the SVs bound to these two sites. Red arrows depict calcium-dependent probabilities of SV movement. SV fusion occurs with a probability of P, which depends on pr, the probability of release of a docked SV, and δ, the probability of having an SV bound to the DS (adapted from Miki et al., 2016). (B) Schematics of RS/DS at rest (left), after one action potential (AP; center), and after two APs (right). After a first AP, the SV that was initially docked (SV1) is released, and the replacement SV (SV2) moves down to the DS (center). After a second AP, the latter SV (SV2) is released (right). (C) Experimental arrangement for the recording of simple PF–MLI synapses.
Figure 2

Simple synapse responses to 8-AP trains under conditions maximizing release probability and docking site occupancy.
(A) Upper panels: Exemplar traces from a simple synapse recording performed in 3 mM external calcium concentration, before (left) or after (center and right) application of the potassium channel blocker 4-amidopyridine (4-AP). Each trace shows a response to an 8-AP stimulation train at 100 Hz (stimulation times indicated by vertical dotted lines). In 4-AP, a post-tetanic potentiation (PTP) protocol was applied to further enhance readily releasable pool (RRP) size (right). Lower panels: Tables showing in color code the number of synaptic vesicle (SV) released per stimulus, as a function of stimulus number (columns) and train number (rows; traces for rows 1–4 shown in upper panels). (B, C) Group results showing released SV numbers (m ± standard error of the mean SEM) as a function of stimulus number, in control (3 mM external calcium, no further addition or manipulation, black), after addition of 4-AP (red), and when combining 4-AP with PTP induction (blue). SV numbers are given per synapse in (B). In (C), they are given per docking site, after normalization in each experiment with respect to docking site number. Number of experiments: n = 8.
-
Figure 2—source data 1
Released synaptic vesicle (SV) counts for individual experiments in various experimental conditions.
This Excel Table lists si results in control, after 4-amidopyridine (4-AP) infusion, and after post-tetanic potentiation (PTP) induction, for the 14 individual experiments used in the present work (group results shown in Figure 2B). It also shows Pi results in the same conditions (group results shown in Figures 2C and 6), as well as P1 + P2 results (group results displayed in Figure 4). Finally, it shows 200 Hz results for a subset of experiments (group results shown in Figure 5).
- https://cdn.elifesciences.org/articles/91087/elife-91087-fig2-data1-v1.xlsx
Figure 3 with 1 supplement

Determination of docking site number using variance/mean analysis and binomial distribution analysis.
(A) Comparison of the determination of N, the docking site number, either with variance–mean analysis of released synaptic vesicle (SV) numbers for stimuli 1–8 (left; black closed circles: data; solid red trace: fit with parabola), or by fitting distributions of released SV numbers in response to the first (center) and second (right) stimulus (black closed circles: data; solid traces: fits with binomial models assuming various N values). Same experiment as in Figure 2A, center, in the presence of 4-amidopyridine (4-AP). The estimated N value with the variance–mean method was 3.8 ± 0.2 (left), and 4 with the binomial analysis (center and right, red curves). (B) Group analysis of eight experiments, normalized to four docking sites, showing variance–mean relation for stimuli 1–8 in control, in 4-AP and during post-tetanic potentiation (PTP; closed circles and error bars: m ± standard error of the mean [SEM]; solid curves: fit of means with parabola). (C) Exemplar experiment where N was determined as 4, showing a close similarity between distributions of released SV numbers in response to first AP in the three conditions (closed circles with dotted curves) and binomial fits assuming N = 4 (solid curves). (D) Group analysis of four experiments as in C (closed circles and error bars: m ± standard error of the mean [SEM]; solid curves: fit of means with binomial model assuming N = 4).
Figure 3—figure supplement 1
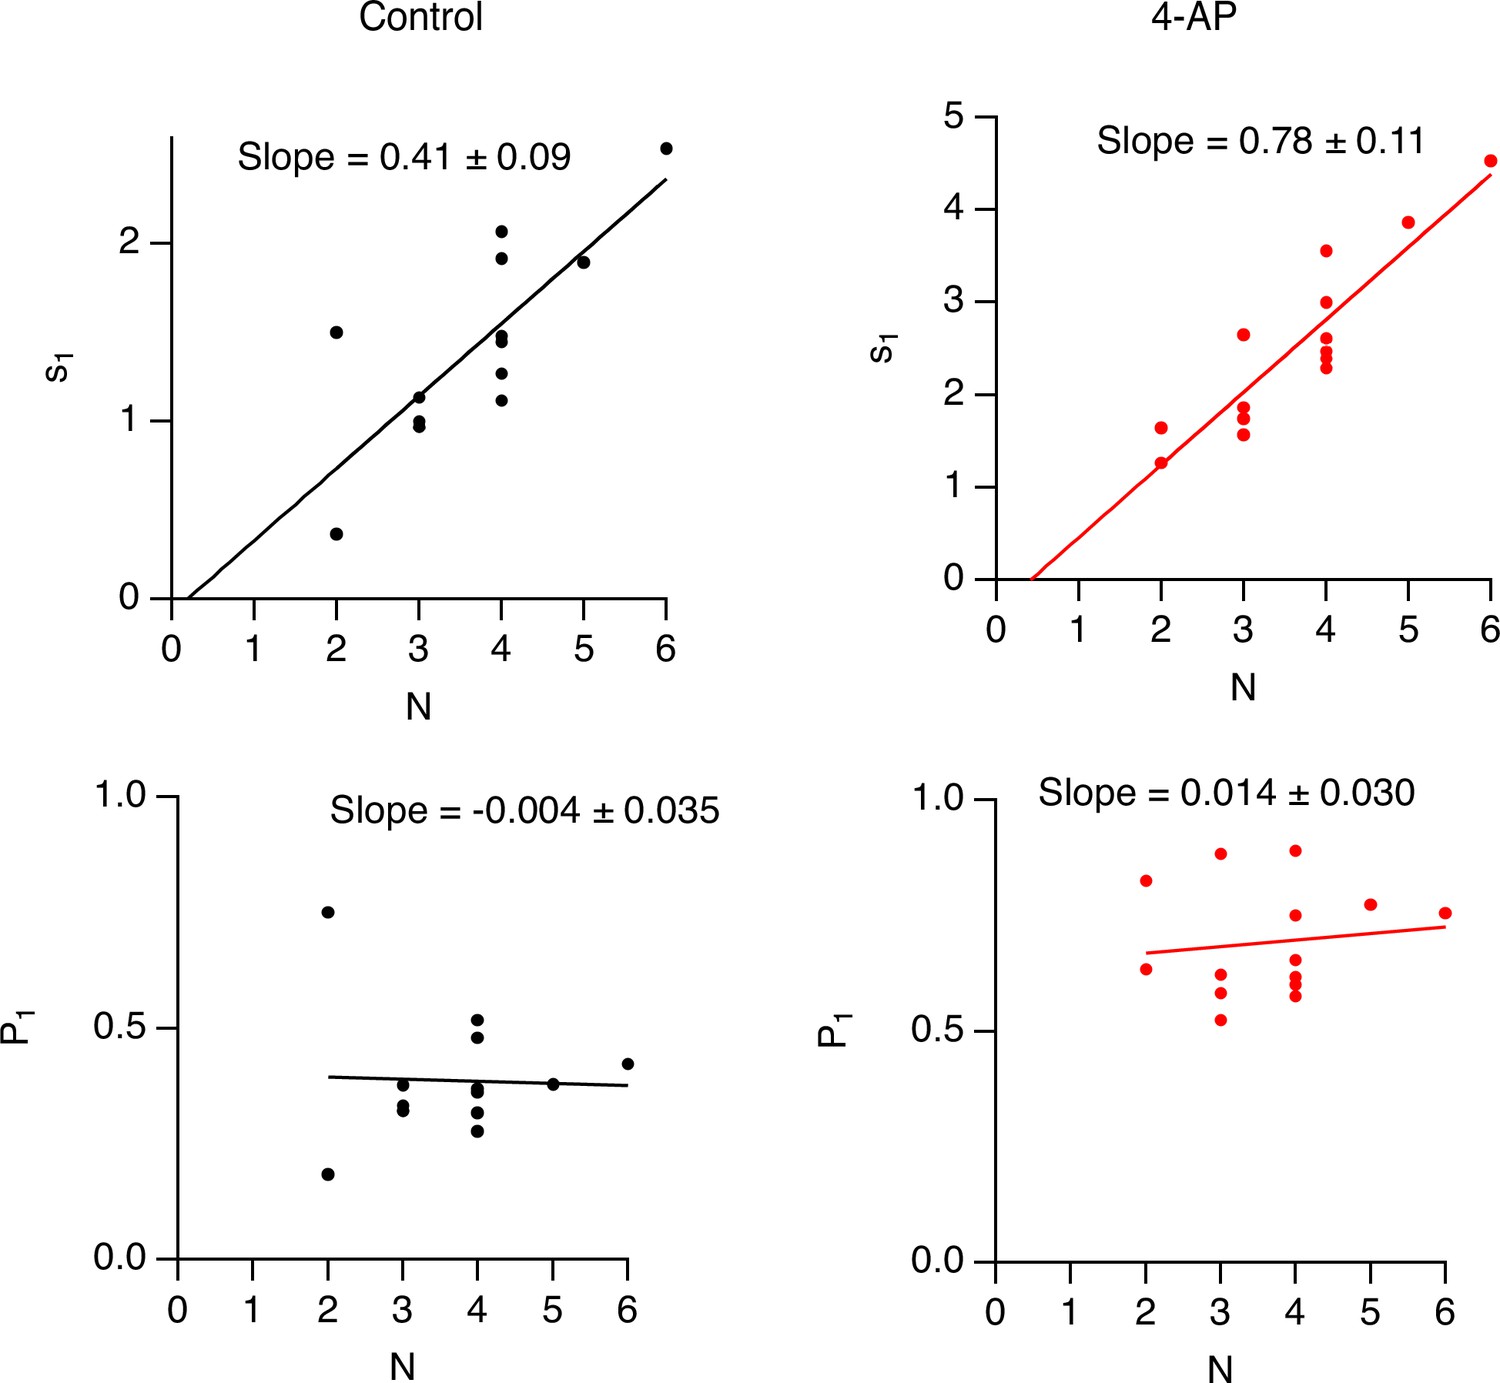
Lack of correlation between P1 and N.
Upper panels: Plots of s1 as a function of docking site number N across n = 14 experiments indicate a strong correlation both in control conditions (left, black data points and regression line) and in the presence of 4-amidopyridine (4-AP) (right, red data points and regression line), with regression lines close to proportionality in both cases. Lower panels: Plots of P1 as a function of N from the same experiments fail to reveal any significant correlation in control condition or after addition of 4-AP. The lack of correlation between P1 and N argues against a significant underestimate of synaptic vesicle (SV) numbers due to event overlap (see Methods).
Figure 4
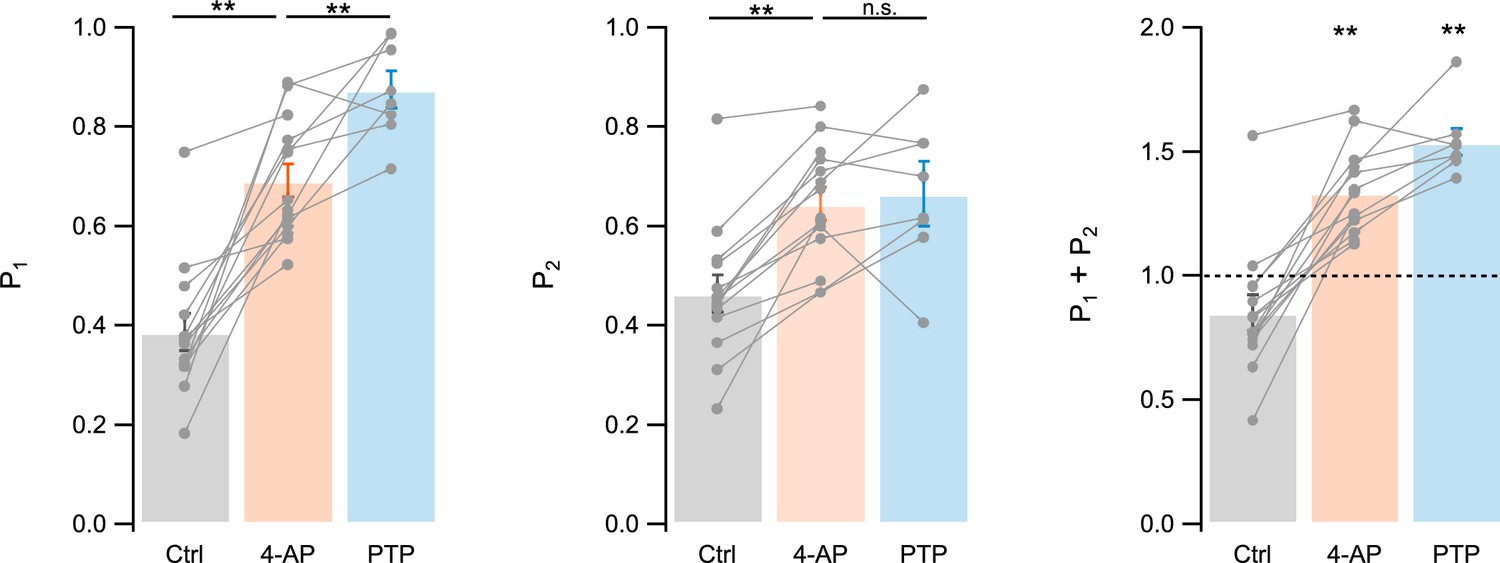
Summary results for P1, P2, and P1 + P2.
Summary results for P1 (left), P2 (center), and P1 + P2 (right) in control, in 4-amidopyridine (4-AP), and during post-tetanic potentiation (PTP). Gray closed circles and linking lines indicate individual experiments; bars and associated margins indicate m ± standard error of the mean (SEM). n = 14 experiments for control and 4-AP, and n = 8 experiments for PTP. ** labels indicate significant differences between conditions (left and center, paired t-tests), and significant differences from 1 (right), with p < 0.01.
Figure 5
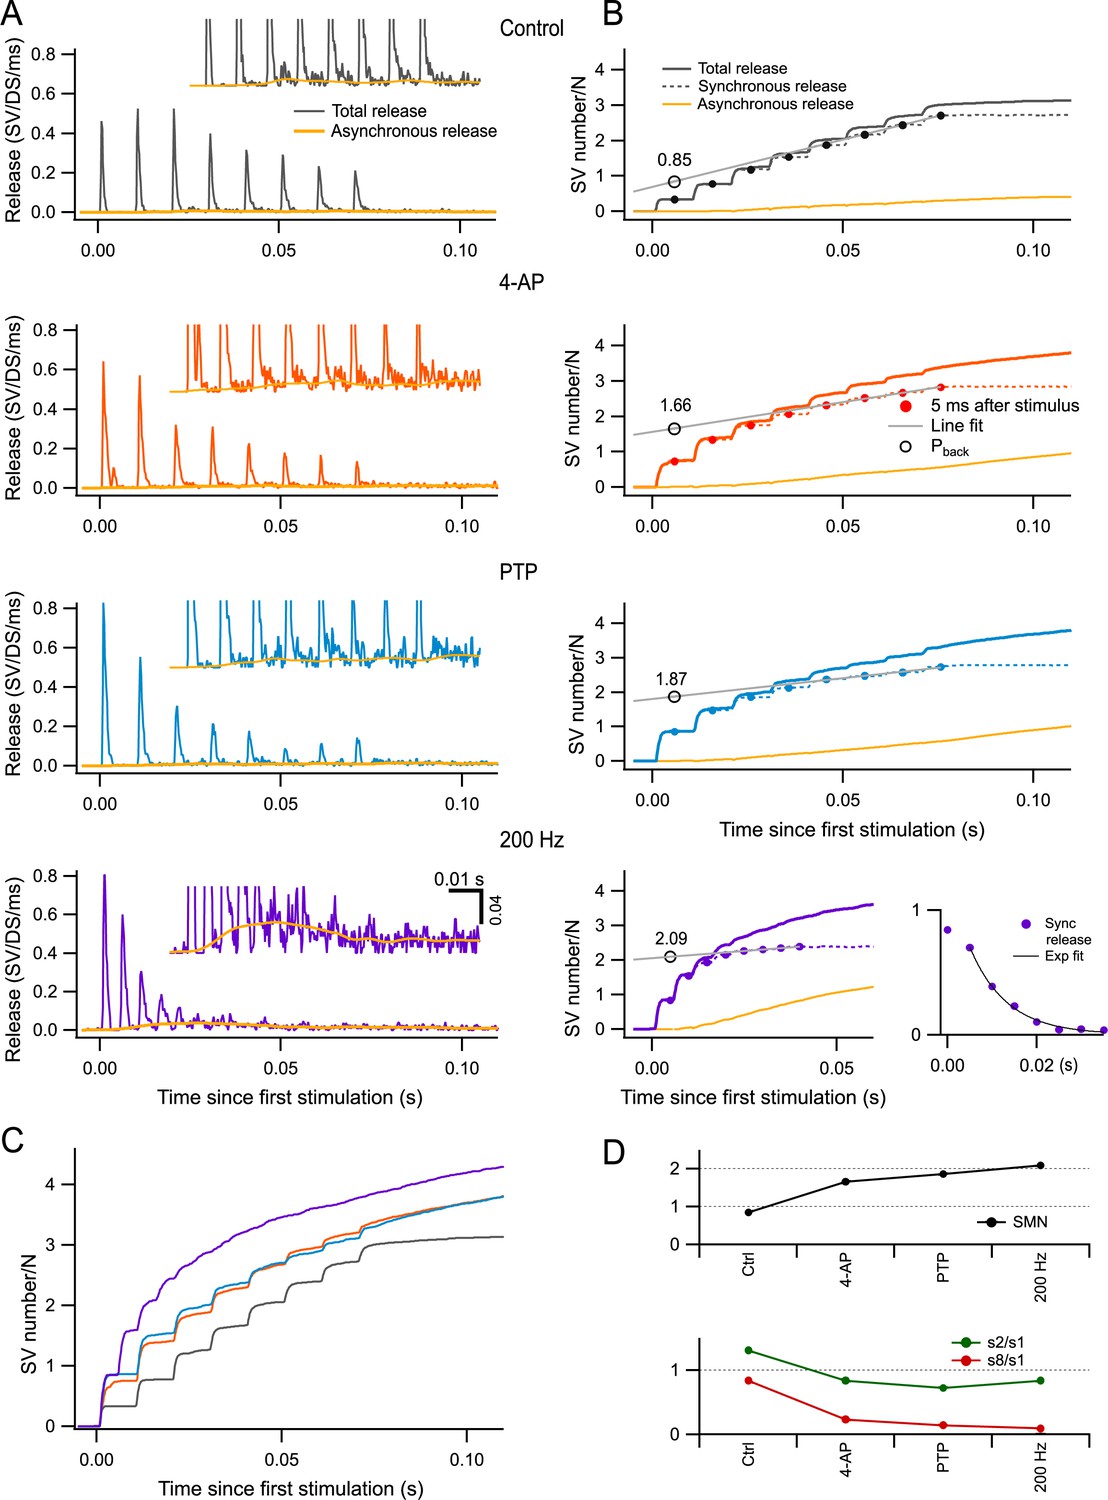
Estimation of readily releasable pool (RRP) size per docking site by back-extrapolation of cumulative release numbers.
(A) Release rate per docking site (from top to bottom: black, control; red, 4-amidopyridine [4-AP]; blue, during post-tetanic potentiation [PTP]; purple, during PTP when accelerating the stimulation rate to 200 Hz) averaged from n = 5–7 experiments with 8-AP trains. Yellow curves close to the baseline indicate estimated asynchronous release in each plot. Insets show expansions of the plots in the low-amplitude range. (B) Cumulative numbers of released synaptic vesicles (SVs) obtained by integration of the plots in (A) (continuous black, red, blue, and purple curves: total release; dotted curves: synchronous release; continuous yellow curves: asynchronous release). Closed symbols indicate estimates of cumulative synchronous release per docking site as a function of stimulus number (i); they are placed 5 ms after each stimulus, when measurements were complete. A regression line through the dots obtained for i = 6–8 (black plot) or for i = 5–8 (red, blue, and purple plots) was back-extrapolated to the time of the first measurement, giving estimates of the RRP per docking site (open symbols: Pback). Bottom right panel: Plot of si (synchronous release only) in conditions of 4-AP and PTP, at a stimulation frequency of 200 Hz. An exponential fit for i > 2 displays a time constant of 8.3 ms and a 0-ordinate asymptote. (C) Superimposition of the cumulative total release rates shown in (B), illustrating the gradual shift from synchronous to asynchronous release as a function of stimulus number in the various conditions of panels (A, B). (D) Plots of RRP size per docking site (upper panel), of the paired-pulse ratio (s2/s1, green points in lower panel), and of synaptic depression (s8/s1, red points in lower panel) calculated for synchronous release in the different conditions illustrated in (A, B). n = 7 independent experiments for 100 Hz stimulations (control, 4-AP, and PTP); five of these experiments included also data at 200 Hz after PTP.
Figure 6 with 2 supplements
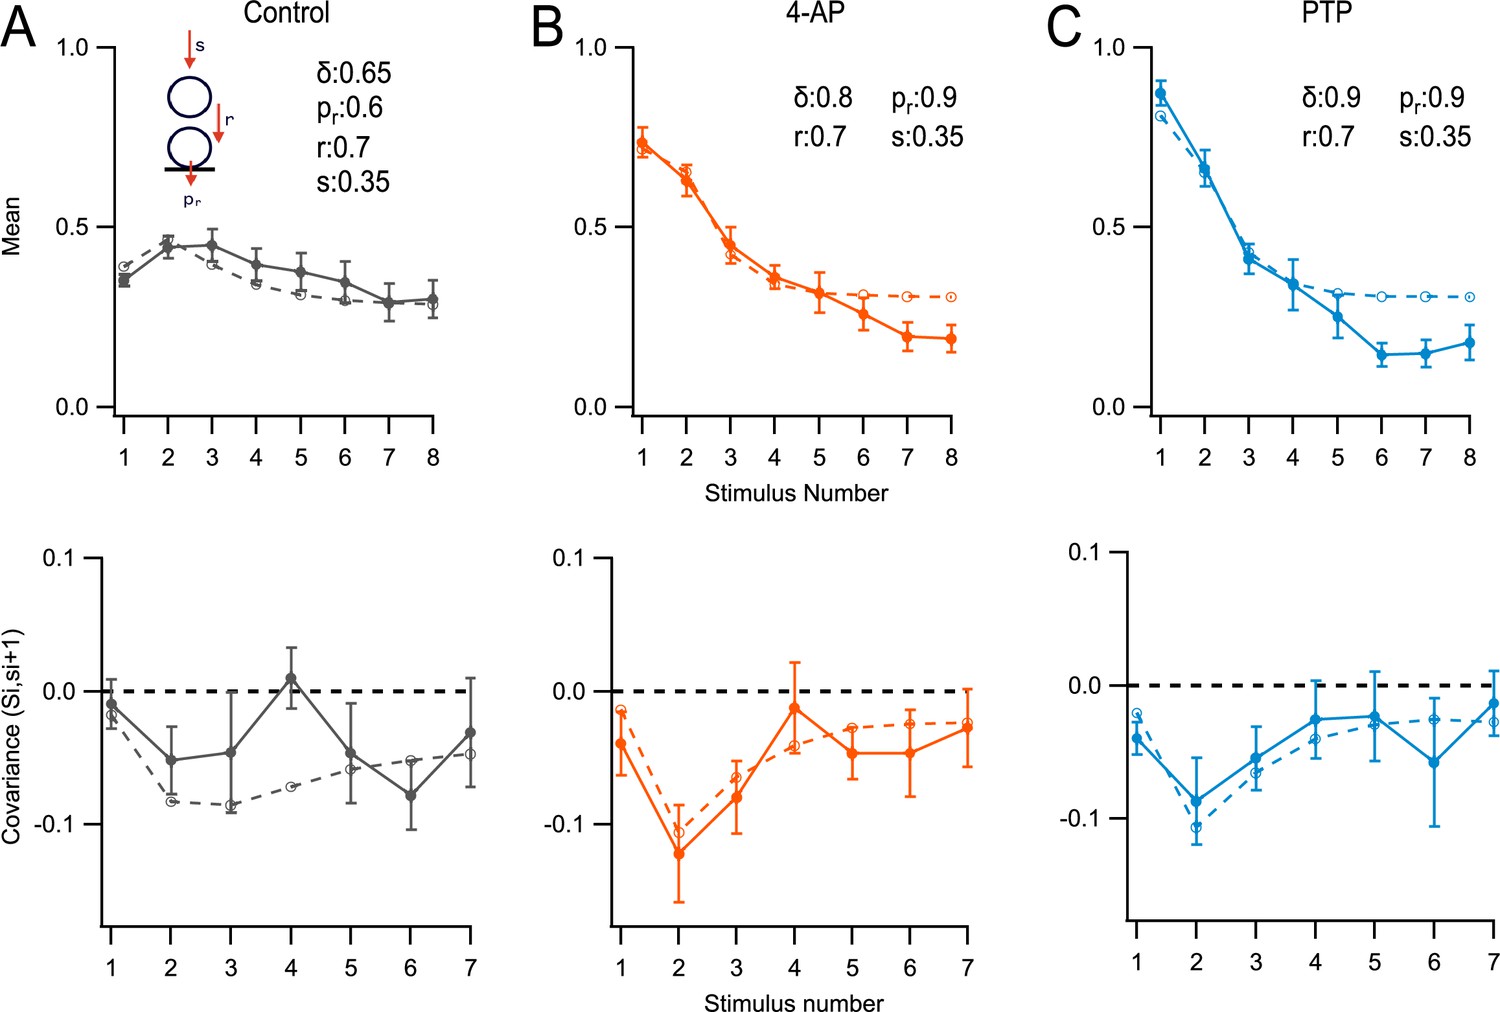
Modeling.
Monte Carlo simulations of the responses to an 8-AP train at 100 Hz for a simple synapse obeying the replacement site/docking site (RS/DS) two-step model. Here, si values represent numbers of released synaptic vesicles (SVs) per docking site after stimulus number i, uncorrected for asynchronous release. Si values represent the sum of si up to stimulus number i. Experimental data (m ± standard error of the mean [SEM]) are displayed as closed symbols, and model results as open symbols. (A) Mean SV release number (<si> vs. i: upper panel), and covariance of Si and si+1 lower panel: covar(Si, si+1) vs. (i) in control conditions. (B) As in (A), in 4-amidopyridine (4-AP). (C) As in (B), during post-tetanic potentiation (PTP).
Figure 6—figure supplement 1
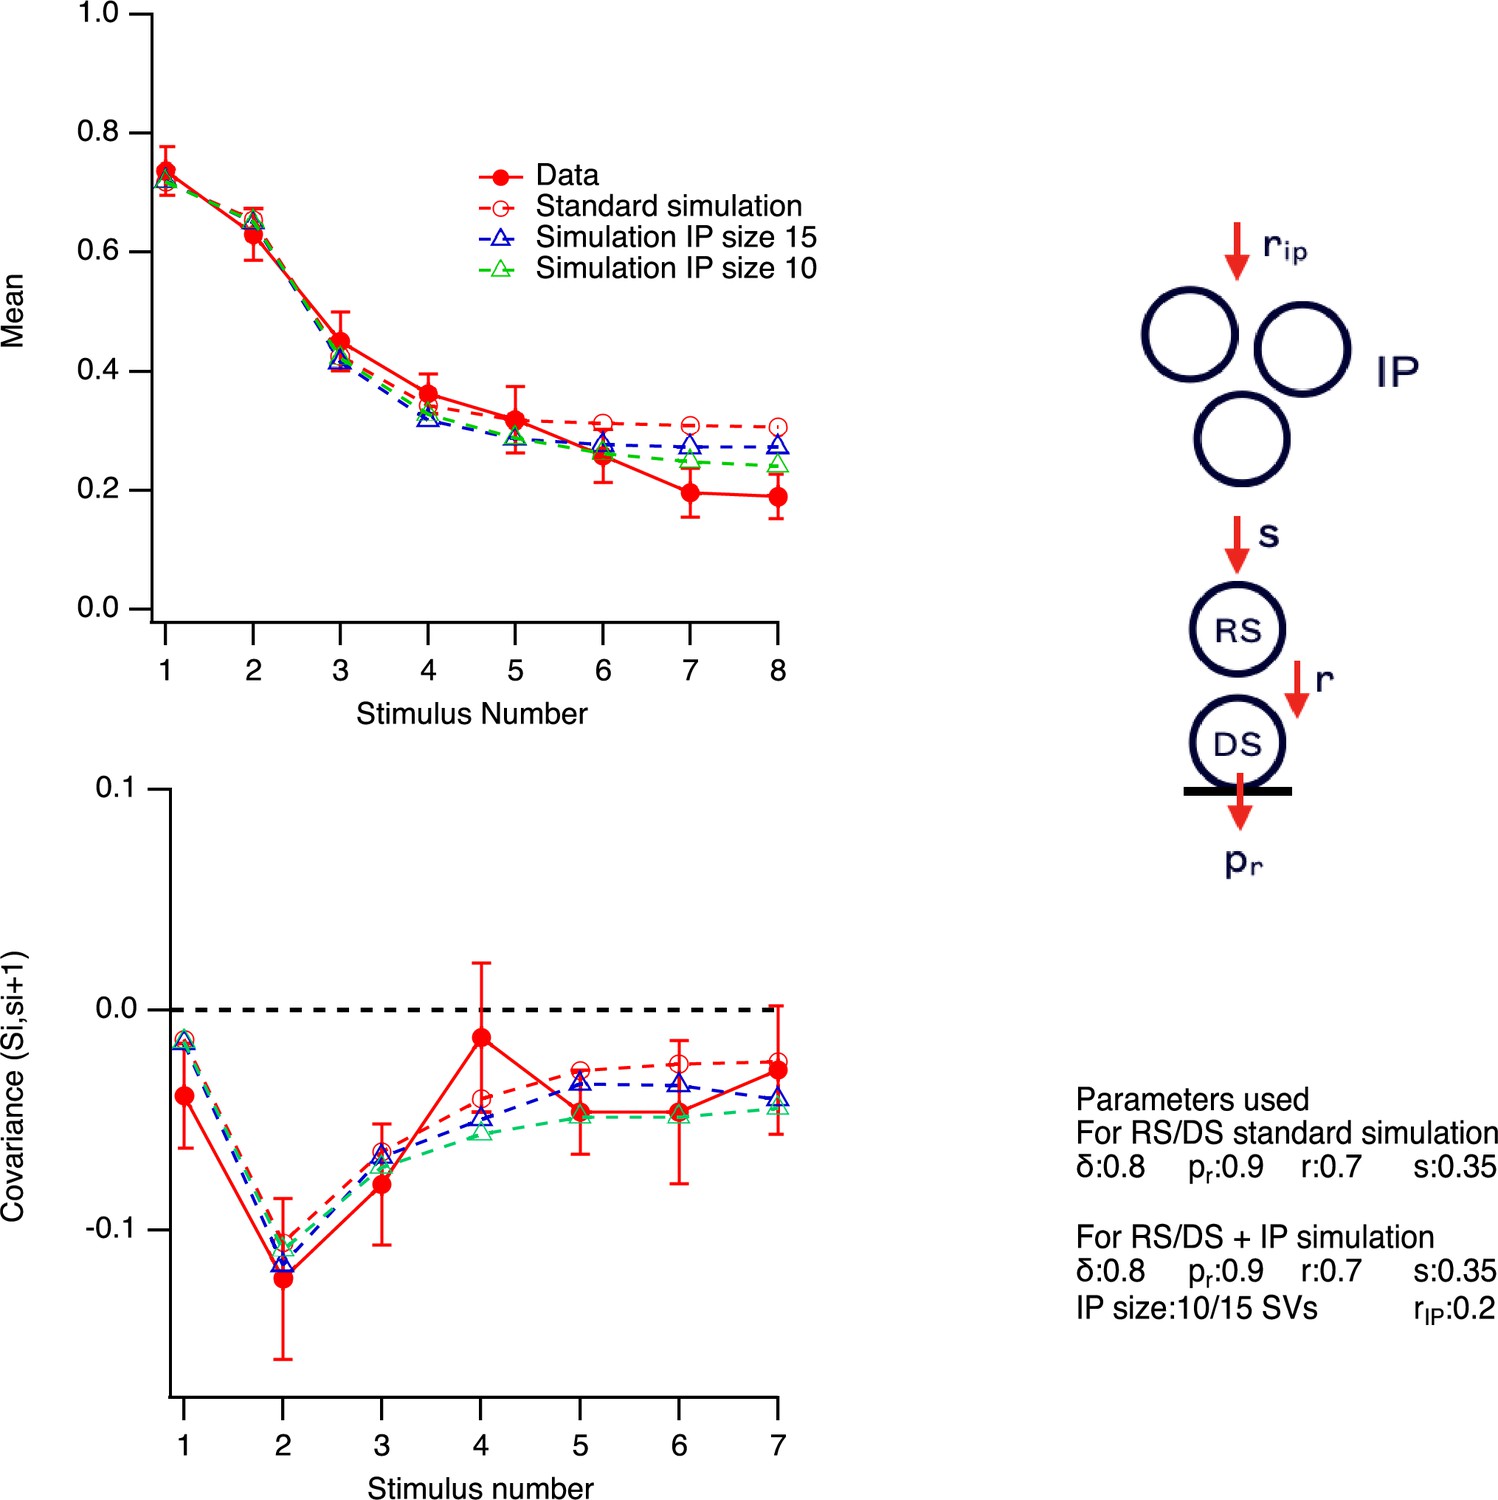
Replacement site/docking site (RS/DS) model with finite intermediate pool (IP).
In this simulation, we modified the RS/DS model in 4-amidopyridine (4-AP) (Figure 6B) to incorporate an IP with finite size feeding RSs (Tran et al., 2022). The corrected model had the same parameter values as in Figure 6B, plus two additional parameters characterizing the size (NIP) and the replenishment rate (rIP) of the IP. These parameters were set at 15 synaptic vesicle (SV) and 0.2 per AP, respectively. In the model, coupling betwen IP size and readily releasable pool (RRP) was introduced by making the transition probability s proportional to the filling state of the IP. Once corrected for the IP, the model was able to fit the si curve better (blue triangles, top panel). The quality of fit of the covariance curve (bottom panel) was similar before and after incorporation of the IP.
Figure 6—figure supplement 2
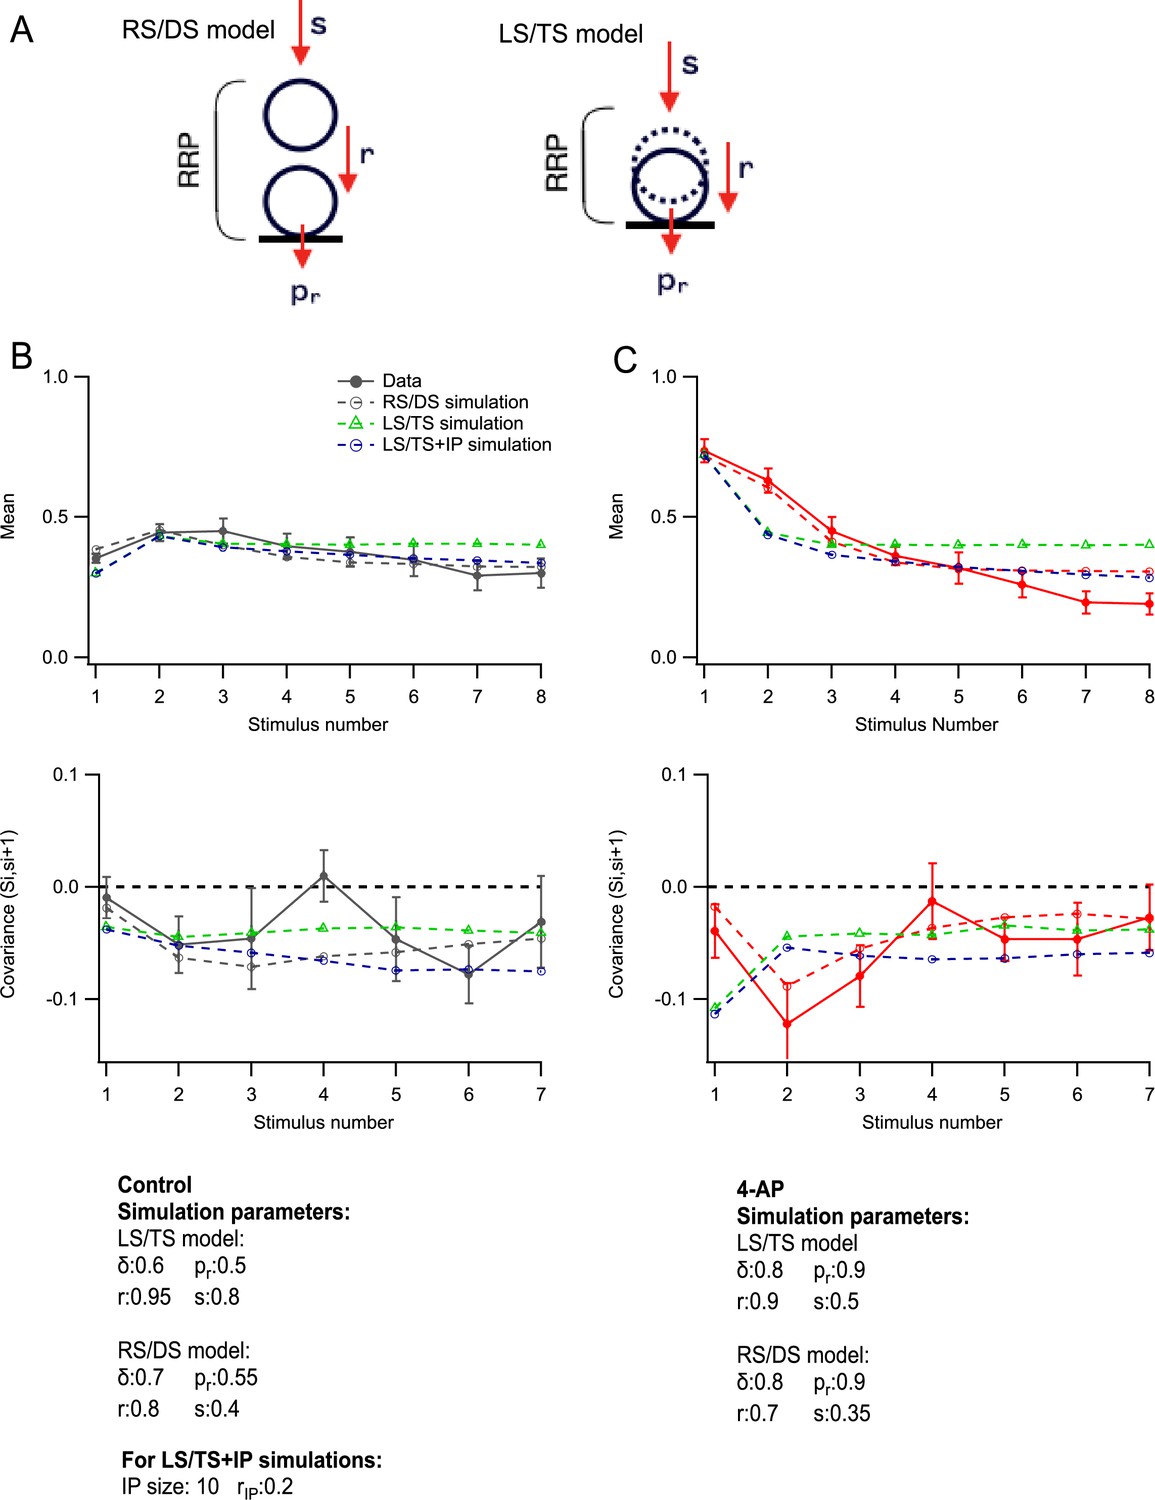
Replacement site/docking site (RS/DS) model vs. loose state/tight state (LS/TS) model.
(A) Comparison between RS/DS model (left) and LS/TS model (right). (B) This simulation shows fits with the RS/DS model (black open symbols; no intermediate pool [IP]) and with the LS/TS model (green open symbols without IP; blue open symbols with an IP of 10 synaptic vesicles [SVs]) of control data (closed black symbols). Data and simulation values are shown for individual release units. (C) As in (B) but for 4-amidopyridine (4-AP) condition. Here, the predictions of the LS/TS model differ from data (red closed symbols), both for the upper plot (<si>) and for the lower plot (cov(Si, si+1)). By comparison, the RS/DS model comes closer to the data (open red symbols).
Author response image 1
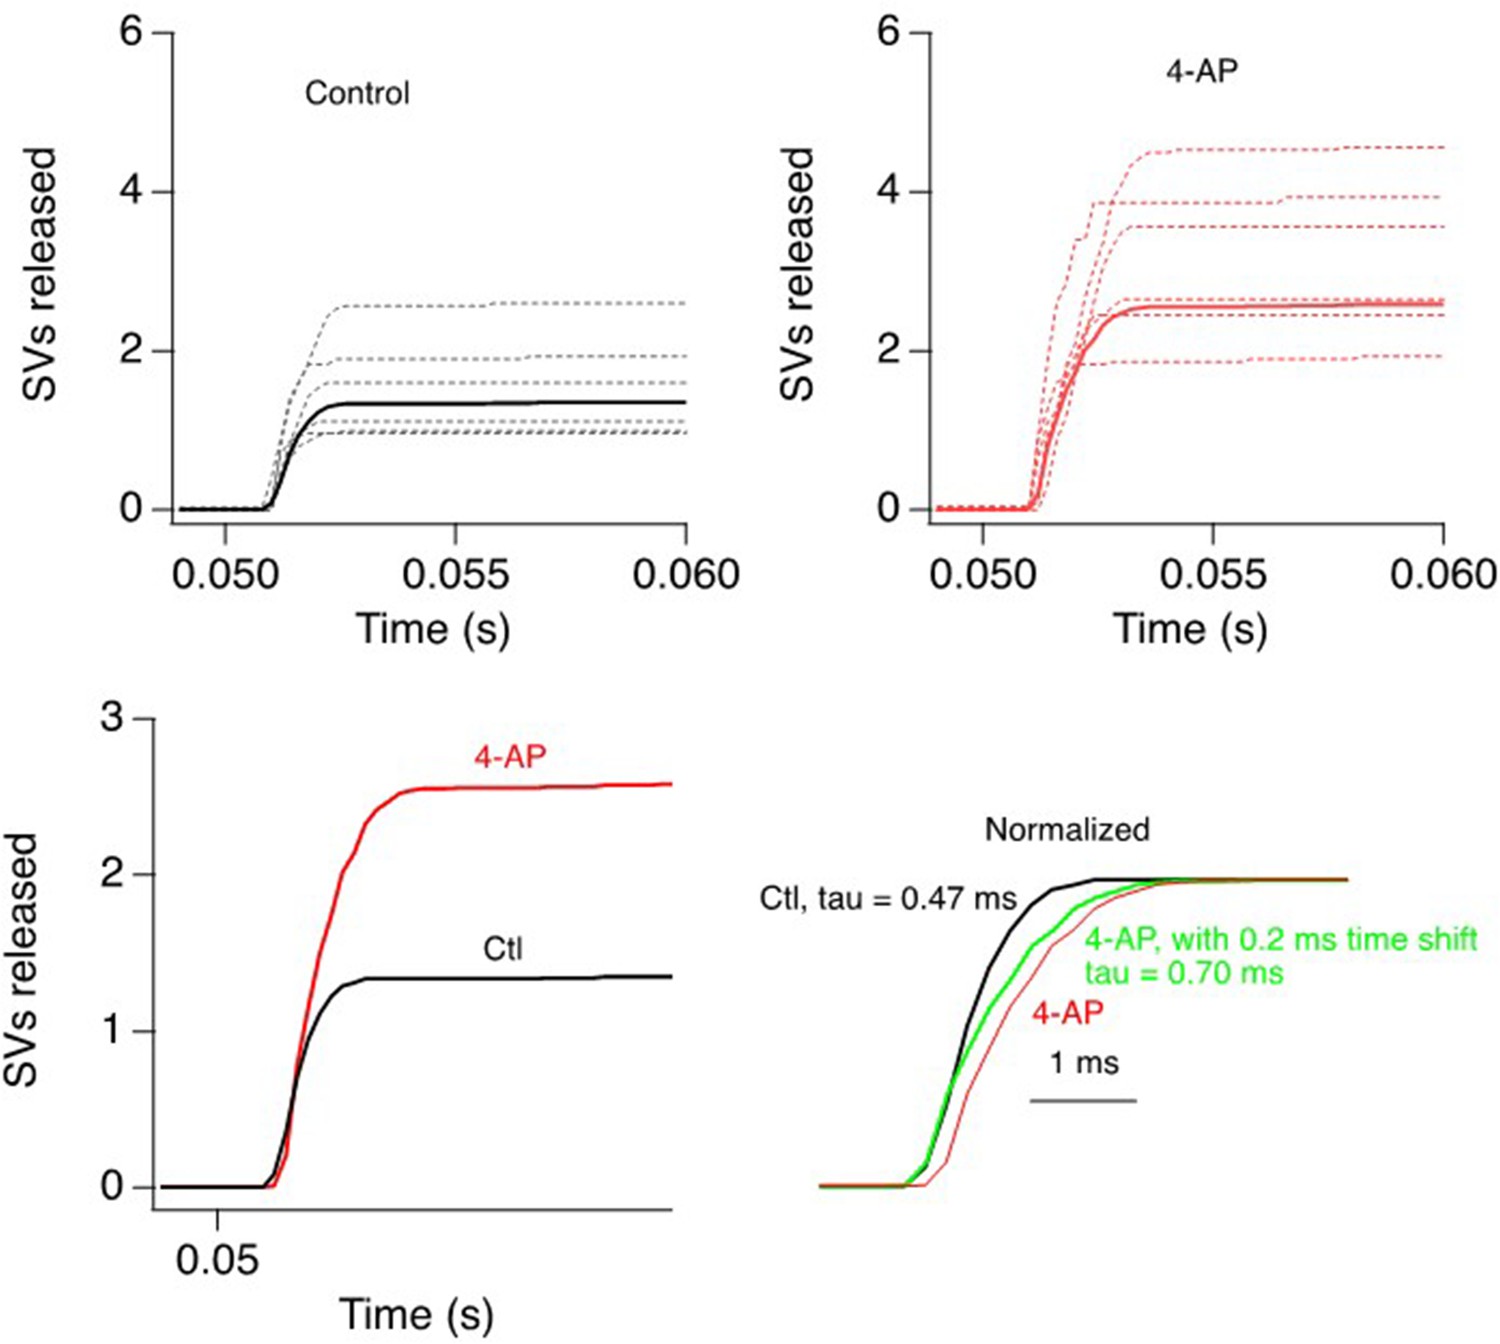
Latency histograms for s1 in control and in the presence of 4-AP.
After normalization, the averaged latency histogram in 4-AP displays an additional delay of 0.2 ms, and a slowing of the time constant τf from 0.47 ms to 0.70 ms.
Additional files
Download links
A two-part list of links to download the article, or parts of the article, in various formats.
Downloads (link to download the article as PDF)
Open citations (links to open the citations from this article in various online reference manager services)
Cite this article (links to download the citations from this article in formats compatible with various reference manager tools)
A maximum of two readily releasable vesicles per docking site at a cerebellar single active zone synapse
eLife 12:RP91087.
https://doi.org/10.7554/eLife.91087.3


