Functional diversity of dopamine axons in prefrontal cortex during classical conditioning
- Department of Neuroscience, Medical University of South Carolina, United States
- Department of Pharmacology, Kagoshima University, Japan
- Institute for Quantum Life Science, National Institutes for Quantum Science and Technology, Japan
- Japan Science and Technology PRESTO, Japan
- Department of Physiology, Monash University, Australia
- Neuroscience Program, Biomedicine Discovery Institute, Monash University, Australia
- Faculty of Data Science, Shiga University, Japan
- Department of Biology, College of Charleston, United States
- Department of Neuro-Medical Science, Osaka University, Japan
- Japan Science and Technology FOREST, Japan
Figures
Figure 1 with 3 supplements
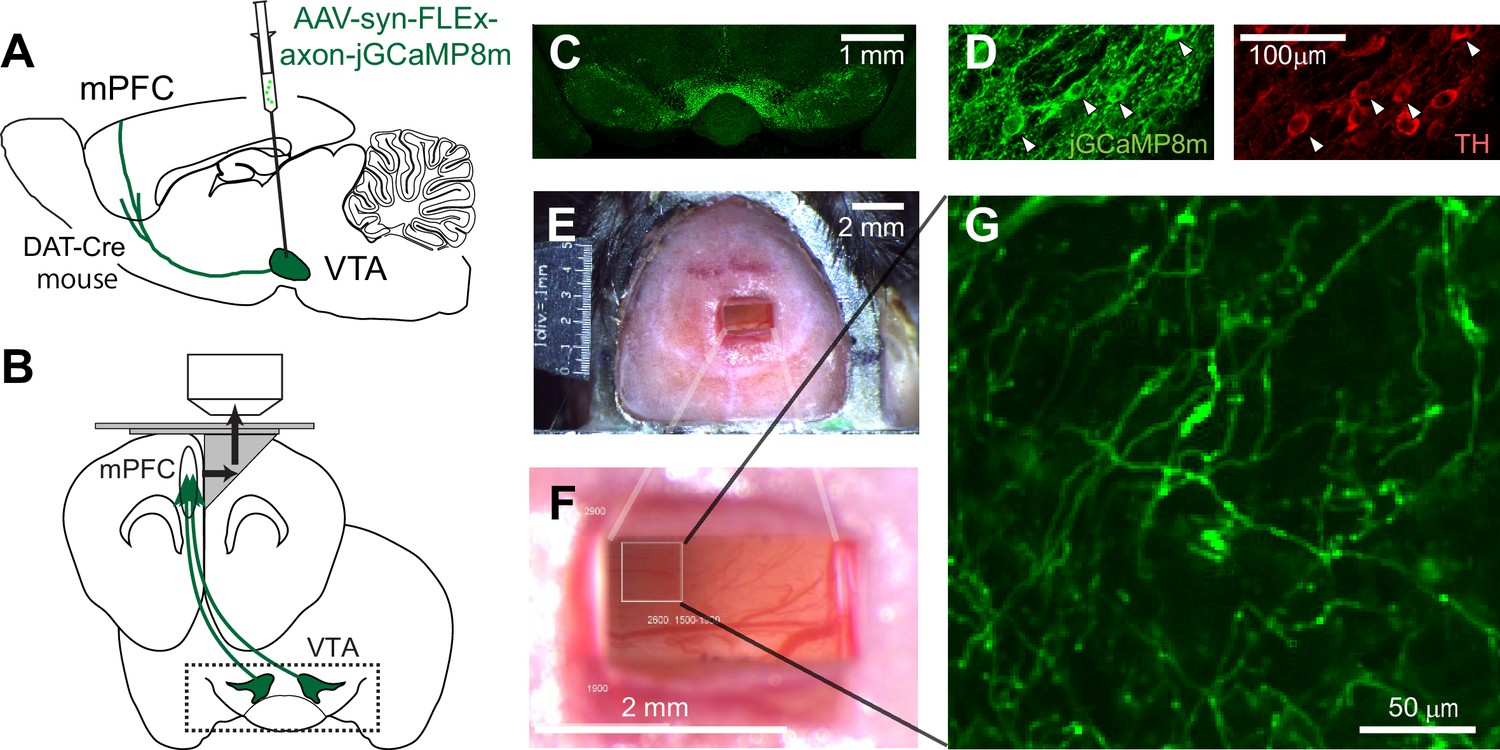
Two-photon imaging of dopaminergic axons projecting to the mPFC.
(A, B) Experimental design. The activity of midbrain dopamine neurons projecting to the mPFC was measured by two-photon calcium imaging of their axons. The axons were accessed through a microprism that bends the optical axis inside the brain (black arrows in B). (C) GCaMP was expressed virally in dopamine neurons in DAT-Cre transgenic mice. A coronal section shows GCaMP expression in the VTA, demonstrating that AAV-axon-DIO-jGCaMP8m was injected into the VTA. (D) jGCaMP8m-expressing neurons were positive for tyrosine hydroxylase (TH), a marker for dopamine neurons. (E, F) Dorsal view of a mouse head implanted with a microprism assembly. The microprism was 1x2 mm. (G) An example in vivo image of jGCaMP8m-expressing axons.
Figure 1—figure supplement 1

Sparse dopaminergic projections to the the mPFC.
(A) Example experiment of AAV-GFP injection into the VTA in the Allen Brain Atlas Data Portal (experiment No. 156314762). (B) Sparse GFP-expressing axons in the mPFC region, including the prelimbic area the same experiment shown in (A). (C) Sparse jGCaMP8m expression at the mPFC was observed in our experiment. The approximate position of the image is indicated as a square in B. (D) The signal of projected GFP axons at the prelimbic area was 1.3% ± 0.9% of that at the caudoputamen. All experiments at the Allen Portal used wild-type or tyrosine hydroxylase-Cre mice that received an AAV-GFP injection into the VTA (experiment No. 156314762, 120572378, 127796728).
Figure 1—figure supplement 2
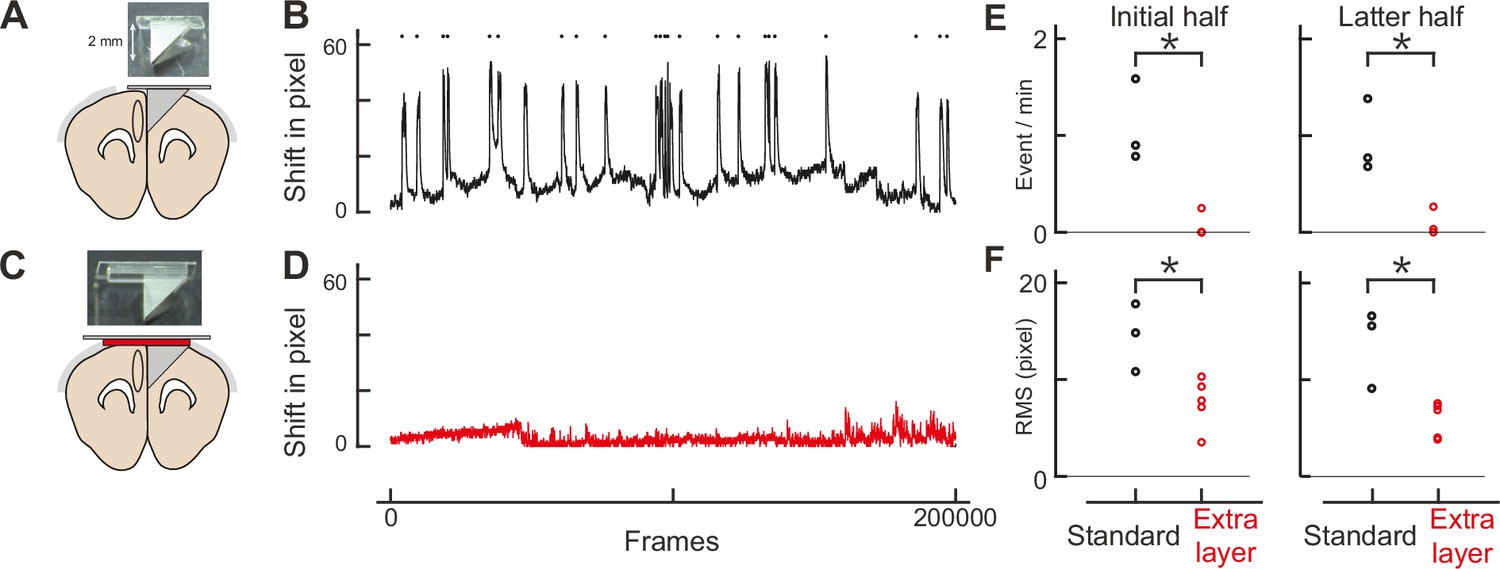
Double-layer glass significantly reduces brain movement.
(A) An assembly design similar to Low et al., 2014. (B) Brain movement during imaging with the assembly design similar to Low’s. The brain shift was computed by the Suite2p program, and shifts in pixels in the x and y dimensions were combined trigonometrically. The frame rate was 58 Hz (200,000 frames corresponds to ~57 minutes). Each pixel represents 0.31 μm. Movement events larger than 16 pixels (4.96 μm) were detected as red dots. (C) Our own assembly design with an additional layer of glass. (D) Similar to B, but with our assembly design. (E) The frequency of movement events larger than 5 μm for Low’s design (standard: n = 3) and ours (extra layer: n=5) for the initial (left panel) and latter (right panel) halves of imaging. The root mean square is statistically smaller with our design (initial half: p = 0.002, latter half: p = 0.002, t-test). (F) Similar to E, but for root mean square of the brain shift. The events are less frequent with our design (initial half: p = 0.018, latter half: p = 0.005, t-test).
Figure 1—figure supplement 3
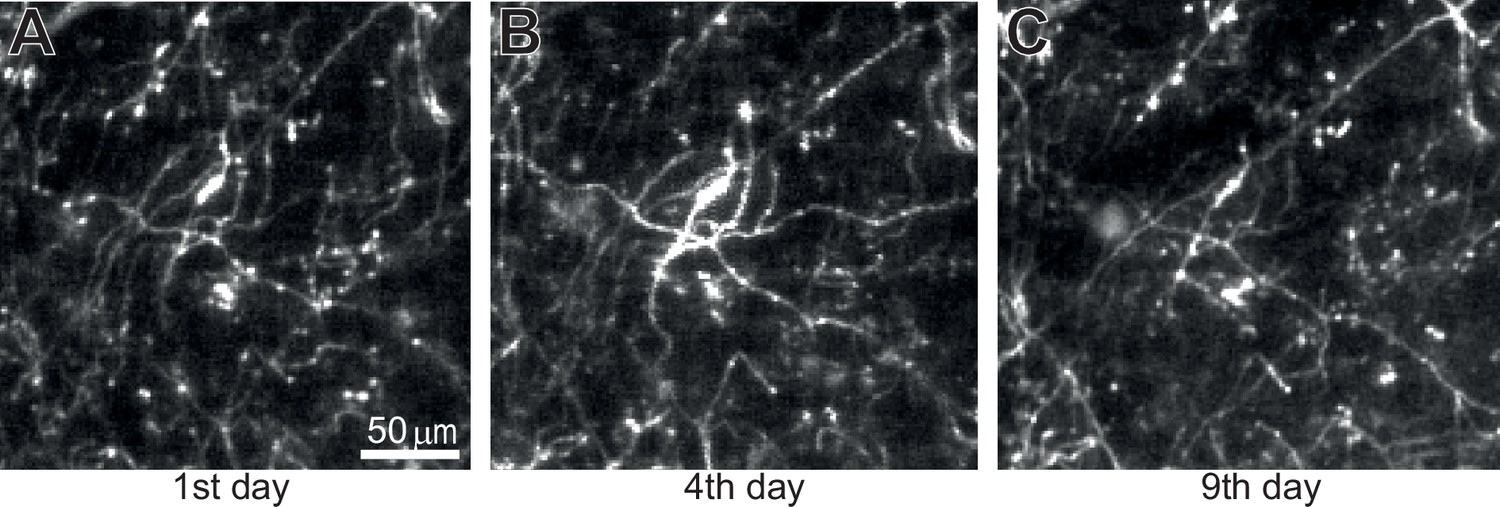
Long-term imaging of dopamine axons across days.
(A) The imaged acquired on the 1st day. (B) Similar to A, but on the 4th day. (C) Similar to A, but on the 9th day. The same imaging plane as Figure 1G.
Figure 2 with 4 supplements
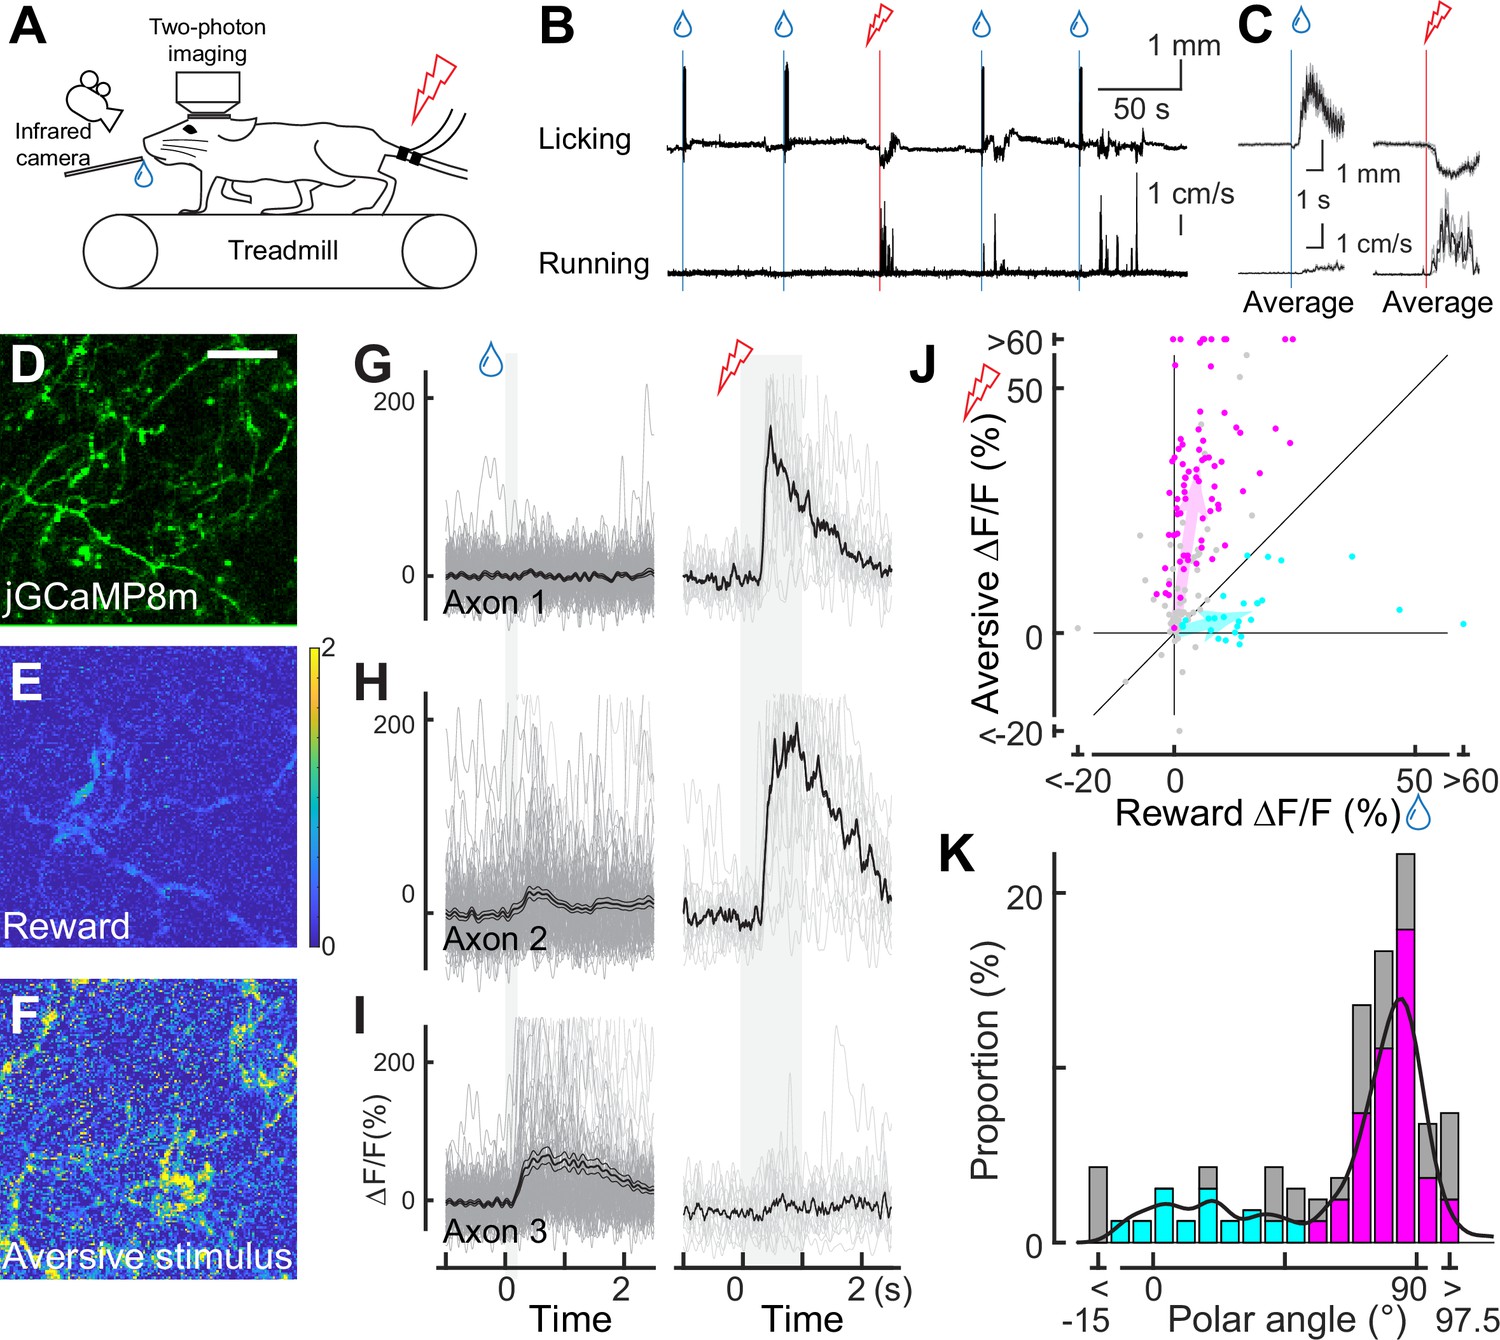
Dopaminergic axonal response to unexpected rewarding or aversive stimuli.
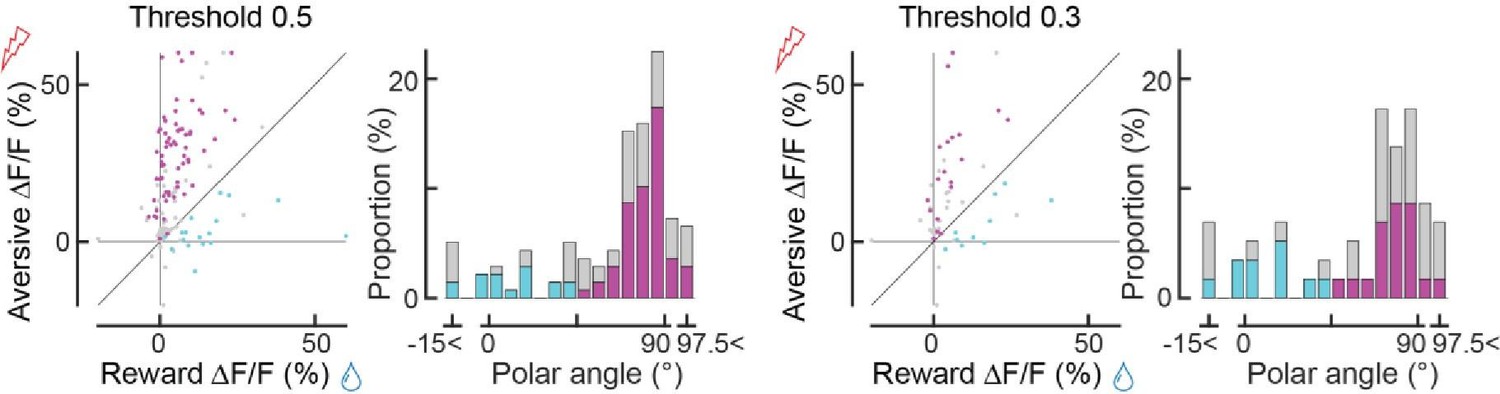
(A) Experimental design. Mice were placed under a two-photon microscope on a linear treadmill and were given unexpected rewarding (water drops) or aversive (electrical shock to the tail) stimuli. The mouse’s face was filmed with an infrared camera to track the tongue position. (B) Example behavioral response to rewarding (top, tongue position) or aversive (bottom, treadmill speed) stimuli. (C) Average behavioral response on a single day for the same animal shown in B. (D) Representative image for dopamine axons labeled with jGCaMP8m. Scale bar: 50 μm. (E, F) Heatmaps of rewarding (E) or aversive (F) stimuli for the same imaging plane shown in D. (G–I) Calcium response for rewarding (left) and aversive (right) stimuli of three example axons. (J) Comparison between reward (x-axis) and aversive (y-axis) responses for dopamine axons (n=162). Statistically significant axons were labeled in either cyan (reward-preferring axons, n=25) or magenta (aversive-preferring axons, n=75). Vector averages representing reward-preferring axons and aversive-preferring axons are depicted as cyan and magenta arrows. (K) Histogram of the polar angle of the scatter plot in J (n=162). The solid line indicates probability density, estimated by kernel smoothing. A value of 0° represents axons that solely prefer rewards, whereas 90° represents those that solely prefer aversive stimuli.
Figure 2—figure supplement 1
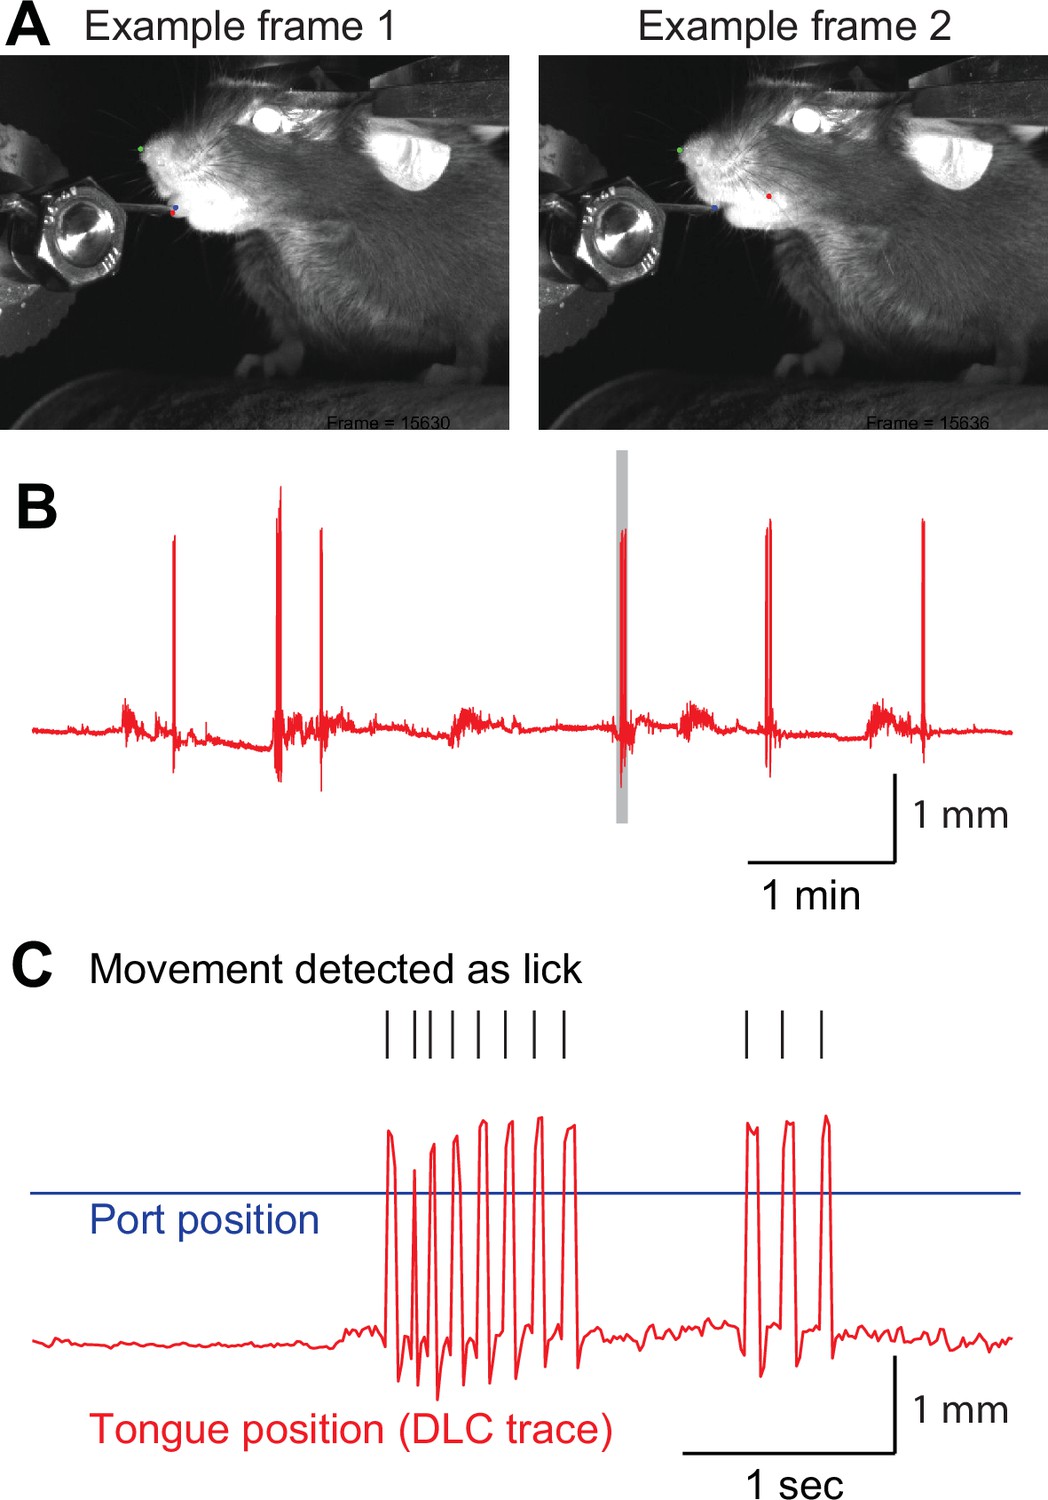
Lick detection using DeepLabCut.
(A) Sample frames used by DeepLabCut. The tongue tip was labeled as a red dot and the water port as a blue dot (left). When the tongue was not visible (right), we intentionally trained DeepLabCut to consider the tongue position as the inside of the oral cavity (red dot). (B) Example of a tongue position trace. Gray shaded period is expanded in C. (C) Tongue movement that crossed the water port position (blue line) was counted as a lick (black ticks).
Figure 2—figure supplement 2

Insignificant locomotion activity of dopaminergic axons.
No significant increase in locomotion initiation (for aversive-preferring axons, p = 0.583, n = 75; for reward-preferring axons, p = 0.92, n = 25; for all axons, p = 0.23, n = 162, Wilcoxon signed rank text).
Figure 2—figure supplement 3

Comparison between reward (x-axis) and aversive (y-axis) responses for each mouse (n = 8 animals), similar to Figure 2J (for all animals).
Figure 2—figure supplement 4

Dopaminergic axonal activity depends on the reward volume and shock current.
(A) Axonal activity increased as the reward volume increased. Differences were significant between 0 and 5 μL (p < 0.001), between 2.5 μL and 5 μL (p < 0.001), and between 5 μL and 10 μL (p < 0.001, n = 39, 2 animals). However, the differences were not significant between 0 μL and 2.5 μL (p = 0.06) or between 10 μL and 15 μL (p = 0.97), indicating saturation at 10 μL. (B) Axonal activity increased as the electrical current increased. The difference was significant between 0 and 0.2 mA (p < 0.001, n = 61, 2 animals) and between 0.2 and 0.4 mA (p < 0.001). * indicates p < 0.05, ** p < 0.01, and *** p < 0.001.
Figure 3 with 4 supplements
Classical conditioning induced behavioral and neural changes.
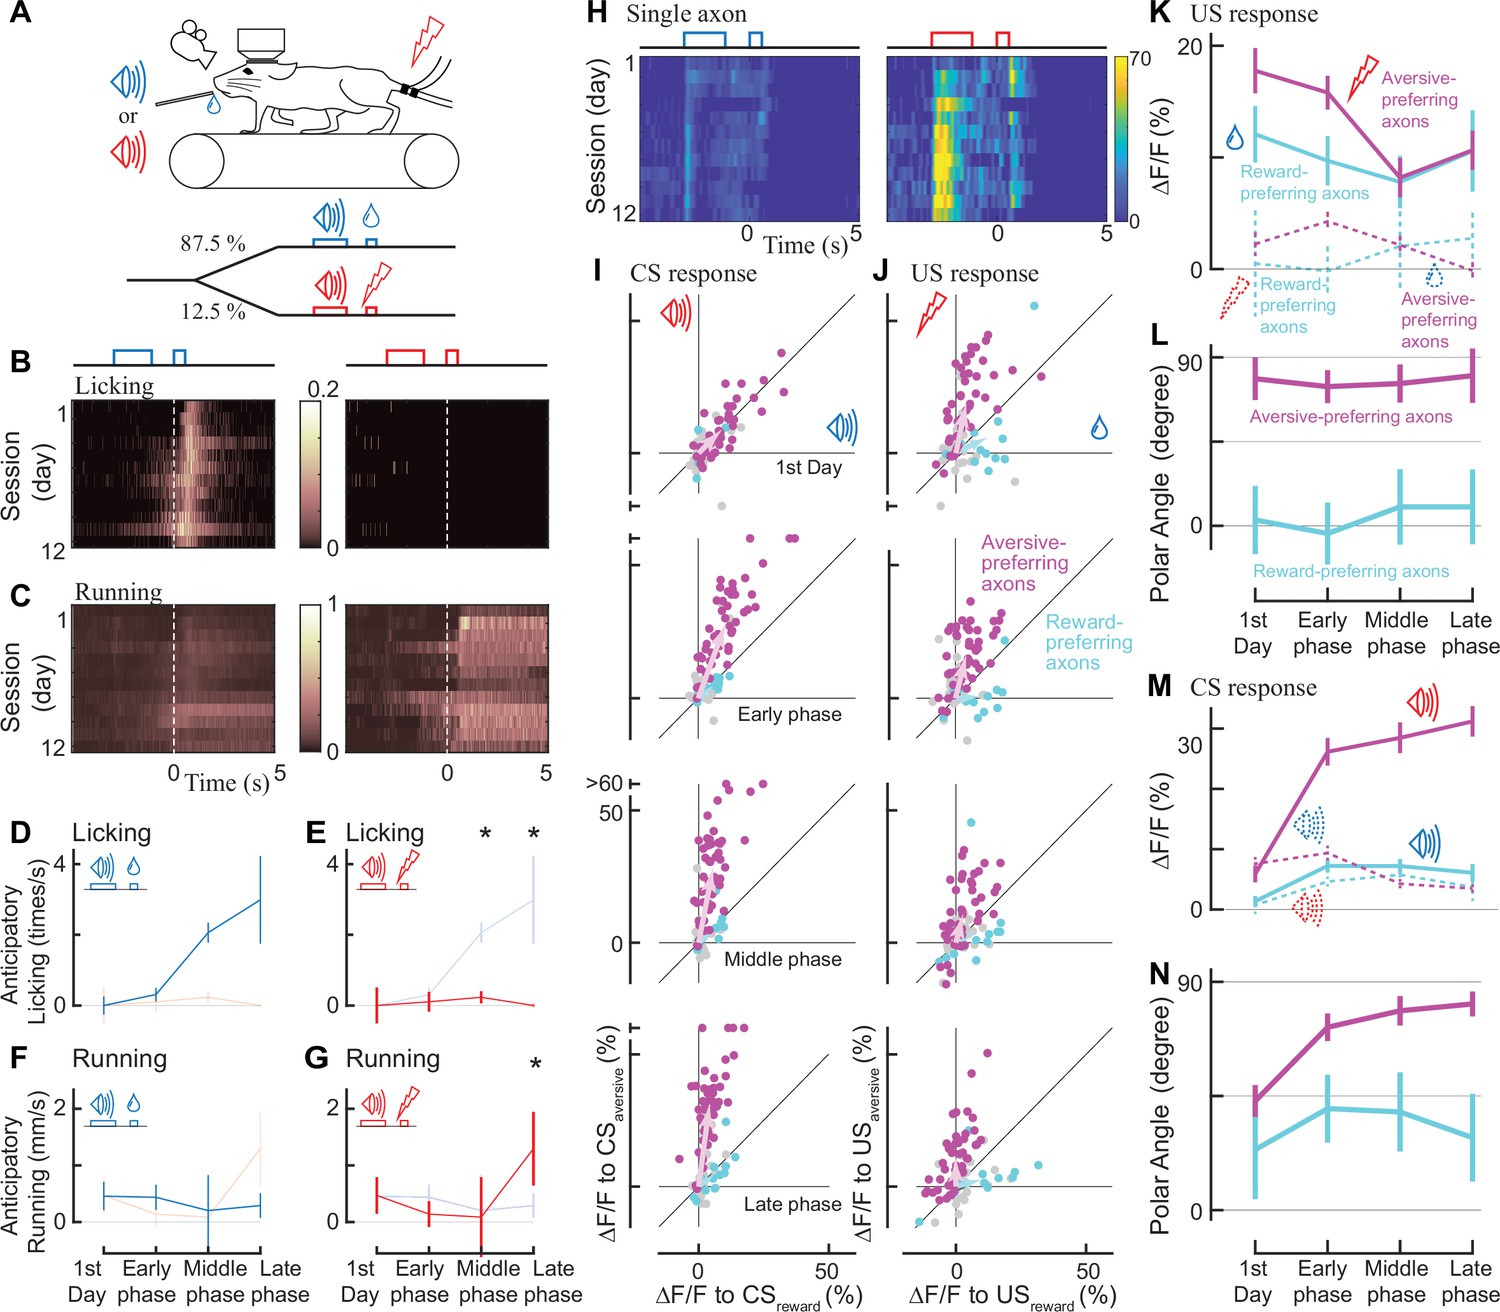
(A) Experimental design. Auditory cues were presented before unconditioned stimuli (rewarding or aversive stimuli). (B, C) Behavioral changes in one example animal across 12 days (B: licking, C: running). In the reward condition, the animal gradually developed anticipatory licking (B, left). In the aversive condition, the animal usually ran after the shock delivery, but sometimes even before the delivery (C, right). Licking and running traces were normalized to the instantaneous maximum values for this animal and then averaged over a single day. (D–G) Anticipatory behavior during classical learning (n=6 animals). In the late phase of learning, anticipatory licking was primarily observed in the reward condition (D) but not in the aversive condition (E). Anticipatory running was seen more often in the aversive condition (G) than in the reward condition (F). (H) Activity change in one example axon across 12 days. The axon was from the same animal shown in B, C. (I, J) Learning induced changes in response to conditioned cues (I) and unconditioned stimuli (J) for aversive-preferring axons (magenta) and reward-preferring axons (cyan) together with non-significant axons (black). Aversive- and reward-preferring axons were defined before the start of classical training. The x-axis represents the reward condition, and the y-axis represents the aversive condition. n=47 for aversive-preferring axons, n=12 for reward-preferring axons. Vector averages representing aversive-preferring axons and reward-preferring axons are depicted as magenta and cyan arrows, overlaid in each panel. (K) Learning induced a change in the amplitude of unconditioned response of aversive-preferring axons for the aversive condition (magenta solid line) and reward condition (magenta dotted line) and that of reward-preferring axons for reward condition (cyan solid line) and aversive condition (cyan dotted line). Number of axons is the same as I, J. (L) The polar angle of the scatter plot in J. The magenta line represents aversive-preferring axons and the cyan line represents reward-preferring axons. (M) Similar to K, but for the conditioned response. (N) Similar to L, but for the conditioned response.
Figure 3—figure supplement 1

Anticipatory licking and running during the classical conditioning (n = 6).
(A) The conditioning period is divided into six phases plus the first day, instead of three phases (Fig. 3 D-G). Licking rate was saturated at 5th and 6th phases. (B) Similar to A, but for anticipatory running.
Figure 3—figure supplement 2

Population activity of aversive- and reward-preferring axons throughout learning (aversive-preferring axons, n = 47; reward-preferring axons, n =12).
(A-D) Averaged calcium traces of aversive-preferring axons for the first day (A), early phase (B), middle phase (C), and late phase (D) of classical conditioning for the reward condition (left column) and aversive condition (right column). (E-H) Similar to A-D, but for reward-preferring axons.
Figure 3—figure supplement 3

Activity is not suppressed during reward omission.
(A) Population calcium trace for reward-preferring axons aligned to reward omission (n = 12 reward-preferring axons). (B) No significant change occurs during reward omission (for reward preferring axons, p = 0.62, n = 12; Wilcoxon signed-rank test). Control and omission 2 s-periods are indicated in A.
Figure 3—figure supplement 4
Response in the first trials in each session.
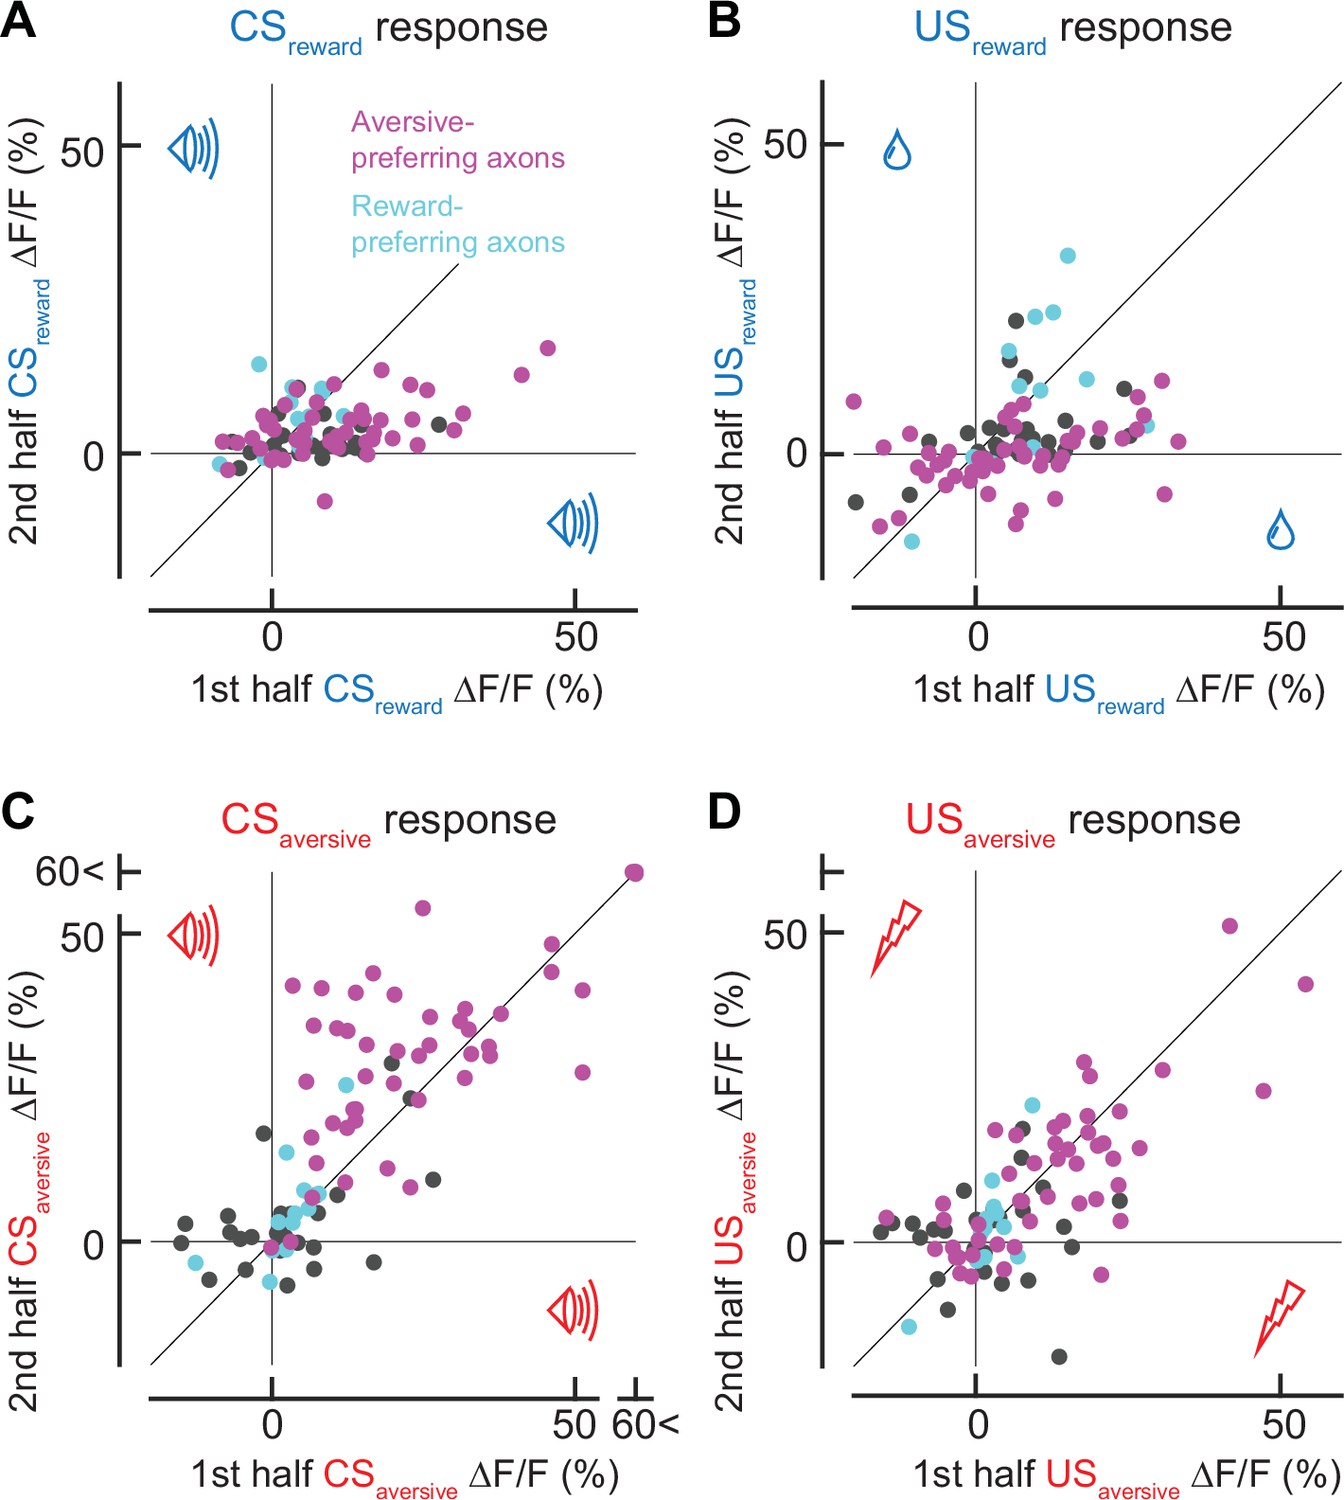
(A) Comparison between CSreward responses in the first trial and the remaining trials. (B) Similar to A, but for USreward. (C) Similar to A, but for CSaversive. (D) Similar to A, but for USaversive. Note that for aversive-preferring axons, the response in the first trial was stronger for CSreward responses (A, p = 0.0002, n = 47, Wilcoxon signed-rank test) and weaker for CSaversive responses (C, p = 0.002, n = 47). The response in the first trial was stronger for USreward response (B, p = 0.002, n = 47), and was not significantly different for USaversive (D, p = 0.36, n = 47 aversive-preferring axons). For reward-preferring axons, there was no significant difference between the first trial and the rest (CSreward, p = 0.23; CSaversive, p = 0.38; USreward, p = 0.85; USaversive, p = 1.00).
Figure 4 with 2 supplements
Axonal cue response in trials with correct or incorrect cue discrimination.
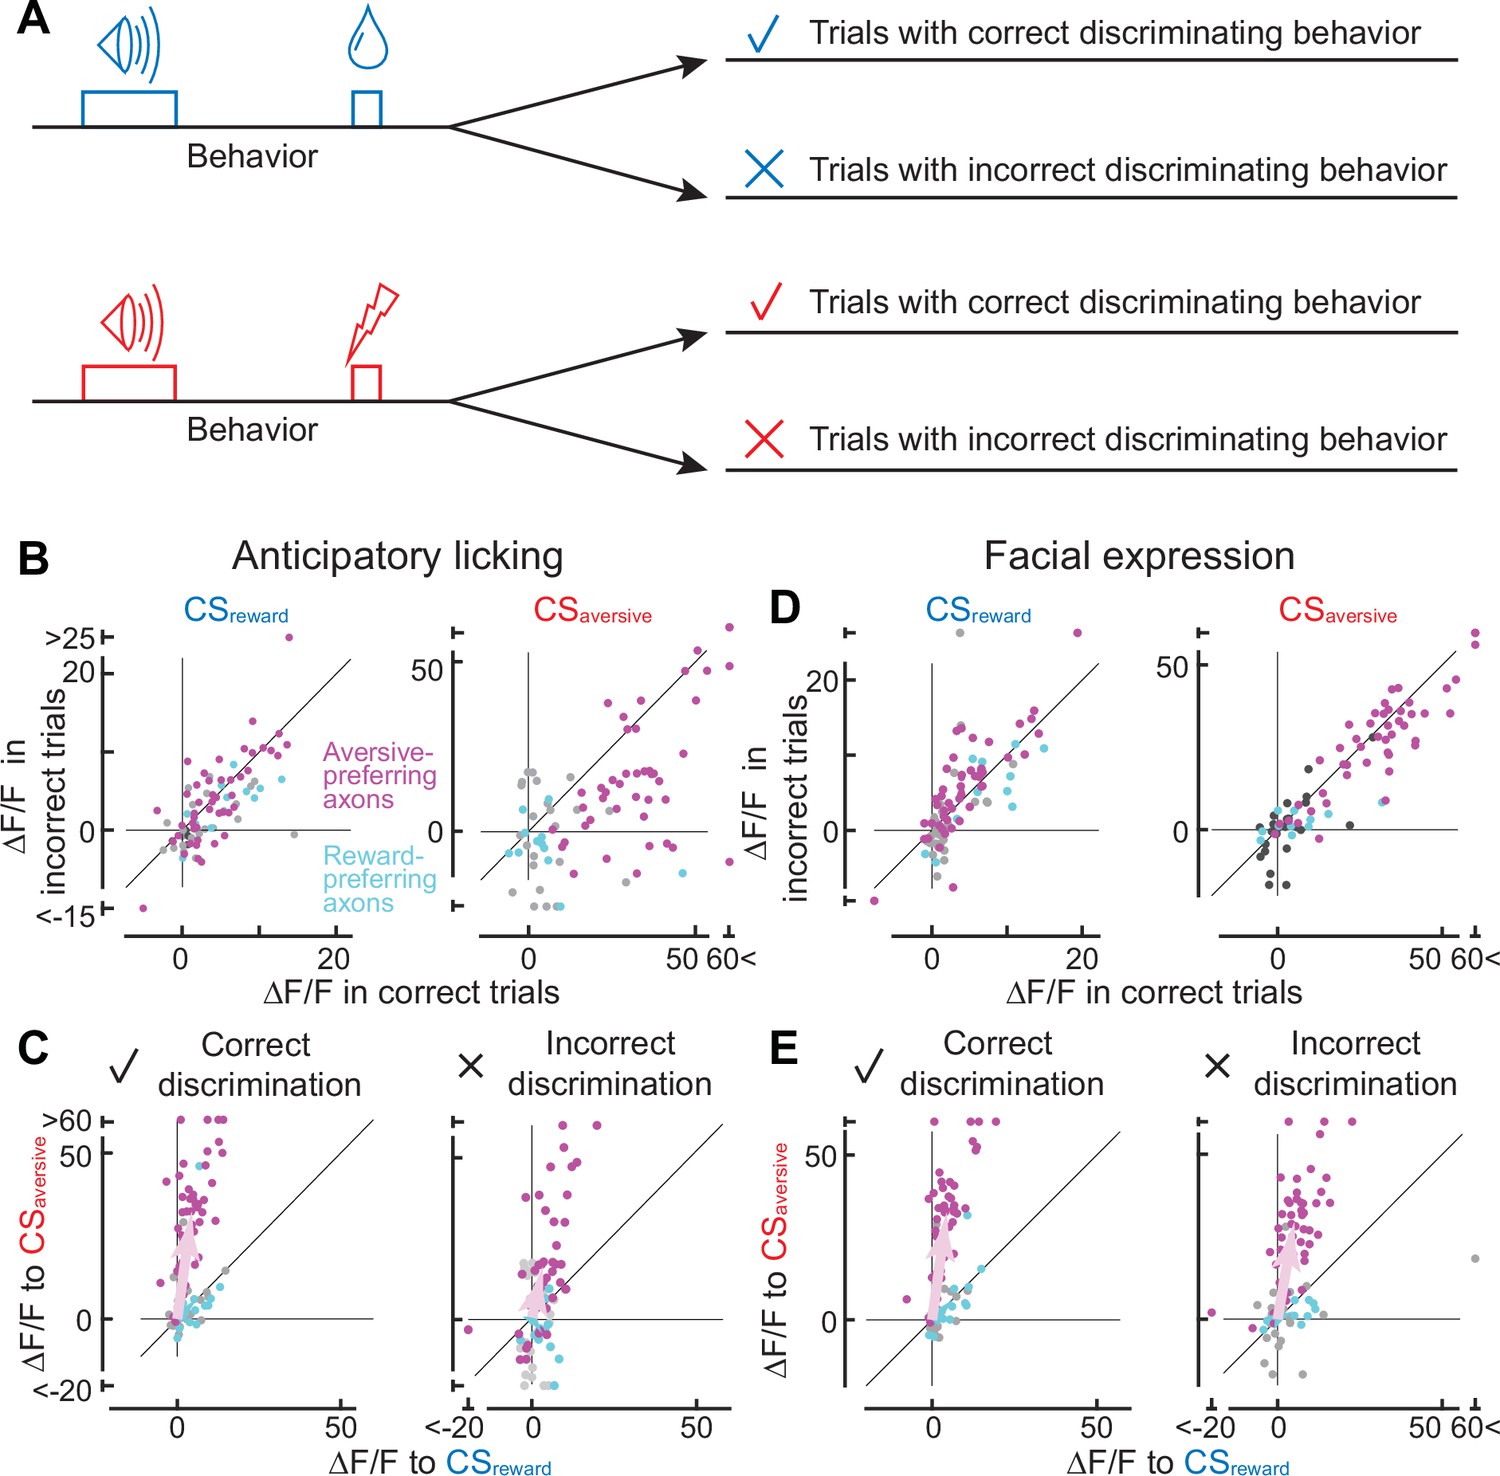
(A) Classification of trials based on the behavioral response that occurred between the conditioned stimulus onset and unconditioned stimulus onset. Such behaviors include anticipatory licking or facial expressions. (B) Comparison of cue response between correct (x-axis) and incorrect (y-axis) trials based on anticipatory licking (magenta, aversive-preferring axons, n=44; cyan, reward-preferring axons, n=12). The left panel shows the reward cue response, and the right panel shows the aversive cue response. (C) Preference for reward or aversive predictive cues in correct (left panel) and incorrect (right) discrimination. Magenta represents aversive-preferring axons (n=44) and cyan represents reward-preferring axons (n=12). Vector averages representing aversive-preferring axons and reward-preferring axons are depicted as magenta and cyan arrows. Note stronger preference for aversive cue as a population in correct discrimination. (D) Similar to B, but based on facial expressions (magenta, aversive-preferring axons, n=47; cyan, reward-preferring axons, n=12) (E) Similar to C, but based on facial expressions (magenta, aversive-preferring axons, n=47; cyan, reward-preferring axons, n=12). As in C, preference for the aversive cue is stronger in correct discrimination.
Figure 4—figure supplement 1

Machine learning discriminates auditory cues based on anticipatory licking.
On the first day, cue discrimination was nearly 50%, indicating that discrimination is random. However, as the training proceeded, discrimination was improved, reaching 79.2 ± 6.3% at the late phase (n = 6 animals).
Figure 4—figure supplement 2
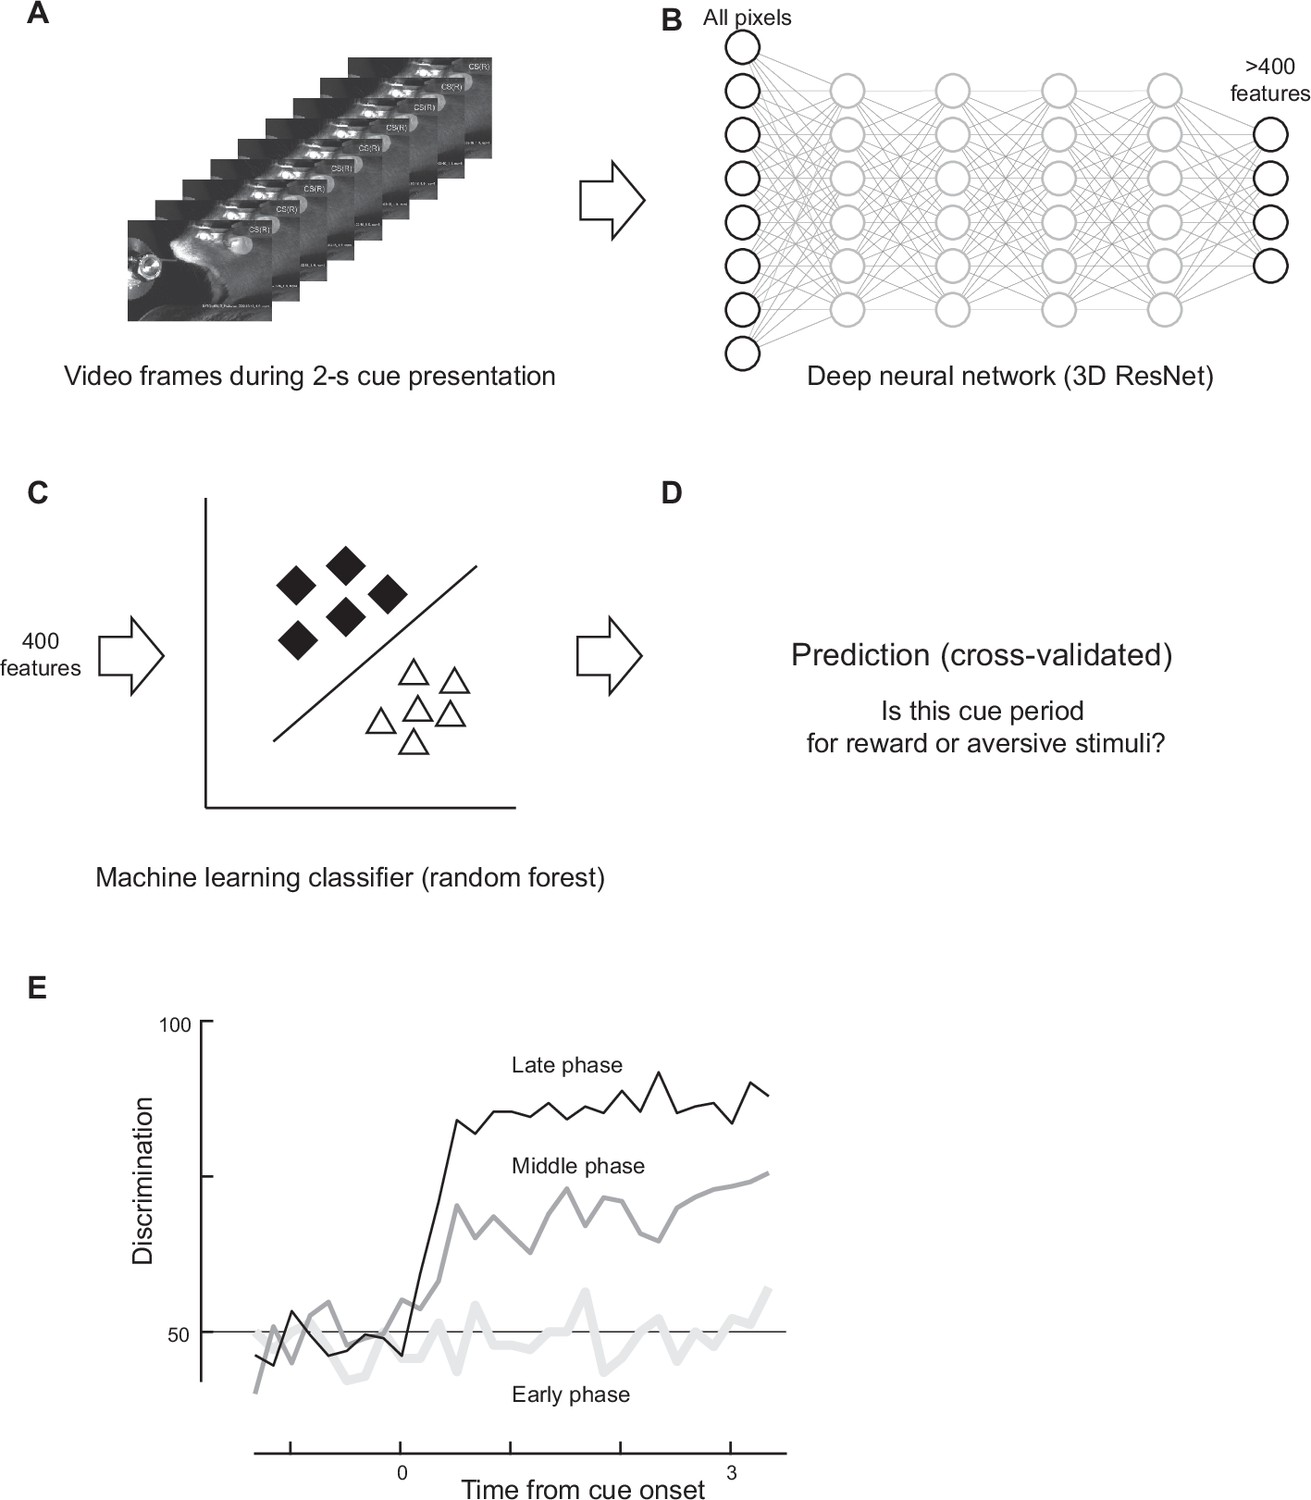
Discrimination based on facial expressions.
(A) A frame sequence during the cue presentation was analyzed. (B) All pixel values were inputted to a pretrained deep neural network, resulting in more than 400 features. (C) The top 400 features were fed into a machine learning classifier (random forest). (D) The recall rate of the classifier was computed as the discrimination rate. (E) The time course of discrimination was computed (one example animal). High discrimination was achieved only in the late phase of classical conditioning, even though the early phase was analyzed based on its own classifier trained with frames from the early phase.
Author response image 1
Tables
Key resources table
| Reagent type (species) or resource | Designation | Source or reference | Identifiers | Additional information |
|---|---|---|---|---|
| Antibody | Anti-GFP (Rabbit Polyclonal) | Thermo Fisher Scientific | Cat# A-11122, RRID:AB_221569 | IF (1:1000) |
| Antibody | Anti-Tyrosine Hydroxylase (Sheep Polyclonal) | Abcam | Cat# ab113, RRID:AB_297905 | IF (1:200) |
| Antibody | Anti-Rabbit IgG (H+L) Antibody, Alexa Fluor 488 Conjugated (Donkey Polyclonal) | Thermo Fisher Scientific | Cat# A-21206, RRID:AB_2535792 | IF (1:500) |
| Antibody | Anti-Sheep IgG (H+L) Antibody, Alexa Fluor 568 Conjugated (Donkey Polyclonal) | Thermo Fisher Scientific | Cat# A-21099, RRID:AB_2535753 | IF (1:500) |
| Recombinant DNA reagent | hSynapsin1-FLEx-axon-jGCaMP8m (plasmid) | This paper | Addgene #216533 | Described at ‘Headplate implant and virus injection’ of ‘Surgery’ section |
| Strain, strain background (AAV) | AAV2/1-hSynapsin1-FLEx-axon-jGCaMP8m-WPRE-SV40 | University of South Carolina Viral Vectors Core | ||
| Genetic reagent (mouse) | Mouse: Slc6a3tm1.1(cre)Bkmn | The Jackson Laboratory | JAX: 006660 | |
| Chemical compound | Normal Donkey Serum | Sigma-Aldrich | Cat# D9663, RRID:AB_2810235 | |
| Software, algorithm | MATLAB | Mathworks | RRID: SCR_001622 https://www.mathworks.com | |
| Software, algorithm | Python | Mathworks | RRID:SCR_008394 https://www.anaconda.com/ | |
| Software, algorithm | Suite2p | Patriarchi et al., 2018; MouseLand, 2024 | https://github.com/MouseLand/suite2p | |
| Software, algorithm | DeepLabCut | Mathis et al., 2018 | https://github.com/DeepLabCut/DeepLabCut; Mathis et al., 2024 | |
| Software, algorithm | B-spline Grid, Image and Point based Registration | Dirk-Jan Kroon | https://jp.mathworks.com/matlabcentral/fileexchange/20057-b-spline-grid-image-and-point-based-registration | |
| Software, algorithm | Pytorch, TorchVision | Meta AI | https://pytorch.org/ | |
| Other | Mouse Brain Connectivity Atlas | Allen Brain Map | https://connectivity.brain-map.org/ | Further details are provided in the caption of Figure 1—figure supplement 1. |
Additional files
Download links
A two-part list of links to download the article, or parts of the article, in various formats.
Downloads (link to download the article as PDF)
Open citations (links to open the citations from this article in various online reference manager services)
Cite this article (links to download the citations from this article in formats compatible with various reference manager tools)
Functional diversity of dopamine axons in prefrontal cortex during classical conditioning
eLife 12:RP91136.
https://doi.org/10.7554/eLife.91136.3


