Retinal metabolism displays evidence for uncoupling of glycolysis and oxidative phosphorylation via Cori-, Cahill-, and mini-Krebs-cycle
- Institute for Ophthalmic Research, University of Tübingen, Germany
- Werner Siemens Imaging Center, Department of Preclinical Imaging and Radiopharmacy, University of Tübingen, Germany
- Core Facility Metabolomics, Faculty of Medicine, University of Tübingen, Germany
- Centro Interdisciplinario de Neurociencia de Valparaíso, Universidad de Valparaíso, Chile
- Biochemistry Department, University of Kassel, Germany
Figures
Figure 1 with 2 supplements
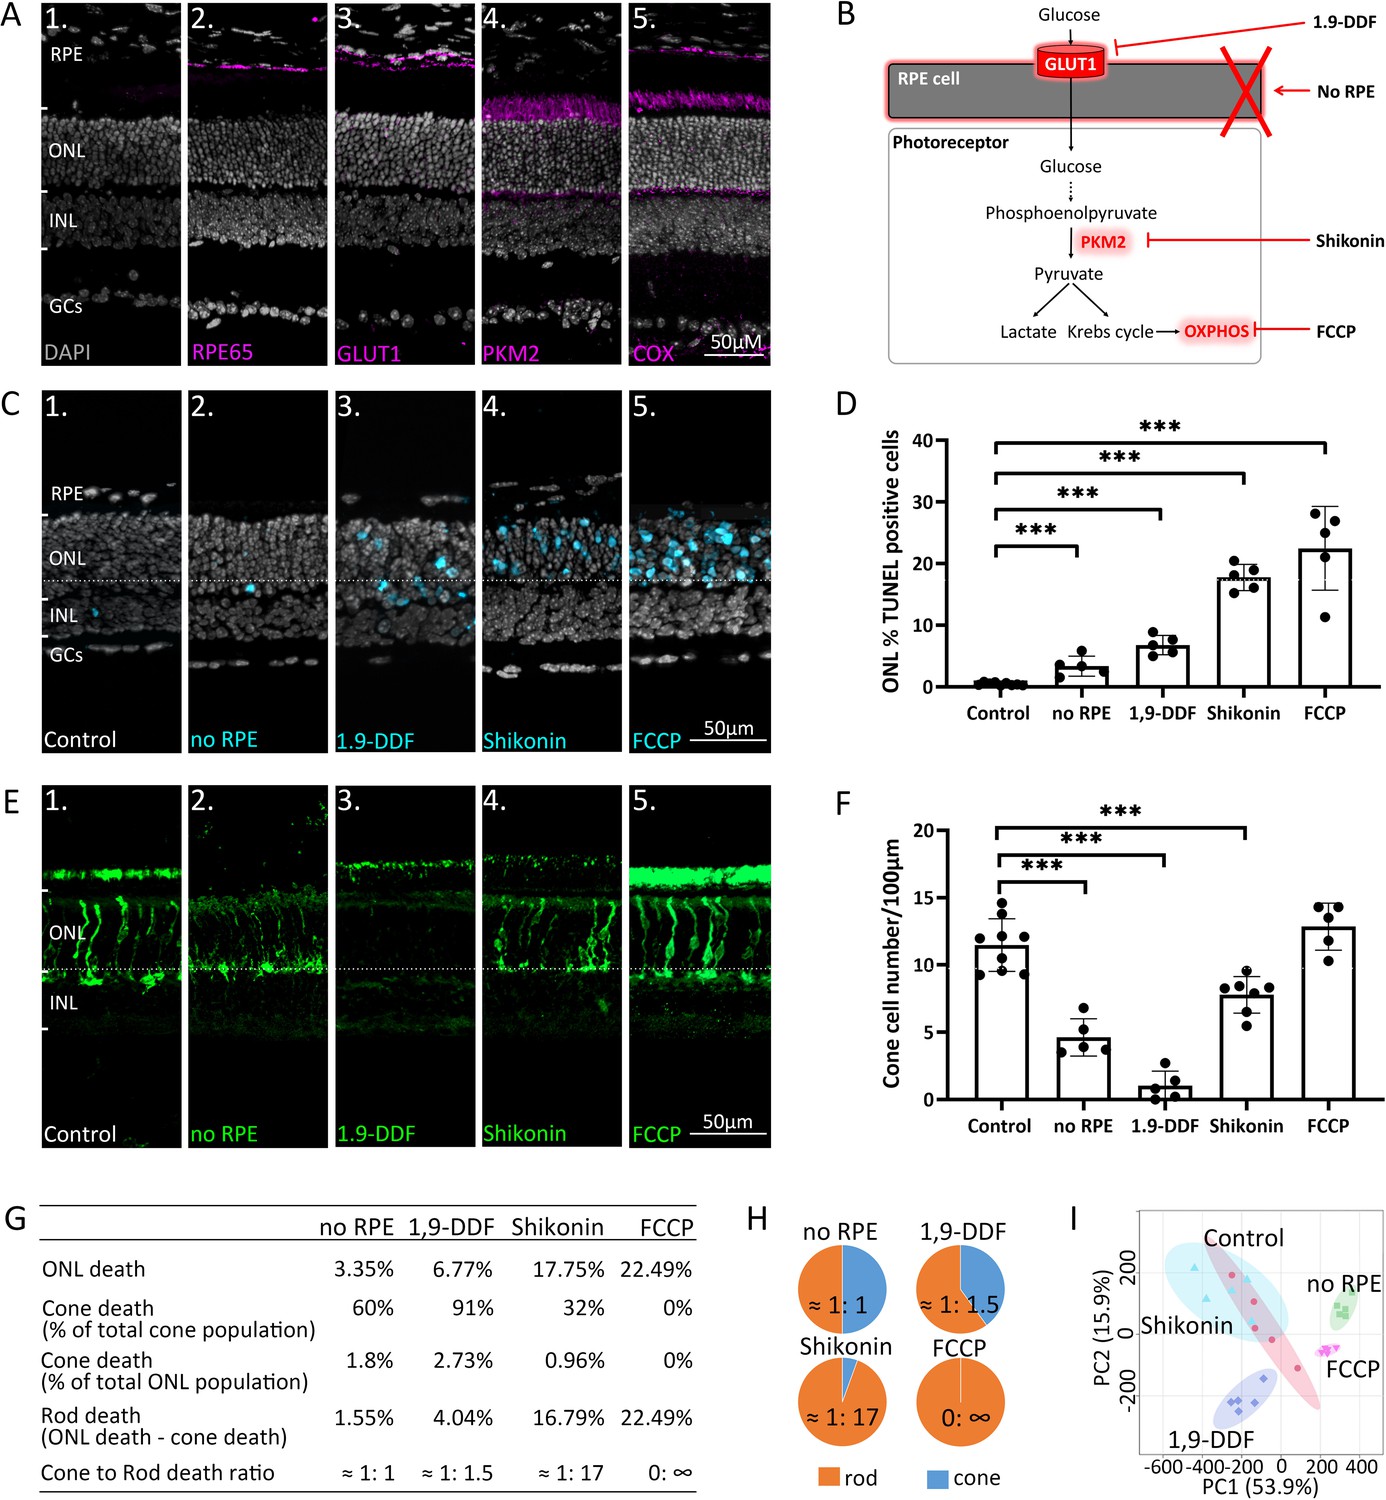
Manipulating energy metabolism differentially affects rod and cone photoreceptors.
(A) Immunofluorescence staining of in vivo retina (magenta): (A1) negative control, (A2) RPE65, (A3) glucose transporter-1 (GLUT1), (A4) pyruvate kinase M2 (PKM2), (A5) mitochondrial cytochrome oxidase (COX). (B) Overview of experimental manipulations. Organotypic retinal explants were cultured for 6 days in vitro with or without RPE or treated with 1,9-dideoxyforskolin (1,9-DDF), Shikonin, or carbonyl cyanide-p-trifluoromethoxyphenylhydrazone (FCCP). (C) Terminal dUTP-nick-end labelling (TUNEL) assay performed on in vitro retina (cyan) marking dying cells in the five experimental conditions. (D) Quantification of TUNEL-positive cells in outer nuclear layer (ONL). Data represented as mean ± SD. (E) Cone-arrestin labelling (green) in the ONL. (F) Quantification of arrestin-positive cones. Data represented as mean ± SD. (G) Table giving percentages of cones and rods lost for each treatment. (H) Pie charts illustrate cone to rod cell death ratios. (I) Principal component analysis (PCA) of retinal samples investigated with 1H-NMR spectroscopy-based metabolomics. Dots in graphs represent individual retinal explants from different animals (n=5). Statistical testing: one-way ANOVA with Tukey’s post hoc test. Asterisks indicate significance levels; p-values: ***<0.001, **<0.01, *<0.05. RPE = retinal pigment epithelium; INL = inner nuclear layer; GCs = ganglion cells.
Figure 1—figure supplement 1
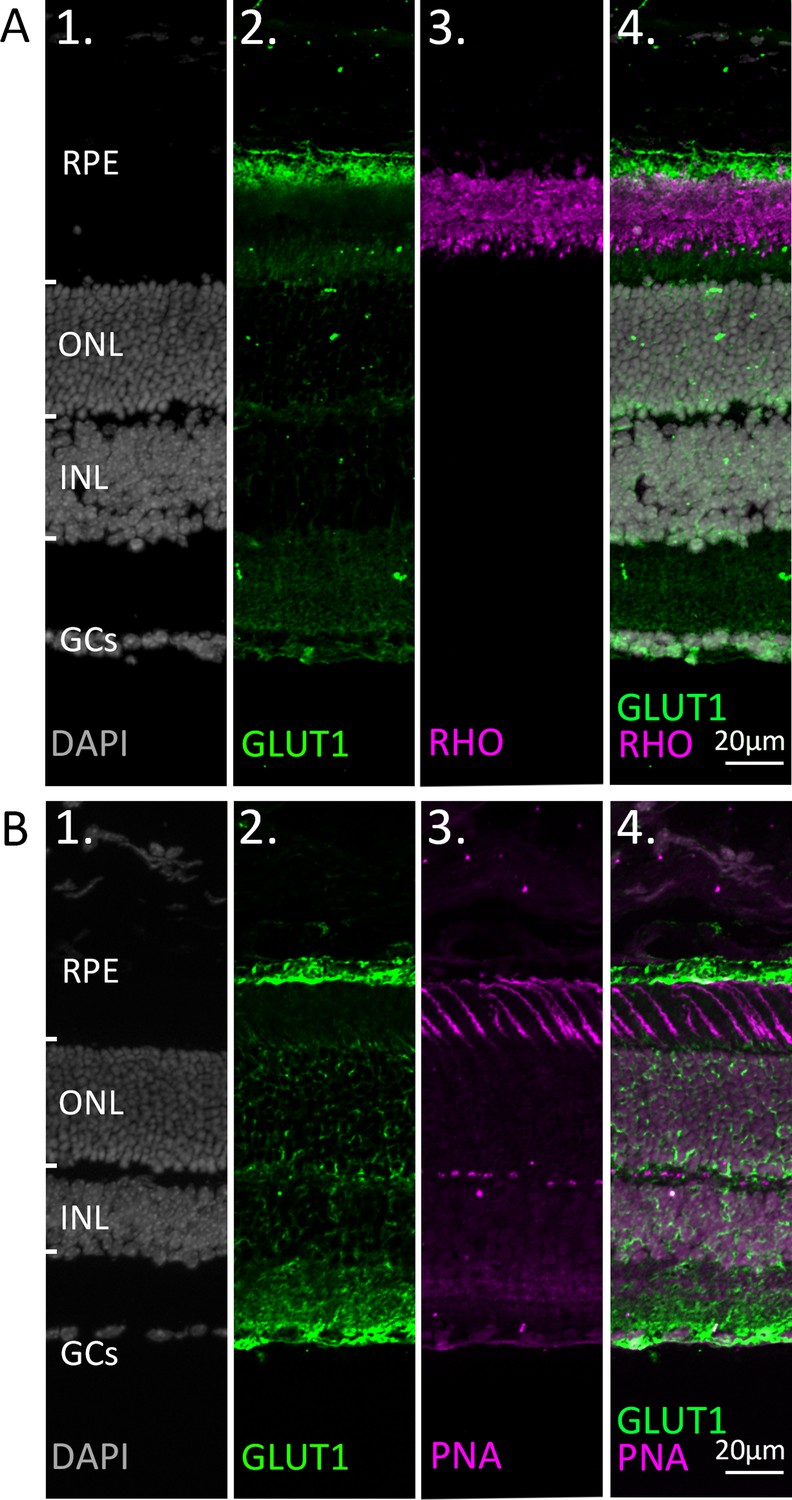
Co-staining of glucose transporter-1 (GLUT1) with markers for rod and cone photoreceptors.
Immunostaining for GLUT1 (green). DAPI (grey) was used as nuclear counterstain. (A) Co-staining with the rod outer segment marker rhodopsin (RHO; magenta). (B) Co-staining with the cone marker peanut agglutinin (PNA; magenta). Note that while the retinal pigment epithelium (RPE) expresses high levels of GLUT1, both rod and cone photoreceptors appear to be devoid of GLUT1 expression. At high gamma values (B2) a staining suggestive of Müller cells is noticed. ONL = outer nuclear layer; INL = inner nuclear layer; GCs = ganglion cells.
Figure 1—figure supplement 2
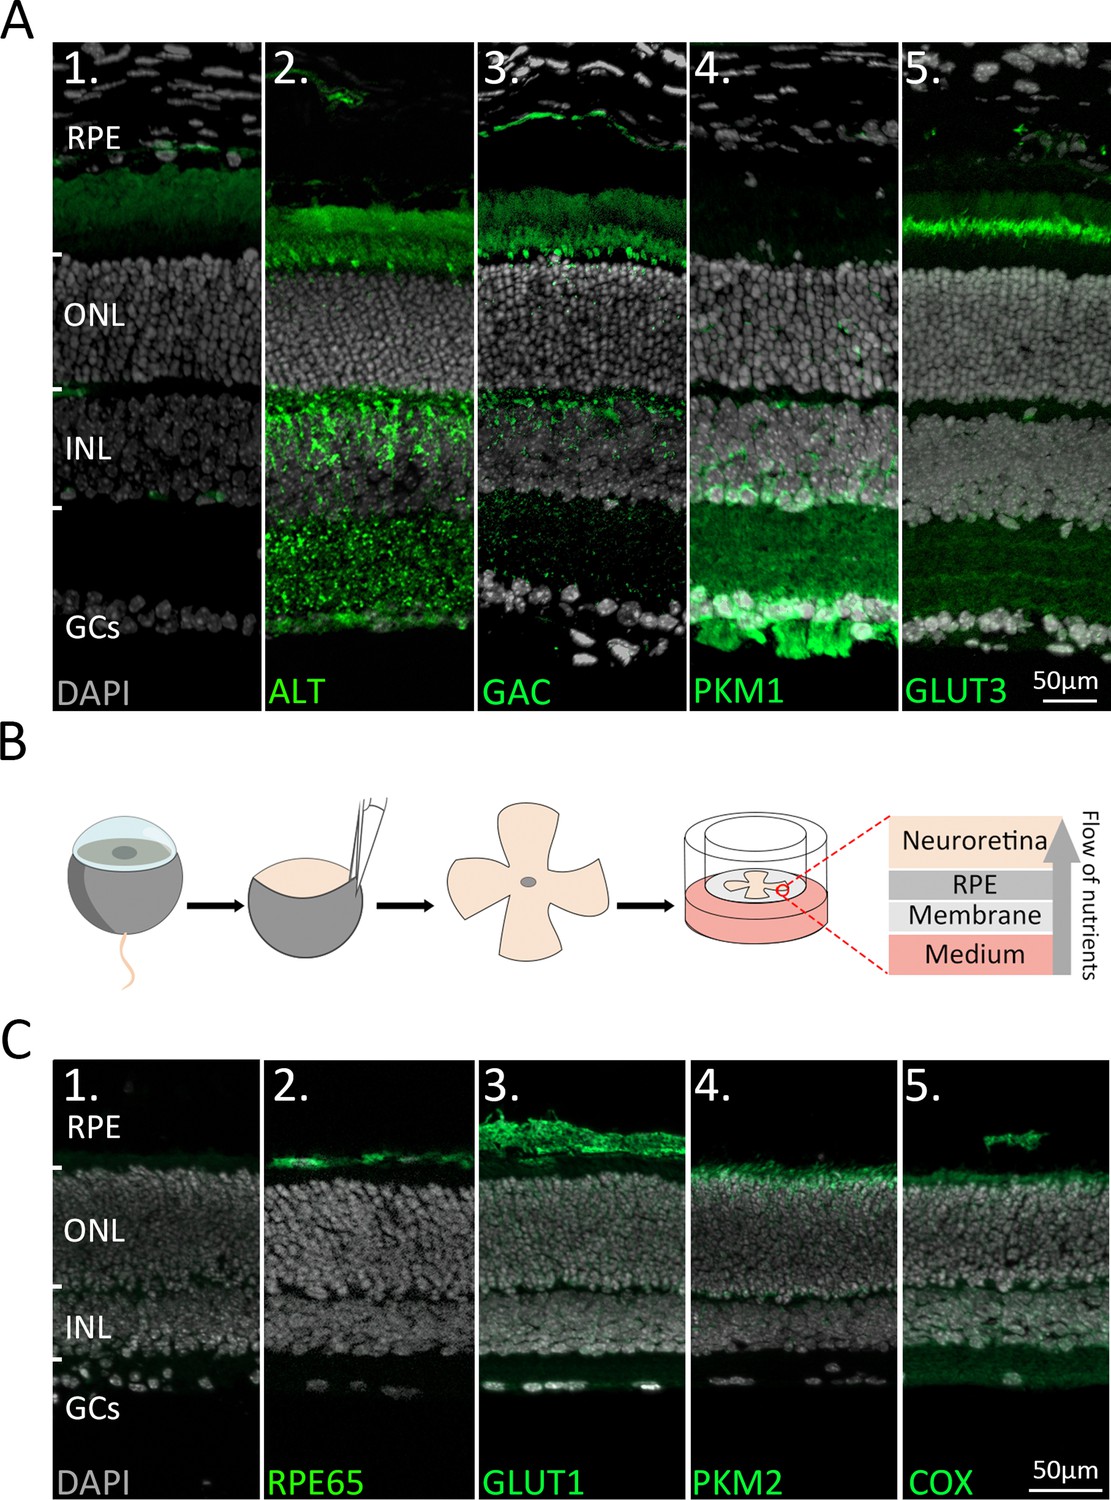
Immunofluorescence staining of retinal enzymes and transporters in vivo and in vitro.
(A) Protein expression (green) in the in vivo retina. DAPI (grey) was used as a nuclear counterstain. (1) Negative control. (2) Alanine transaminase (ALT) showed strong labelling on photoreceptor inner segments (IS) and inner nuclear layer (INL). (3) Glutaminase C (GAC) was expressed in IS and INL. (4) Pyruvate kinase M1 (PKM1) selectively labelled INL cells, synapses in the inner plexiform layer (IPL), and the ganglion cell layer (GCL). (5) Glucose transporter 3 (GLUT3) was strongly expressed on the basal side of IS and in discrete IPL sublamina. (B) Retinae were explanted at post-natal day (P) 9 and cultured until P15. During the culture period the retinal pigment epithelium (RPE) faced the culturing membrane so that nutrients from the underlying medium had to pass through the RPE. (C) Protein expression (green) in the in vitro retina. (1) Negative control. (2) RPE65. (3) Glucose transporter-1 (GLUT1). (4) Pyruvate kinase M2 (PKM2). (5) Mitochondrial cytochrome oxidase (COX). Note that the cultured retina is somewhat thinner than in a living animal, yet the in vitro enzyme expression patterns are comparable to the in vivo situation (Figure 1A). ONL = outer nuclear layer; GCs = ganglion cells.
Figure 2 with 2 supplements
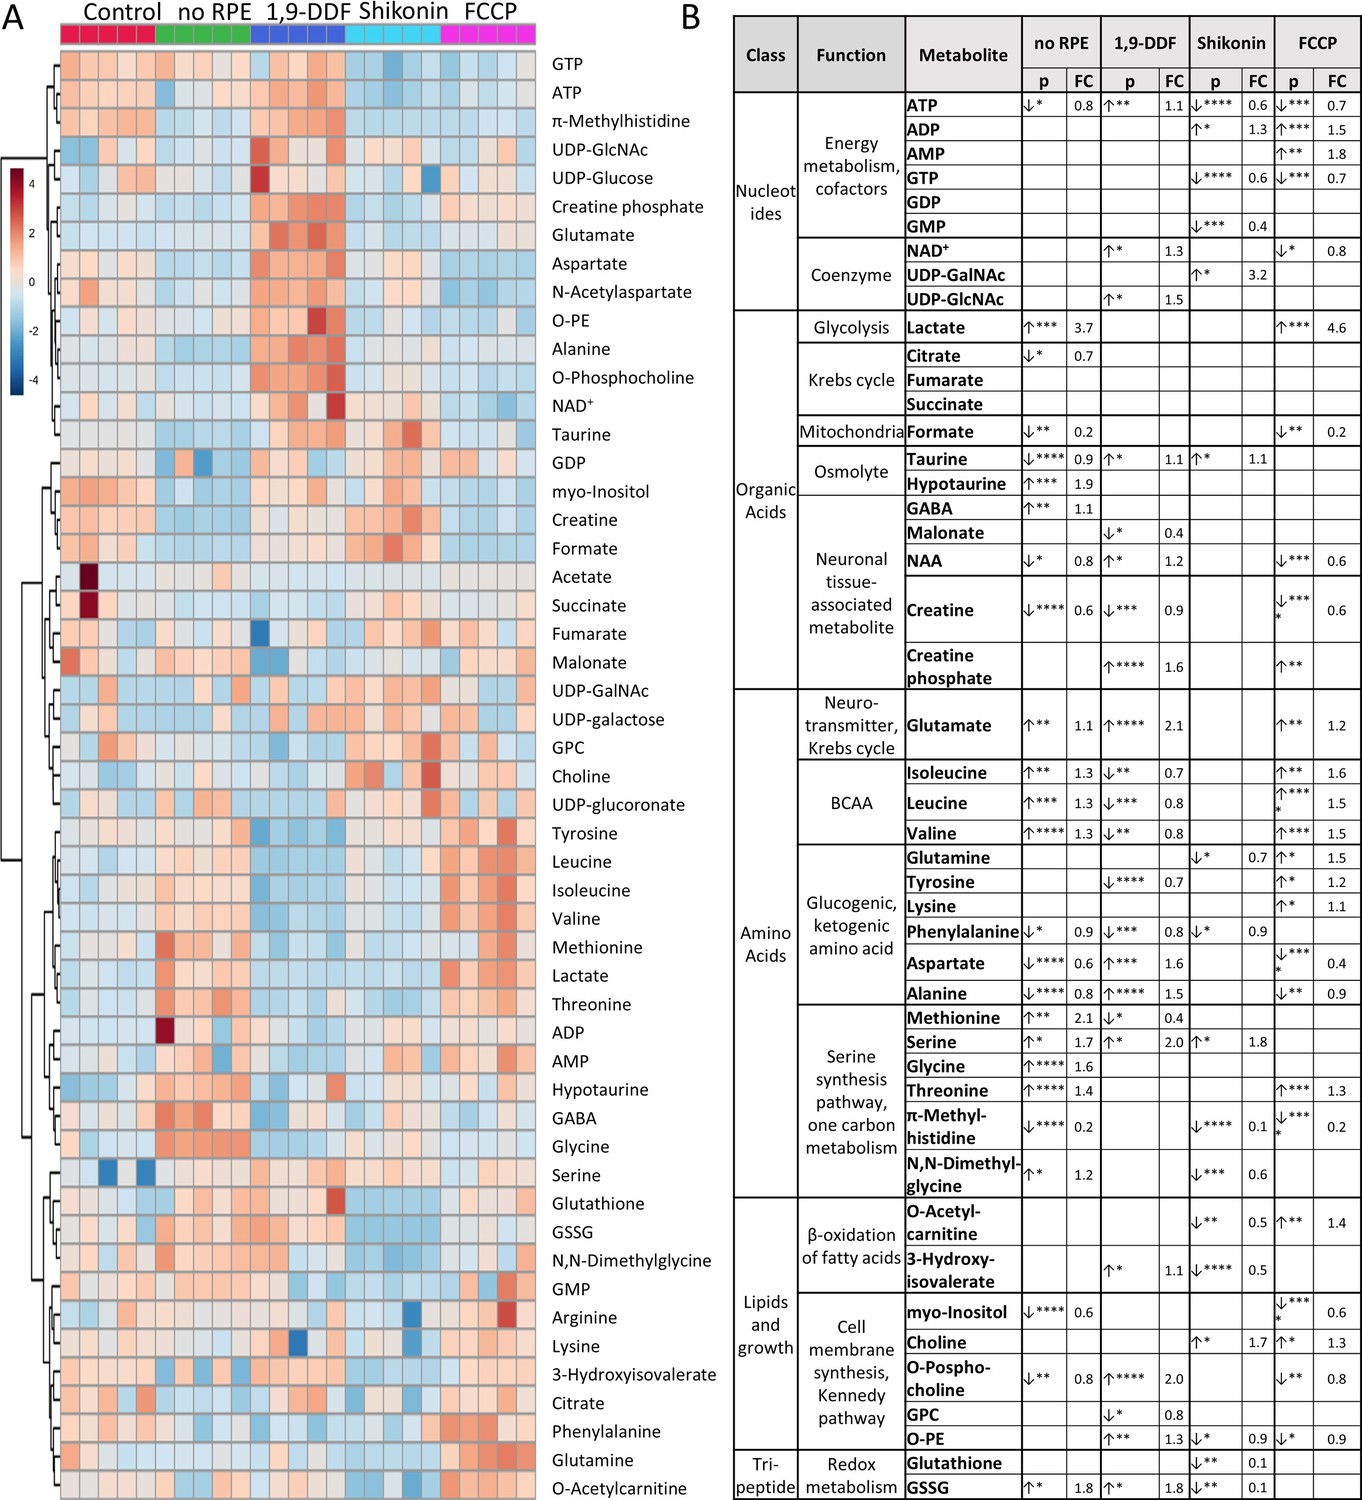
1H-NMR spectroscopy-based metabolomics analysis of retina subjected to interventions in energy metabolism.
(A) Heatmap based on unsupervised hierarchical cluster analysis by Ward’s linkage, showing auto-scaled metabolite concentrations (red – high, blue – low) in five different experimental conditions: control – red, no retinal pigment epithelium (RPE) – green, 1,9-dideoxyforskolin (1,9-DDF) – dark blue, Shikonin – light blue, carbonyl cyanide-p-trifluoromethoxyphenylhydrazone (FCCP) purple (n=5 samples per condition). Squares in the heatmap represent data from individual retinal explants from different animals (n=5). (B) Metabolic profiles of each intervention were compared to control. Metabolites significantly changed in at least one experimental condition were grouped according to functions and pathways. Data show p-values and fold change (FC) over control. Statistical comparison: Student’s unpaired t-test (group variance equal); p-values: ****<0.0001, ***<0.001, **<0.01, *<0.05.
-
Figure 2—source data 1
Full list of all quantified metabolites in retina samples.
A total of 50 metabolites were quantified in control, no retinal pigment epithelium (RPE), 1,9-dideoxyforskolin (1,9-DDF), Shikonin, and carbonyl cyanide-p-trifluoromethoxyphenylhydrazone (FCCP) groups. Each metabolite’s mean concentration value (µM concentration range) and standard deviation (stdev) is displayed in the table (n=5).
- https://cdn.elifesciences.org/articles/91141/elife-91141-fig2-data1-v1.csv
Figure 2—figure supplement 1
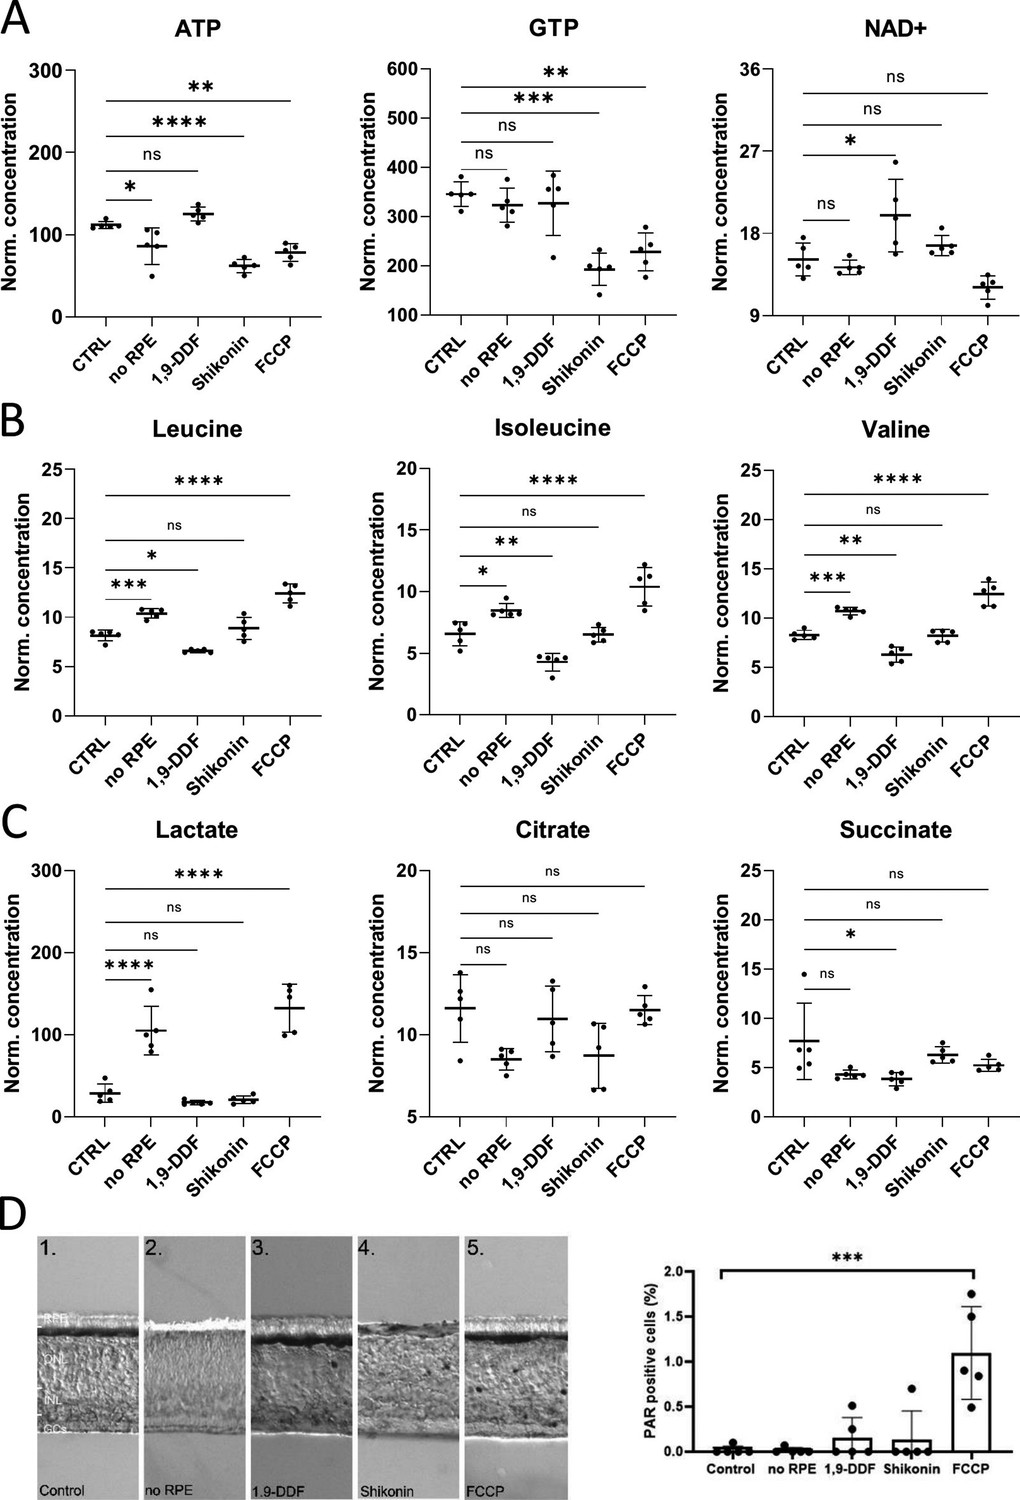
Retina characterisation by metabolomics and immunostaining.
(A) Energy metabolism-related metabolites: Overview of box plots. (B) Box plots for branched chain amino acids (BCAAs). (C) Krebs-cycle and glycolysis-associated metabolite box plots. Data represented as individual data points in µM concentration range with mean ± SD. (D) Immunodetection of poly-ADP-ribose (PAR) in the five experimental conditions. The bar graph shows the percentage of PAR-positive cells in the outer nuclear layer (ONL). Dots in graphs represent individual retinal explants from different animals (n=5). Statistical testing: one-way ANOVA with Tukey’s post hoc test. For simplicity only p-values for comparison to control are shown: ****<0.0001, ***<0.001, **<0.01, *<0.05.
Figure 2—figure supplement 2
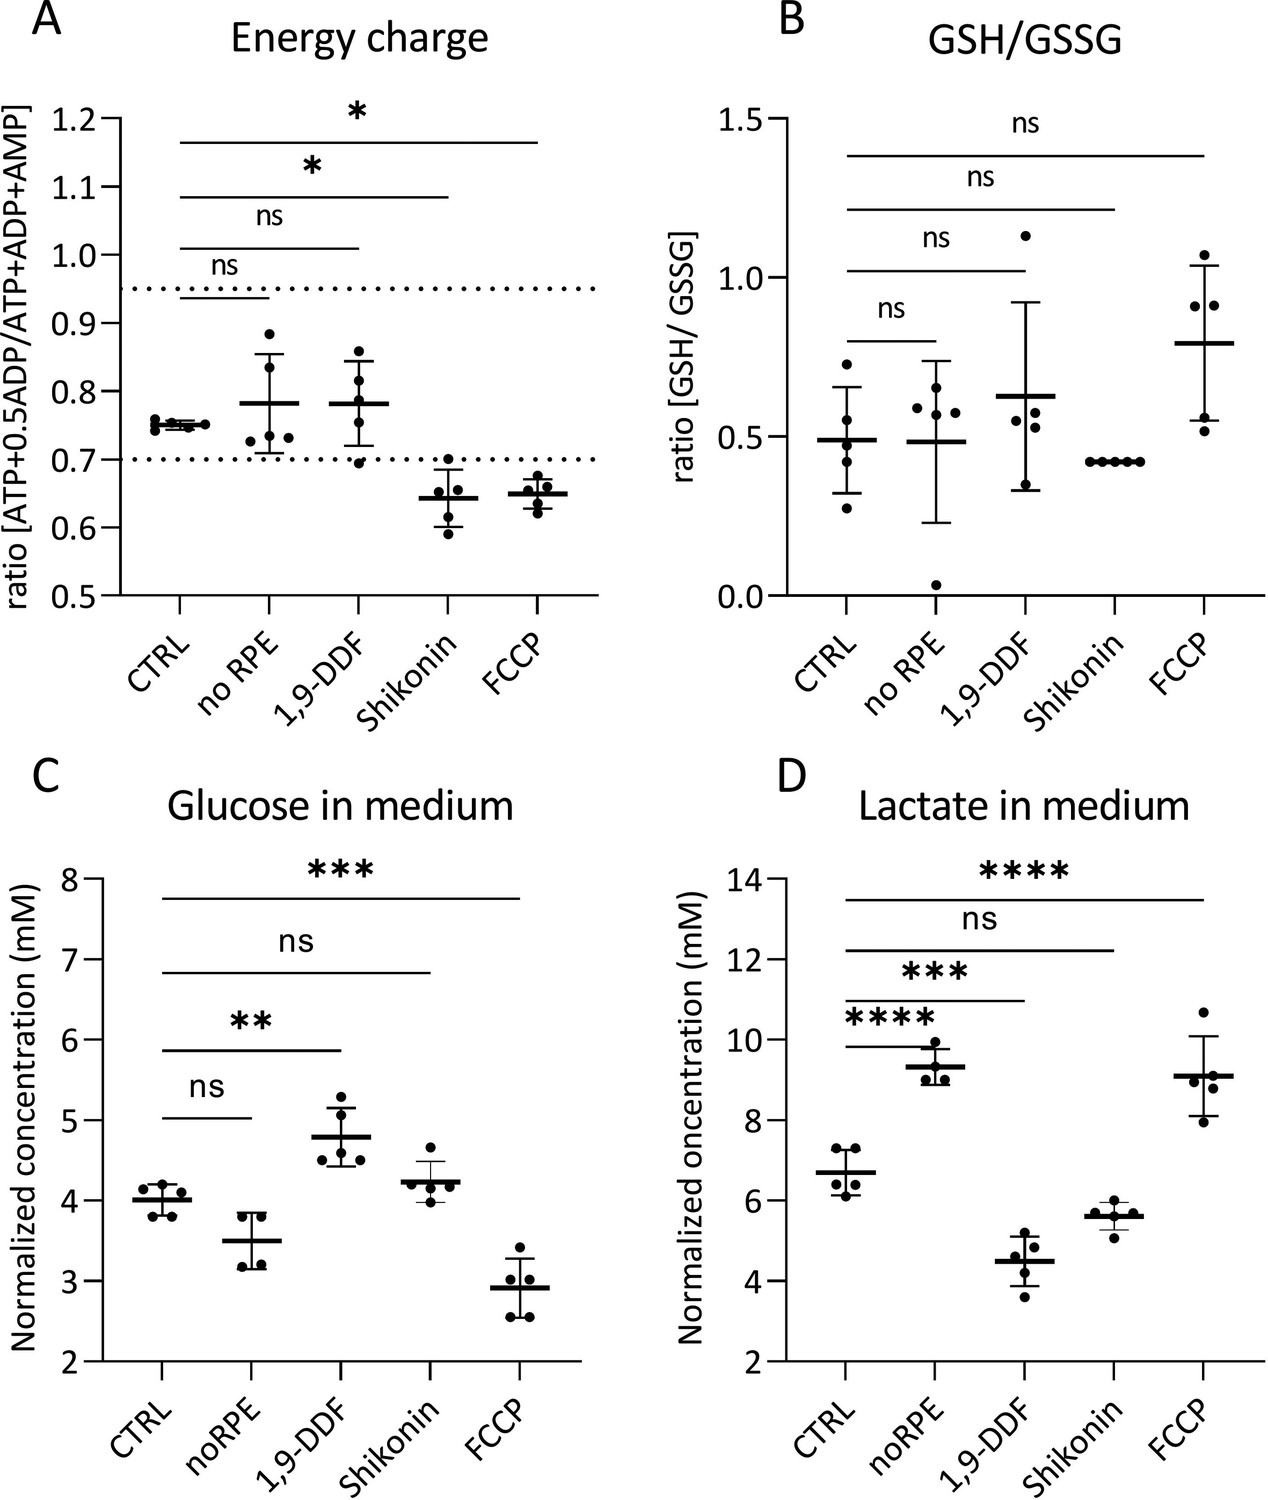
Retinal tissue energy status, glutathione (GSH) ratio, glucose, and lactate concentrations in medium.
Comparison of metabolism-related parameters across the five different experimental conditions. (A) The calculated ratio of the adenylate energy charge in the retina. The dotted lines indicate the energy charge window typical for most healthy cells (0.7–0.95). (B) Ratio of the GSH/glutathione disulfide (GSSG) in retina tissue. (C) Glucose concentration in the medium at the last day of retina explant culture (i.e. at post-natal day [P] 15). (D) Lactate concentration in P15 explant culture medium samples. Statistical testing: one-way ANOVA with Tukey’s post hoc test. Data represented as individual data points as a metabolite concentration ratio (A, B) or in mM concentration range (C, D) with mean ± SD (n=5). Asterisks indicate significance levels; p-values: ****<0.0001, ***<0.001, **<0.01, *<0.05.
Figure 3 with 2 supplements
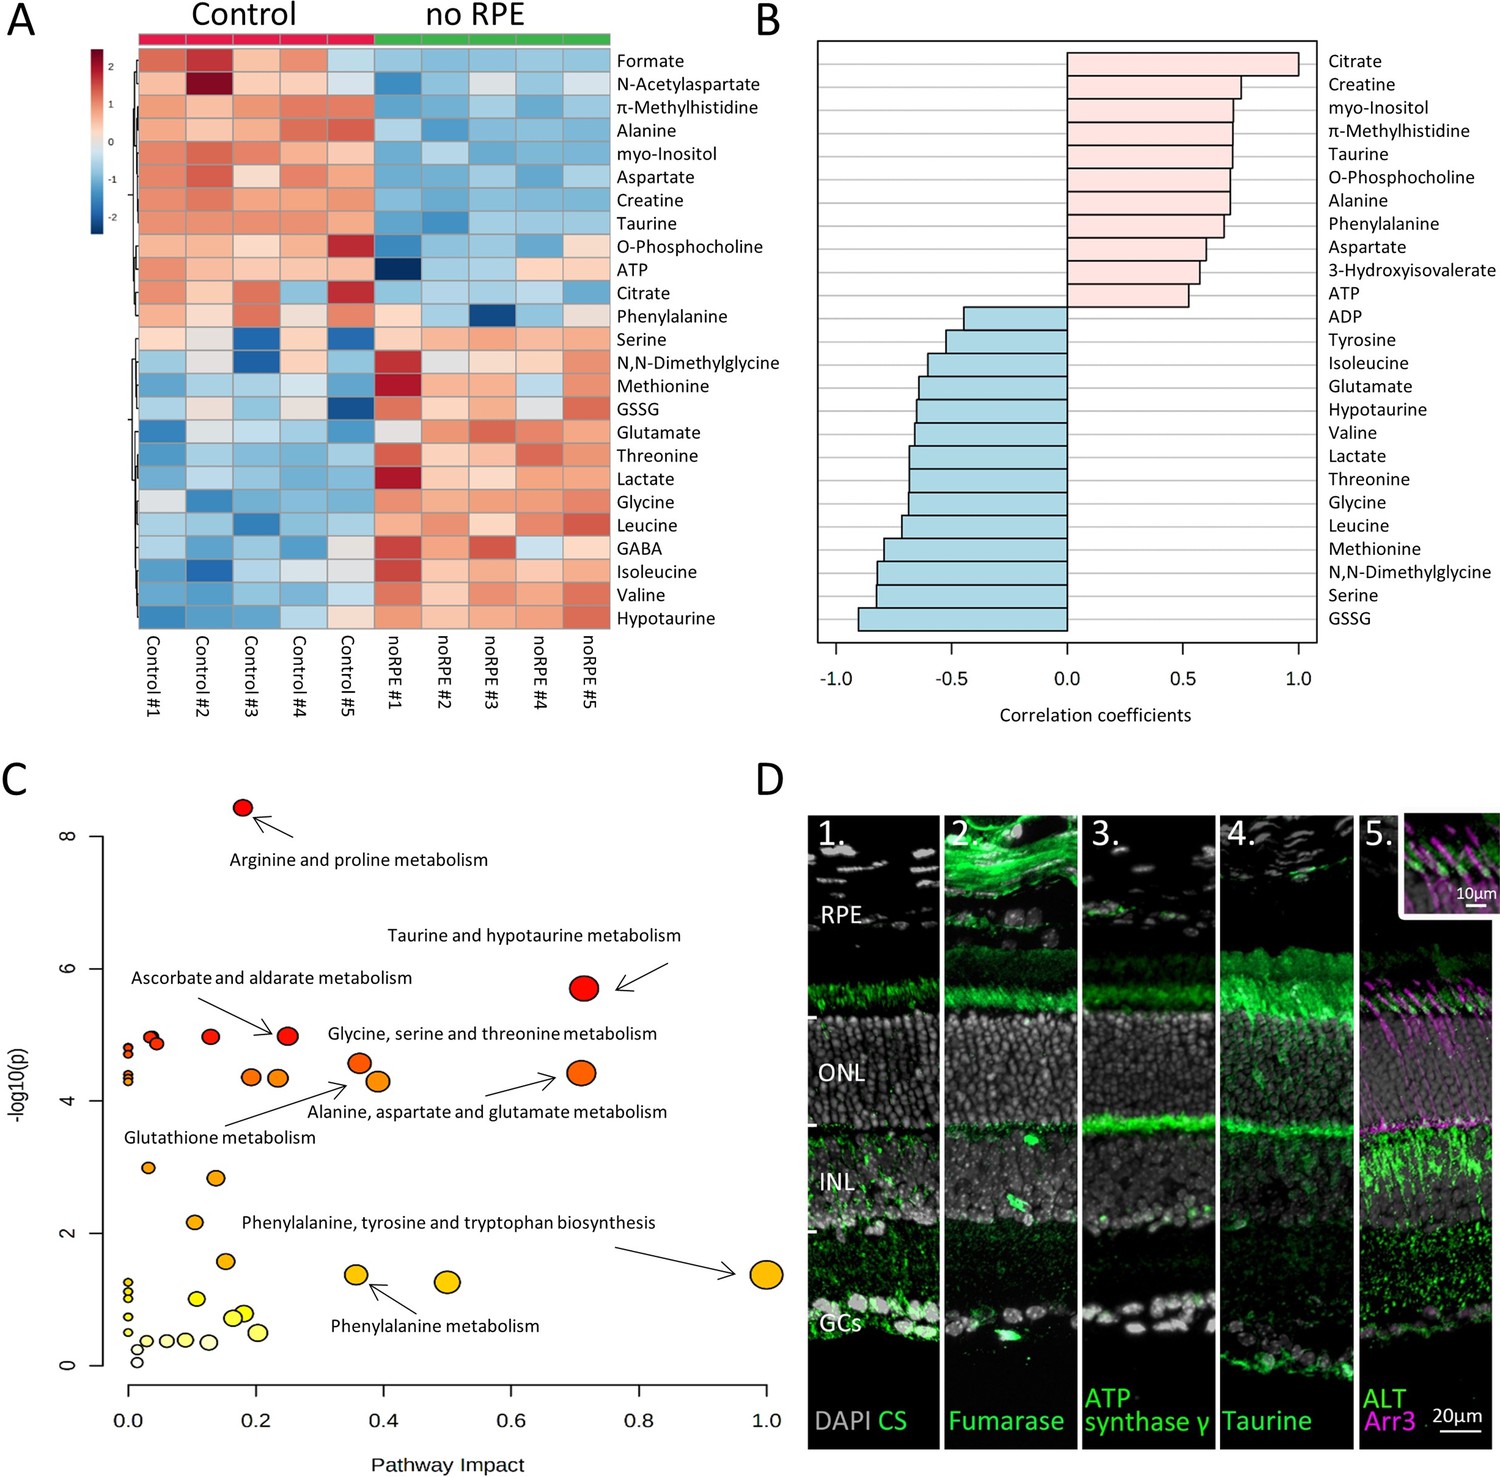
Absence of retinal pigment epithelium (RPE) dramatically changes retinal metabolism.
(A) Heatmap, based on unsupervised hierarchical cluster analysis by Ward’s linkage, illustrating statistically significant changes for 25 metabolites (n=5; unpaired t-test, fold change [FC] >1.2, raw p-value<0.05). (B) Pattern hunter for citrate, showing the top 25 correlating metabolites, correlation coefficient given as Pearson r distance. (C) Metabolic pathways most affected in no RPE condition compared to control, based on Kyoto Encyclopaedia of Genes and Genomes (KEGG) pathway database. (D) Immunodetection of enzymes and metabolites (green) on in vivo retina. (D1) Citrate synthase (CS), (D2) fumarase, (D3), adenosine triphosphate (ATP) synthase γ, (D4) taurine, (D5) alanine transaminase (ALT). Co-staining for ALT and cone arrestin (Arr3; magenta) showed high expression in cone inner segments. DAPI (grey) was used as a nuclear counterstain.
Figure 3—figure supplement 1
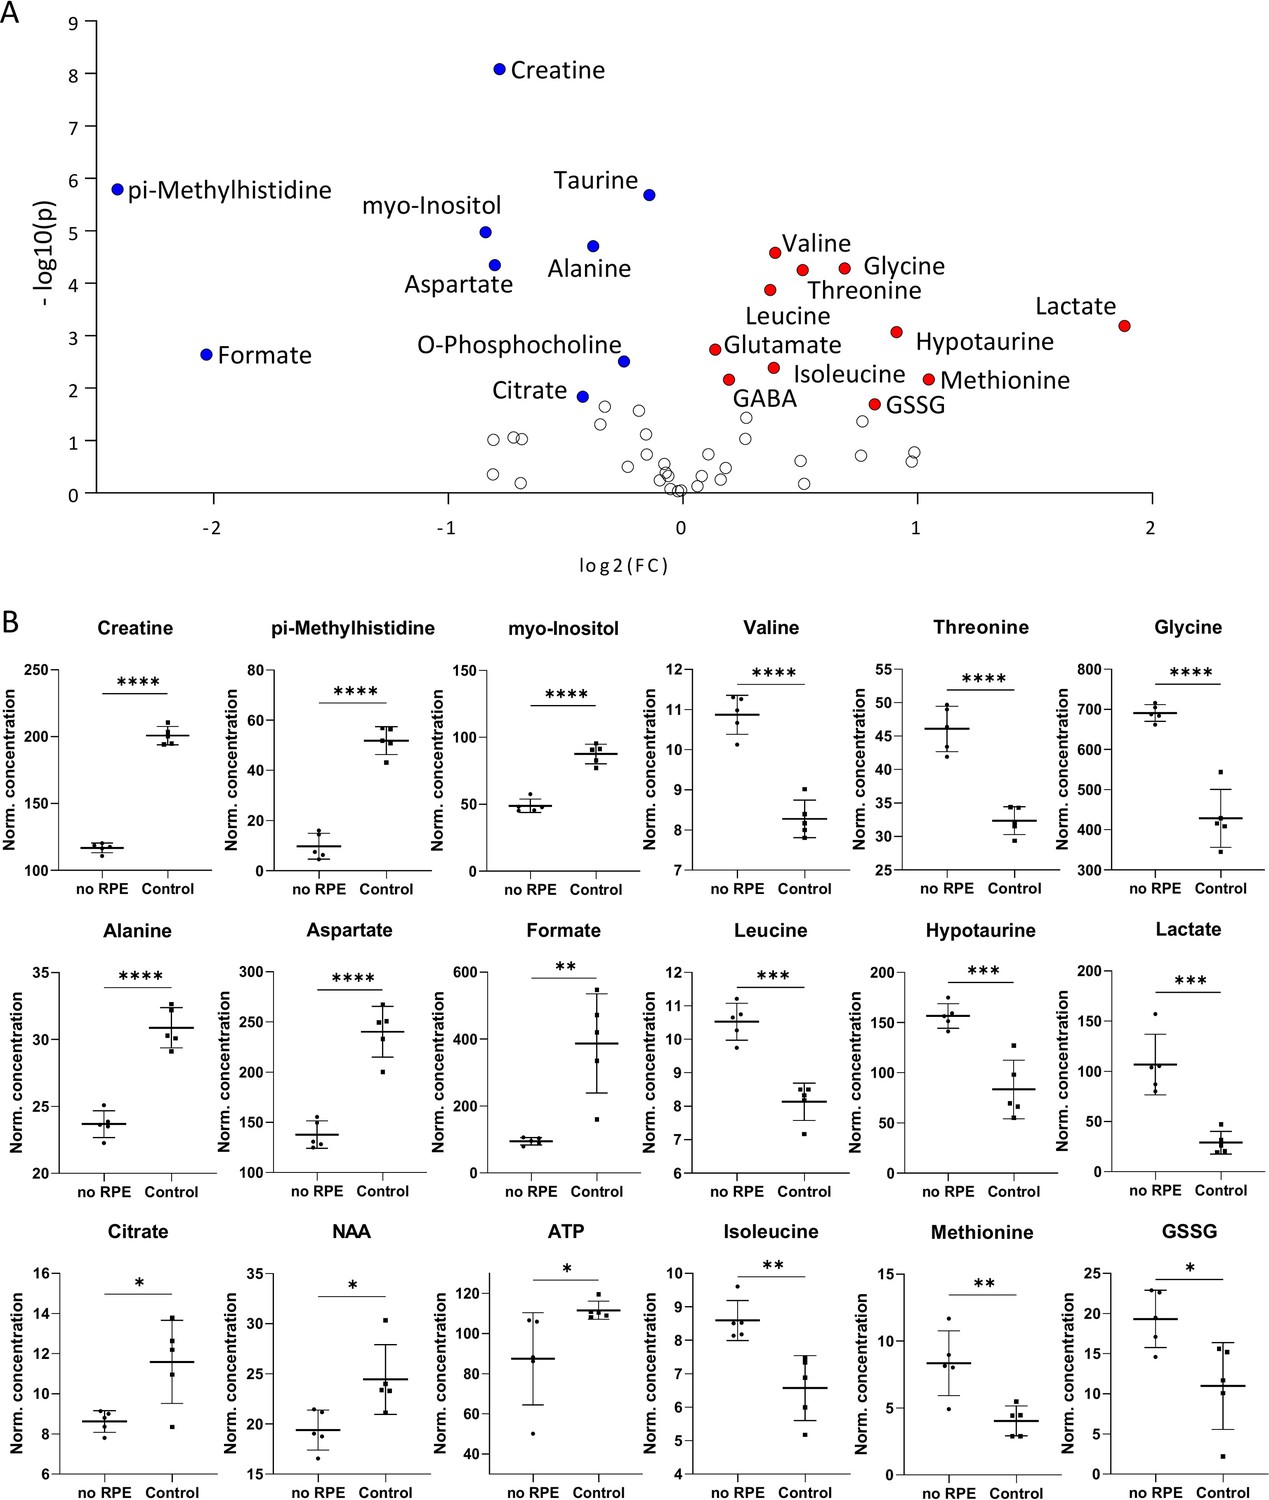
Metabolomic comparison of no retinal pigment epithelial (RPE) condition vs. control.
(A) Volcano plot illustrating the most significant metabolite changes. Log2 (fold change [FC]) = log2 (mean metabolite concentration in control) – log2 (mean metabolite concentration in no RPE group). (B) Individual metabolite box plots for FC >1.2 and raw p-value<0.05. Statistical testing: Student’s unpaired, two-tailed, t-test; p-values: ****<0.0001, ***<0.001, **<0.01, *<0.05. Data represented as individual data points in µM concentration range with mean ± SD (n=5).
Figure 3—figure supplement 2
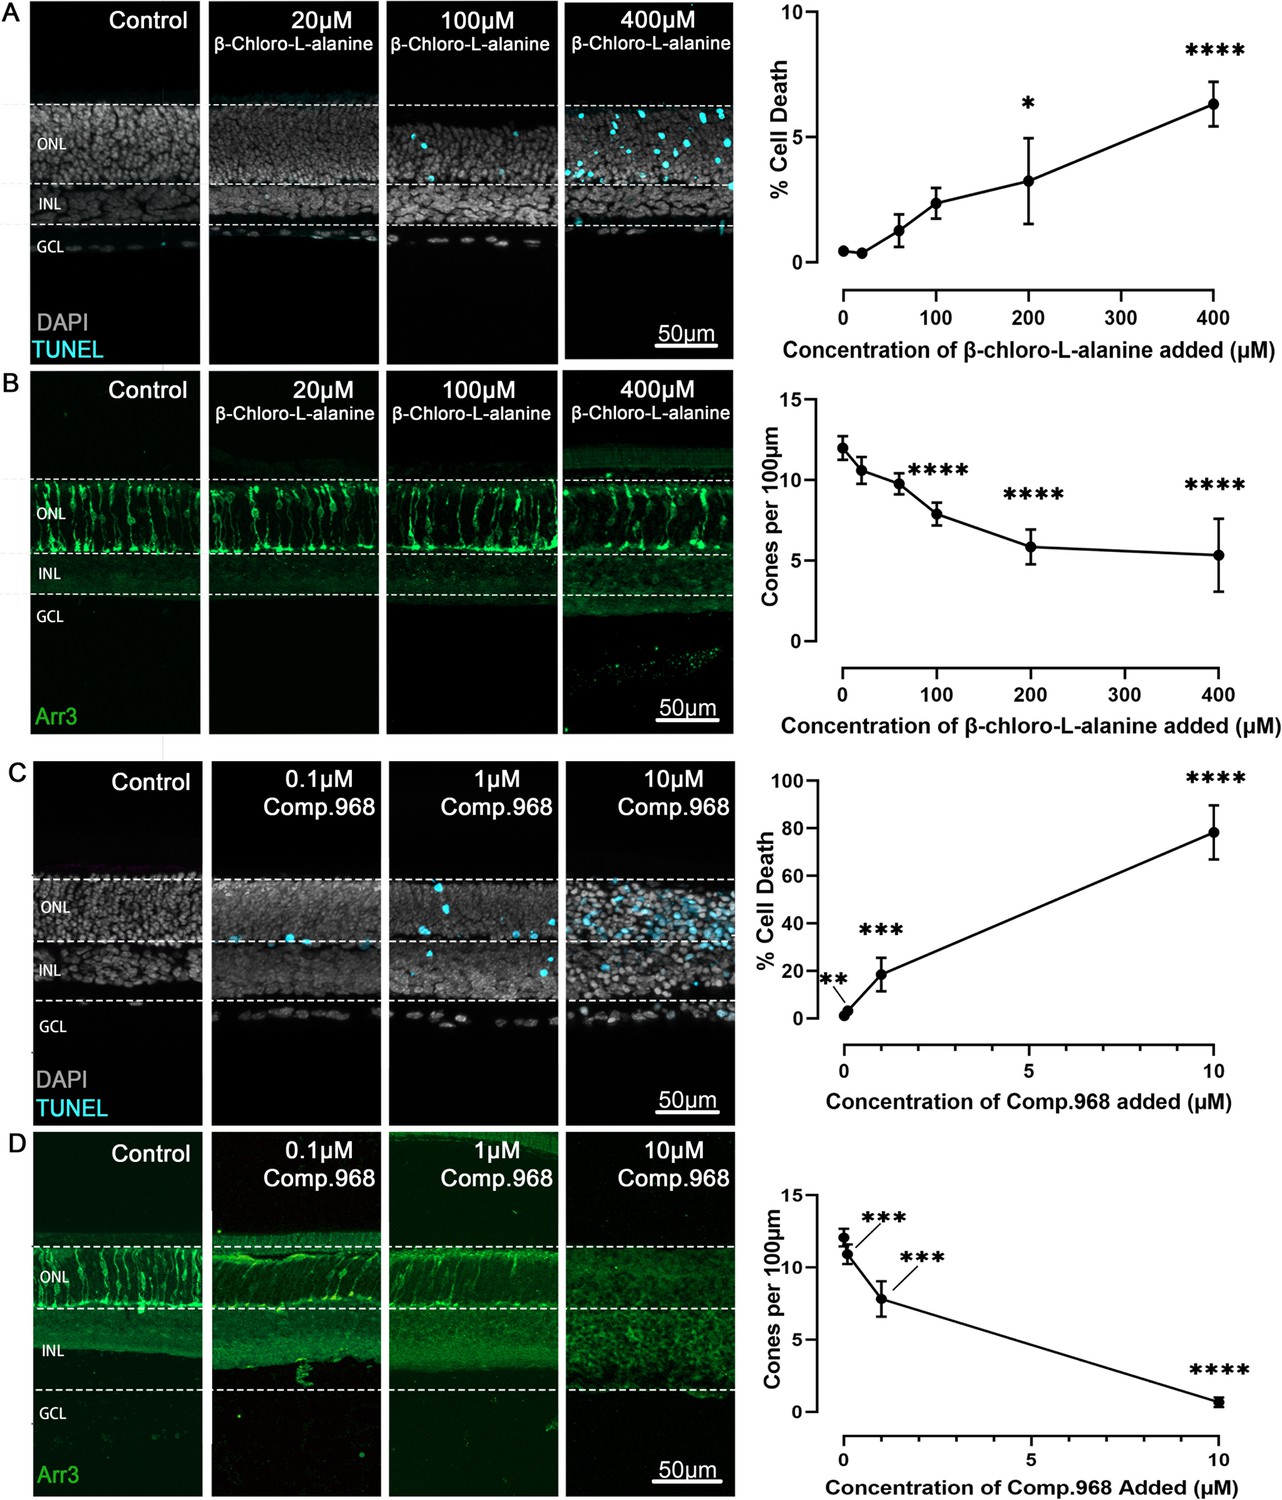
Inhibition of alanine transaminase (ALT) and glutaminase C (GAC) dose-dependently reduce photoreceptor viability.
Organotypic retina explants explanted at post-natal day (P) 9 were treated from P11 to P15 with inhibitors for either ALT or GAC. Left image panels display retinal cross-sections; graphs on right show quantifications of dying cells as evidenced by the terminal dUTP-nick-end labelling (TUNEL) assay (cyan) or cone photoreceptors as indicated by cone arrestin-3 (Arr3) immunostaining (green); DAPI (grey) was used as nuclear counterstain. (A) ALT inhibition with β-chloro-alanine selectively increased photoreceptor cell death in the outer nuclear layer (ONL) in a concentration-dependent manner, and (B) significantly decreased cone viability. (C) Inhibition of GAC with Compound 968 dose-dependently increased photoreceptor cell death, and (D) significantly reduced cone viability. Note that both ALT and GAC inhibition left the inner retina essentially intact. INL = inner nuclear layer; GCL = ganglion cell layer; scale bar = 50 µm. Statistical comparison using one-way ANOVA with Tukey’s multiple comparisons test; n=5–8 individual retinal explants from different animals per treatment condition; p-values: ****<0.0001, ***<0.001, **<0.01, *<0.05.
Figure 4 with 1 supplement
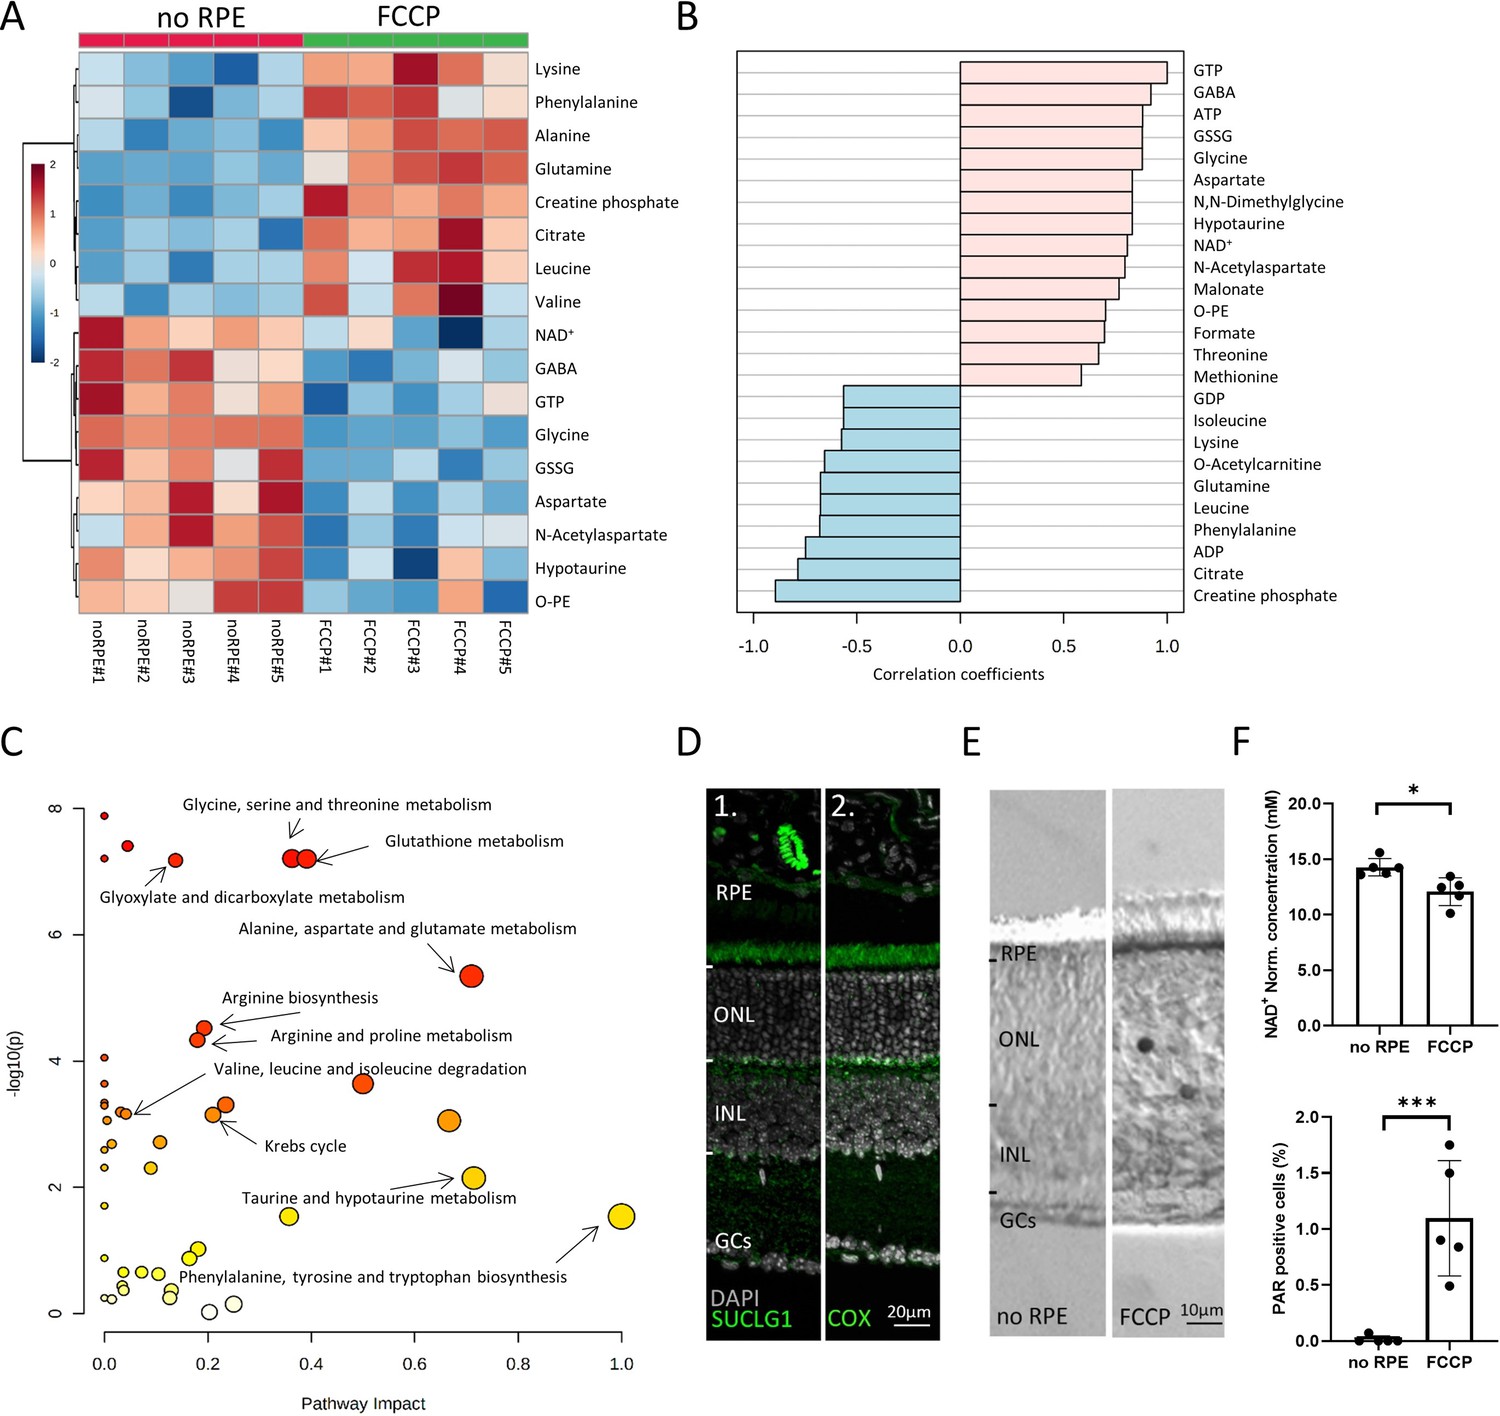
Comparison between no retinal pigment epithelial (RPE) and carbonyl cyanide-p-trifluoromethoxyphenylhydrazone (FCCP) conditions.
(A) Heatmap, based on unsupervised hierarchical cluster analysis by Ward’s linkage, illustrating statistically significant metabolite changes (n=5; unpaired t-test, fold change >1.2, raw p-value<0.05). (B) Pattern hunter for guanosine triphosphate (GTP) showing the top 25 correlating compounds. Correlation coefficient given as Pearson r distance. (C) Kyoto Encyclopaedia of Genes and Genomes (KEGG)-based pathway analysis, comparison between no RPE and FCCP. (D) Immunofluorescence for succinate-CoA ligase-1 (SUCLG-1, green) labelled photoreceptor inner segments and co-localised with cytochrome oxidase (COX). DAPI (grey) was used as a nuclear counterstain. (E) PAR-positive photoreceptors (black) in the outer nuclear layer (ONL) of FCCP-treated retina. (F) Compared to no RPE, NAD+ levels were lower in the FCCP group, while the percentage of PAR-positive cells was higher. Data represented as mean ± SD (n=5). Statistical testing: Student’s two-tailed t-test. p-Values: ***<0.001, *<0.05.
Figure 4—figure supplement 1
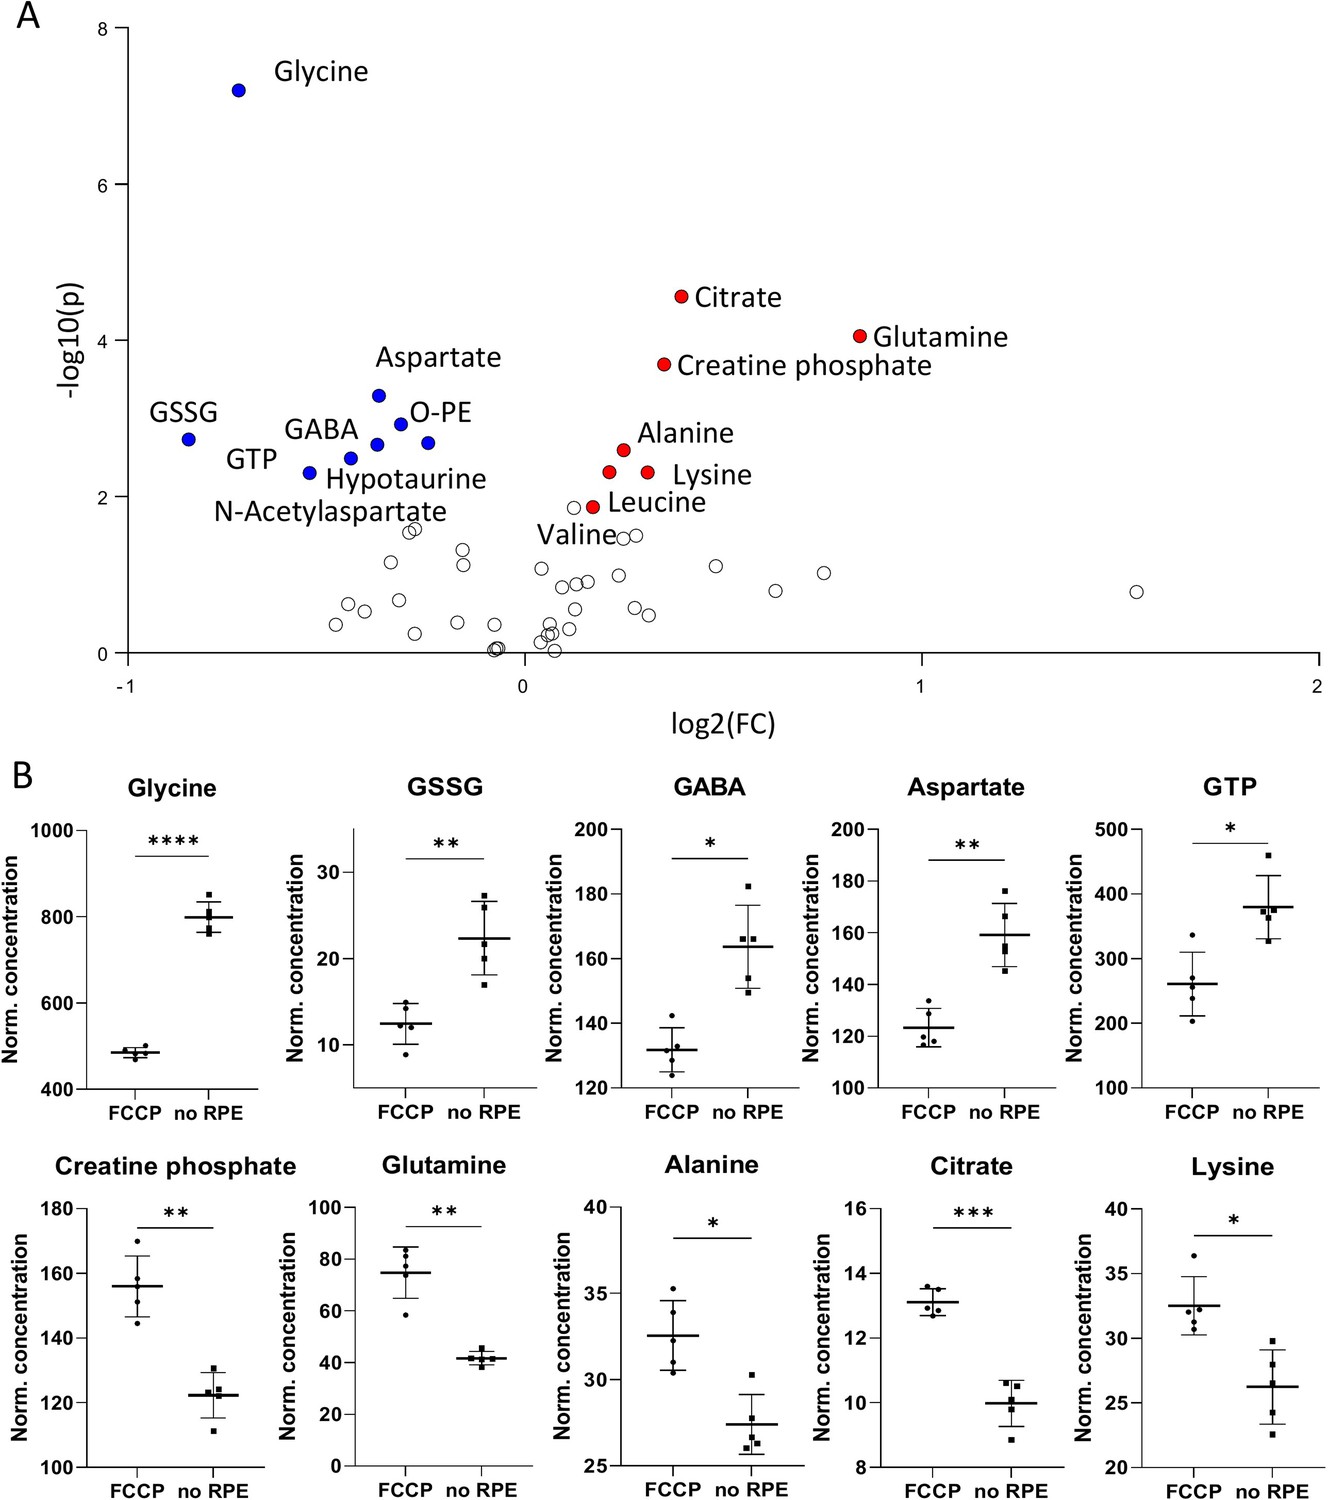
Metabolomic comparison of no retinal pigment epithelial (RPE) vs. carbonyl cyanide-p-trifluoromethoxyphenylhydrazone (FCCP) treatment.
(A) Volcano plot illustrating the most significant metabolic changes. Log2 (fold change [FC]) = log2 (mean metabolite concentration in FCCP group) – log2 (mean metabolite concentration in no RPE group). (B) Individual metabolite box plots for FC > 1.2 and raw p-value< 0.05. Statistical testing: Student’s unpaired, two-tailed, t-test; p-values: ****<0.0001, ***<0.001, **<0.01, *<0.05. Data represented as individual data points in µM concentration range with mean ± SD (n=5).
Figure 5 with 2 supplements
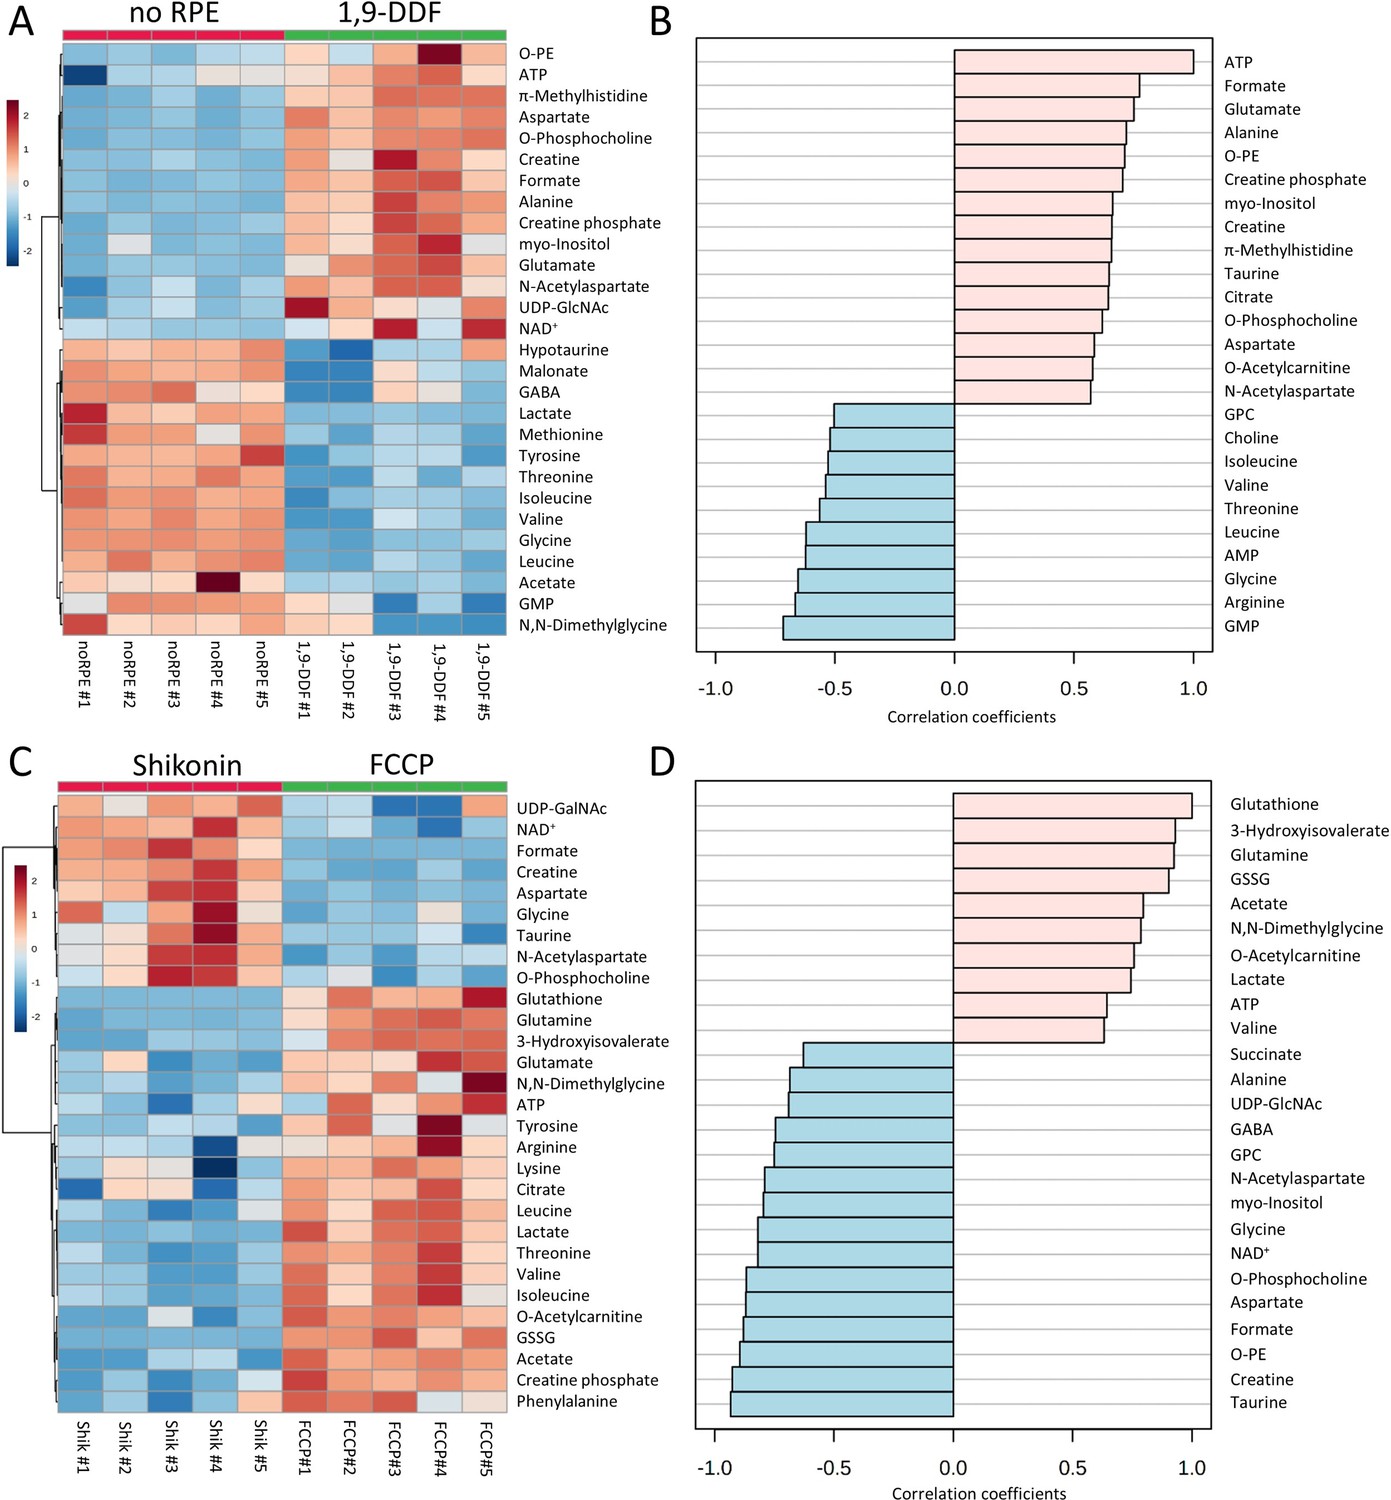
Metabolomic analysis of no retinal pigment epithelial (RPE) vs.1,9-dideoxyforskolin (1,9-DDF) treatment and Shikonin vs. carbonyl cyanide-p-trifluoromethoxyphenylhydrazone (FCCP) treatment.
Heatmap illustrating statistically significant metabolite changes (n=5; unpaired t-test, fold change [FC] >1.2, raw p-value<0.05) for (A) no RPE vs. 1,9-DDF and (C) Shikonin vs. FCCP. Pattern hunter for (B) adenosine triphosphate (ATP) and (D) glutathione, showing the top 25 correlating compounds. Correlation coefficient given as Pearson r distance.
Figure 5—figure supplement 1
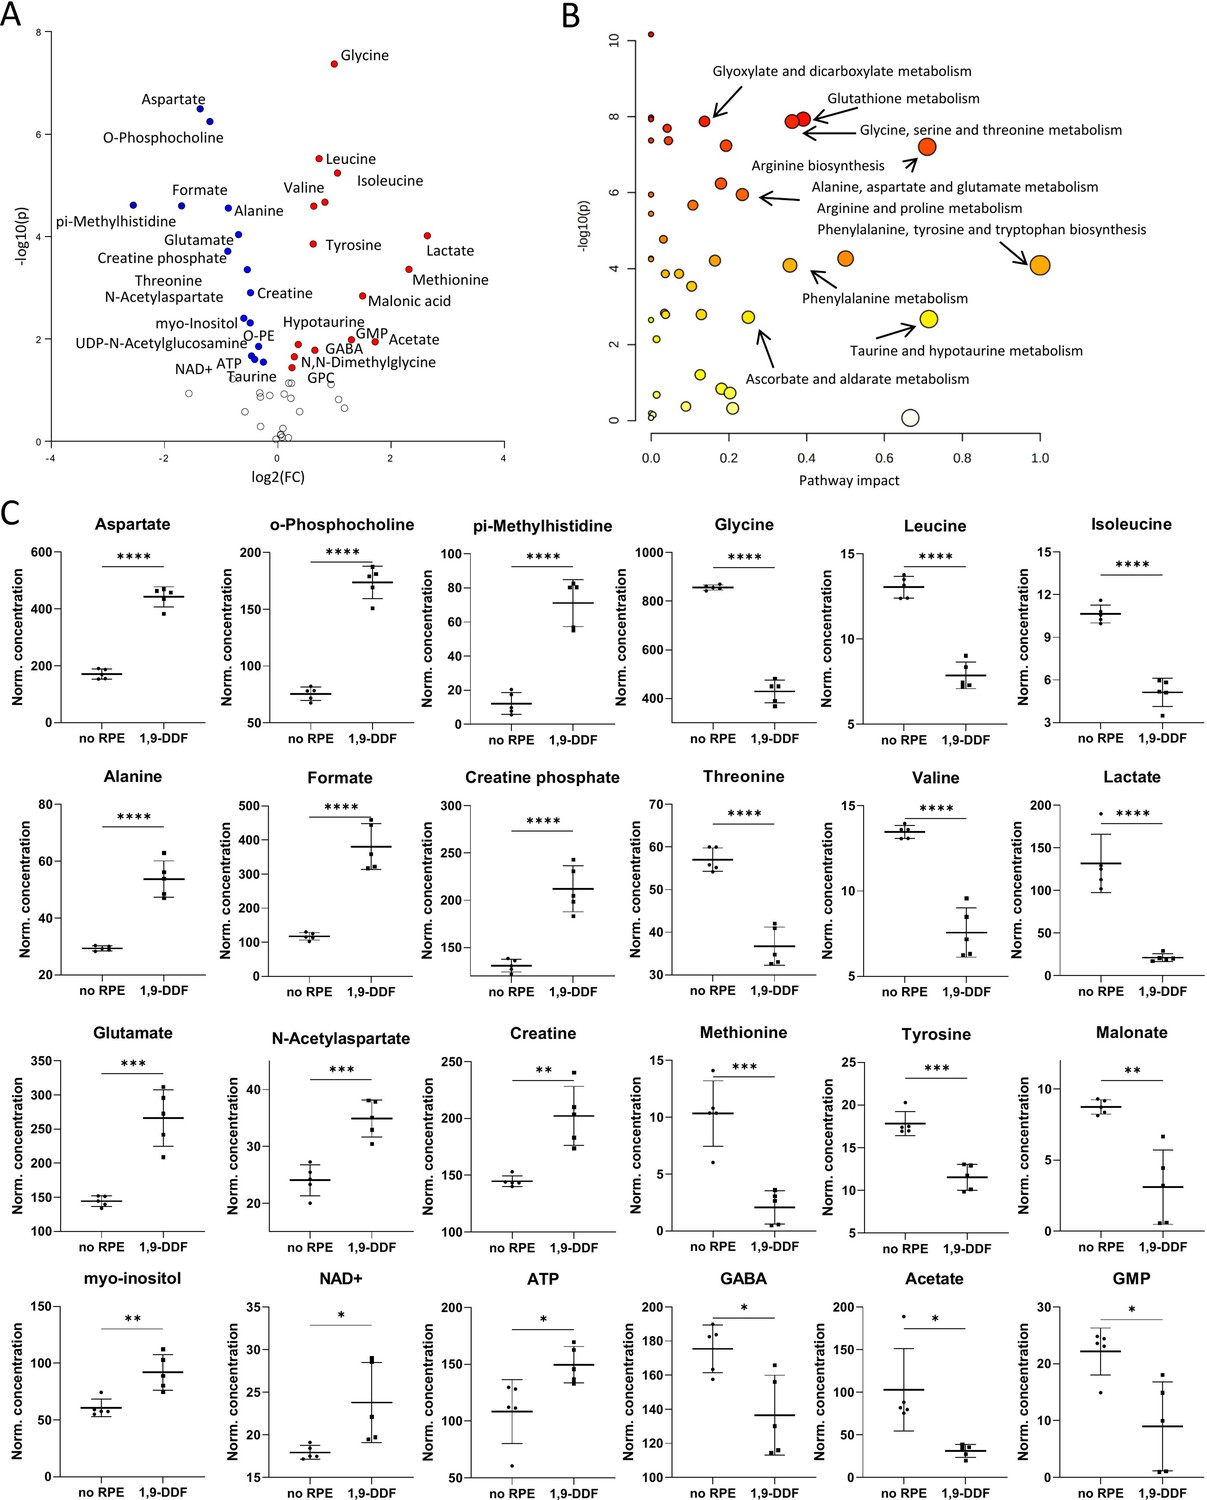
Metabolomic comparison of no retinal pigment epithelial (RPE) vs.1,9-dideoxyforskolin (1,9-DDF) treatment.
(A) Volcano plot illustrating the most significant metabolic changes. Log2 (fold change [FC]) = log2 (mean metabolite concentration in no RPE group) – log2 (mean metabolite concentration in 1.9-DDF group). (B) Kyoto Encyclopaedia of Genes and Genomes (KEGG) database-based pathway analysis with the most affected metabolic pathways. (C) Individual metabolite box plots for FC > 1.2 and raw p-value<0.05. Statistical testing: Student’s unpaired, two-tailed, t-test; p-values: ****<0.0001, ***<0.001, **<0.01, *<0.05. Data represented as individual data points in µM concentration range with mean ± SD (n=5).
Figure 5—figure supplement 2
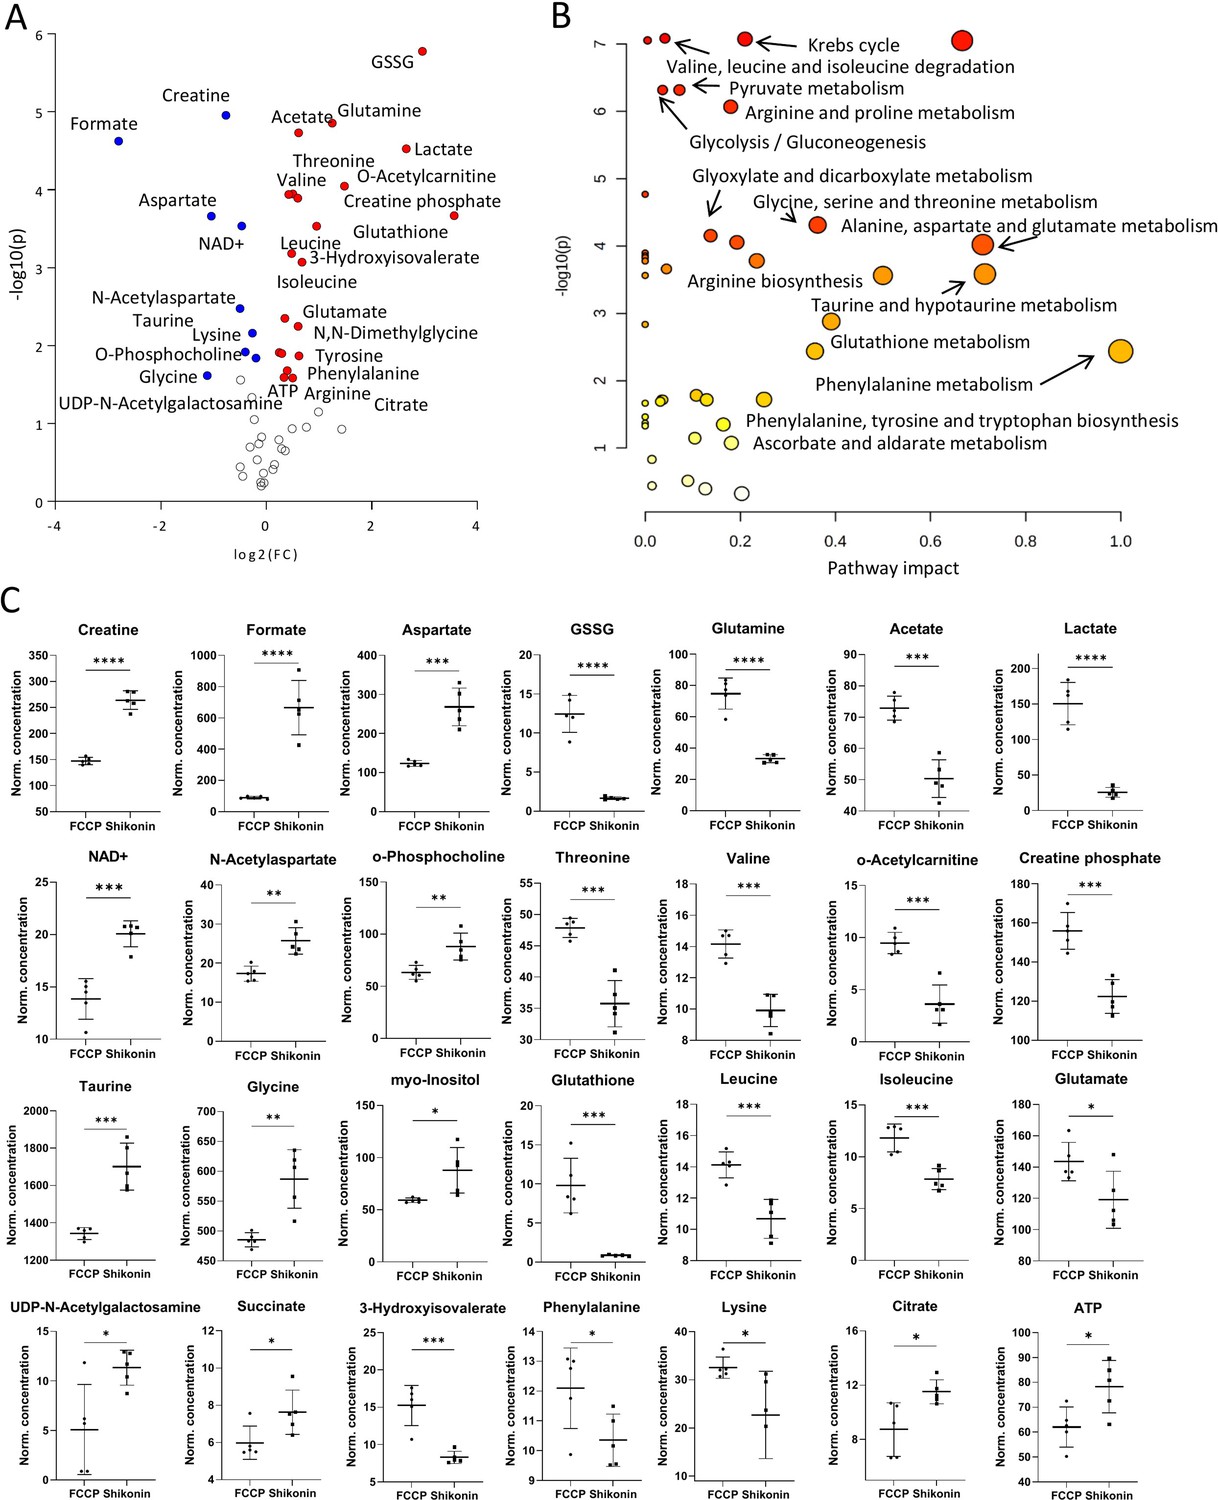
Metabolomic comparison of carbonyl cyanide-p-trifluoromethoxyphenylhydrazone (FCCP) vs. Shikonin treatments.
(A) Volcano plot with the most significant metabolic changes illustration. Log2 (fold change [FC]) = log2 (mean metabolite concentration in FCCP group) – log2 (mean metabolite concentration in Shikonin group). (B) Kyoto Encyclopaedia of Genes and Genomes (KEGG) database-based pathway analysis with the most affected metabolic pathways. (C) Individual metabolite box plots for FC > 1.2 and raw p-value<0.05. Statistical testing: Student’s unpaired, two-tailed, t-test; p-values: ****<0.0001, ***<0.001, **<0.01, *<0.05. Data represented as individual data points in µM concentration range with mean ± SD (n=5).
Figure 6 with 1 supplement
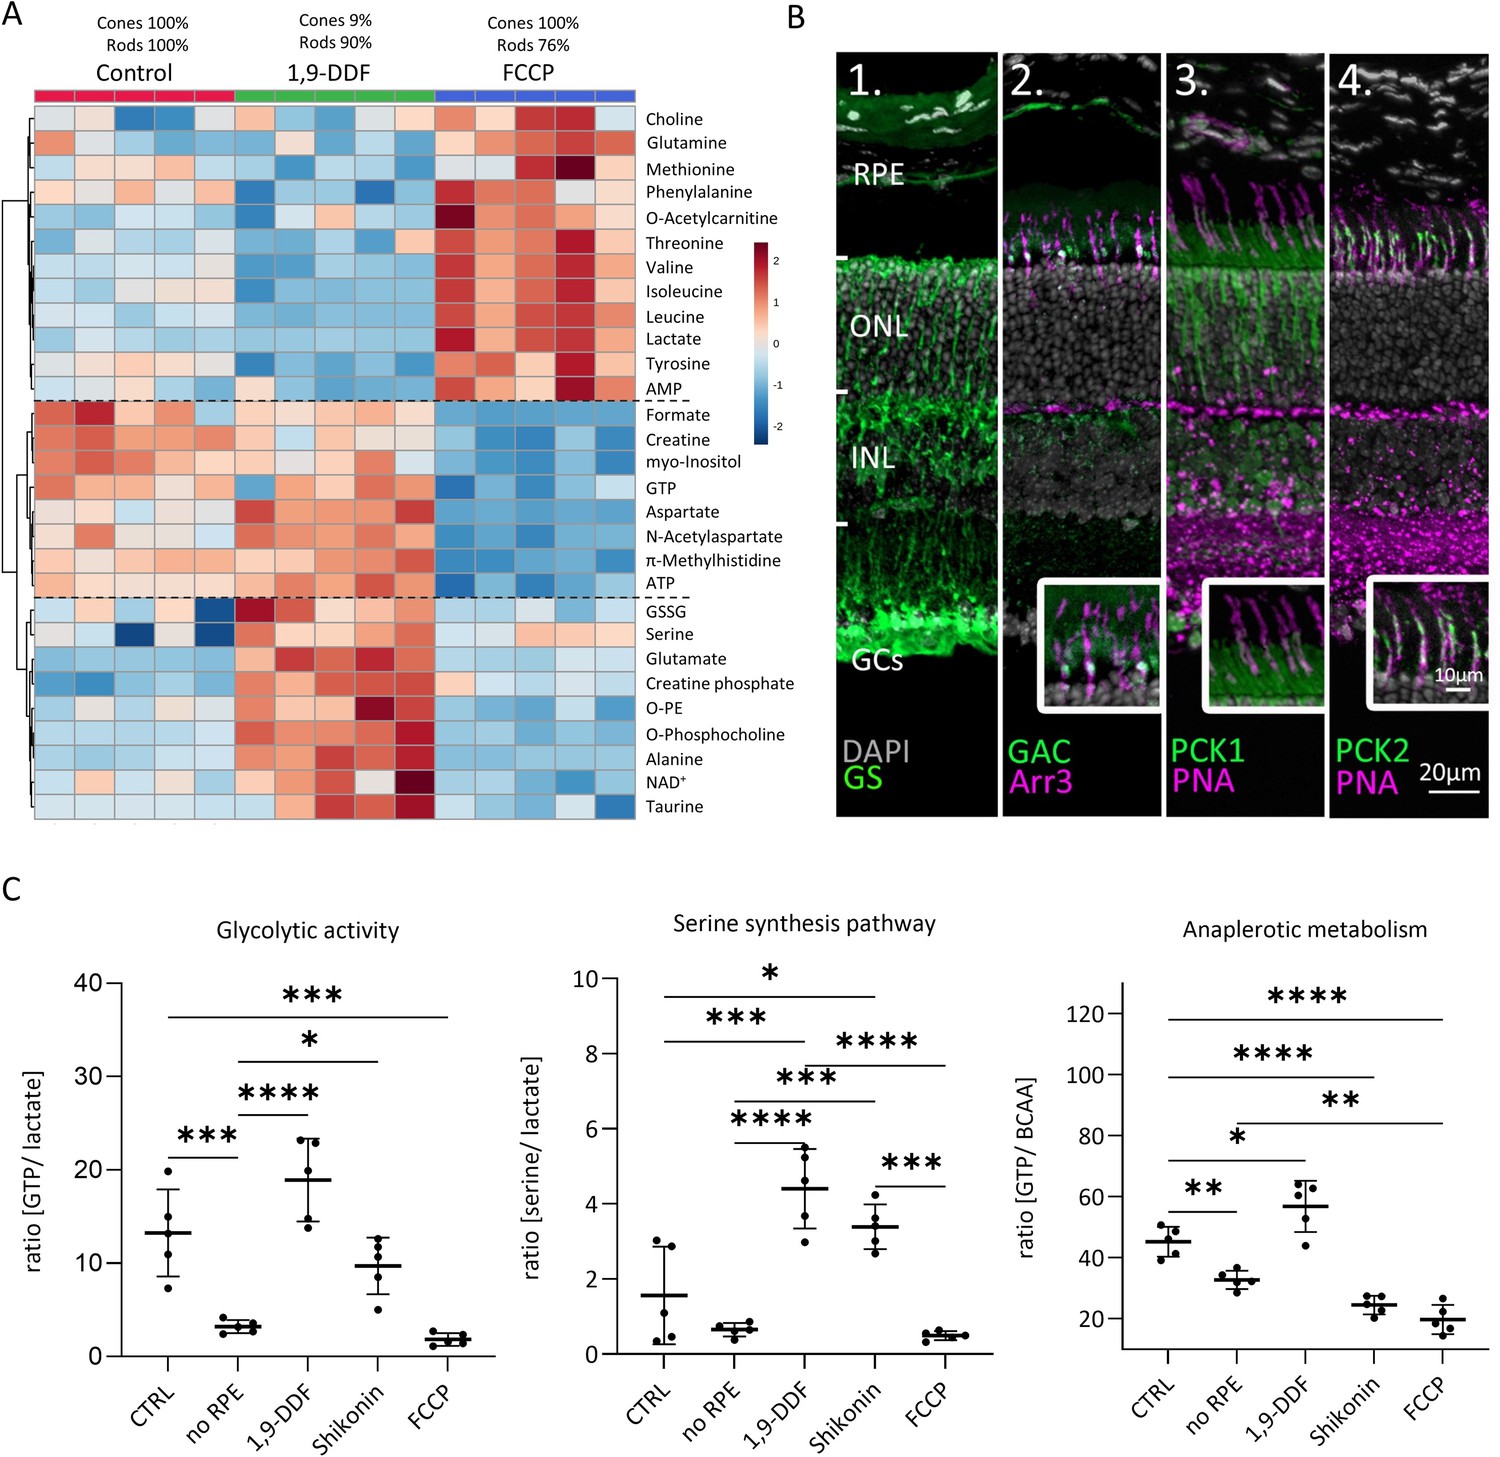
Metabolomic comparison between control, 1,9-dideoxyforskolin (1,9-DDF), and carbonyl cyanide-p-trifluoromethoxyphenylhydrazone (FCCP) treatment.
(A) Heatmap illustrating 29 statistically significant metabolite changes (parametric one-way ANOVA, Fisher’s LSD post hoc analysis). Three main clusters of metabolite changes were evident (dashed lines). (B) Immunostaining (green) for enzymes related to glutamine metabolism. DAPI (grey) was used as nuclear counterstain. (B1) Glutamine synthase (GS), (B2) glutaminase C (GAC); co-localisation with cone-arrestin (Arr3; magenta). (B3) Phosphoenolpyruvate carboxykinase 1 (PCK1) did not co-localise with cone marker peanut agglutinin (PNA) while (B4) PCK2 did. (C) Ratios between metabolites representing glycolysis (lactate vs. guanosine triphosphate [GTP]), anaplerotic metabolism (GTP vs. branched chain amino acids [BCAA]), and serine synthesis pathway (serine vs. lactate). Data represented as individual data points with mean ± SD (n=5). Statistical testing: one-way ANOVA with Tukey’s post hoc test; p-values: ****<0.0001, ***<0.001, **<0.01, *<0.05.
Figure 6—figure supplement 1
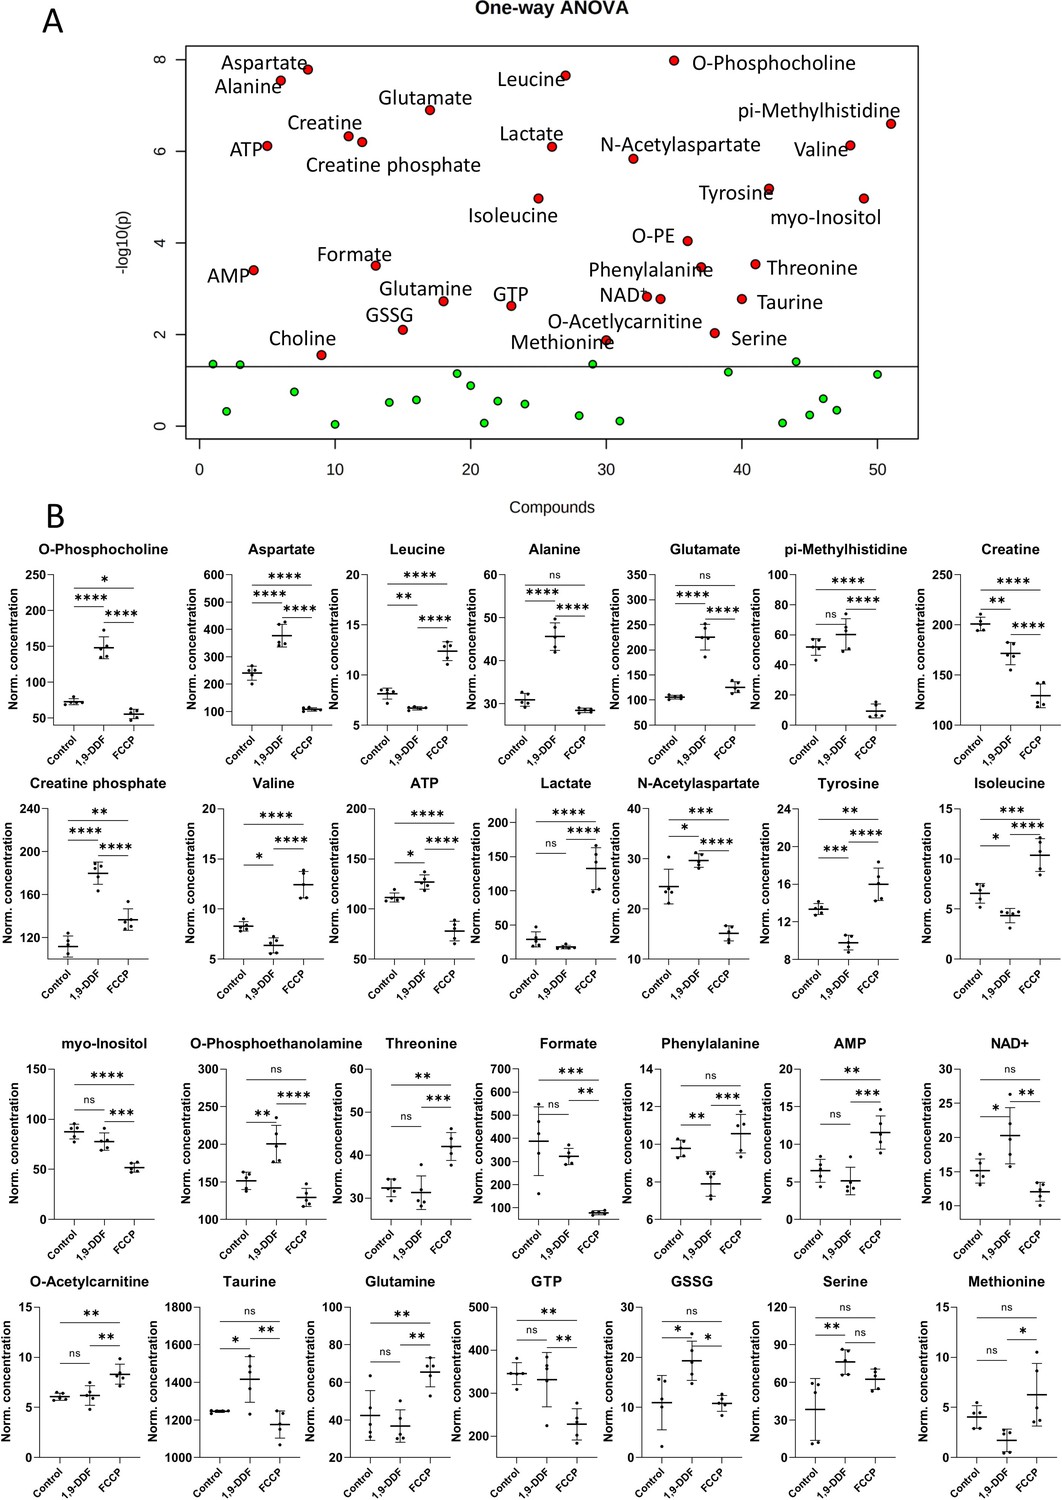
Metabolomics analysis of control vs. 1,9-dideoxyforskolin (1,9-DDF) vs. carbonyl cyanide-p-trifluoromethoxyphenylhydrazone (FCCP) three-way comparison.
(A) One-way ANOVA result visualisation plot displaying the most significant metabolite concentration changes based on the three-group analysis. The x-axis labels a numerical list of quantified and analysed metabolites in alphabetical order. (B) Individual metabolite box plots. Statistical analysis: one-way ANOVA, Fisher’s LSD post hoc analysis, p-values: ****<0.0001, ***<0.001, **<0.01, *<0.05. Data shown as individual data points in µM concentration range with mean ± SD (n=5).
Figure 7 with 1 supplement
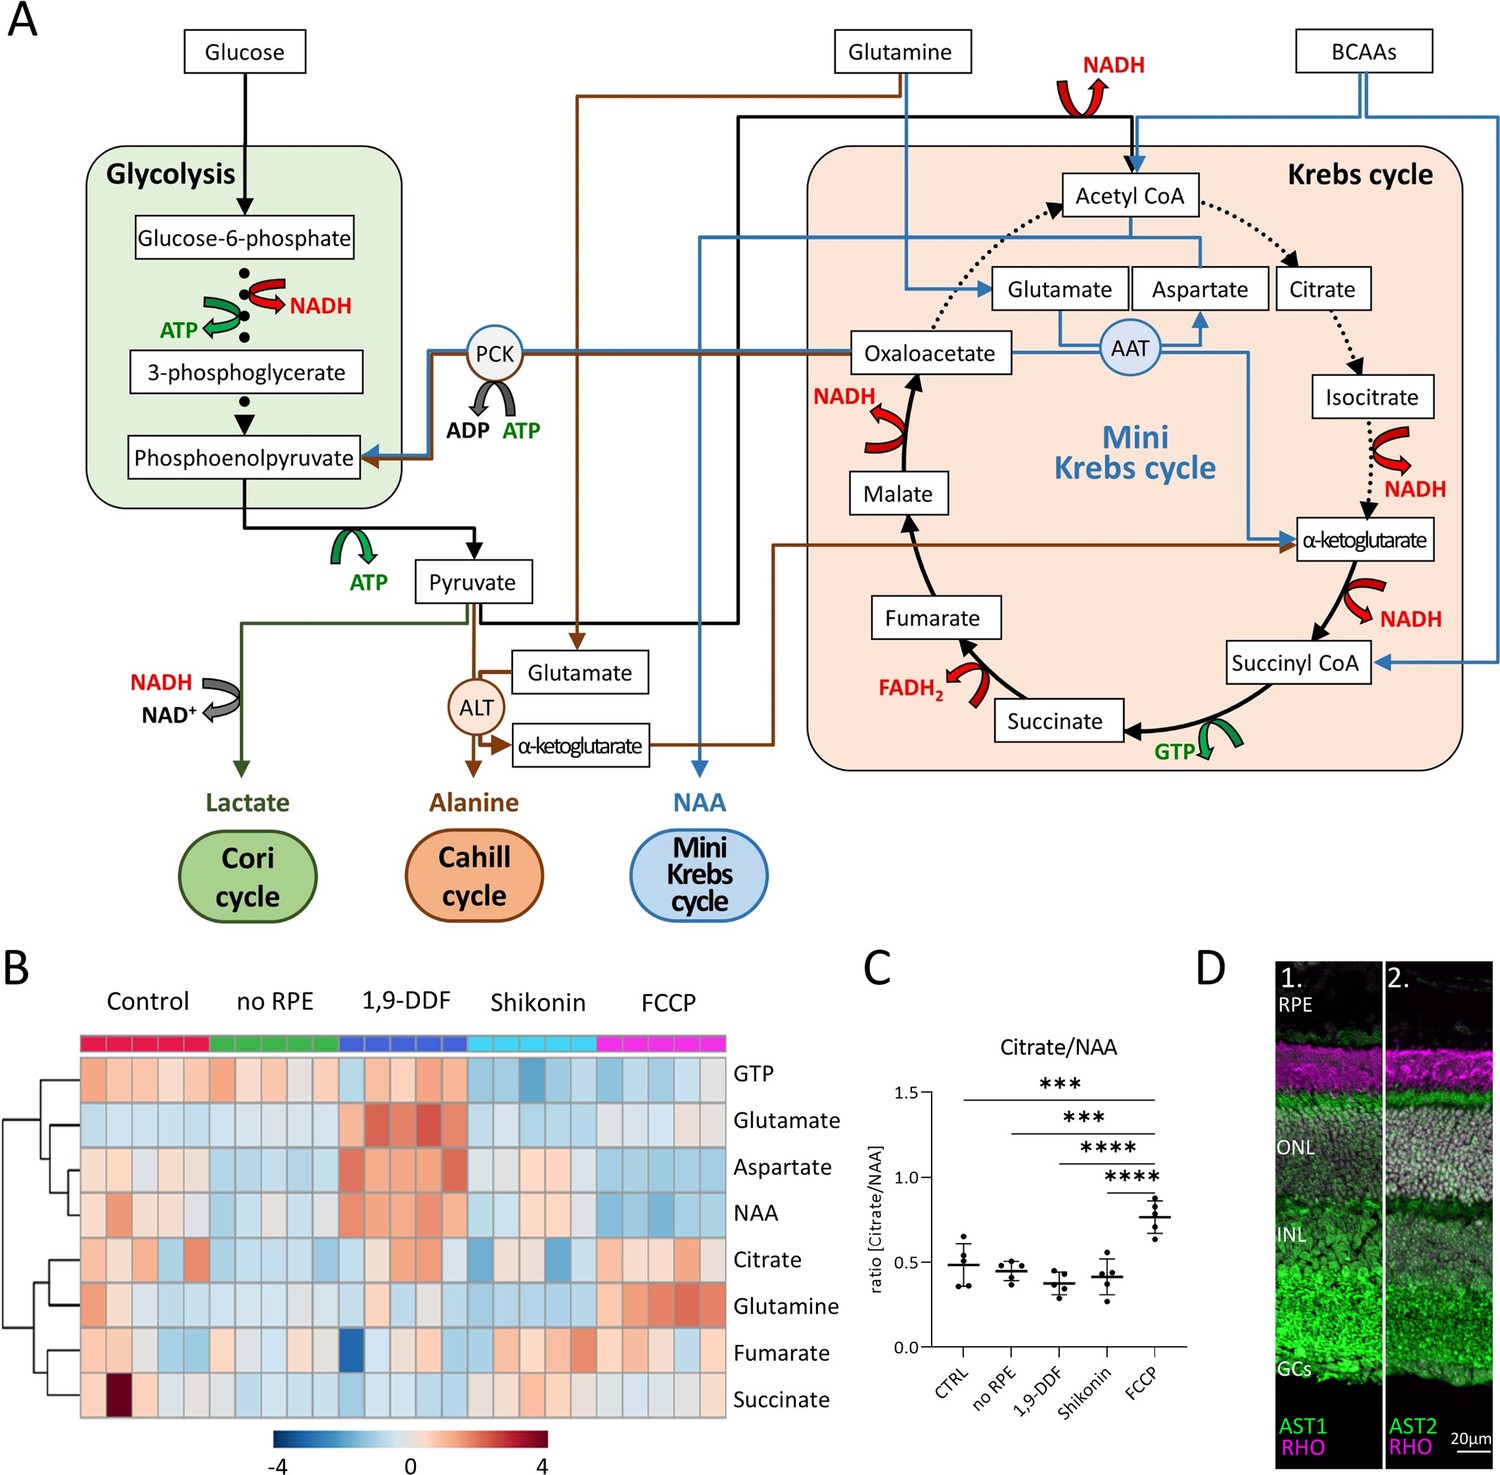
Metabolic pathways in the retina, key metabolites, and expression of aspartate aminotransferase (AST).
(A) Overview of main metabolic pathways and metabolites. Execution of Cori- (green arrows), Cahill- (brown), or mini-Krebs-cycle (blue) releases the signature metabolites lactate, alanine, and N-acetylaspartate (NAA), respectively. Key enzymes of the Cahill- and mini-Krebs-cycle are phosphoenolpyruvate carboxykinase (PCK), pyruvate kinase M (PKM), alanine transaminase (ALT), and AST. (B) Hierarchical clustering of eight metabolites connected to Krebs and mini-Krebs cycle. (C) Ratio of NAA vs. citrate, representing full and mini-Krebs-cycle. Data represented as ratio of individual data points with mean ± SD (n=5). Statistical comparison using one-way ANOVA, Tukey’s multiple comparisons test; p-values: ****<0.0001, ***<0.001. (D) Immunostaining for aspartate aminotransferase-1 and -2 (AST1, AST2; green) co-stained with the rod photoreceptor outer segment marker rhodopsin (RHO; magenta), DAPI (grey) was used as nuclear counterstain.
Figure 7—figure supplement 1
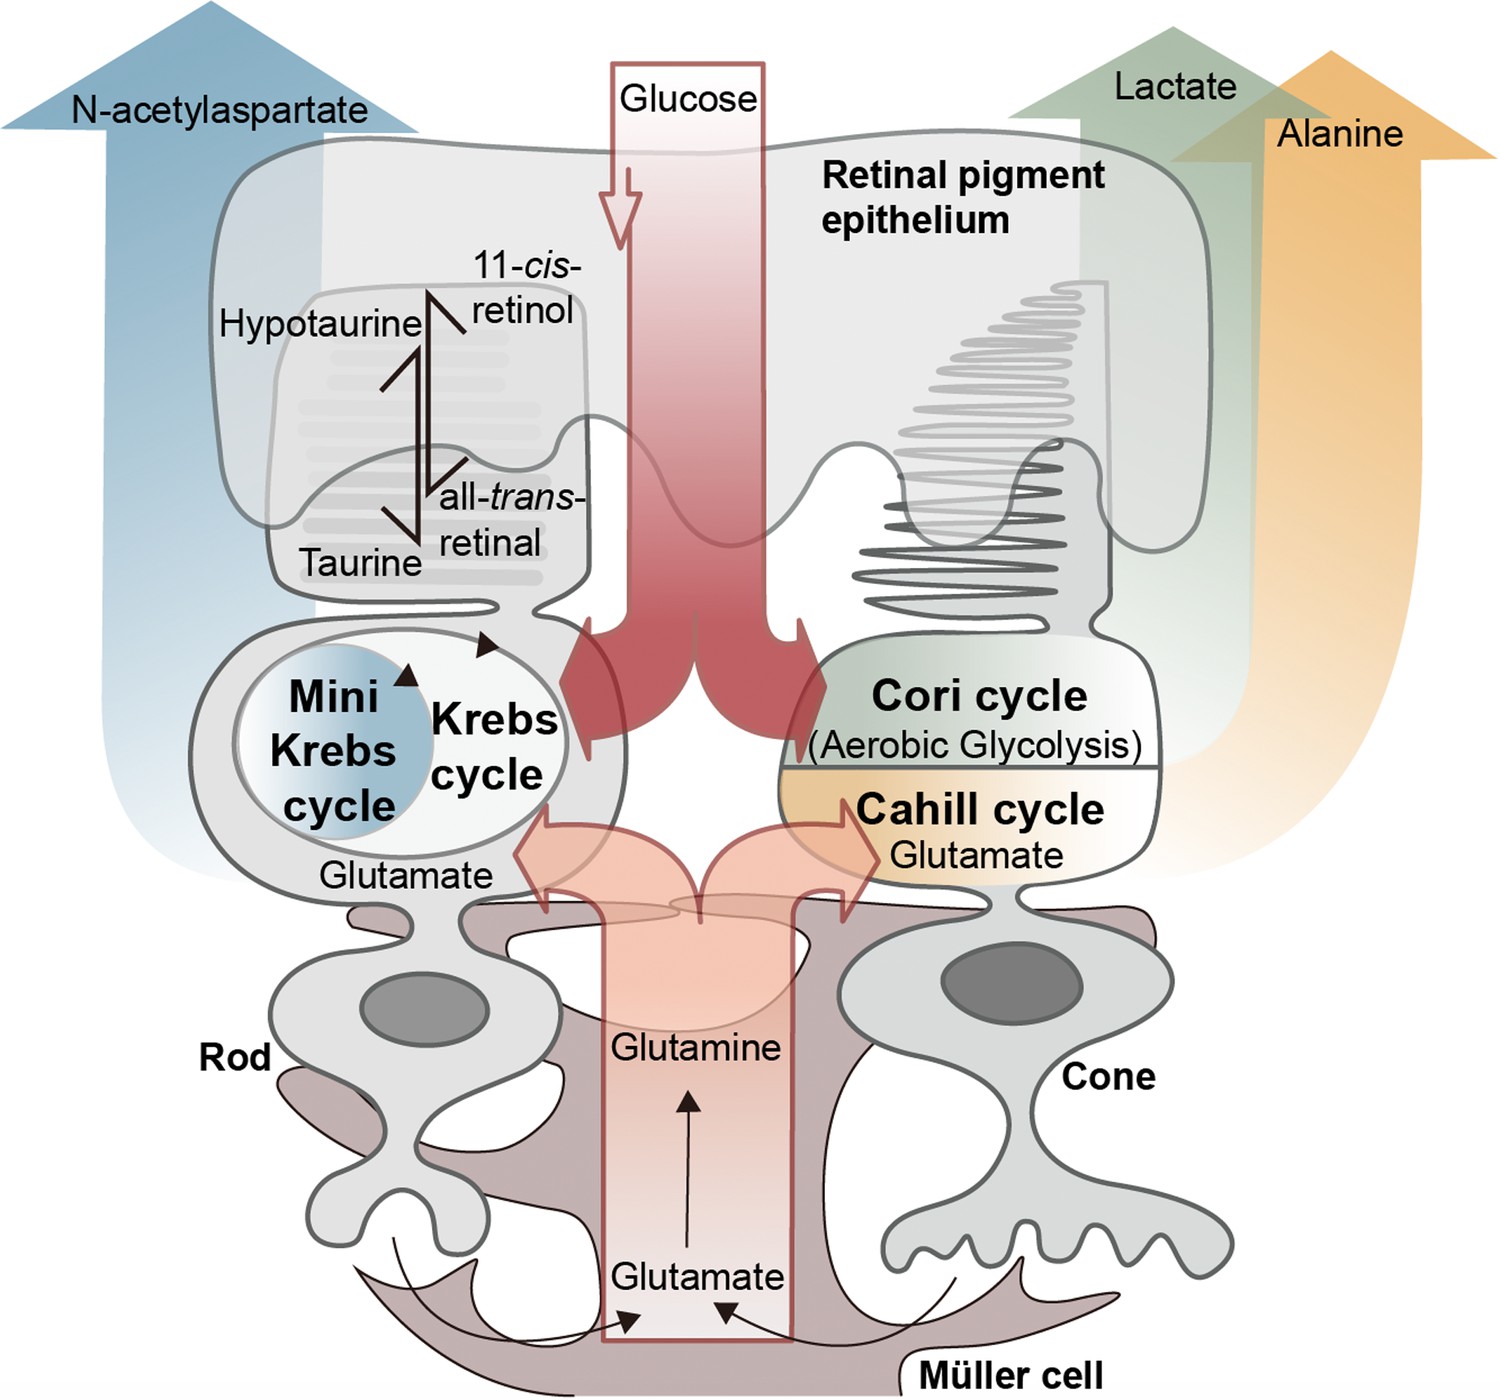
Proposed metabolic interactions between different retinal cell types.
Retinal photoreceptors appear to employ both glucose and glutamate as fuels. While rod photoreceptors may rely on oxidative phosphorylation and the N-acetylaspartate producing mini-Krebs-cycle, cone photoreceptors seem to rely on the lactate-producing Cori-cycle and the oxidative, alanine-producing Cahill-cycle. Glutamate may be supplied to both rods and cones by Müller cells via glutamine. Retinal pigment epithelium cells may employ a hypotaurine to taurine conversion to shuttle additional reducing equivalents to photoreceptors.
Figure 8
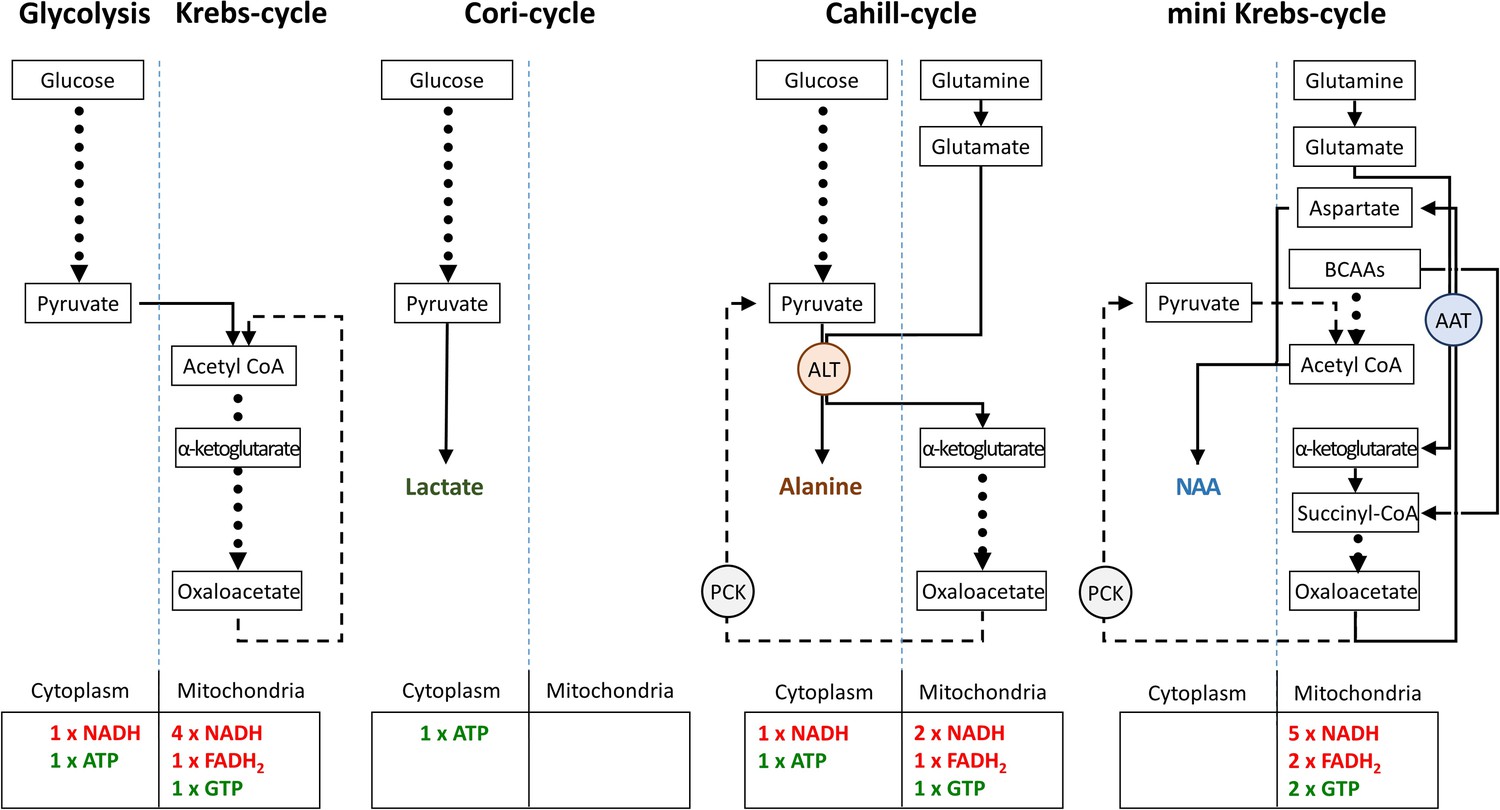
Comparison of metabolic pathways and their energetic efficiencies.
Compared to the Cori-cycle, both Cahill- and mini-Krebs-cycles are highly efficient. Their key enzymes – alanine transaminase (ALT) and aspartate aminotransferase (AST), respectively – generate alanine and aspartate/N-acetylaspartate (NAA). Pyruvate carboxy kinase (PCK), either in cytoplasm or within mitochondria, may reconstitute pyruvate from oxalacetate. Note that energy output of each pathway was calculated based on input of pyruvate (three carbons) or glutamate/branched chain amino acid/acetyl-CoA (three carbons).
Tables
Table 1
Primary and secondary antibodies used in the study, providers, and dilutions.
| Reagent or resource | Source | Identifier |
|---|---|---|
| Antibodies, dilution | ||
| Mouse monoclonal anti-RPE65, 1:100 | Thermo Fisher Scientific | Cat# MA5-16042, RRID:AB_11151857 |
| Rabbit polyclonal anti-GLUT1, 1:300 | Abcam | Cat# ab652, RRID:AB_305540 |
| Rabbit polyclonal anti-GLUT3, 1:300 | Abcam | Cat# ab41525, RRID:AB_732609 |
| Rabbit monoclonal anti-PKM1, 1:300 | Cell Signaling Technology | Cat# 7067, RRID:AB_2715534 |
| Rabbit monoclonal anti-PKM2, 1:300 | Cell Signaling Technology | Cat# 4053, RRID:AB_1904096 |
| Mouse monoclonal anti-Cytochrome C, 1:300 | Molecular Probes | Cat# A-6403, RRID:AB_221582 |
| Rabbit polyclonal anti-Cone arrestin, 1:300 | Sigma-Aldrich | Cat# AB15282; RRID:AB_1163387 |
| Rabbit polyclonal anti-Citrate synthase, 1:300 | GeneTex | Cat# GTX110624, RRID:AB_1950045 |
| Rabbit polyclonal anti-ATP synthase gamma, 1:300 | GeneTex | Cat# GTX114275S, RRID:AB_10726795 |
| Rabbit polyclonal anti-Fumarate hydratase, 1:300 | GeneTex | Cat# GTX109877, RRID:AB_1950283 |
| Rabbit polyclonal anti-Taurine, 1:300 | Abcam | Cat# ab9448, RRID:AB_307261 |
| Rabbit monoclonal anti-Alanine transaminase, 1:300 | Abcam | Cat# ab202083, RRID:AB_2915976 |
| Rabbit polyclonal anti-SUCLG-1, 1:300 | Novus Biologicals | Cat# NBP1-32728, RRID:AB_2286802AB_2286802 |
| Mouse monoclonal anti-Glutamine synthetase, 1:1000 | Abcam | Cat# MAB302, RRID:AB_2110656 |
| Rabbit polyclonal anti-Glutaminase C (GAC), 1:300 | GeneTex | Cat# GTX131263, RRID:AB_2886452 |
| Rabbit polyclonal anti-PCK1, 1:300 | Affinity Biosciences | Cat# DF6770, RRID:AB_2838732 |
| Rabbit monoclonal anti-PCK2, 1:300 | Novus Biologicals | Cat# NBP2-75610 RRID:AB_2915974 |
| Peanut agglutinin (PNA), 1:1000 | Vector Laboratories | Cat# FL-1071, RRID:AB_2315097 |
| Rabbit polyclonal anti-Aspartate aminotransferase-1, 1:300 | Abcam | Cat# ab221939, RRID:AB_2915980 |
| Rabbit polyclonal anti-FABP-1 (Aspartate aminotransferase-2), 1:300 | Abcam | Cat# ab153924, RRID:AB_2915981 |
| Alexa Fluor 568, goat anti-mouse, 1:500 | Molecular Probes | Cat# 11031, RRID:AB_144696 |
| Alexa Fluor 568, goat anti-rabbit, 1:500 | Molecular Probes | Cat# 11036, RRID:AB_10563566 |
| Alexa Fluor 568, donkey anti-rabbit, 1:500 | Invitrogen | Cat# 10042, RRID:AB_2534017 |
| Alexa Fluor, 488 donkey anti-mouse, 1:500 | Thermo Fisher | Cat# 21206, RRID:AB_2535792 |
| Alexa Fluor 488, donkey anti-rabbit, 1:500 | Thermo Fisher | Cat# A21206, RRID:AB_2535792 |
| Alexa Fluor 488, goat anti-rabbit, 1:500 | Molecular Probes | Cat# A11034, RRID:AB_2576217 |
Additional files
Download links
A two-part list of links to download the article, or parts of the article, in various formats.
Downloads (link to download the article as PDF)
Open citations (links to open the citations from this article in various online reference manager services)
Cite this article (links to download the citations from this article in formats compatible with various reference manager tools)
Retinal metabolism displays evidence for uncoupling of glycolysis and oxidative phosphorylation via Cori-, Cahill-, and mini-Krebs-cycle
eLife 12:RP91141.
https://doi.org/10.7554/eLife.91141.3


